Video Summary
Dr. Matt Ruark, UW–Madison Extension soils and nutrient cycling specialist and professor of soil science, discusses what’s changing in Wisconsin nutrient management guidelines for corn and soybeans.
This video covers upcoming updates to A2809, including nitrogen rate adjustments, phosphorus and potassium recommendations, and how soil type, crop rotation, and fertilizer prices affect decisions in the field.
Resources
Transcript
0:05
All right, thanks everyone.
0:07
All right, so timely updates is a little bit of a misnomer here, right?
0:13
These are like way desperately needed updates.
0:16
But let’s talk about where we’re at and what the process is here.
0:20
So we’ll talk about some NPK, we’ll talk about corn and soybeans.
0:27
That’ll be the focus.
0:28
All right, so this is the famous just to make sure we’re all on the same page of what’s going on here.
0:32
We talk about everyone throws out this number letter A2809.
0:35
What is it?
0:36
It’s the nutrient application guidelines for field vegetable and fruit crops in Wisconsin.
0:40
So it’s a publication, it’s a, you know, it’s our publication that contains all the our guidelines for nutrient applications for all the crops in the state.
0:50
So it’s a little out of date though.
0:53
We haven’t updated any of the recommendations since 2012.
0:57
We haven’t stopped doing research on these crops, but we haven’t incorporated anything into a new into an update.
1:04
So they’re they’re they’re quite desperately needed.
1:07
All right, So what do we got?
1:08
So I’m going to start with talking about nitrogen on corn.
1:11
This is good.
1:11
This is going to be the big one and just the way we’re doing this.
1:17
I just want to start with just kind of getting everyone back on the same page with what the structure of the nitrogen guidelines are.
1:29
I’ll also say if anyone has any questions or any comments popping into the chat, Chris Clark’s going to interrupt me and we’ll we’ll get those questions addressed as we go.
1:41
OK.
1:41
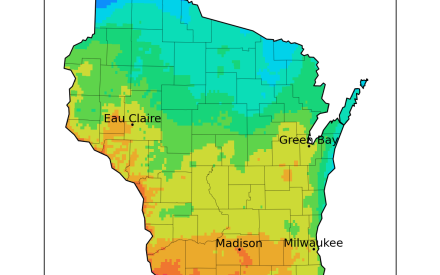
So here’s the structure. One is when we talk about nitrogen on corn, we have it sort of three categories where we have a recommendation structure for loamy soils that we call high yield potential, loamy soils that we consider medium yield potential.
1:56
And then our sands or loamy sands, sands and loamy sands are further split.
2:01
But these high yield and medium yield, this is a, it is a little bit of a fairly arbitrary definition, but it’s based on things like available water capacity, depth of root, you know, depth.
2:14
Soil depth, these sort of things that might be yield limiting factors.
2:20
Then within these sort of three categories, we have, you know, subcategories here.
2:26
So again, under the high yield potential loamy soils, we have it broken down into basically crop rotation, previous crop.
2:35
This is going to be a really important one though that we need to make be clear.
2:38
So we have corn following corn.
2:40
There’s a bunch of other words here.
2:41
We’re going to cover that in a second.
2:43
So basically it’s corn following corn, and corn following soybeans or small grains.
2:48
And what this means is that we see a difference right in the optimum N rate based on what the previous crop was.
2:54
But here’s the here’s the thing, it really, this data set here here is really constructed for where we have a bunch of nitrogen response curves that are corn following corn.
3:05
These are built primarily on ones that are corn following soybeans or winter wheat.
3:10
We might have a few other other crops in there as well.
3:13
But that’s basically that, you know, we have all these other words in here, but it’s really, this is really corn following corn.
3:19
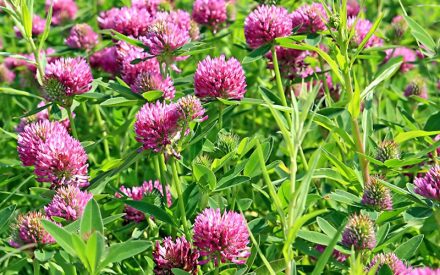
This is just to indicate forage legumes, your alfalfa, your red clovers or green manures.
3:26
You start with this number and then subtract basically your alfalfa credit from this number.
3:31
So it’s corn following corn, corn following soybeans.
3:33
Use this number.
3:34
If it’s following alfalfa, there’s a whole other set to credit that makes sense.
3:38
I don’t know if you’ve done nutrient management planning, but this it’s, it’s an important thing to to, to make sure it’s very clear.
3:45
This data set is not built off of corn falling alfalfa.
3:48
This data set for these recommendations are built for corn, falling corn.
3:53
Alright, so we have that then for the, same for the medium yield potential soils and then sands we have to separate into irrigated and non irrigated.
4:00
Generally speaking, the irrigated crops is a higher nitrogen recommendation.
4:05
Why?
4:06
Because bigger yields, it’s generally the the effect.
4:11
All right.
4:12
And then lastly, or second to last, we have a structure built on the nitrogen corn price ratio.
4:18
So as that nitrogen gets more expensive relative to the price of corn, our our rates decrease.
4:27
So the guidelines under the .05, that’s going to be very close to what we would consider the agronomic optimum.
4:34
Generally speaking, we don’t see much yield, any yield gain beyond that rate.
4:40
However, you know law of diminishing returns, it becomes a lot more expensive to maximize yield.
4:47
So this is the rate, you know, as we decrease rates, those rates indicate that a profitability is maximized with these with these lower rates.
4:57
Then we need to acknowledge this.
4:58
We have a guideline here.
4:59
We have one number, that number we also slap a range around that number and that’s managing within a buck per acre.
5:08
So if we say apply 165, but really the data says anywhere between 155 and 180 is really kind of within a buck and acre maximizing productivity, right?
5:19
So we’re acknowledging some spread in the in the numbers there.
5:22
So, you know, 165 isn’t like the absolute number.
5:27
If you go through the A2809 document, you know, there’s all sorts of like little hints and tricks of like how to like check to do the high end of the range or do the low end of the range.
5:36
There’s a lot of other things to think through.
5:38
And so encourage everyone to to go through that document.
5:41
OK, so here’s our updated. Boom.
5:43
Here’s all the data and not very pretty formatted structure.
5:48
We’re going to break this down a little bit more, but ultimately for the most case, most of these rates are going up.
5:55
I’m not going to leave it on that for too long.
5:58
One of the first things I think we need to acknowledge is that what is the price ratio that we should be using?
6:06
I, I know I went fast past that one.
6:08
I’m going to come back to it, but there’s, there’s a lot of data on there.
6:11
The only point is all the numbers are being updated.
6:13
When using these price ratios.
6:15
I highly recommend you start with the .1 price ratio.
6:19
So we go back when we look at some of these historic, you know, price of corn and the historic price of nitrogen.
6:25
This one in this case is based off of urea.
6:28
In terms of cost per pound of nitrogen, Generally those price ratios have been pretty.
6:34
They’ve bounced around a little bit, but generally they’re bouncing around point .01.
6:37
Over the past decade.
6:38
It’s kind of average .11.
6:40
Using .1 is a good place to start.
6:43
However you notice at least last year and I will see what you know, everyone knows what they’re doing for this year.
6:50
It’s been, it’s been going up you for this year.
6:53
I know it’s, it’s, it’s late to make nitrogen decisions.
6:56
But you know, as we talked kind of all all winter, like really you might want to think of you, you know, there’s probably economic value in cutting back, right.
7:04
So we have this using a .15. Maybe moving forward keep track of that.
7:10
So let’s break this down.
7:12
Just looking at the .1 ratio, this will simplify this a little bit.
7:16
We’ve got the same structure, high yield, medium yield.
7:18
This was the first thing, it’s been so long since we’ve updated.
7:22
We want to just keep the structure the same.
7:26
So here we’re keeping the structure same.
7:29
We have a database that is goes back 20 years.
7:33
So it’s a 20 year database.
7:34
So 2004 to 2024 is the is the data that we have our nitrogen response data in.
7:42
This is a completely data-driven approach.
7:44
So we collect a bunch of N response trials, we averaged some curves and we can put together these average average values.
7:52
All right, So what what’s changing here?
7:55
So for corn following corn is for high yield potential, corn following corn or the forage legumes, it was pretty similar that we’re going to move the nitrogen, the average N rate up about 5 lbs.
8:06
Not a big, not a big change.
8:08
Everything looked pretty similar to our current recommendations.
8:11
This next one’s the big one.
8:13
We are changing this a little bit.
8:15
I’m changing the vernacular here, soybean, small grains, vegetables and all their crops because sometimes we have it following, we have N response trials following some random vegetable crops or or something else.
8:27
And so we combined all of those into that case.
8:31
This issue here of it corn following corn having a higher nitrogen need.
8:36
Again, that is just simply a corn on corn penalty, right?
8:39
We just generally see that as as the effect.
8:44
So we’re lumping basically rotate it, rotate your corn with any other crop you’ll be in this category.
8:50
Here’s the big one.
8:51
We’re moving it up 40.
8:53
So this is going up 40 lbs.
8:56
Again, I want to just reiterate, this is not just on my arbitrary decision to increase the nitrogen.
9:02
This is based off of the end response data that’s been collected in the state over the past 20 years.
9:08
I think one thing is that it reflects much greater yields.
9:13
We track, you know, the kind of the yields that we’re seeing in these trials over time.
9:17
They’re definitely increasing while we don’t while we’ve moved away from you know this yield goal based approach, there is kind of there is still this overall issue of bigger crops do need more nitrogen.
9:30
So if we are on average increasing our yields, this does make sense.
9:34
This number 2 of 160 is a little bit more similar to what other states are recommending for these corn in this rotation and maybe similar soils.
9:46
So it does kind of bring, this is not out of bounds in terms of what other states are recommending. Medium yield potential soils, both of these have gone up also 40, again reflecting a little bit of a bigger yield.
10:03
There still is a hint of a yield effect here.
10:06
I think as we kind of think about the idea, one of the things we’ll want to question over time and take a deeper look into is like do these yield potential categories hold true?
10:17
There is a measured difference in kind of our average yields.
10:20
The high yield potential soils have on average higher yields than our medium yield potential soils in this data set.
10:27
Is it big enough to separate out, especially when we have maybe a similar response, so 170 for corn following corn and high yield, 165 in medium yield, that’s not that big of a difference.
10:47
Hammer home again, data-driven.
10:49
This is going up 40 lbs.
10:52
Then in the medium yield potential soil, so a bigger difference.
10:55
This is going up 45 lbs, but there’s still about a 15 LB difference in the requirement depending on your soil type there.
11:03
For sands and loamy sands, we’re not changing anything.
11:07
We have.
11:09
So that should be 230.
11:10
My bad.
11:11
All right.
11:12
No, is that right?
11:13
I can’t remember what we changed it.
11:14
That’s my apologies.
11:15
Yeah.
11:15
Moving stuff around right in the middle of updating all these chapters, which I’ll talk about here in a sec, but we didn’t.
11:21
But ultimately we’re not changing anything for sands or loamy sands.
11:23
We only had a handful of response sites.
11:26
So we’re not going to end up changing anything.
11:29
This is an important one to highlight.
11:31
Again, we don’t, why don’t we use a yield goal based approach.
11:35
Just give me an order to multiply my yield goal base and that’s how much nitrogen I’ll put out there.
11:39
But you look at our data set.
11:41
So this is our optimum N versus yield for our high yield potential soils corn following soybeans.
11:48
There is no inherent relationship between the optimum N rate and the yield.
11:53
So to say that there’s a, there’s an equation, you know, produced from this data, just it’s not there, right.
12:00
So there’s, there’s nothing I can build a functional equation off of, right.
12:06
So I don’t, it’s just not really going to be a, a functional way to approach it.
12:11
So removing yield goal instead, you know, we create, you know, maybe I should have started with this.
12:17
This is the foundational piece we have our, you know, we run all these nitrogen response trials.
12:23
A lot of you on this call are probably doing a lot of these N rate trials.
12:27
Maybe it’s through the NOPP.
12:28
Maybe you’ve just just like to do these for fun, right?
12:33
You put out different rates.
12:34
We draw a curve through it.
12:35
We figure where optimum nitrogen rate is, we apply our economic return and we can calculate this.
12:40
So what we’re doing is we build these curves like this and then we calculate the return to nitrogen, right?
12:46
So this idea that we’re maximizing the this maximum return to N is the approach.
12:52
So our recommendations, our guidelines here optimize profitability, not yield.
12:56
So it’s important to to highlight. The other thing too is that we’re averaging these return to nitrogen curves.
13:05
So which means we’re not taking, we’re not picking like oh, this side had 154, the next site had this, the next site, we’re at, we’re not averaging this number across our data set.
13:15
We’re averaging the response functions, which gives us something a little bit a little bit different.
13:22
And this is really important to note.
13:23
So there’s when we look at these recommendations, you know, we’re going to recommend using the .1 price ratio, but it is important to note that the our approach here skews the values higher than what would be the average, right.
13:35
So if I’m saying, I hope this makes sense.
13:38
If I took all of the, let’s say we have on this case, I think we have like 80 some response curves and I took this is the optimum N rate for every single one, maybe 81 response curves.
13:50
Sorry.
13:51
Now if I take the median value of these, you know, taking it, I would the average, the median value is wow, the formatting shifted a little bit here.
14:00
The median value is 134.
14:03
But the MRTN because I’m averaging the each response curve, I’m averaging the curves, the MRTN rate would be 160.
14:11
So this the average would be a lot less.
14:13
So in fact, 75% of the sites in our data set had optimum rates less than the MRTN.
14:19
So what does this mean?
14:19
It means that this MRTN approach, because we average a curve not the value, right, it skews recommendations to a slightly greater value.
14:29
So it’s important distinction here.
14:31
So we’re averaging the curve, not the rates and that’s our recommendations are more likely to delete to over than under, right.
14:38
So we’re skewing a little bit higher.
14:40
So as we think about what these rates are, these are kind of starting to get capped at a high end.
14:44
So if you’re using a .1 rate, .1 ratio, you’re using, you know, the MRTN rate, there’s not tremendous value in moving stuff forward or, or, or higher rate.
14:56
So in fact, when you go to like the higher, the high end of the .05, now it gets to like 85, only 85 or I’m sorry.
15:04
So it’d be less.
15:05
So let’s look at the other way.
15:06
Only 10 to 15% of the sites would actually have a rate higher than that.
15:10
In this case you can think about only 25% of our sites would have a optimum N rate greater than the MRTN rate at .1, right.
15:18
So, so we, it is important to note when you’re thinking about this where you need to be, this is already skewing a bit higher.
15:29
All right, so I know this is a lot to go through, but I’ll, I’ll also just say I’ll go through this quickly.
15:36
We have, you know, with our approach we also have a bunch of data for P&K response.
15:42
I won’t get into all those details, this just hey, here’s all our data, boom, we create the categories.
15:49
This is only it’ll take a while to go through that like the whole technique here.
15:53
But that this is just to point out, we have a lot of data for field correlation between this idea between the soil test value and relative yield, which allows us to identify optimum ranges for these soil test categories.
16:05
And that’s true for phosphorus and it’s true for potassium.
16:10
At the end of the day, for phosphorus, phosphorus isn’t going to change much.
16:14
Our soil test categories, you know, you know, 16 to 20 for the optimum range on loamy soils, we bumped it up to 17 to 24.
16:22
Not a very big, not a very big change. For sandy soils,
16:27
also moving up a little bit, only minor changes.
16:29
Again, a completely data-driven approach.
16:33
Same thing for potassium.
16:35
Potassium is going to move a little bit more though.
16:37
So we’re moving these categories.
16:38
Let’s let’s focus on the optimum range.
16:40
So if we’re saying, well, the optimum range is like the ideal range you want to be in, right.
16:44
So if you can get to the optimum range, apply what your move, that’s kind of the sweet spot.
16:49
You know, that’s kind of like the foundational piece of our, our recommendation structure.
16:54
So we go from 100 to about 130 currently we’re going to move that up 20.
17:00
So going from 120 to 150. Sandy soils will end up being the same.
17:04
So this is kind of the bigger movement.
17:05
So if anything it’s saying the data would suggest actually maybe you want to have your optimum range be a little bit higher based on, you know, based on our approach here, but not not too drastic.
17:20
The big thing here is the idea of removal coefficient.
17:23
So how much should you apply?
17:24
Now the for some of this is actually our removal coefficients are actually decreasing.
17:30
So we’re not actually changing anything for corn in terms of for the phosphorus removal, we’re going to keep that the same.
17:38
So the amount you would apply based on your yield would be the same.
17:41
For potassium, we’re actually going to decrease it a little bit.
17:44
So they actually, we were saying, well, maybe have your soils in a higher soil test category for potassium, but your rates might actually be a little bit less.
17:55
Same thing for soybean.
17:57
We have a little bit of a, a slight increase in removal, you know, so we’re going to say the amount that you should apply for soybean for phosphorus might go up a little bit, but for potassium it’ll, it’ll decrease a little bit on a per per bushel basis.
18:12
So, so if you look at these numbers for, for corn and soybeans, for phosphorus, the, the differences are basically negligible.
18:21
For potassium, it’ll be a slight difference, It’ll be a slightly less, you know, you know, in this case, you know, 5 to 18 lbs of P2O5 less.
18:33
And so it’s not going to be a big, it’s not going to be a big change, but it is, it’s all going to be reflected in the, in the structure.
18:39
So when we get all this build in, it’ll be important everyone takes a look and see how things might change.
18:44
So yeah, so we want you to build up a little bit more, but maybe you don’t need to apply.
18:48
You can apply a tick less.
18:52
The last thing I want to mention here is that we do know that for crop removal the variation could be high.
18:59
So the whole premise of our of our recommendation or what we recommend is to apply what you remove, build to optimum, then apply what you remove.
19:07
But you can see like the idea the difference between grain yield and then the removal of P, the removal of K for corn and beans, there could be some variation there.
19:16
So I do wonder is if when we start moving forward, should we actually be, if your soil tests are moving in a direction, if they keep decreasing or they’re increasing faster than what you’re expecting, maybe start to get some analysis done on your grain to see like to try to dial in, are you actually removing more than you thought or removing less than you thought?
19:36
So this is not a super predictive, right?
19:39
There’s a lot of wiggle room in this in these numbers we’re using our approach is to to be a little, get a little on the higher side to make sure you’re not short.
19:49
But I think I wonder if more data at the farm level will be, will be better.
19:55
All right, quick recap.
19:56
Nitrogen guidelines for corn will be will use the same format, rates will be increasing.
20:02
P guidelines are essentially be the same.
20:04
K guidelines will change in the fine ways.
20:05
Optimal test ranges will increase, but the applications will slightly decrease.
20:10
So here’s what’s going to happen next.
20:12
I’m going to, I’m going to stop sharing so I can speak directly into the camera, OK?
20:18
OK.
20:19
So we’re updating the A2809, we’re making it an online document.
20:23
So we don’t it’ll be much easier to update as we kind of as we obtain new data, we’re getting rid of a hard printed copyright.
20:30
So everything will be online and we’re going to release that sometime this summer.
20:35
Here’s the big issue that is affecting right now for those that are filling out nutrient management plans, if you’re required to, once we release these, you can use.
20:47
So for the next growing season, you can use them, but the big issue is that they won’t be incorporated into Snap Plus quite yet.
20:55
So they’ll be a little bit of an offset.
20:57
There’s an issue with the rulemaking for DATCP to change it from pointing to a specific document to a website.
21:04
I don’t know if any folks from DATCP are on here.
21:08
I don’t lawyers are involved.
21:09
I don’t know what needs to happen, but they’re working on it.
21:12
But so you can use the current recommendations for next year.
21:18
You might get flagged in Snap Plus, but you’ll just have to, you’ll have to put in the notes that you use the updated, the updated recommendation.
21:27
So we’ll keep, we’ll get a bunch of information on that over the summer into the fall for folks that are filling out nutrient management plans for the future.
21:36
It’ll all work out.
21:37
It’s just some just some rule-making issues for those that need to, you know, stay in compliance.
21:44
So that’s the quick and dirty version.
21:46
So, basically the take home message, N rates, yeah, let’s we can bump up some N rates and just kind of manage just some kind of new shifts, little shifts and recommendations for for P&K.
22:00
Yeah, thank you, Matt.
22:01
I’m happy to take any more of Rodrigo’s time.
22:04
So if anyone has any thoughts or questions or but I mean it’s a lot of the time you can get right.
22:10
So feel free to e-mail me, call me, we can chat more.
Badger Crop Connect
Timely Crop Updates for Wisconsin
Second and fourth Thursdays 12:30 – 1:30 p.m.
Live via Zoom