Video Summary
Josh Bendorf, climate outreach specialist with UW–Madison’s Division of Extension and the Wisconsin State Climatology Office, provides a spring weather outlook for Wisconsin agriculture. He reviews winter temperature and snowfall trends, recent precipitation and soil moisture conditions, and current drought status. The presentation explains near‑term and seasonal forecasts for temperature and precipitation, flooding risks, and soil temperature timing relevant to spring planting decisions.
Resources
- Ag Weather Outlooks for Wisconsin
- NCEI County Climate Rankings
- U.S. Drought Monitor
- Wisconet
- USDA Crop and Soil Moisture Reporting
- NOAA CPC Climate Outlooks
- MRCC Data Portal
Transcript
0:05
Alright.
0:06
Well, thank you so much, Jerry and good afternoon, everyone.
0:09
Like Jerry said, my name is Josh Bendorf.
0:11
A lot of you are probably familiar with me from these updates last year, but just to remind you, I am the Climate Outreach Specialist with the Wisconsin State Climatology Office, which is part of the Division of Extension.
0:23
And today I’m going to be delivering for you the our ag weather recap for the past several months and then an outlook for the weeks ahead.
0:34
So the agenda for this talk will be first a recap of the winter months followed by a discussion of the current conditions.
0:42
So what’s been going on currently and then like over the last few weeks or so leading up to today?
0:46
And then what are outlooks for the next few weeks and then for the spring and into early summer?
0:54
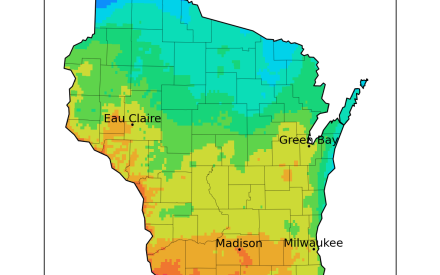
So to start off with a winter recap, these maps show the temperature and precipitation rankings by county for the state of Wisconsin for our winter months.
1:03
This is something that the National Center for Environmental Information, NCEI, puts out every month.
1:10
Basically what you’re seeing on these maps is how does the winter of 2025-2026 compared to the other 130 winters that we’ve had prior to this?
1:20
What we see on the map on the left-hand side is that a lot of those counties are showing up kind of in that that peach color.
1:27
So those are counties that are ranking kind of on the warmer end for winter.
1:31
So you can see the state of Wisconsin, our temperature anomaly was about 2 1/2 degrees above average and it was our 34th warmest winter on record.
1:40
So kind of in that top third of winters, not a record warm winter by any means, but kind of on the warmer end of the spectrum for most counties.
1:49
Precipitation was a bit more of a mixed bag.
1:52
You can see we kind of have a mix of counties across the state.
1:55
If you were in the South Central or southeastern part of Wisconsin, you were kind of more on the drier end.
2:00
It was one of it was a more drier winter for you all down there.
2:05
But then as you got up into northern parts of Wisconsin, not too far to the north, even in like in central counties, things ranked on the wetter end of the spectrum.
2:13
So it was really a really dependent on your locality as to whether you had a drier than normal winter or a wetter than normal winter.
2:22
One thing I do want to talk about with temperatures and you know, we all experience this, but I want to put some numbers to what we, you know, the ping ponging that we experienced with temperatures this winter.
2:32
You know, we had a lot of up and down.
2:35
And you can see on this chart, which is temperature data from the the Madison Dane County Regional Airport, those blue bars show they’ll each each blue bar represents a day.
2:47
And the height of that blue bar is the difference between the daily high temperature and the daily low temperature.
2:53
So you can see the spread on those.
2:55
But look how much up and down we have in those bars.
2:58
You see, we had early in December, we had, you know, winter started off pretty rough.
3:03
You know, we had a lot of snow as we were just a day or two after Thanksgiving had a pretty heavy snowfall event.
3:10
Temperatures are really cold.
3:11
So winter was really wasn’t holding any punches back early on.
3:16
But then not too long after that, as we got into the latter part of December, you can see temperatures moderated quite a bit.
3:21
We got into more of that brown shading area, which is like average temperatures to that red shaded area which is more above normal.
3:28
So we kind of wrapped up 2025 with some above normal temperatures.
3:32
Then into the first part of January, we had some near record high temperatures in Madison.
3:36
You can see those blue bars approaching that dark red line.
3:39
Those are the top red line is like our record warmest of all time.
3:44
So we were reaching those records in early January, but just a few weeks after that things got really cold.
3:51
And you can see the latter half of January we had more, we dropped off quite a bit in temperatures and now we were actually approaching record coldest temperature.
3:59
So all within the same month, record, warmest, record coldest all occurring within the same month.
4:03
So a lot of ping pong and you can see things ramping back up again as we headed into February with, again, high temperatures that were approaching records.
4:13
So a lot of up and down with winter.
4:16
And it wasn’t just southern Wisconsin.
4:17
I pulled this chart from the Chippewa Valley Regional Airport just north of Eau Claire.
4:22
This was pretty much the story across the board in Wisconsin.
4:26
Taking a look at snowfall, the map on the left shows accumulated snowfall that we’ll, we’ll call this our seasonal snowfall going back to November 1st through April 6th.
4:36
Yep.
4:37
So like I said, these are snowfall maps and these are our seasonal snowfall totals and then the percent of normal.
4:43
So like how this compares to what we would expect in a normal year.
4:46
You can see our snowfall totals there are somewhat not surprising.
4:49
Our northern parts of Wisconsin received the most snowfall anywhere in the state, but pretty much across the board in Wisconsin it was an at or above average snowfall season.
5:00
A lot of areas in northern Wisconsin were like 125 to 150% of normal.
5:06
Some areas shaded in blue up in, like Bayfield and Douglas counties were approaching 200 percent or twice as much snowfall as average.
5:14
But it was pretty much an average to just above average snowfall season across Wisconsin.
5:20
But again, similarly to temperatures, there was a lot of back and forth.
5:23
It wasn’t like a nice steady incline in our accumulated snowfall.
5:28
This chart from Wausau kind of shows the story.
5:31
And we would have times where we’d have like a shot of several inches of snowfall, like a pretty substantial snowfall event followed by weeks of not really getting much snowfall at all.
5:41
So our green line here on this chart, this is accumulated snowfall for 2025-2026, comparing it to an average year in our record years.
5:51
So what we’re seeing on here, like on this green line, you see a bump where that line goes up, but then it flatlines after that.
5:56
So we’d get a shot of snowfall and then go a couple weeks before we’d get a next shot of snowfall.
6:02
Or we were kind of tap dancing around average snowfall for most part of like December and January and maybe it’s the latter half half of February.
6:11
We were starting to think this might be a below average snowfall season, but then the snow, the snow storm of March 14th through 16th hit and then we went from having a below average snowfall season in in and around Wausau to having a near record snowfall year, mostly because of that shot of 20 plus inches of snow we got in middle of March.
6:30
So again, you can see a lot of back and forth here.
6:33
Similar story at La Crosse further South.
6:36
We didn’t get that major as big of a snowfall event in mid March, but again, you can see we had a pretty snowy end of February and March with two major winter storms hitting around that time, bringing us up to near average snowfall levels.
6:51
So now to pivot to current conditions, this these are maps of 30 day precipitation and how that compares to normal.
6:59
So precipitation has been really abundant across Wisconsin over the past 30 days.
7:03
We were talking a little bit prior to the webinar about how wet some things are over on the eastern side of the state and you can see in like parts in and around Green Bay and then down the southeast part of the state, 6 to 8 inches or more of precipitation in those areas over the last 30 days.
7:21
That’s more than double or in some cases triple the amount of precipitation that we would expect to get over this 30 day period.
7:28
You know, this is by no means our wettest time of year.
7:30
You know, this is, this would be a lot even for like one a month or two from now.
7:35
These are totals, you know, these are very high totals for the month of March.
7:40
A lot of it was on the eastern side of the state.
7:42
But again, you can see there’s large parts of Wisconsin that are double the amount of precipitation that we would expect to get this time of year.
7:49
A little bit closer to average further south and in and around, kind of like Eau Claire. Temperatures over the last 30 days, lower to middle 40s in the southern part of the state, up to upper 20s to around 30 in the north.
8:04
How this compares to average for most folks.
8:06
While up in the northern part of the state, it was the temperatures were right around a degree of average and then further south it was anywhere from about two to 4° above average.
8:17
March was a pretty warm month across most of the United States, but Wisconsin in comparison, things were a little bit more closer to average here than like other parts of the country.
8:28
How March compares to other Marches that we have on record?
8:31
How does 2026 stack up?
8:34
Again, you can see a lot of counties showing up in orange on the county average temperature rankings, some counties showing up as darker orange and kind of the west central part of Wisconsin.
8:44
But overall we are about 6° above average, ranking 15th warmest all time for this March. Precipitation,
8:52
again, a lot of a mixed bag especially for you all in the northeast part of Wisconsin in the far south and also the far southeast corner.
9:00
It was one of your probably think about top 10 wettest Marches of all time.
9:05
But for most counties, March 2026 ranked as one of the wetter ones on record.
9:12
And with all the precipitation that we’ve had, both during the winter, getting the snow, the snow melt and then the like some of the heavier rainfall events that we had in March, we’ve really made a big dent in the drought status in Wisconsin over this time.
9:26
You can see where we were, where we were as we were wrapping up harvest last fall.
9:31
You know, end of November where we stood with drought, pretty much all of the state was in at least D0 or abnormally dry up to some areas of D1, widespread across the north and the southwest also some severe drought in there, especially in the northeast.
9:46
You can see we’ve almost eliminated all that.
9:48
The April 7th maps just came out today and you can see the only drought we have left in Wisconsin is up in the far northwest part of the state, which didn’t get, it hasn’t gotten as much rainfall like over the past 30 days, snowfall wasn’t quite as high as like the northeast part of the state.
10:03
So heading into planting, we’ve really made a big dent in drought in the state by pretty much eliminating all of it.
10:11
And we can see that in our soil moisture levels.
10:13
This is Wisconet 4 inch soil moisture across our various UW research stations.
10:19
You can see the bar on the far right, that hashed bar, that’s the soil moisture as of two months ago.
10:26
So we look at those that was coming out of that really cold end of January that we had.
10:31
We still had a lot of snow on the ground at that time, but it hadn’t melted and infiltrated in yet.
10:37
So that that moisture was there, just hadn’t gone down to the soil.
10:41
But then we had, you know, some warm stretches in February where that snow melted was able to percolate into the soils as temperatures warmed up to well above average.
10:51
You can see by the time we got to early March that we were had really replenished a lot of our topsoil.
10:56
And for the most part, those wetter than normal topsoils have are still in place across most of these stations.
11:03
You can see the dark blue bars are at or above those levels that we saw in early March.
11:08
And again, I would highly encourage you to check out Wisconet.
11:11
Find a station nearest to you and you can find soil moisture data near to where you live.
11:18
So you these are these maps show USDA topsoil and subsoil rankings.
11:24
They rate topsoils from short to very short to adequate to surplus based on reports from folks out in the field.
11:32
They put these out weekly with the USDA crop reports.
11:36
So you can see in Wisconsin the week ending April 5th.
11:39
So this came out on Monday that 54% of topsoils in Wisconsin are rated adequate, 68% of subsoils are rated adequate.
11:50
But I do want to point out that only four to 7% of soils are rated as short to very short and in soil moisture in Wisconsin.
11:57
So most of these soils that you’re seeing on here, most fields that aren’t ranked as adequate are surplus moisture.
12:02
So more moisture than we would like because of all that precipitation that we’ve got over the last month or so.
12:09
So now let’s pivot to outlooks.
12:12
So first I want to talk about precipitation over the next seven days because if you aren’t tired of precipitation already, there’s a lot more coming over the next seven days.
12:21
It’s going to be a pretty active next seven days.
12:24
The map here on the left shows the current National Weather Service 7 day precipitation forecast.
12:30
And for context, our average this time of year in the state is about .73 inches, about 3/4 of an inch.
12:37
You can see most of the state we’re going to be at or above 2 inches of precipitation as multiple systems are expected to come through through later this week into the weekend and then into early next week as well.
12:48
And this is going to have some hydrologic implications in the state.
12:51
You can see a map there on the right.
12:53
Those are stream gauges.
12:54
Each one of those dots, the stream gauges and the color of those dots represents if it’s in flood stage or not. Dots or squares on there that are in yellow,
13:02
those are action stages or like rivers that are running full but not quite the flood stage.
13:07
And then the orange and orange dots and black square and orange squares, excuse me, are are at minor flood stage and you can see some, some of the the green polygons on there.
13:21
Those are flood warnings, flood advisories that we have out there right now.
13:25
And most of these are forecasted to stay at flood stage at least for the next several days because of, well, the precipitation that has fallen and then more rain falling on already wet soil.
13:36
So be aware of some flooding that’s going on out there if you live in one of these areas.
13:41
Zooming out now to 8 to 14 days.
13:44
So this is going into the middle part of April, into the latter part of April.
13:49
The map on the on the left shows our temperature outlook.
13:52
So these are the probabilities that we’re going to be above normal or near normal or below normal.
13:59
And the map here on the left is showing up as mostly orange, which means we’re leaning pretty much across the state.
14:04
We’re leaning towards above normal temperatures.
14:07
If you live in the northern half of the Wisconsin, you’re kind of more in the 30 to 33 to 50% chances that it’s going to be above normal for this this week, this particular week.
14:18
If you live in the southern part of the states, more of a 50 to 60% chance that you’re going to be above average.
14:23
Just for context, our average for this week, this particular week is 44.5°F.
14:30
Similarly with precipitation, it’s pretty much a above normal lean across the board of 40 to 50%, little bit less or so if like you’re, you’re in the Southern Tier of counties in Wisconsin.
14:40
And again, our average is about quarter inch of precipitation. For the entire month of April,
14:47
so the CPC, the most recent CPC Climate Prediction Center outlooks for the month of April came out March 31st.
14:55
They will be putting out a new outlook again a week from today, April 16th.
14:59
So that will be talked about more in next week’s Ag
15:03
WOW.
15:04
But as far as this outlook goes, we see across the board in Wisconsin pretty much everyone except that for like far southwest corner, my neck of the woods of Wisconsin, you’re it’s uncertain for temperatures.
15:15
We can’t say with certainty one way or the other if they’re going to be above normal or below normal.
15:20
The signal’s not strong one way or the other.
15:22
So we can’t really say outside of that little narrow area in the south, we don’t have a lot of confidence as to which way temperatures are going to lean.
15:31
But for precipitation, again, things are leaning towards being above normal 40 to 50 for most in Wisconsin, about 50 to 60 if you live in the far south to southeast part of the state.
15:43
But again, there’ll be a there’ll be a new outlook coming out, although we this one will be, this is April’s outlook, there’ll be a May outlook coming, coming out next week.
15:53
And again, this is for the next three months.
15:57
So looking at April, May and June, unfortunately, you can see here, our maps here are showing up as mostly white, still very uncertain as to what temperatures are going to be during this time and precipitation outside again of that far southwest part of the state, far south, the state line area that’s showing a slight lean towards above normal temperatures.
16:19
So again, I would, I would say with this, you’ll stay tuned to the ag weather outlooks.
16:24
We will post these new outlooks as they come available.
16:28
And I just, I just want to remind you all of a tool that’s available from the Midwest Regional Climate Center.
16:36
This one is the the soil climatology tool.
16:39
So as we’re heading into the spring months, as we’re heading into planting season, I think this is a really useful tool that you all can use.
16:46
This one, it shows the average date of when soils are expected to warm above the four inch soil temperature is expected to warm above 50°F and stay above that.
16:58
So I picked out a spot here near to Arlington just for an example.
17:02
You can see if you go on the website and hover over this, this is an interactive map so you can find this for your area.
17:08
But you can see the statistics that are available for like an area like Arlington that shows an average date of May 14th for soils warming up above 50°.
17:20
But you can see how that varies all the way from like the end of April to the first part of June.
17:24
I put this out there as a reminder that I would encourage you to look at this tool, but also to look at this in conjunction with the AgWOW because we’ll post outlooks for the month of temperature, outlooks for the month of May.
17:36
And if and if we’re going to be warmer, if it’s projected to be warmer than normal for May or the first part of May, we might lean a little bit towards the earlier end of of these dates, maybe the first part of May or if it’s cooler than average, maybe the latter half of May.
17:51
So I just want to put this out there as a way to kind of for you all to kind of think of what is that range where soil temperatures might be getting into that optimum range for planting.
18:00
And so with that, that is all the information I have.
18:03
I’d be happy to take any questions, my contact information’s there on the screen.
18:08
So are you able to stay on Josh if some questions do come in till the end of the program?
18:13
Yep, definitely.
18:15
Alright.
18:15
Appreciate that.
Badger Crop Connect
Timely Crop Updates for Wisconsin
Second and fourth Thursdays 12:30 – 1:30 p.m.
Live via Zoom