Publication ID: A4034
Soil Fertility Guidelines
Soil Sampling and Testing
Nutrient Application Guidelines
Soil pH and Lime Requirement
Nitrogen
Phosphorus and Potassium
Nutrient Crediting
Tips For Good Urine and Manure Distribution
Grazing Manure Application Estimator Worksheet
Additional Information
The objective of University of Wisconsin-Extension soil fertility guidelines is to help farmers maintain an adequate supply of soil nutrients that support economically optimal yield and quality of the crops grown, while minimizing nutrient losses to the environment (figure 1).
Primary Nutrient Application Guidelines for Pastures: Nitrogen (N), Phosphorus (P), Potassium (K), and Lime
- Based on soil sampling and lab analysis (soil testing).
- Specific to the forage species in the pasture and estimated yield goal, along with the texture of the soil in the pasture.
- Reduced according to the amount of nutrients estimated to come from manure (feces and urine) deposited by the grazing livestock. If grazing is managed to allow for good distribution of the manure across the pastures, supplemental nutrient additions from fertilizer or other sources may be minimal.
Figure 1. Pasture Nutrient Balance
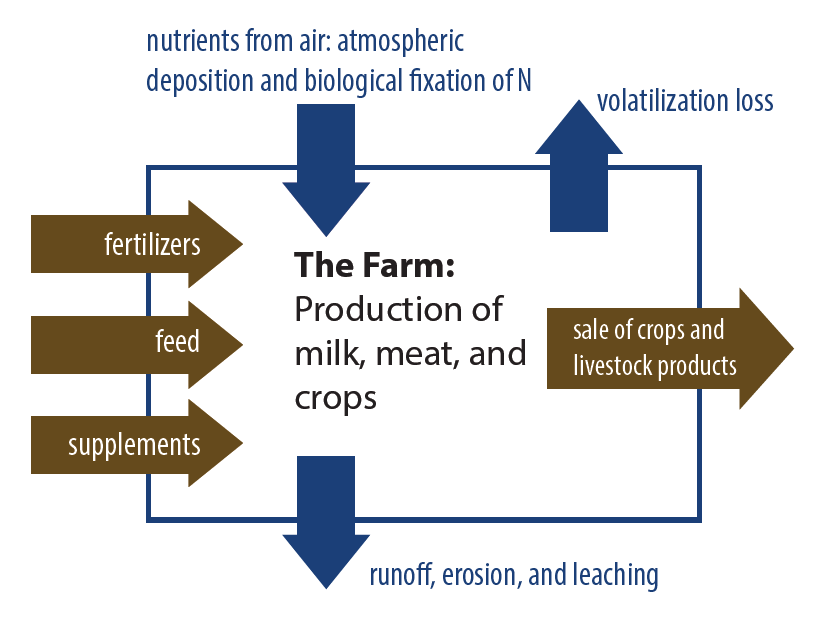
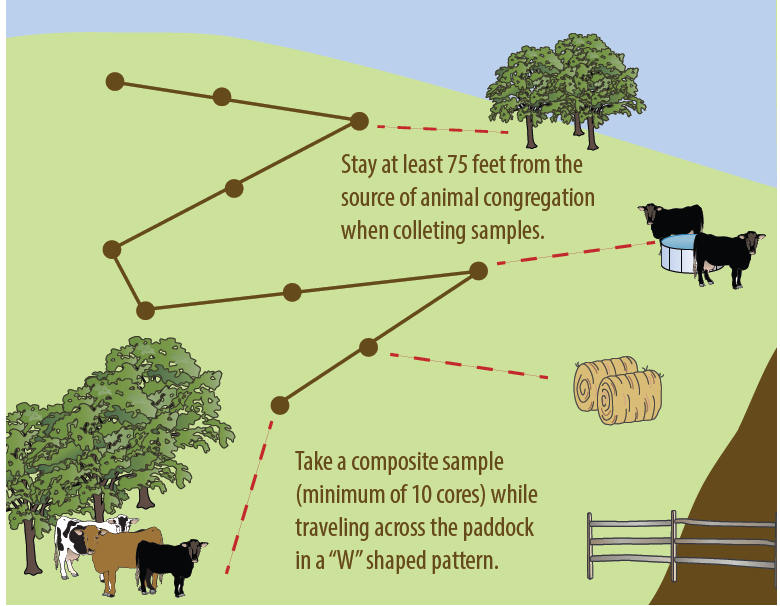
Figure 2. Soil Sampling Guidelines for Pasture
Soil Sampling and Testing
Soil fertility guidelines for crops grown in Wisconsin, including pasture forages, are based on soil testing. Soil testing measures plant-available nutrients and acidity levels (pH). If soil testing determines that P or K levels are potentially limiting, nutrient applications will be recommended. These nutrients can be supplied with fertilizer applications or may be met by deposition or application of manure. Agricultural lime applications will be recommended if soil acidity is greater than optimal (low soil pH), especially when legumes are included in the pasture mix.
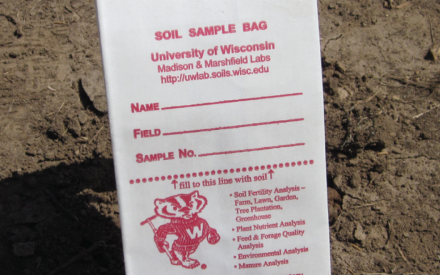
Care must be taken to collect representative soil samples so that test results accurately portray the soil fertility of the pasture. Generally, one composite sample should be taken per five acres of field or paddock (management unit). If paddocks are smaller than five acres, then two or more paddocks with similar management history can be combined into one management unit for sampling. A composite sample is made up of a minimum of 10 soil cores taken to a depth of 6 inches with a soil probe. The ten cores should be collected in a “W” shaped pattern across the management unit (figure 2). Cores should be collected in a bucket, thoroughly mixed, and then placed in a labeled bag for delivery to the lab.
Figure 3. Soil Sampling Guidelines for Pasture Hot Spots
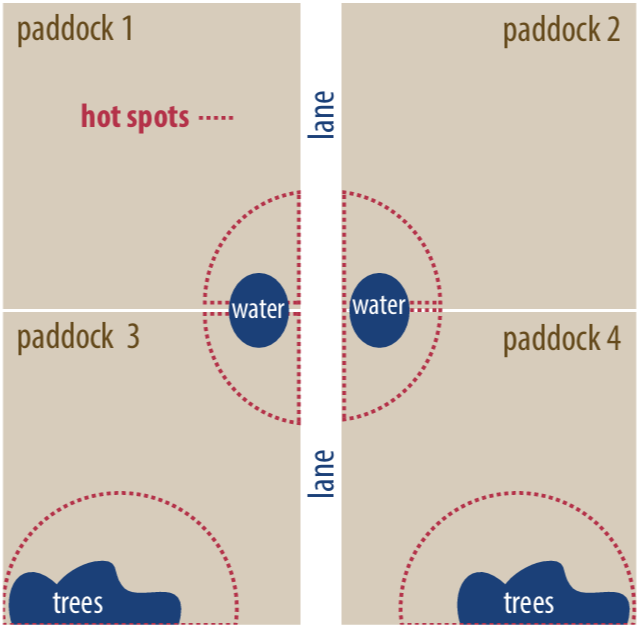
Research measuring manure distribution across pastures often shows soil nutrient gradients with higher concentrations (hot spots) near places where livestock congregate and loaf, such as near water sources, lanes, supplemental feed bunks, and trees or shade. Meanwhile, less manure deposition in other areas may result in zones of net nutrient removal and possible nutrient shortages. When sampling, avoid the hot spot areas so that overall results are not biased toward higher fertility than really exists for most of the paddock. As a general rule, stay at least 75 feet from sources of animal congregation when collecting samples. In addition, congregation areas may be sampled separately, combining similar hot spot areas into a management unit. When sampling hot spots separately from the main paddock, sample density should not exceed one composite sample per five acres (Figure 3) for the hot spots or main paddock management units.
For complete information on soil sampling and submitting samples to a state-certified lab, see Nutrient Application Guidelines for Field, Vegetable, and Fruit Crops in Wisconsin (A2809). Only soil test results from Wisconsin DATCP-certified laboratories may be used for nutrient management plans being developed with cost-share dollars.
Soil Testing Quick Tips
- Collect soil samples so that soil test results accurately represent the soil fertility of the pasture. Generally, one composite sample should be taken per five acres of field or paddock (management unit).
- A composite sample is made up of a minimum of 10 soil cores taken to a depth of 6 inches with a soil probe. The ten cores should be collected in a “W” shaped pattern across the management unit (figure 2).
- Samples should be collected 75 feet away from congregation areas (hot spots).
- Hot spots may be combined into a manage-ment unit and sampled separately.
- Soil cores for a composite sample should be collected in a bucket, thoroughly mixed, and then placed in a labeled bag for delivery to the laboratory.
- Fill out the soil information sheet. A completely and carefully filled out information sheet will provide the most accurate nutrient recommendations.
Nutrient Application Guidelines
Soil pH and Lime Requirement
Managing soil pH is a critical component to a soil fertility program because soil pH regulates nutrient availability and influences microbial reactions in the soil. In addition, legumes have symbiotic relationships with N-fixing bacteria that are pH -dependent. Grass-based pastures that contain less than 30% of any legume species should have soil pH maintained at a target pH of 6.0. Pastures with legume-grass mixtures where the legume is more than 30% of the species, as well as red clover pastures, should have soil pH maintained at 6.3. The soil pH for alfalfa should be maintained at 6.8.
A pasture should be limed if the soil pH is more than 0.2 units below the target pH. Lime recommendations are based on soil pH as well as the buffer pH. Tables 1a and 1b provide the lime recommendations for pastures with a target pH of 6.0 and 6.3, respectively. Lime recommendations are capped at 4 tons per acre (t/a) of 60-69 grade lime even though more lime may be needed to reach the target pH. This is because there is limited incorporation of the lime by bioturbation (e.g. hoof action, soil biota movement) in the pasture. Soil sampling every four years is a good way to monitor soil pH. Soil pH and lime requirement for both 60-69 neutralizing index (NI) and 80-89 NI limes will be given on a soil test report from most labs.
To adjust the lime recommendation for limes other than 60-69 grade, use the following formula:
Lime requirement (t/a) of lime being used =
(t/a of 60-69 lime recommended) x
(65 ÷ NI* of lime being used)
*When a range is given, use the midpoint (e.g., for 80-89
grade lime, use 85 in the calculation).
Recommended Lime Application Rate Tables for Pastures Based on Target pH
Table 1a. Lime Recommendations for Pastures with Target pH 6.0
Target pH = 6.0
| Soil pH | Buffer pH* 6.3 | Buffer pH 6.4 | Buffer pH 6.5 | Buffer pH 6.6 | Buffer pH 6.7 | Buffer pH 6.8 |
|---|---|---|---|---|---|---|
| 5.0 | 4.0 | 4.0 | 4.0 | 3.5 | 3.0 | 2.0 |
| 5.1 | 4.0 | 4.0 | 4.0 | 3.5 | 2.5 | 2.0 |
| 5.2 | 4.0 | 4.0 | 3.5 | 3.0 | 2.0 | 1.5 |
| 5.3 | 4.0 | 4.0 | 3.5 | 2.5 | 2.0 | 1.0 |
| 5.4 | 4.0 | 3.5 | 3.0 | 2.0 | 1.5 | 1.0 |
| 5.6 | 3.5 | 3.0 | 2.0 | 1.5 | 1.0 | 1.0 |
| 5.7 | 3.5 | 2.5 | 2.0 | 1.0 | 1.0 | 1.0 |
| 5.8 | 3.5 | 2.0 | 1.5 | 1.0 | 1.0 | 1.0 |
Table data units: tons/a of 60–69 grade lime to apply
Table 1b. Lime Recommendations for Pastures with Target pH 6.3
Target pH = 6.3
| Soil pH | Buffer pH 6.3 | Buffer pH 6.4 | Buffer pH 6.5 | Buffer pH 6.6 | Buffer pH 6.7 | Buffer pH 6.8 |
|---|---|---|---|---|---|---|
| 5.0 | 4.0 | 4.0 | 4.0 | 4.0 | 2.5 | 1.5 |
| 5.1 | 4.0 | 4.0 | 4.0 | 3.5 | 2.5 | 1.0 |
| 5.2 | 4.0 | 4.0 | 4.0 | 3.5 | 2.0 | 1.0 |
| 5.3 | 4.0 | 4.0 | 4.0 | 3.0 | 1.5 | 1.0 |
| 5.4 | 4.0 | 4.0 | 4.0 | 2.5 | 1.5 | 1.0 |
| 5.6 | 4.0 | 4.0 | 3.5 | 2.0 | 1.0 | 1.0 |
| 5.7 | 4.0 | 4.0 | 3.0 | 1.5 | 1.0 | 1.0 |
| 5.8 | 4.0 | 4.0 | 2.5 | 1.5 | 1.0 | 1.0 |
| 6.0 | 4.0 | 3.5 | 2.0 | 1.0 | 1.0 | 1.0 |
| 6.1 | 4.0 | 3.0 | 1.5 | 1.0 | 1.0 | 1.0 |
Table data units: tons/a of 60–69 grade lime to apply
Nitrogen
When a pasture sward contains a significant percentage of legumes such as alfalfa or clovers, nitrogen additions are not recommended. The legume species biologically fix N for their own use and provide some N to companion grasses as legume plant roots, crowns, and leaves decompose and regenerate. The grasses will generally benefit from added N, but to the detriment of the desired legumes, which will not compete with the N-fed grasses. When a pasture sward is composed entirely of grass, manure and urine deposition often do not supply enough available N for optimal forage production. The guidelines in table 2 are based on the pasture’s soil organic matter content (as determined by the soil test) and whether the pasture is being seeded or is already established. For legume-grass pastures, a small amount of N is recommended only at seeding. Nitrogen applications should be split into two or three applications through the growing season.
Nitrogen application will stimulate growth. Therefore, split N applications in early- to mid-June and early- to mid-August will promote more even pasture production through the season. Ideally application of urea-based fertilizers should be applied ahead of rainfall to limit ammonia volitilization.
Table 2. Nitrogen Fertilization Guidelines for Pastures
| Crop | Yield range per acre | Soil organic matter <2.0% | Soil organic matter 2.0%–9.9% | Soil organic matter 10.0%–20.0% | Soil organic matter > 20.0% |
|---|---|---|---|---|---|
| Pasture grassa,b | 0.5–5 ton | 160 | 130 | 100 | 50 |
| Pasture, ≤ 30% legume-grass, seeding | 0.5–1.9 ton | 40 | 20 | 0 | 0 |
| Pasture, ≤ 30% legume-grass, established | 2–5 ton | 0 | 0 | 0 | 0 |
| Pasture, > 30% legume-grass, seeding | 0.5–1.9 ton | 30 | 10 | 0 | 0 |
| Pasture, > 30% legume-grass, established | 2–5 ton | 0 | 0 | 0 | 0 |
| Pasture, unimproveda | 1–4 ton | 120 | 100 | 70 | 30 |
aSplit N applications into two to three applications per year.
bGrass = bromegrass, orchardgrass, fescue, ryegrass, timothy (any combination).
Phosphorus (P) and Potassium (K)
Management-intensive grazing systems with good manure distribution often result in efficient cycling of phosphorus and potassium between grazing livestock and forage production. The need for supplemental P and K inputs may be minimal, particularly when grazing livestock are supplemented with other feeds. The need for P and K additions is best determined by soil testing every four years (see Sampling Soils for Testing chapter in A2809 for guidelines). Application guidelines for P and K (table 4) for each of the four pasture crop categories are based on the soil test interpretation level (table 3) and pasture forage yield goal.
Yield goals should be based on historic yields from the pasture and reasonable goals for improvement based on forage need and management level. Several methods can be employed for estimating and tracking pasture yields, including hand clipping from sampling squares, keeping records of grazing days and livestock gains, using pasture sticks (USDA-NRCS) or a pasture plate. See Pastures for Profit (A3529) for guidance on estimating pasture productivity.
Soil Test Interpretation Tables for P and K
Table 3a. Phosphorus Soil Test Interpretation Levels for Pasture
| Soil groupa | Very low (VL) | Low (L) | Optimum | High (H) | Very high (VH) | Excessively high (EH) |
|---|---|---|---|---|---|---|
| Loamy | <10 | 10–15 | 16–20 | 21–30 | – | >30 |
| Sandy, Organic | <12 | 12–22 | 23–32 | 33–42 | – | >42 |
aFor more details on soil groups see Nutrient Application Guidelines for Field, Vegetable, and Fruit Crops in Wisconsin (A2809), Chapter 4.
Table 3b. Potassium Soil Test Interpretation Levels for Pasture
| Soil groupa | Very low (VL) | Low (L) | Optimum | High (H) | Very high (VH) | Excessively high (EH) |
|---|---|---|---|---|---|---|
| Loamy | <70 | 70–100 | 101–130 | 131–160 | 161–190 | >190 |
| Sandy, Organic | <45 | 45–65 | 66–90 | 91–130 | – | >130 |
aFor more details on soil groups see Nutrient Application Guidelines for Field, Vegetable, and Fruit Crops in Wisconsin (A2809), Chapter 4.
Nutrient Application Guideline Tables for P and K Based on Pasture Type
Table 4a. Phosphorus Nutrient Application Guidelines for Pasture Grass
Crop name: Pasture, grassa,b
| Yield goal (per acre) | Very Low | Low | Optimum | High | Excessively High |
|---|---|---|---|---|---|
| 0.5–1.9 ton | 69 | 50 | 20 | 10 | 0 |
| 2–3 ton | 80 | 70 | 40 | 20 | 0 |
| 3.1–4 ton | 95 | 85 | 55 | 30 | 0 |
| 4.1–5 ton | 110 | 100 | 70 | 35 | 0 |
Table data units: lb P2O5/a to apply
aIncludes bromegrass, fescue, orchardgrass, ryegrass, and timothy.
bP2O5 and K2O guidelines for pasture make no assumptions about manure/urine deposition. Nutrient credits for manure/urine deposition should be subtracted from these rates.
Table 4b. Phosphorus Nutrient Application Guidelines for Pasture, ≤ 30% Legume-grass
Crop Name: Pasture, ≤ 30% legume-grassb
| Yield goal (per acre) | Very Low | Low | Optimum | High | Excessively High |
|---|---|---|---|---|---|
| 0.5–1.9 ton | 55 | 45 | 15 | 10 | 0 |
| 2–3 ton | 75 | 65 | 35 | 20 | 0 |
| 3.1–4 ton | 85 | 75 | 45 | 25 | 0 |
| 4.1–5 ton | 100 | 90 | 60 | 30 | 0 |
Table data units: lb P2O5/a to apply
aIncludes bromegrass, fescue, orchardgrass, ryegrass, and timothy.
bP2O5 and K2O guidelines for pasture make no assumptions about manure/urine deposition. Nutrient credits for manure/urine deposition should be subtracted from these rates.
Table 4c. Phosphorus Nutrient Application Guidelines for Pasture, > 30% Legume-grass
Crop name: Pasture, > 30% legume-grassb
| Yield goal (per acre) | Very Low | Low | Optimum | High | Excessively High |
|---|---|---|---|---|---|
| 0.5–1.9 ton | 55 | 45 | 15 | 10 | 0 |
| 2–3 ton | 75 | 65 | 35 | 20 | 0 |
| 3.1–4 ton | 85 | 75 | 45 | 25 | 0 |
| 4.1–5 ton | 100 | 90 | 60 | 30 | 0 |
Table data units: lb P2O5/a to apply
aIncludes bromegrass, fescue, orchardgrass, ryegrass, and timothy.
bP2O5 and K2O guidelines for pasture make no assumptions about manure/urine deposition. Nutrient credits for manure/urine deposition should be subtracted from these rates.
Table 4d. Phosphorus Nutrient Application Guidelines for Pasture, Unimproved
Crop name: Pasture, unimprovedb
| Yield goal (per acre) | Very Low | Low | Optimum | High | Excessively High |
|---|---|---|---|---|---|
| 1–2 ton | 65 | 55 | 25 | 15 | 0 |
| 2.1–3 ton | 80 | 70 | 40 | 20 | 0 |
| 3.1–4 ton | 95 | 85 | 55 | 30 | 0 |
Table data units: lb P2O5/a to apply
aIncludes bromegrass, fescue, orchardgrass, ryegrass, and timothy.
bP2O5 and K2O guidelines for pasture make no assumptions about manure/urine deposition. Nutrient credits for manure/urine deposition should be subtracted from these rates.
Table 4e. Potassium Nutrient Application Guidelines for Pasture Grass
Crop Name: Pasture, grassa,b
| Yield goal (per acre) | Very Low | Low | Optimum | High | Very High | Excessively High |
|---|---|---|---|---|---|---|
| 0.5–1.9 ton | 115 | 100 | 70 | 35 | 20 | 0 |
| 2–3 ton | 185 | 170 | 140 | 70 | 35 | 0 |
| 3.1–4 ton | 240 | 225 | 195 | 100 | 50 | 0 |
| 4.1–5 ton | 295 | 280 | 250 | 125 | 65 | 0 |
Table data units: lb K2O/a to apply
aIncludes bromegrass, fescue, orchardgrass, ryegrass, and timothy.
bP2O5 and K2O guidelines for pasture make no assumptions about manure/urine deposition. Nutrient credits for manure/urine deposition should be subtracted from these rates.
Table 4f. Potassium Nutrient Application Guidelines for Pasture, ≤ 30% Legume-grass
Crop name: Pasture, ≤ 30% legume-grassb
| Yield goal (per acre) | Very Low | Low | Optimum | High | Very High | Excessively High |
|---|---|---|---|---|---|---|
| 0.5–1.9 ton | 110 | 95 | 65 | 35 | 15 | 0 |
| 2–3 ton | 175 | 160 | 130 | 65 | 35 | 0 |
| 3.1–4 ton | 225 | 210 | 180 | 90 | 45 | 0 |
| 4.1–5 ton | 275 | 260 | 230 | 115 | 60 | 0 |
Table data units: lb K2O/a to apply
aIncludes bromegrass, fescue, orchardgrass, ryegrass, and timothy.
bP2O5 and K2O guidelines for pasture make no assumptions about manure/urine deposition. Nutrient credits for manure/urine deposition should be subtracted from these rates.
Table 4g. Potassium Nutrient Application Guidelines for Pasture, > 30% Legume-grass
Crop name: Pasture, > 30% legume-grassb
| Yield goal (per acre) | Very Low | Low | Optimum | High | Very High | Excessively High |
|---|---|---|---|---|---|---|
| 0.5–1.9 ton | 120 | 105 | 75 | 40 | 20 | 0 |
| 2–3 ton | 195 | 180 | 150 | 75 | 40 | 0 |
| 3.1–4 ton | 255 | 240 | 210 | 105 | 55 | 0 |
| 4.1–5 ton | 315 | 300 | 270 | 135 | 70 | 0 |
Table data units: lb K2O/a to apply
aIncludes bromegrass, fescue, orchardgrass, ryegrass, and timothy.
bP2O5 and K2O guidelines for pasture make no assumptions about manure/urine deposition. Nutrient credits for manure/urine deposition should be subtracted from these rates.
Table 4h. Potassium Nutrient Application Guidelines for Pasture, Unimproved
Crop name: Pasture, unimprovedb
| Yield goal (per acre) | Very Low | Low | Optimum | High | Very High | Excessively High |
|---|---|---|---|---|---|---|
| 1–2 ton | 100 | 85 | 55 | 30 | 15 | 0 |
| 2.1–3 ton | 135 | 120 | 90 | 45 | 25 | 0 |
| 3.1–4 ton | 170 | 155 | 125 | 65 | 30 | 0 |
Table data units: lb K2O/a to apply
aIncludes bromegrass, fescue, orchardgrass, ryegrass, and timothy.
bP2O5 and K2O guidelines for pasture make no assumptions about manure/urine deposition. Nutrient credits for manure/urine deposition should be subtracted from these rates.
Nutrient Crediting
Nutrients deposited on pastures in manure and urine should be credited against the suggested N, P2O5, and K2O application rates. Nutrient credits are based on the amount of manure deposited (t/a) and the nutrient content of the manure. Table 5 provides nutrient contents for manures from livestock species commonly grazed in Wisconsin. For these species, 40% of the total N and 80% of the total P2O5 and K2O deposited should be credited each year. The N credits assume that 30% of the total N deposited is available in the year of deposition (1st year credit) and an additional 10% of total N is available in the year after deposition (2nd year credit). For P and K, 80% of the P2O5 and K2O deposited are available as 1st year credits.
The availability of manure and urine nutrients will not total 100% for several reasons:
- The deposited nutrient amounts are an estimation, not an exact amount.
- Some of the nutrients are incorporated into soil organic matter and microbial pools.
- Nutrient losses—such as ammonia volatilization, leaching and denitrification of nitrate, and surface runoff of all nutrients—can occur.
Table 5. Estimated Total and Available Nutrient Contents in Deposited Manure or Urine Pasture Systems
| Livestock Type | Dry Matter % | Total N | Total P2O5 | Total K2O | Available N | Available P2O5 | Available K2O |
|---|---|---|---|---|---|---|---|
| Beef | 8 | 14 | 4 | 9 | 6 | 3 | 7 |
| Dairy | 13 | 10 | 4 | 7 | 4 | 3 | 6 |
| Sheep | 25 | 19 | 10 | 19 | 8 | 8 | 15 |
| Goat | 32 | 22 | 5 | 15 | 9 | 4 | 12 |
| Horse | 14 | 7 | 2 | 2 | 3 | 2 | 2 |
Table data units: lb/ton
P and K note
Application guidelines for P and K are given in their oxide
forms, P2O5 (phosphate) and K2O (potash), which is how fertilizer nutrients are expressed.
The amount of manure deposited on a pasture can be estimated according to the number of animals of a given species, their size, and the amount of time spent grazing the pasture. Daily manure production estimates for the major livestock species have been developed and are published by the Midwest Plan Service (table 6). They can also be obtained from your UW-Extension county office, county land and water conservation department, or from the Wisconsin Department of Agriculture Trade and Consumer Protection (WDATCP) on their farm nutrient management planning web page. These manure production values, and the associated nutrient contents, are also used within the SnapPlus software for farm nutrient management planning. SnapPlus contains a Grazing Herd Setup where total daily manure production can be calculated and a Grazing Application Rate Estimator where manure deposition on a paddock-by-paddock basis can be determined. Find out more about SnapPlus in the additional information section linked here.
Nutrient credits should also be taken when manure is collected from other places on the farm such as milking centers and feedlots, and then mechanically applied to pastures. In this case, the nutrient composition and availability of the
collected manure will be different than feces and urine that are directly deposited on pastures; the estimated available nutrients in table 5 should not be used. To obtain more appropriate nutrient credits for mechanically applied manure, see Nutrient Application Guidelines for Field, Vegetable, and Fruit Crops in Wisconsin (A2809), pages 73–77.
Nutrient Credit Example
| Nurtients | Lbs of N per acre | Lbs of P2O5 per acre | Lbs of K2O per acre |
|---|---|---|---|
| Soil test recommendation for a managed or rotation grass pasture (soil test = optimum for P and K, 3% OM, yield goal = 3.5 tons/acre) | 130 | 55 | 195 |
| Credit for estimated beef cattle manure deposited in the pasture = 4.5 tons/acre @ 6-3-7 | 27 | 14 | 32 |
| Subtract the nutrient credits from the suggested nutrient application rates to get fertilizer/supplemental nutrients to apply. | 103 | 41 | 163 |
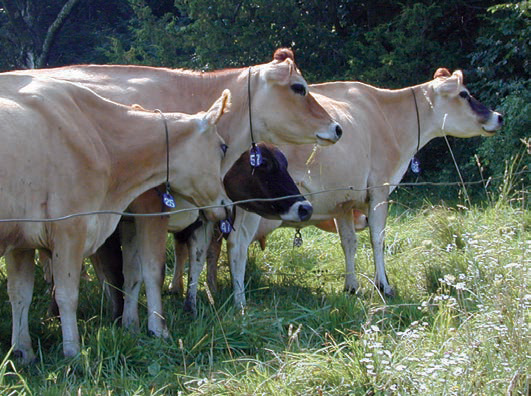
Tips For Good Manure and Urine Distribution
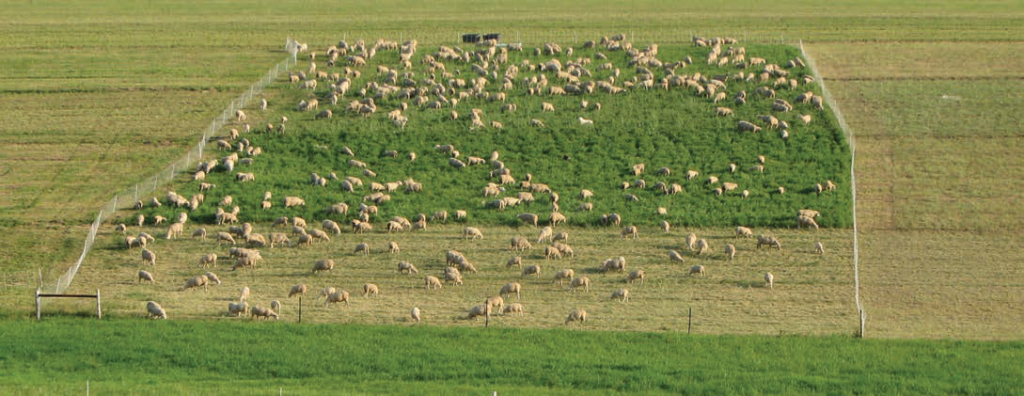
The ability of a grazier to depend on nutrient credits from manure deposition will depend on relatively even manure distribution across the pastures and within paddocks.
Practices shown to improve manure and urine distribution by grazing livestock include:
Additional Information
Midwest Plan Service, 2000. Livestock Waste Facilities Handbook. Publication 18, 112 pp. ISBN 0-89373-089-0.
UW-Madison Extension Team Forage website and Grazier’s Notebook Fact Sheets.
UW-Madison Extension Publications
Nutrient Application Guidelines for Field, Vegetable and Fruit Crops in Wisconsin (A2809).
Pastures for Profit: A Guide to Rotational Grazing (A3529).
SnapPlus Grazing Tool
SnapPlus has grazing tools that estimate pasture manure amounts and application rates. Click here for SnapPlus Software.
Important note for SnapPlus users: The terminology for pastures in A2809 does not exactly match those used in SnapPlus. Use the table below to cross-reference the pasture names.
| A2809 crop name | SnapPlus crop name |
|---|---|
| Pasture, grass | Pasture seeding, grass Pasture, rotational stocking, grass Pasture, variable stocking, managed continuous |
| Pasture, < 30% legume-grass, seeding | Pasture seeding, grass/legume |
| Pasture, < 30% legume-grass, established | Pasture, rotational stocking, grass/legume Pasture, variable stocking, managed continuous, grass/legume |
| Pasture, > 30% legume-grass, seeding | Pasture seeding, legume more than 30% |
| Pasture, > 30% legume-grass, established | Pasture, rotational stocking, legume more than 30% Pasture, variable stocking, managed continuous, legume more than 30% |
| Pasture, unimproved | Pasture, continuous stocking, high density Pasture, continuous stocking, low density |
| Idle land (no recommendations) | Pasture, dry lot, exercise area |
Originally Published: 2013