

Weather and climate conditions this week in Wisconsin
Here are this week’s take-home points about the weather. As a reminder, AgWOW reports will be published weekly throughout the growing season. Scroll down for the full report.
Additionally, we’re collecting user feedback. Regardless of whether it’s your first time here or if you are a regular user, we’d love to hear from you!

Key Points
Recent Conditions
- Temperatures were 1-3°F warmer than normal across most of the state.
- Rainfall totals were highest last week in northwest, northeast, and southern counties (0.5-2”). Central and east central counties were the driest, with widespread totals of less than 0.25”.
Impact
- For Wisconet stations included in the chart and table, most saw decreased soil moisture after receiving less than a half inch of rain last week.
- Satellite-based soil moisture estimates indicate that severe dryness is common across northwest, north-central, and east-central counties. These estimates also indicate that dryness worsened in southern counties.
- Abnormal dryness (D0) expanded into Grant County last week, but D1-D4 coverage was unchanged from last week.
- A small percentage of the state’s soybean crop has begun dropping leaves, and the corn kernels are denting across many Wisconsin fields. The continued dryness once again caused the corn and soybean conditions to decrease.
Outlook
- All of Wisconsin has a chance for rain next week, with models indicating totals of over 2” for some. Rain chances are highest on Thursday (9/3), Friday (9/4), and Tuesday (9/8).
- Mid-September temperatures in southern and central Wisconsin are likely to be above normal, with precipitation leaning above normal statewide.
- September temperatures are leaning towards above normal statewide (40-50% odds), with precipitation uncertain with “equal chances”.
- Fall temperatures are leaning towards above normal for almost all of Wisconsin. Precipitation is uncertain statewide except for the far northeast (below normal lean).
Agronomic, Fruit, and Vegetable Considerations
Field Conditions
- Crop conditions are highly reflective of moisture throughout the state. Pockets of drought-stressed crops are scattered throughout Wisconsin, especially in the northern regions of the state, with silage harvest beginning early due to low moisture and/or disease pressure.
Forage Management
- Fourth crop is being harvested. Use the Alfalfa Cutting Tool to plan your final cut to manage for persistence.
- Read about the impacts of drought on alfalfa if your crop is affected.
- Silage season is here. As dry down events start collecting moisture data, you can view reports using the Corn Silage Dry Down Monitoring Tool.
- If your silage crop has been impacted by drought, read these harvest considerations.
- In areas that are impacted by drought, take caution with annual forages such as sorghum-sudangrass for concerns related to nitrate toxicity.
Pest Management
- Scout fields to note what weed species are part of a late flush or have escaped herbicide application.
- Scout late planted sweet corn with remaining green silks for corn earworm. Late season moth migrations are high.
- Corn rootworm adult populations have been lower this year. Scouting to determine pressure will help dictate management strategies for next year.
- If your area has been dry, check the undersides of soybean leaves for spider mites. This pest causes pockets of yellowing and browning of leaves starting on field edges and working inward.
- Wisconsin has its first confirmed case of soybean tentiform leafminer. This pest is unlikely to cause economic damage, but please report the pest if found.
- Red crown rot was confirmed in WI last year. Know what to scout for in your soybean fields this year.
- Fall armyworm trapping counts remain low.
- Read the late-season field crops disease report. Diseases may be visible in corn and soybean fields, so make appropriate harvest plans if disease is present.
Manure Applications
- Reminder of Wisconsin’s NR 151 Runoff Rules with the timing of manure spreading and current runoff levels. Check DATCP Runoff Risk Advisory Forecast.
Small Grains
- As you harvest, remember the importance of combine cleaning.
- After small grain harvest is the perfect time to plant cover crops. Review species options.
- If you are planting winter wheat this fall, consider revisiting Small Grains Recommendations and Row Width and Seeding Rates in WI.
Fruit Considerations – General
- Reminder: Always read and follow directions on the label and keep in mind pre-harvest intervals (PHI) as we move through harvest.
- Table grape harvest has begun, with wine grapes soon to follow at West Madison Ag. Research Station. Check out last weeks WI Fruit Crop Scouting Report for updates on grape maturity testing.
- Sanitation: remove and destroy (chop/compost) fallen fruit ~weekly to prevent any internally developing larvae from reaching maturity, and to limit the spread of disease.
- Apple and grape growers can reference the NEWA weather station network to monitor for disease infection periods in their area. Check out your nearest weather station: NEWA Weather Station Network (Cornell).
- Wisconsin fruit growers can reference the Midwest Fruit Pest Management Guide for a list of registered products and recommended best practices. View the MFPMG Online.
- Sun scald and southwest injury to trunks and branches has been observed across many orchards and vineyards this summer, likely due to wide variations in winter temperatures that can cause trunk and branch damage.
- Fruit sunburn has been observed across many fruit crops in southern WI. Consider removing this fruit while out picking to prevent other pests attracted to the volatiles (scent).
Fruit Considerations – Disease
- Downy mildew foliar symptoms (“oil-stains”) have been observed in a few locations. Scout for pale-yellow lesions on the tops of leaves and white downy growth on the underside of leaves.
- Black rot and fruit rot symptoms continue to be reported in vineyards around WI. Review this 2022 article by Dr. Leslie Holland on Fruit and Cluster Rots for more information on black rot and fruit rot management around harvest.
- Sooty blotch and flyspeck continues to be observed in Southern WI, pushed along by warm, humid conditions. Continue monitoring NEWA models.
Fruit Considerations – Insects
- Apple growers should continue monitoring pheromone traps and degree-day (base 50℉) accumulation for Codling moth.
- Grape and berry growers monitoring spotted wing drosophila should continue checking and refreshing traps weekly through harvest.
- Apple maggot pressure is variable across the state. Growers should continue to use red sphere traps to monitor populations.
- Check out the WI DATCP Orchard Insect Pest Bulletin for more information on current insect trap captures across the state.
- Overview of grape insect/mite monitoring and management: Grape Insects and Mite Pests, 2024 Field Season (Cornell, 2024).
Vegetable Considerations – General
- Make note of diseases you are dealing with this season and consider trialing resistant varieties next year.
- It is time to start thinking about fall cover crops. Use the Midwest Cover Crops Council Cover Crop Selection Tool to help decide the best species that fit your goals and planting window.
- If you are considering topping (removing the growing point) of your Brussel sprouts, the recommendation is to top 30-60 days before harvest. More than 60 days before harvest can lead to the stalk regrowing rather than the plant sending energy to the growing sprouts. This practice can make stalks look fuller if you harvest the whole stalk. This practice is only recommended if you plan to do a once over harvest. If you do not top your plants, the sprouts will develop more slowly, but the plant will produce longer into the fall.
- Winter squash harvest tips:
- Signs of maturity include loss of skin glossiness, tough skin that resists puncture by your fingernail, drying/corking of the stem, and on certain types (acorn and delicata) the ground spot turning yellow to orange in color.
- Cucurbita pepo (acorn, delicata, some pie pumpkins) should not be cured. It can lead to the skin changing color, reduced eating quality, and reduced storage life.
- Cucurbita maxima (kabocha, buttercup) and Cucurbita moschata (butternut, some edible pumpkins) should be cured to help the skin harden and to accelerate wound healing to prevent disease development. It also helps the squash convert starch to sugar to improve eating quality sooner. Curing should occur at warm temperatures (80-85°F) and high humidity (80-85%) for 5 to 10 days.
- Storage conditions: temperatures should range from 50-55°F. Relative humidity should be between 50-70%. The area should be well ventilated.
Vegetable Considerations – Disease
- Brassica alternaria starts as small black lesions that grow in a bullseye pattern as the lesions expand. It is spread through overhead irrigation, windborne spores, and insects such as flea beetles. Management options include avoiding working in fields when wet, management of weeds in the brassica family that serve as alternative hosts (ex: shepherd’s purse and wild mustards), removal of infected plants, and fungicides.
- Cucurbit downy mildew of cucumber has been confirmed in several more counties in Michigan over the past week. Cases have also been reported in Ohio, New York, and Pennsylvania. There are currently no reports in WI. Symptoms start as angular, vein bound yellow to pale green spots on the upper leaf surface. As the disease progresses, the lesions turn brown and grow together leading to browning of entire leaves. Under humid conditions a dark purplish-grey fuzz may form on the underside of leaves.
- Continue scouting for powdery mildew. Focus on the underside of leaves and leaves that are shaded. Look for the characteristic white talcum-like colonies. Management includes growing resistant varieties, fungicides, and biologically based products. Michigan State University conducted trials last season on recommendations for both fungicides and biologically based products. Results can be found here. Treatments should continue until the week before harvest. If pumpkins are ready, harvest them as soon as possible. If powdery mildew spreads to the handles, it can make them brittle and reduce desirability for customers.
- Potato and tomato early blight were confirmed in Buffalo County. Symptoms start as circular brown spots. As the lesions expand, they develop the characteristic bulls-eye pattern of concentric rings. The best control measure is prevention. Once symptoms appear, it can be difficult to control. Fungicides must be applied very early, either before disease occurs or at first symptoms, to be effective. Continued preventative fungicide applications for early blight in potato are recommended for all fields in WI. Guidance on fungicide options can be found here. If you have problems with early blight this year, destroy or bury infected plant material and consider planting resistant varieties and increasing plant spacing for increased air flow next season.
- There are no new reports of late blight on potato or tomato anywhere in the Midwest over the past week. Continue applying preventative fungicides. Symptoms include large irregular leaf lesions that are not restricted by leaf veins, dark brown lesions on stems, and brown to red to purple discoloration of internal tuber tissue.
- Bacterial canker of tomato has been confirmed on several farms in WI this summer. This disease can be very difficult to control because it is a systemic infection and can easily be spread during pruning, trellising, and harvest. Symptoms include wilting on one side of the plant while the other remains symptom free and raised corky gray to brown lesions on fruit. It can be easily confused with other diseases so it is recommended to send a sample to the disease diagnostic clinic. Management options
Vegetable Considerations – Insects
- Cabbage aphid populations can increase quickly especially on long season crops such as Brussel sprouts. Their populations actually grow more quickly in relatively cooler temperatures (50-68°F). They prefer to feed on new growth including developing Brussel sprout buds. If plants are infected this fall, but residue cannot be tilled in or removed, be sure to remove/destroy crop residue early next spring before eggs hatch. Management options include biological controls and insecticides although they must be applied early before an infestation is severe.
- Squash bugs continue to be a problem. Nymphs are the most susceptible life stage for control so be sure to be scouting regularly to be able to target this stage. Eggs generally hatch within 5 to 10 days after being laid. In small plantings, control options include remove eggs with adhesive tape, burning egg masses with a small torch, and cutting out small sections of leaves that have eggs. For larger plantings, there are organic and conventional insecticide options. Be sure to get good canopy penetration for the best control.
- Corn earworm, also known as tomato fruit worm, trap counts remained high last week. Check the DATCP trap network for counts in your area. Sweet corn with green silk is at risk. Larvae range in color from olive-brown to maroon to black with yellow heads. Id can be tricky as larvae can look similar. This article from Purdue can help with ID. Management options
- Areas in northern WI are experiencing drought conditions that are favorable for two spotted spider mites (TSSM). TSSM feed on solanaceous crops and cucurbits. Symptoms include pale, blotchy spots that give leaves a mottled appearance and visible webbing with heavy infestations. Management options include overhead irrigation, although water early enough in the day to allow leaves to dry, avoiding over applications of nitrogen, and chemical controls.
Dive deeper into each report section by clicking a topic below.
Precipitation Trends
7 Day Precipitation
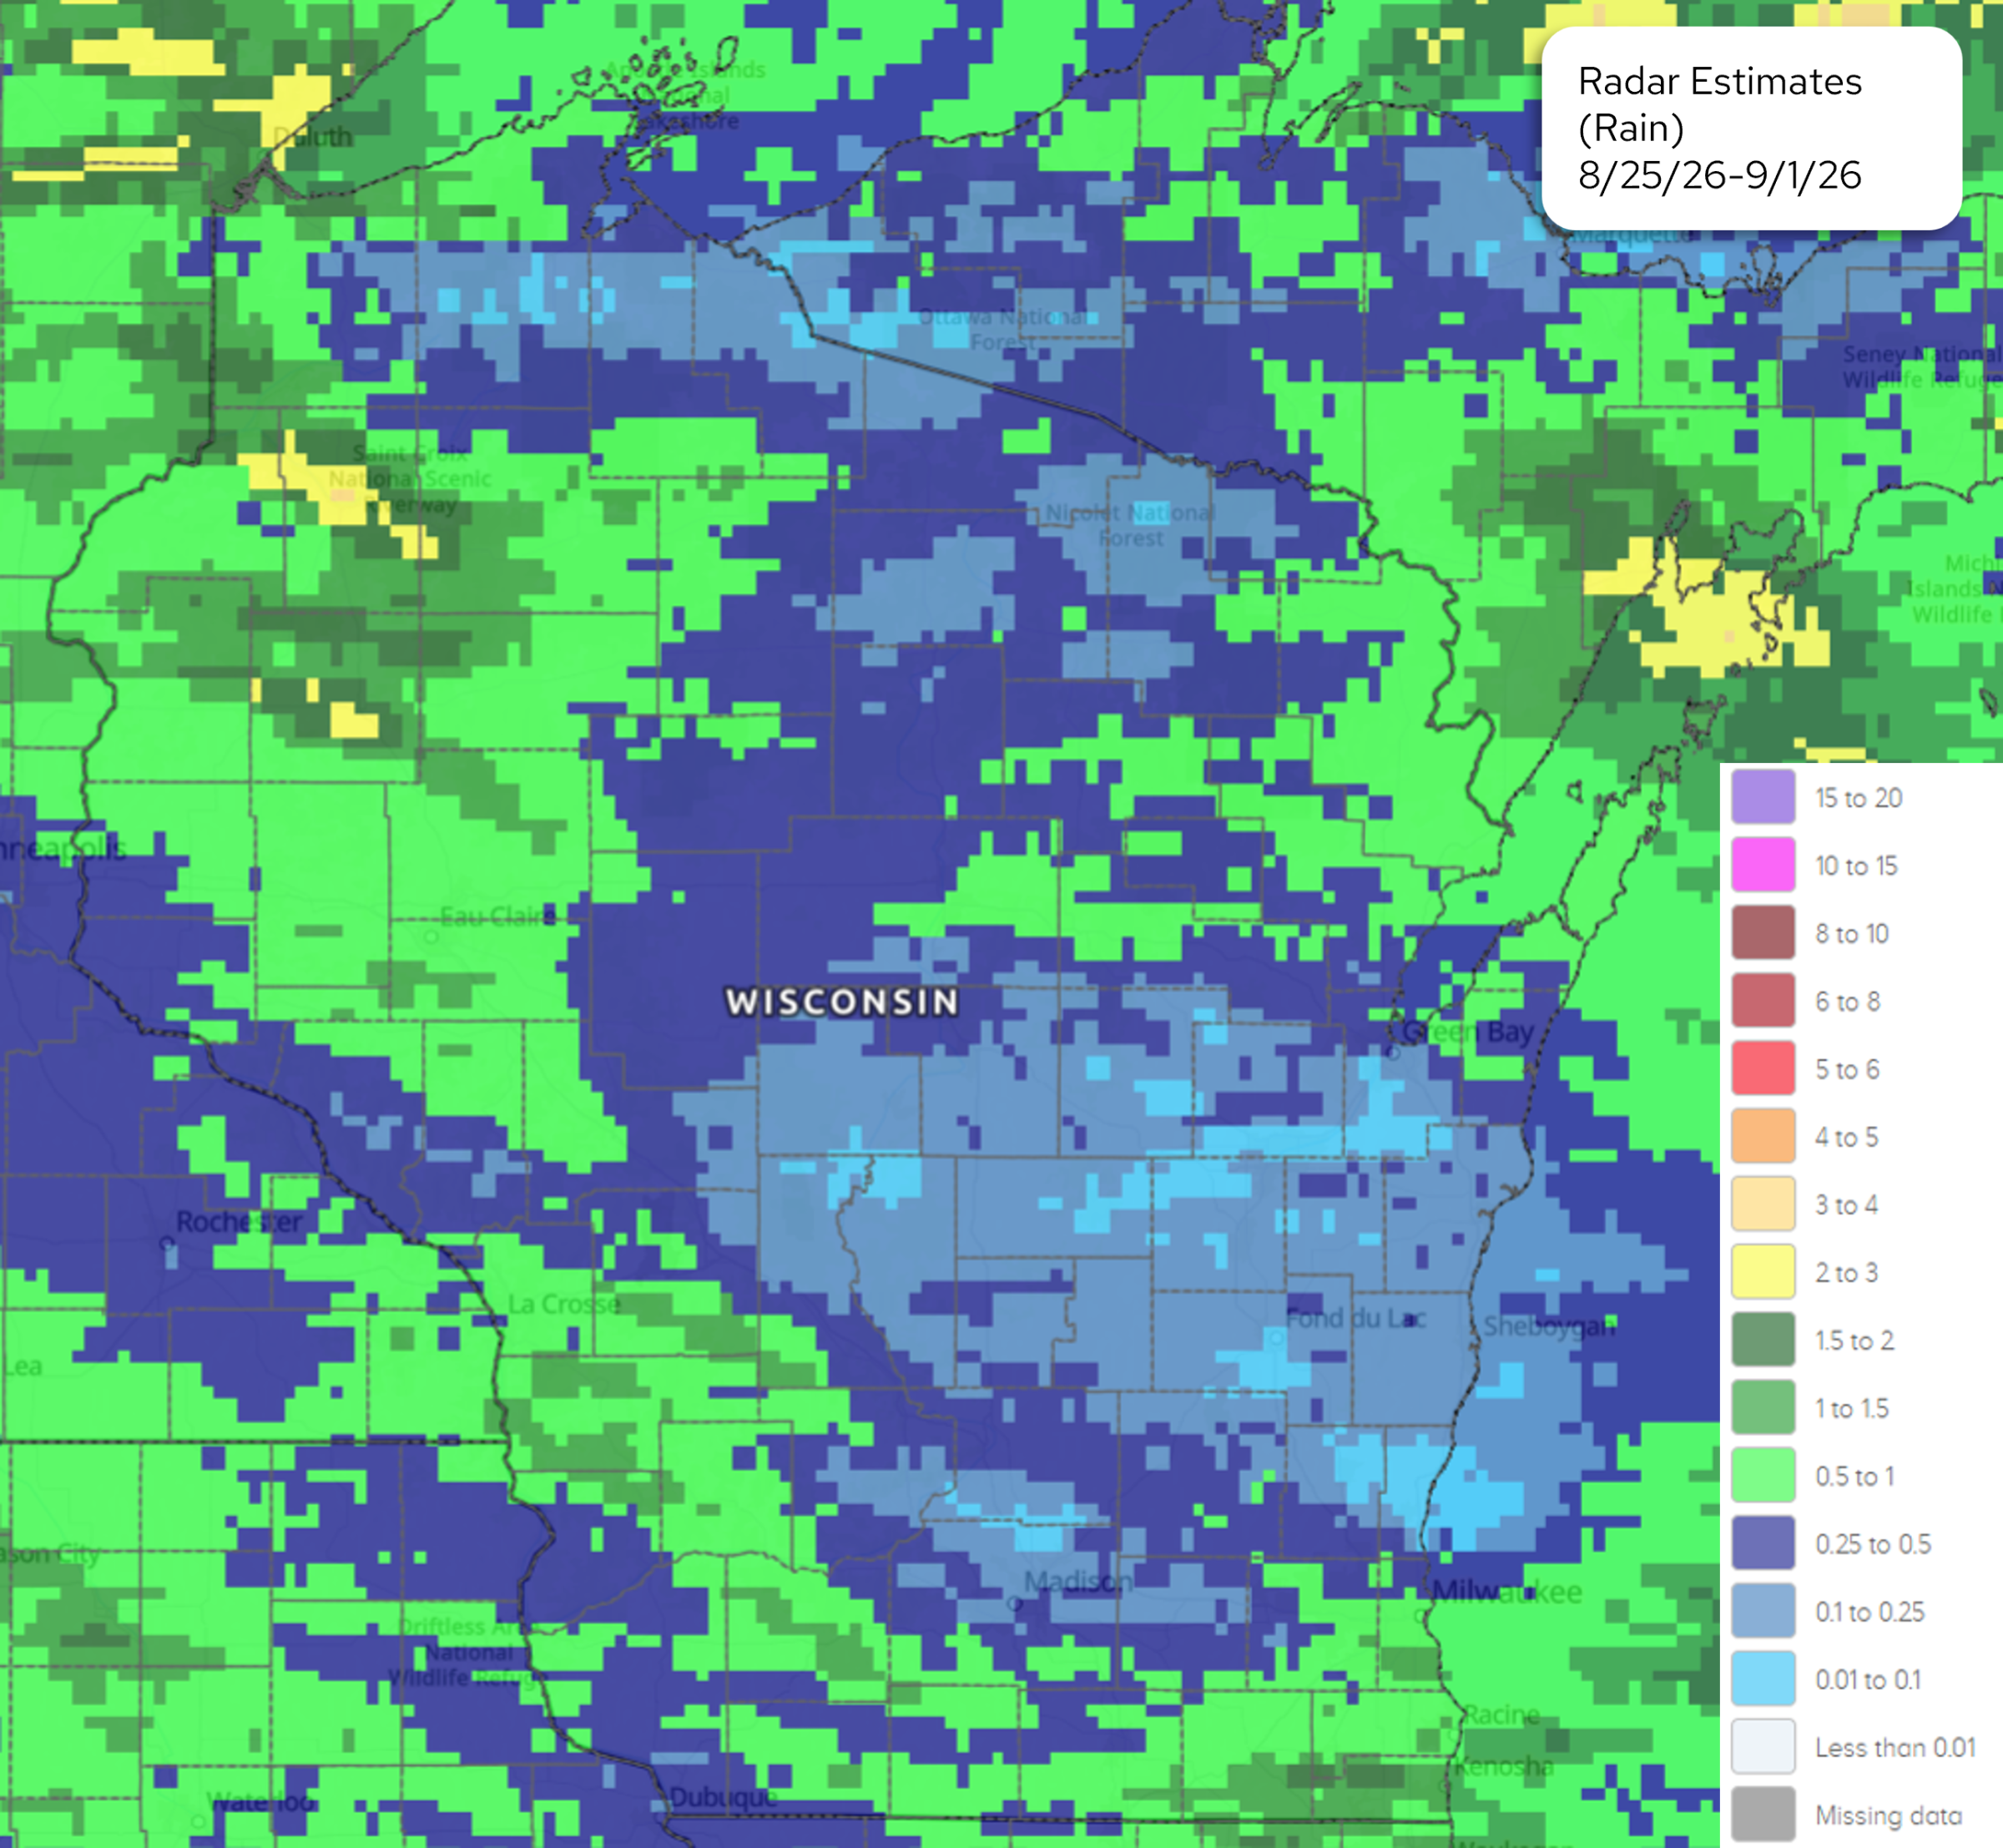
Image Description ↓
A Doppler radar precipitation estimation map covering Wisconsin and surrounding areas for the period from August 25, 2026, to September 1, 2026. The color-coded legend indicates rainfall amounts ranging from less than 0.01 inches to 20 inches. Most of northern and central Wisconsin received between 0.5 and 1.5 inches of rain, shown in bright green. A large band extending through central and southern Wisconsin received between 0.25 and 0.5 inches, depicted in dark blue, with small pockets of 0.01 to 0.1 inches in light blue around Madison and Milwaukee.
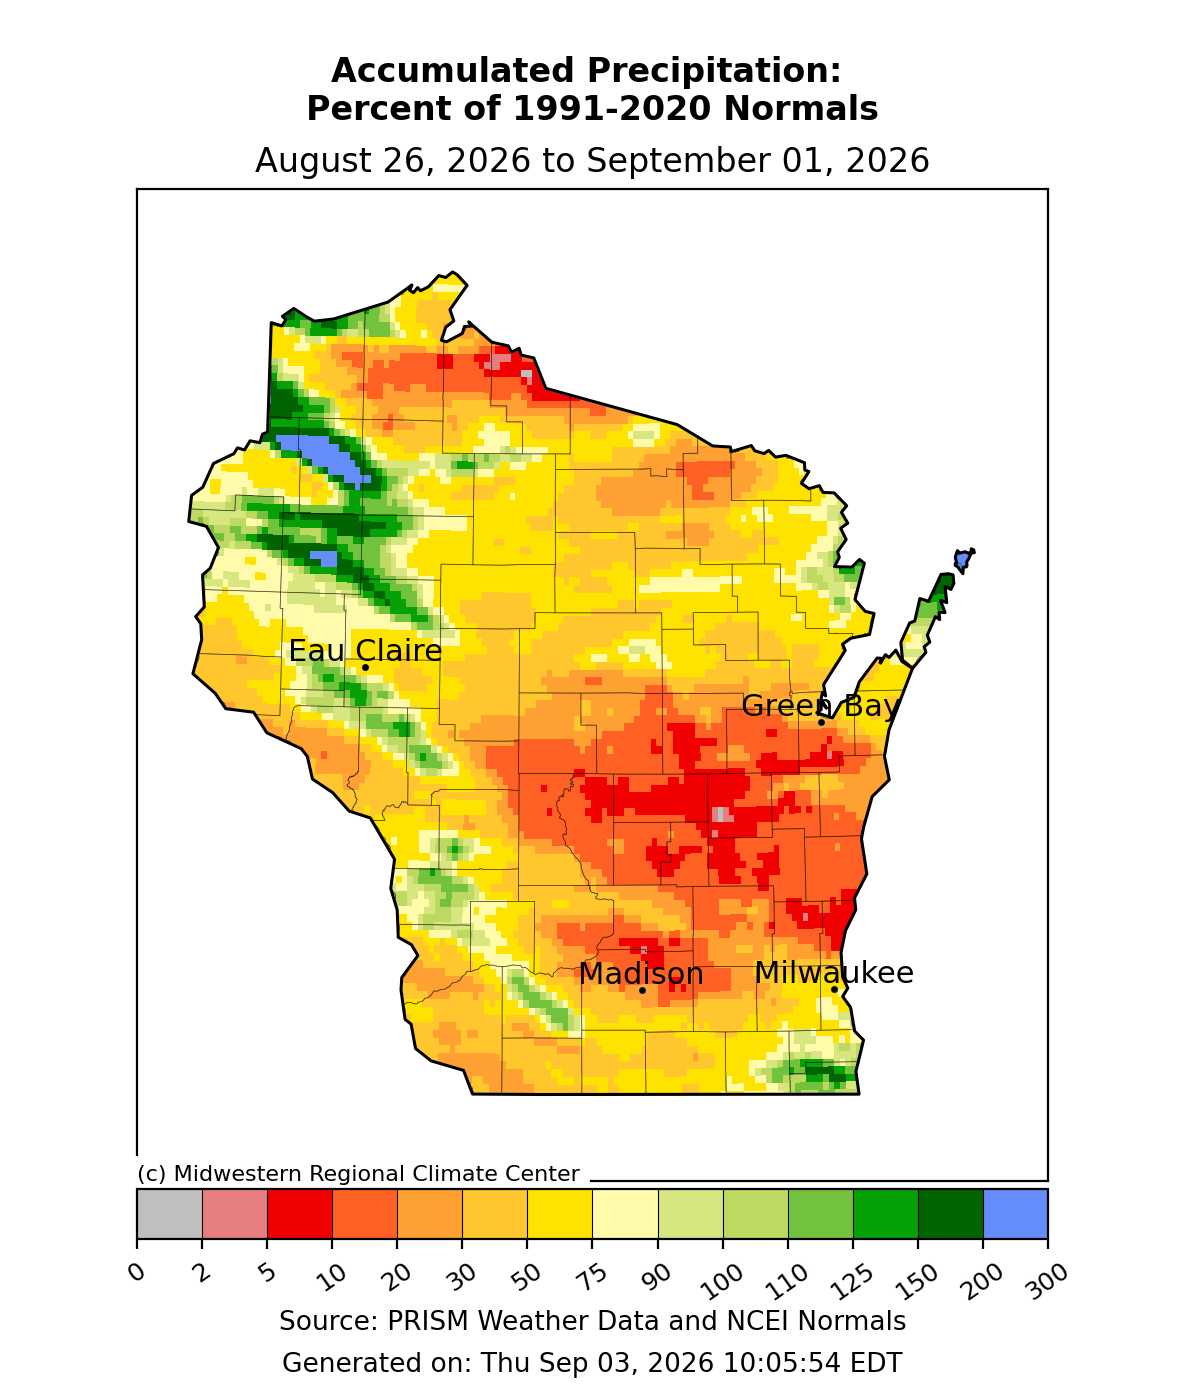
Image Description ↓
A map of Wisconsin published by the Midwestern Regional Climate Center showing accumulated precipitation as a percentage of 1991 to 2020 normal levels between August 26, 2026, and September 01, 2026. Major cities marked include Eau Claire, Green Bay, Madison, and Milwaukee. The color scale at the bottom ranges from gray for 0 percent up to blue for 300 percent. Central and southern areas around Madison and parts of central Wisconsin are dominated by orange and red shades indicating 10 to 30 percent of normal precipitation. Portions of northwestern Wisconsin feature dark green to blue areas indicating 125 to 300 percent of normal precipitation. Small regions in northernmost and far southern Wisconsin show pockets of yellow to green. Source is noted as PRISM Weather Data and NCEI Normals, generated on Thursday, September 03, 2026.
- Totals were highest last week in northwest, northeast, and southern counties. In these regions, totals of 0.5-2” were common.
- Outside of these regions, totals were less than 0.5”. Central and east central counties were the driest, with widespread totals of less than 0.25”.
- Highest Wisconet station total from last week: 1.51” (Sister Bay, Door County). Totals in Door County were as high as 200-300% of normal.
30 Day Precipitation Total and Departure from Normals
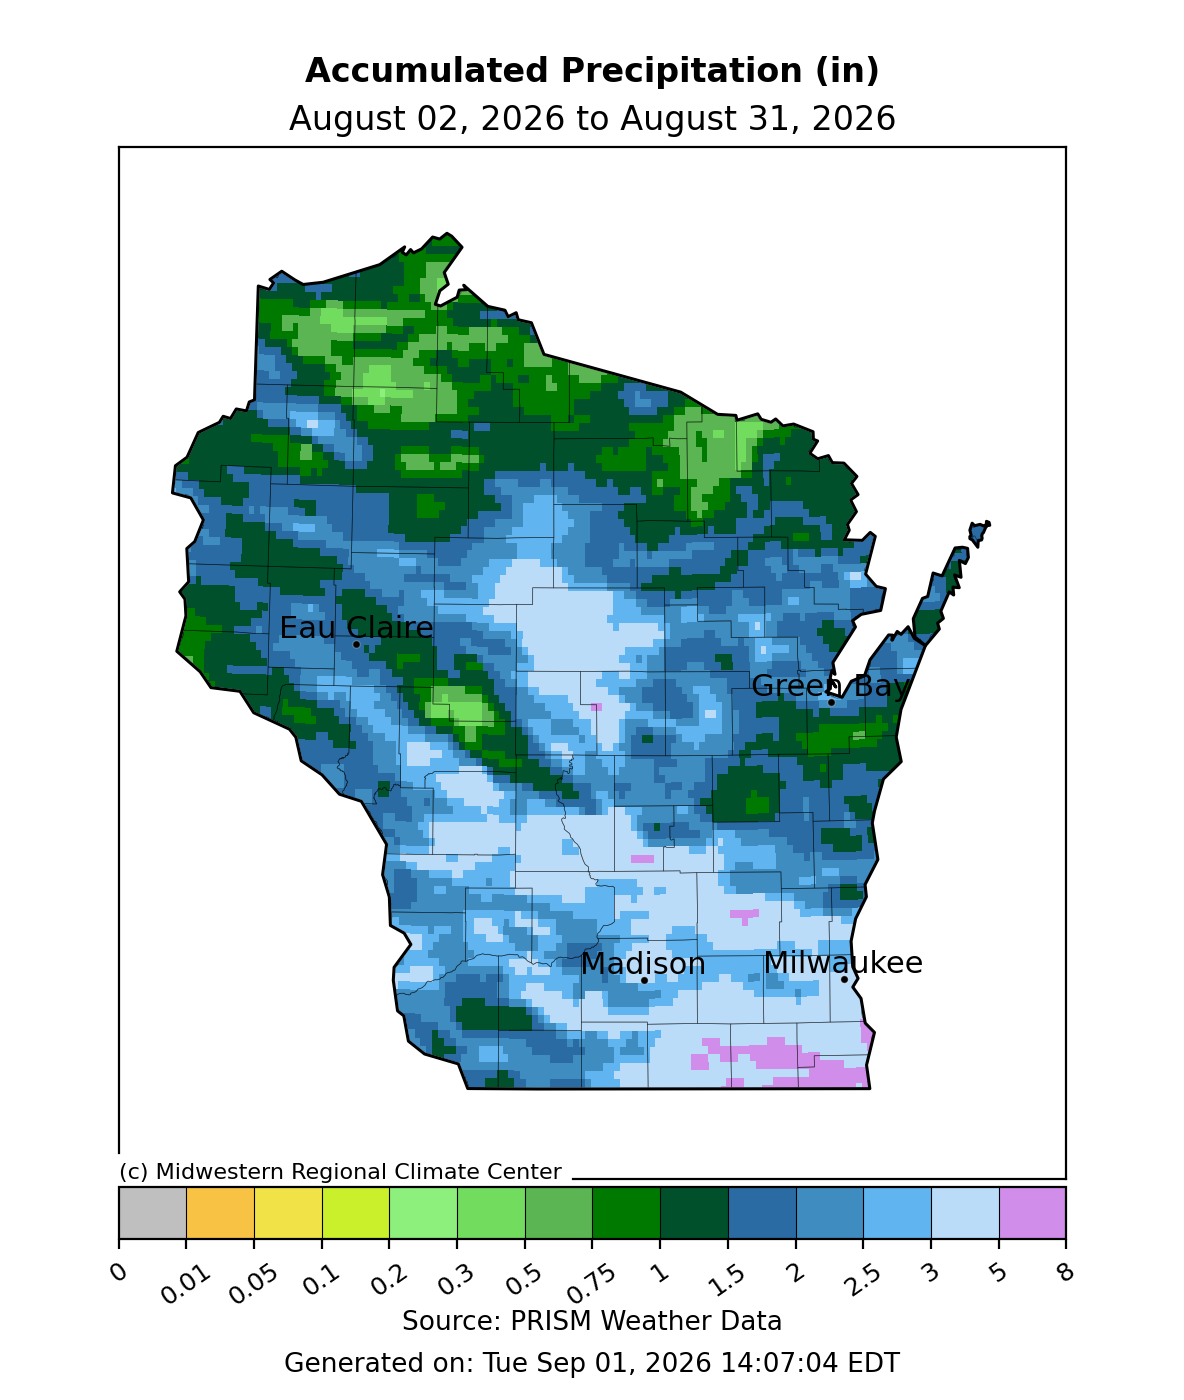
Image Description ↓
This Midwestern Regional Climate Center map shows total accumulated precipitation in inches across Wisconsin from August 2, 2026, to August 31, 2026. The legend ranges from 0 to 8 inches. Northern counties generally received between 0.3 and 1 inch of precipitation (shaded in green). Central and southern areas, including Eau Claire, Green Bay, Madison, and Milwaukee, received between 1.5 and 5 inches (shaded in blues). Pockets in the southernmost counties near the border recorded between 5 and 8 inches, shaded in light purple. Source data is provided by PRISM Weather Data.
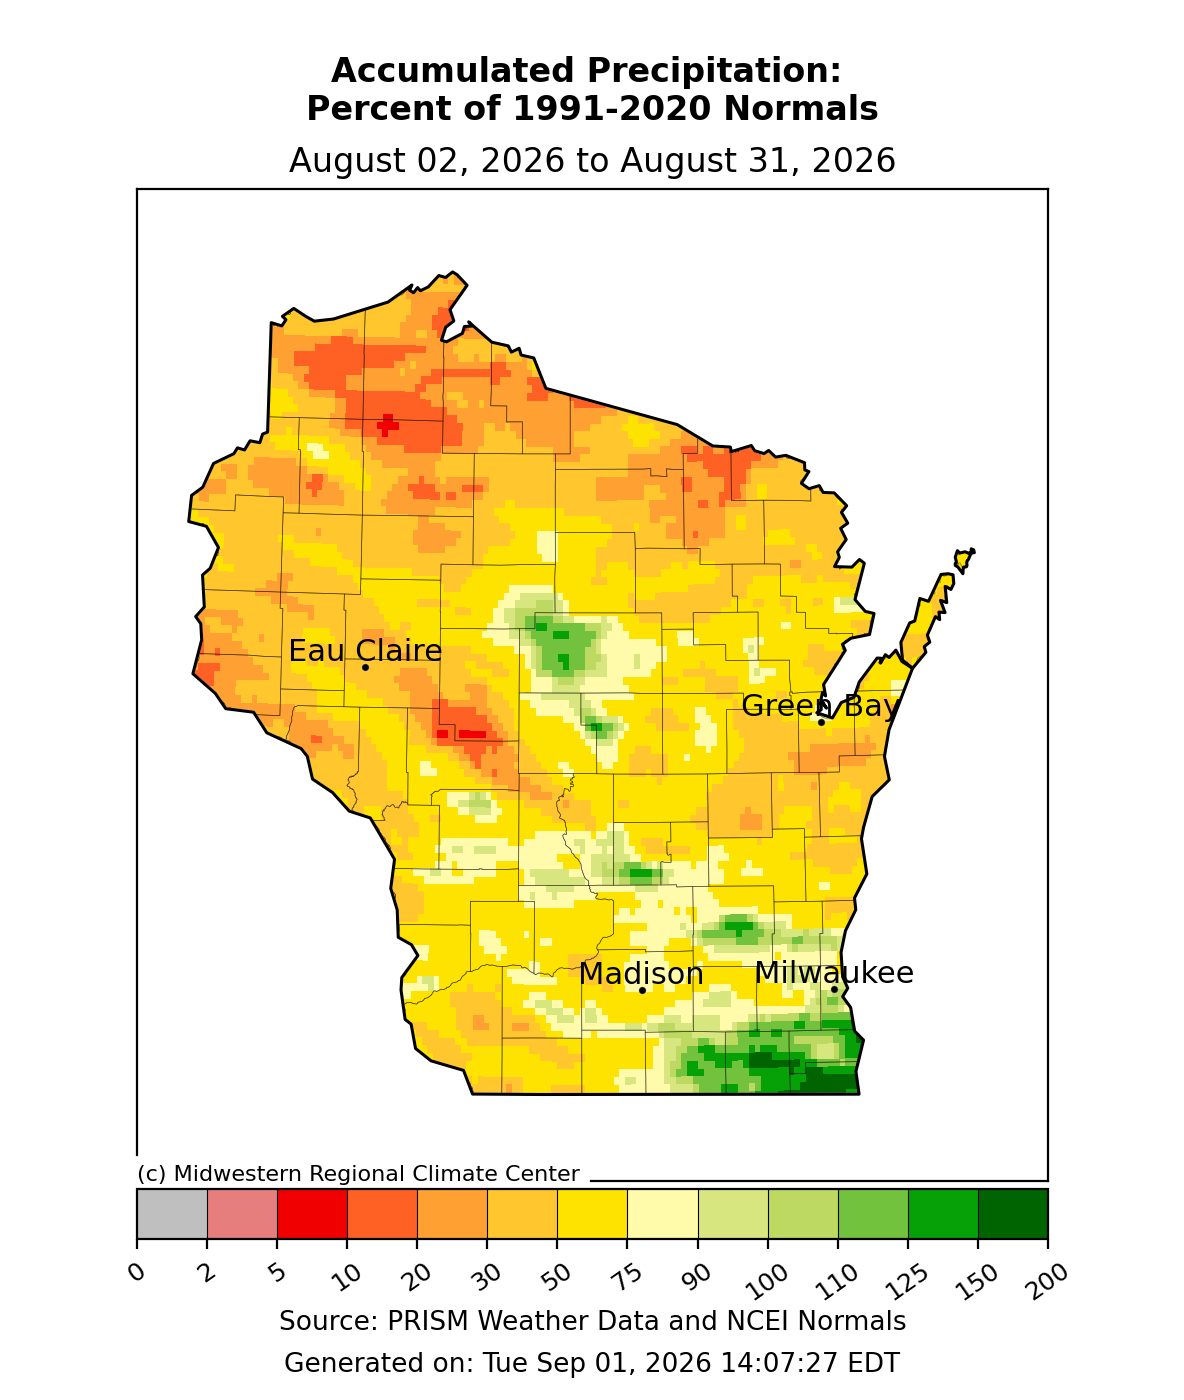
Image Description ↓
This map generated by the Midwestern Regional Climate Center displays accumulated precipitation across Wisconsin counties from August 2, 2026, to August 31, 2026, measured as a percentage of 1991 to 2020 normal levels. Most northern and central counties show below-normal precipitation between 20 percent and 75 percent, indicated by orange and yellow shading. Southern and southeastern regions, including areas near Madison and Milwaukee, received normal to above-normal precipitation, with pockets reaching 100 percent to 200 percent rendered in light and dark green. Key cities labeled include Eau Claire, Green Bay, Madison, and Milwaukee. Source credit is given to PRISM Weather Data and NCEI Normals.
- Southeast counties have been the wettest over the past 30 days, with totals ranging from 3-5” for most, with localized areas with over 5”. These totals were 125-200% of normal.
- Totals across most of Wisconsin were ≤75% of normal. In central Wisconsin, totals were a bit higher (2-5”).
- Further north and west, totals were much less. Totals of 1.5” or less were common, which was 50% of normal or less.
90 Day Precipitation Total and Percent of Normals
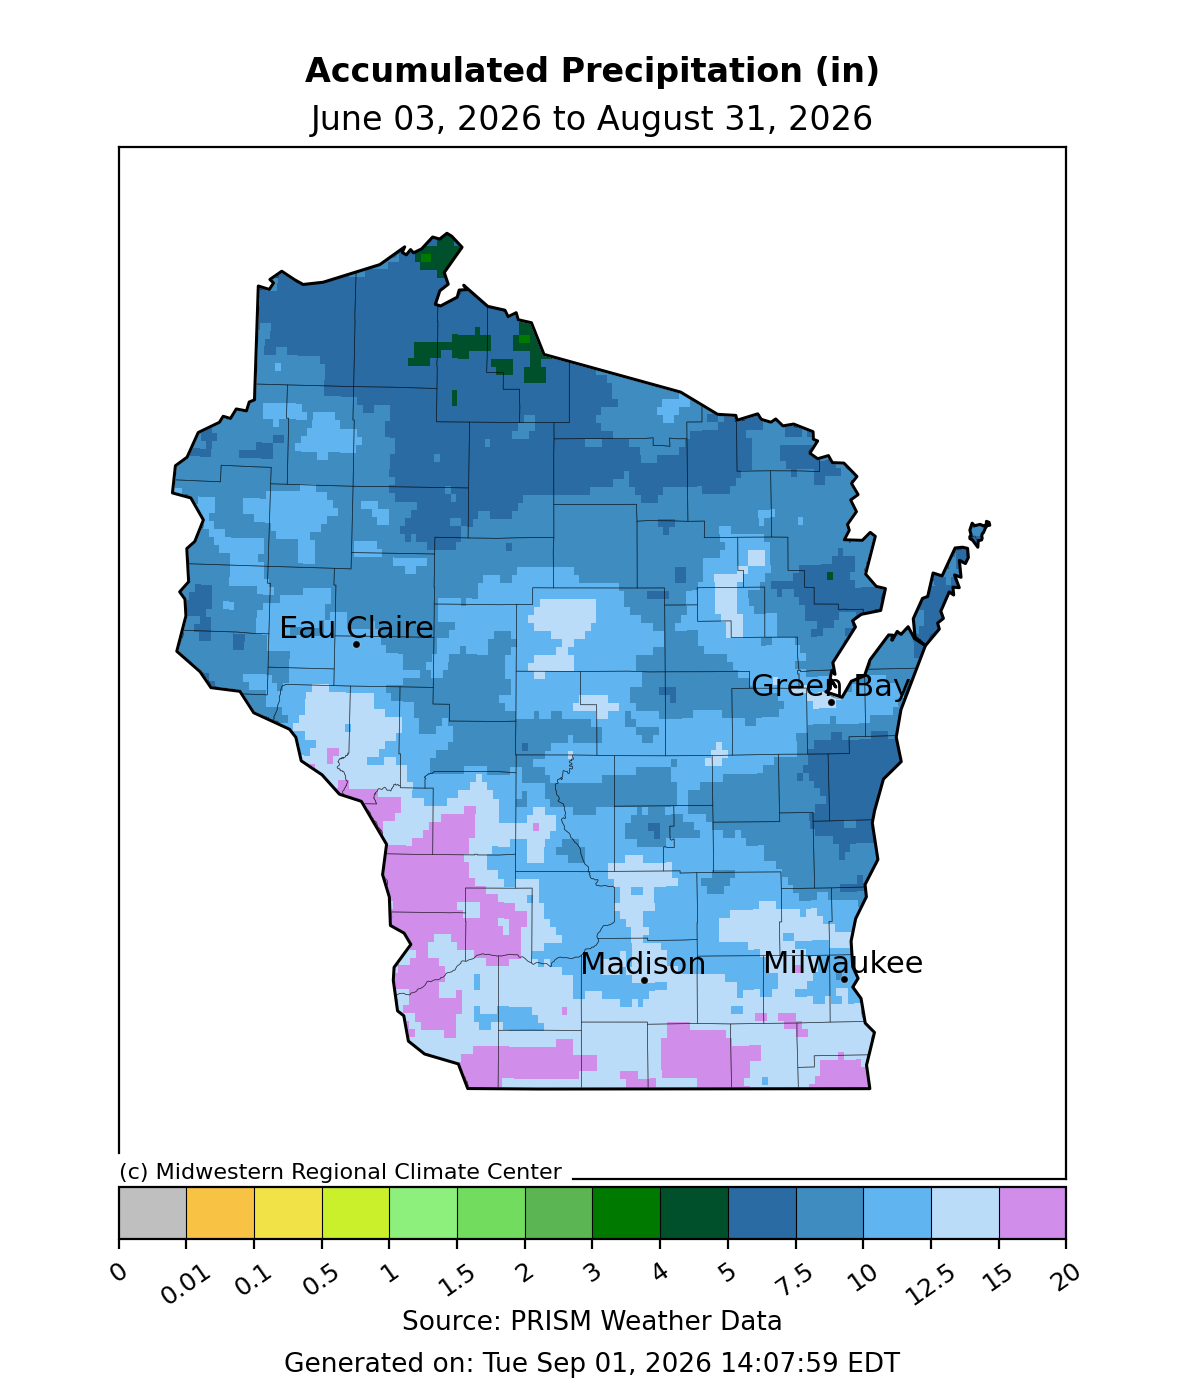
Image Description ↓
This map from the Midwestern Regional Climate Center displays total accumulated rainfall in inches across Wisconsin between June 3, 2026, and August 31, 2026. Legend values range from 0 to 20 inches. Northern counties mostly received between 4 and 7.5 inches, shown in dark green and dark blue. Central and eastern areas, including Eau Claire, Green Bay, and Milwaukee, saw 7.5 to 12.5 inches in light blue. Southwestern counties around Madison received the highest totals, ranging from 12.5 to 20 inches, shaded in pinkish-purple.
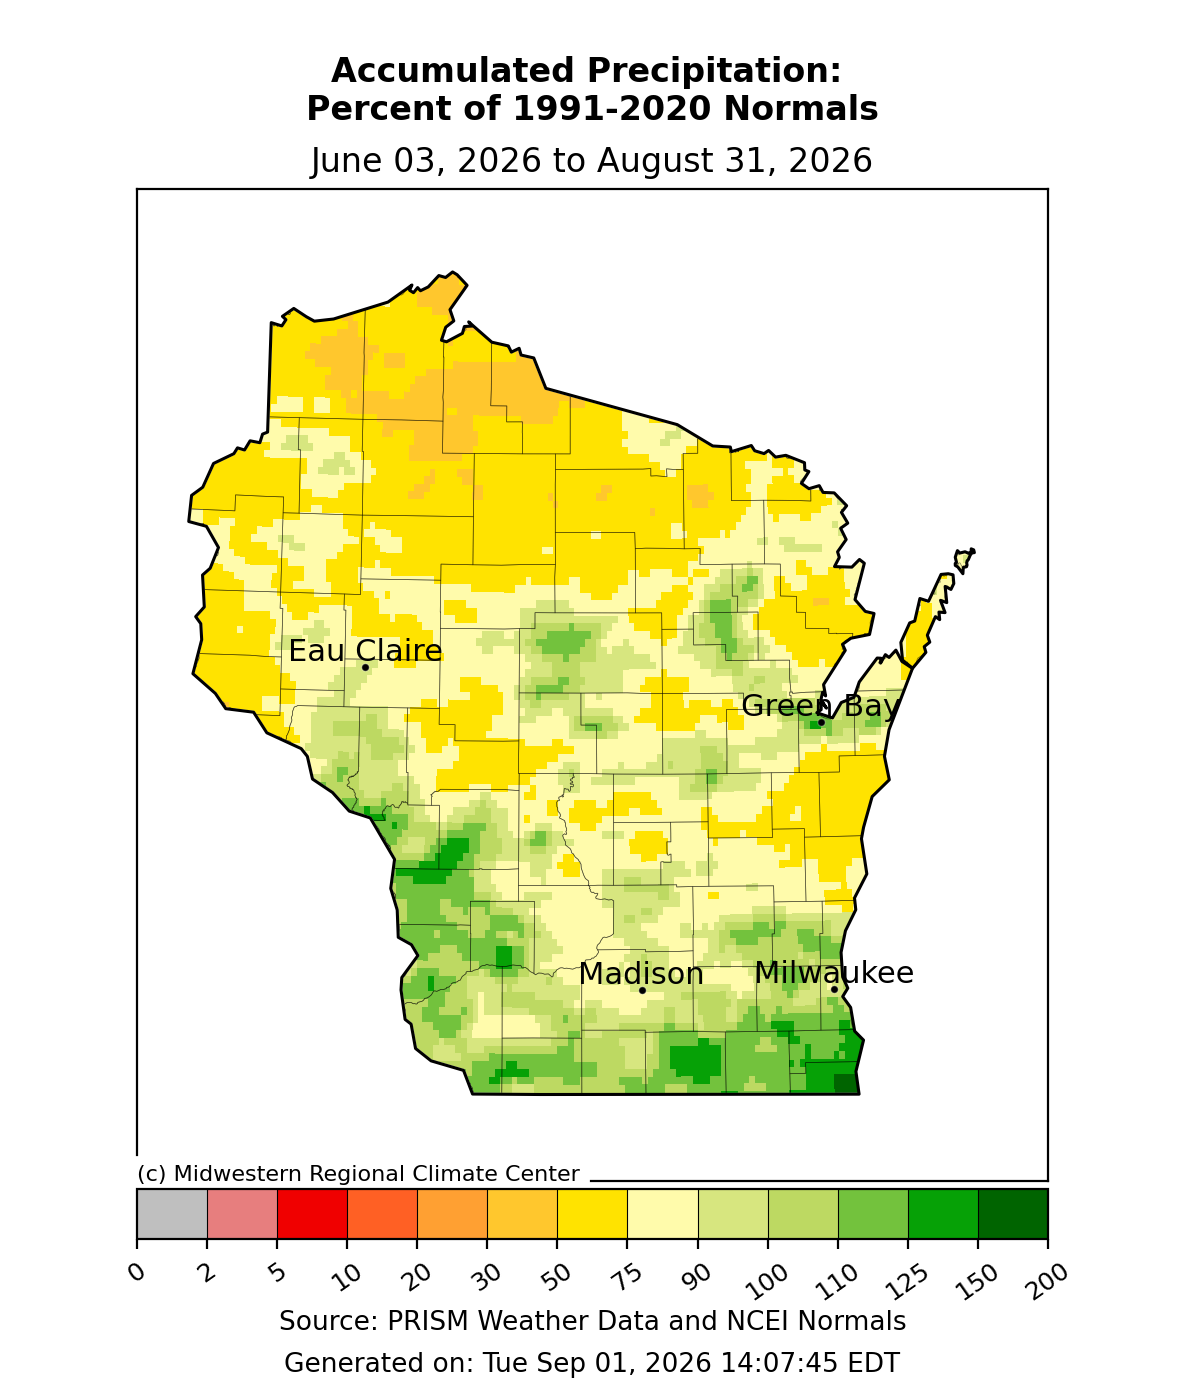
Image Description ↓
A regional map created by the Midwestern Regional Climate Center showing Wisconsin accumulated precipitation relative to 1991-2020 normal values for the period from June 3, 2026, to August 31, 2026. Northern regions display mostly below-normal values ranging from 50 percent to 75 percent, marked in yellow. Central and southern regions display normal to above-normal percentages ranging from 90 percent to 150 percent, shaded in light to dark green, particularly southwest of Madison. Labeled cities include Eau Claire, Green Bay, Madison, and Milwaukee.
- Totals were highest in the southwest and southern counties (12.5-20”). These totals were near to normal.
- Totals across most of Wisconsin were below normal, with totals commonly between 50-90% of normal.
- Northern counties were the driest, with most locations receiving totals that were at or below 50% of normal.
2026 Precipitation
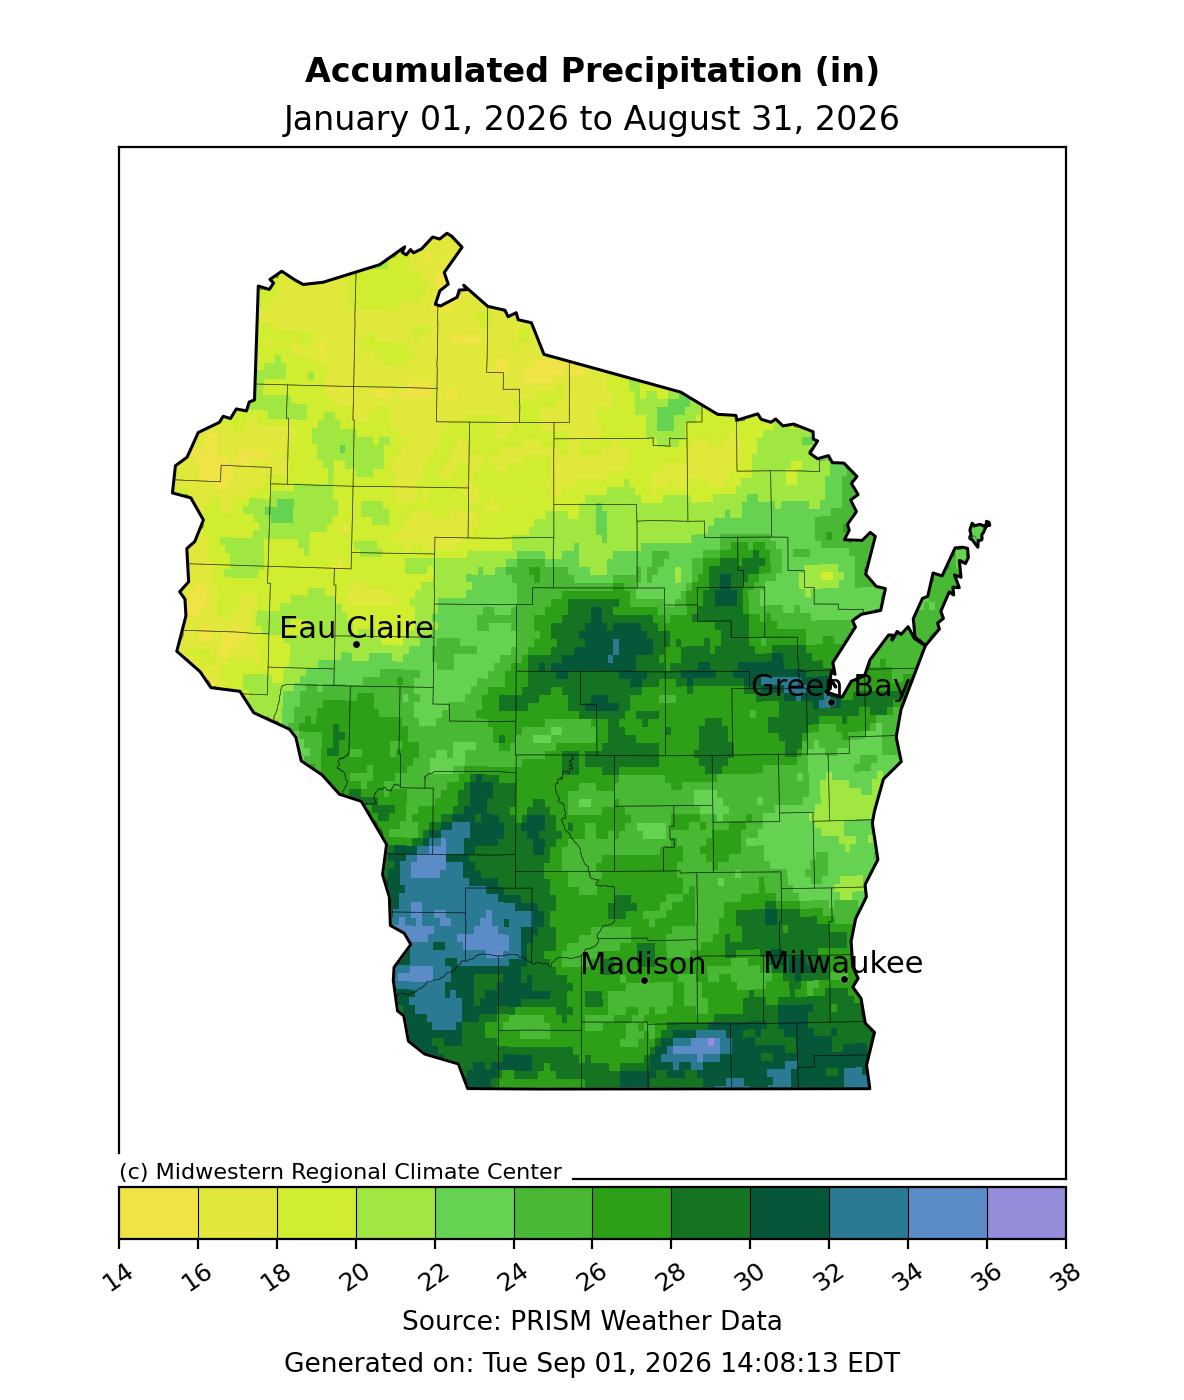
Image Description ↓
This Midwestern Regional Climate Center map shows total accumulated precipitation across Wisconsin counties from January 1, 2026, through August 31, 2026. Northern counties recorded the lowest totals, between 18 and 24 inches, represented by yellow and light green shading. Central regions recorded 24 to 30 inches in green. Southwestern and southern regions, near Madison and Milwaukee, recorded the highest accumulation levels between 30 and 36 inches, shaded in dark green and blue.
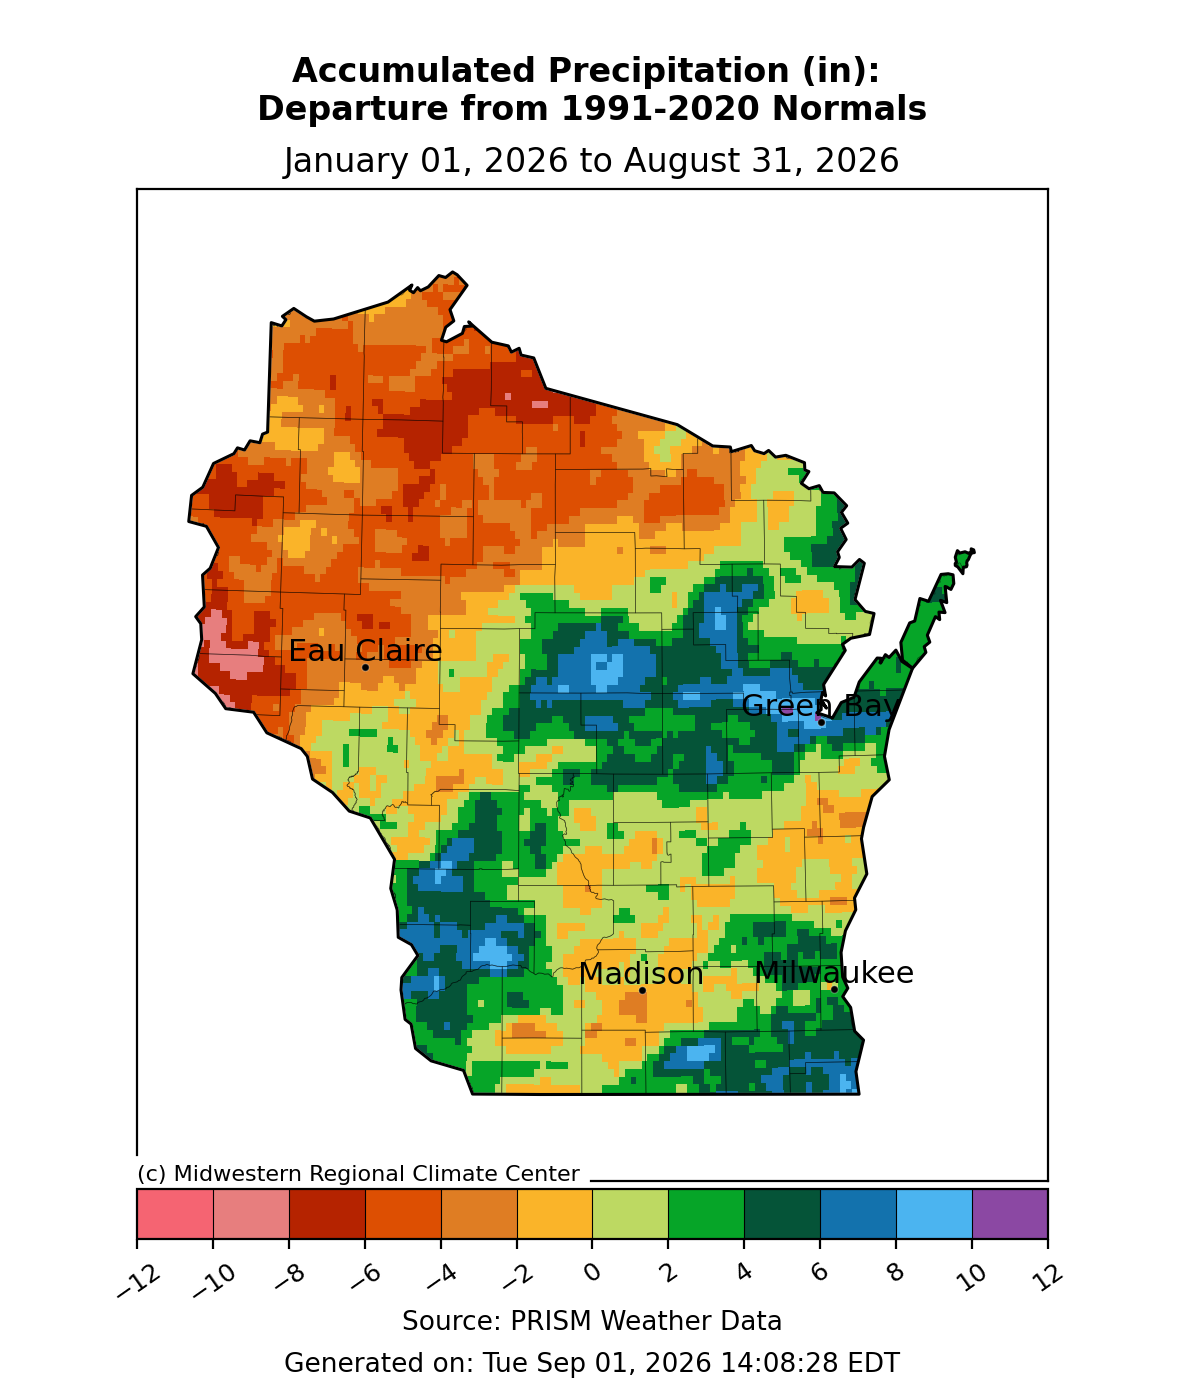
Image Description ↓
A map from the Midwestern Regional Climate Center depicting departure from 1991-2020 normal precipitation levels in inches across Wisconsin between January 1, 2026, and August 31, 2026. Northern and northwestern counties show precipitation deficits between 4 and 10 inches below normal, represented in dark orange and red. Central, southern, and eastern portions, including Madison, Milwaukee, and Green Bay, exhibit precipitation surpluses ranging from 2 to 8 inches above normal, shaded in green and dark blue.
Soil Moisture and Temperature Trends
Soil Moisture Models
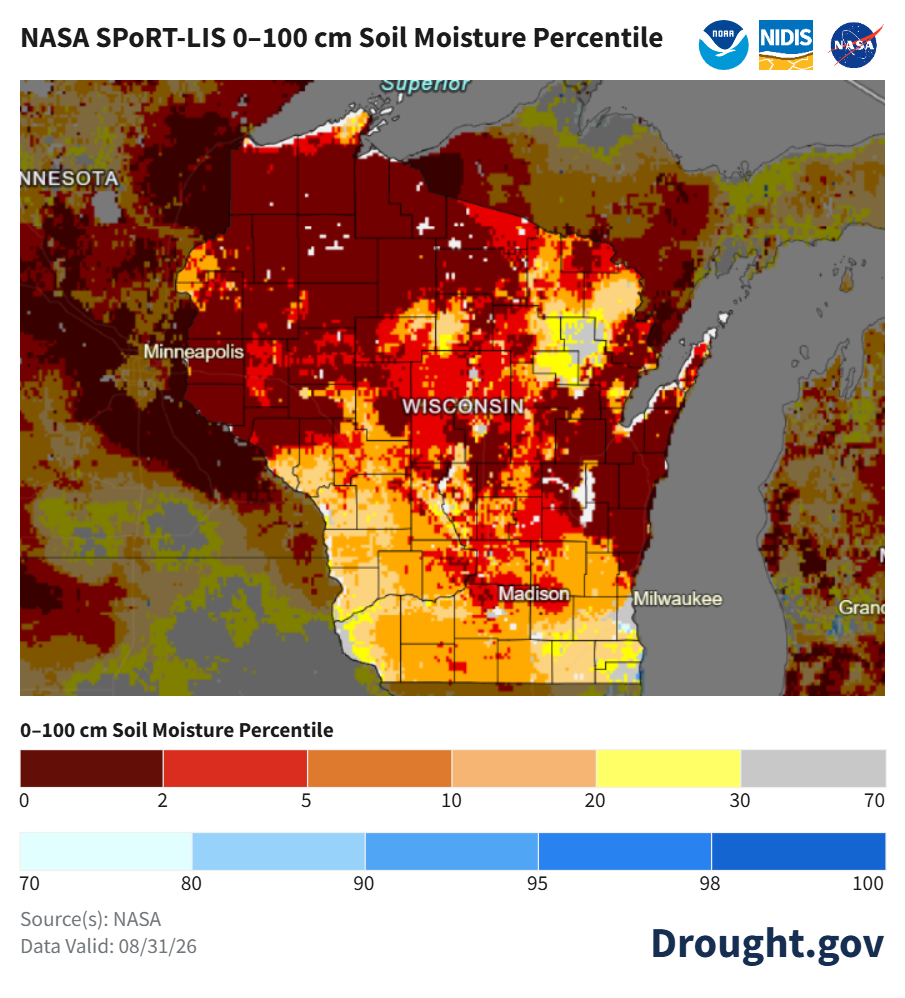
Image Description ↓
A NASA SPoRT-LIS soil moisture percentile map for Wisconsin, valid August 31, 2026. Dark red and bright red shading dominates northern, western, and eastern Wisconsin, marking soil moisture percentiles below 2. Central and southern areas display yellow and light orange shading, corresponding to percentiles between 10 and 30. A legend at the bottom maps colors to percentiles from 0 to 100, while source logos for NOAA, NIDIS, and NASA appear at the top right.
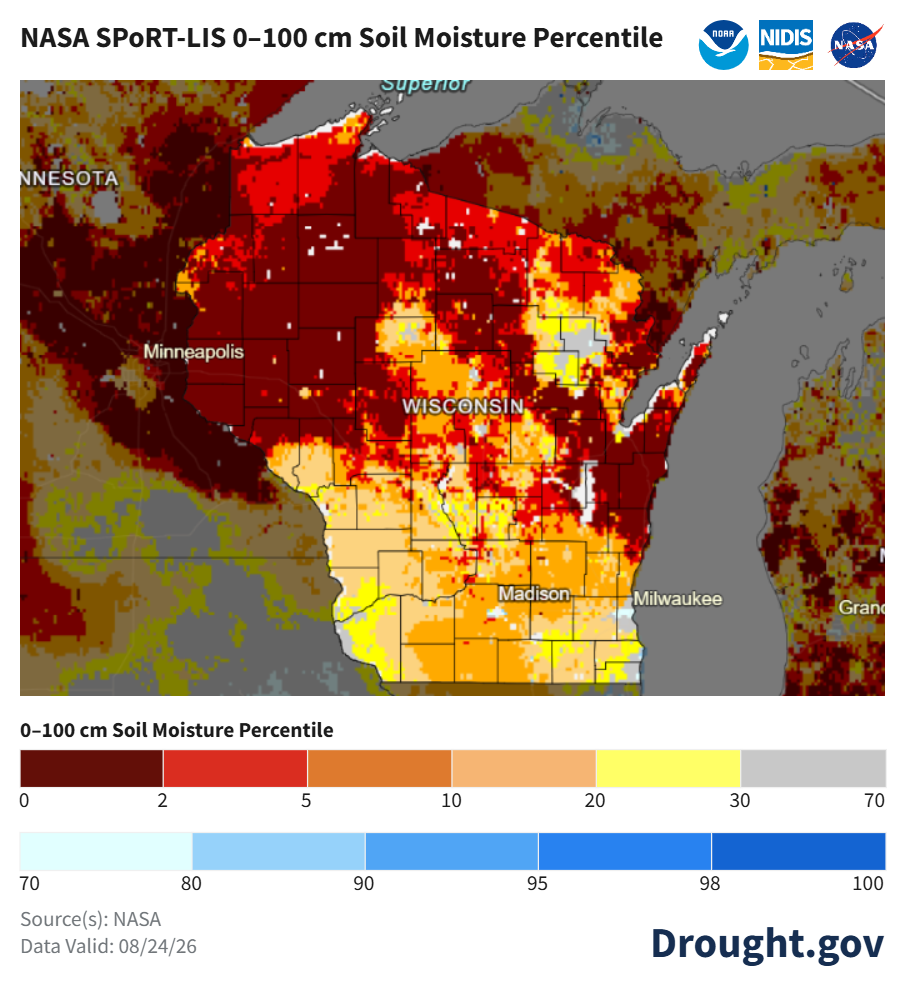
Image Description ↓
soil moisture map from NASA SPoRT-LIS and Drought.gov covering Wisconsin, valid August 24, 2026. The 0 to 100 centimeter soil moisture percentiles are depicted using color-coded shading. Most of the state, especially northern, central, and eastern regions, is shaded in dark red and orange, indicating low soil moisture percentiles below 5. Southern Wisconsin displays slightly higher moisture levels with yellow and light brown shades representing the 10 to 30 percentile range.
- Satellite-based soil moisture estimates indicate that severe dryness is common across northwest, north-central, and east-central counties.
- These estimates also indicate that dryness worsened in southern counties.
- Notes on how to interpret the maps:
- Red areas = top 5 driest in 100 years.
- Dark red areas = top 2 driest in 100 years.
- Dark blue areas = top 2 wettest in 100 years.
Wisconet Soil Moisture
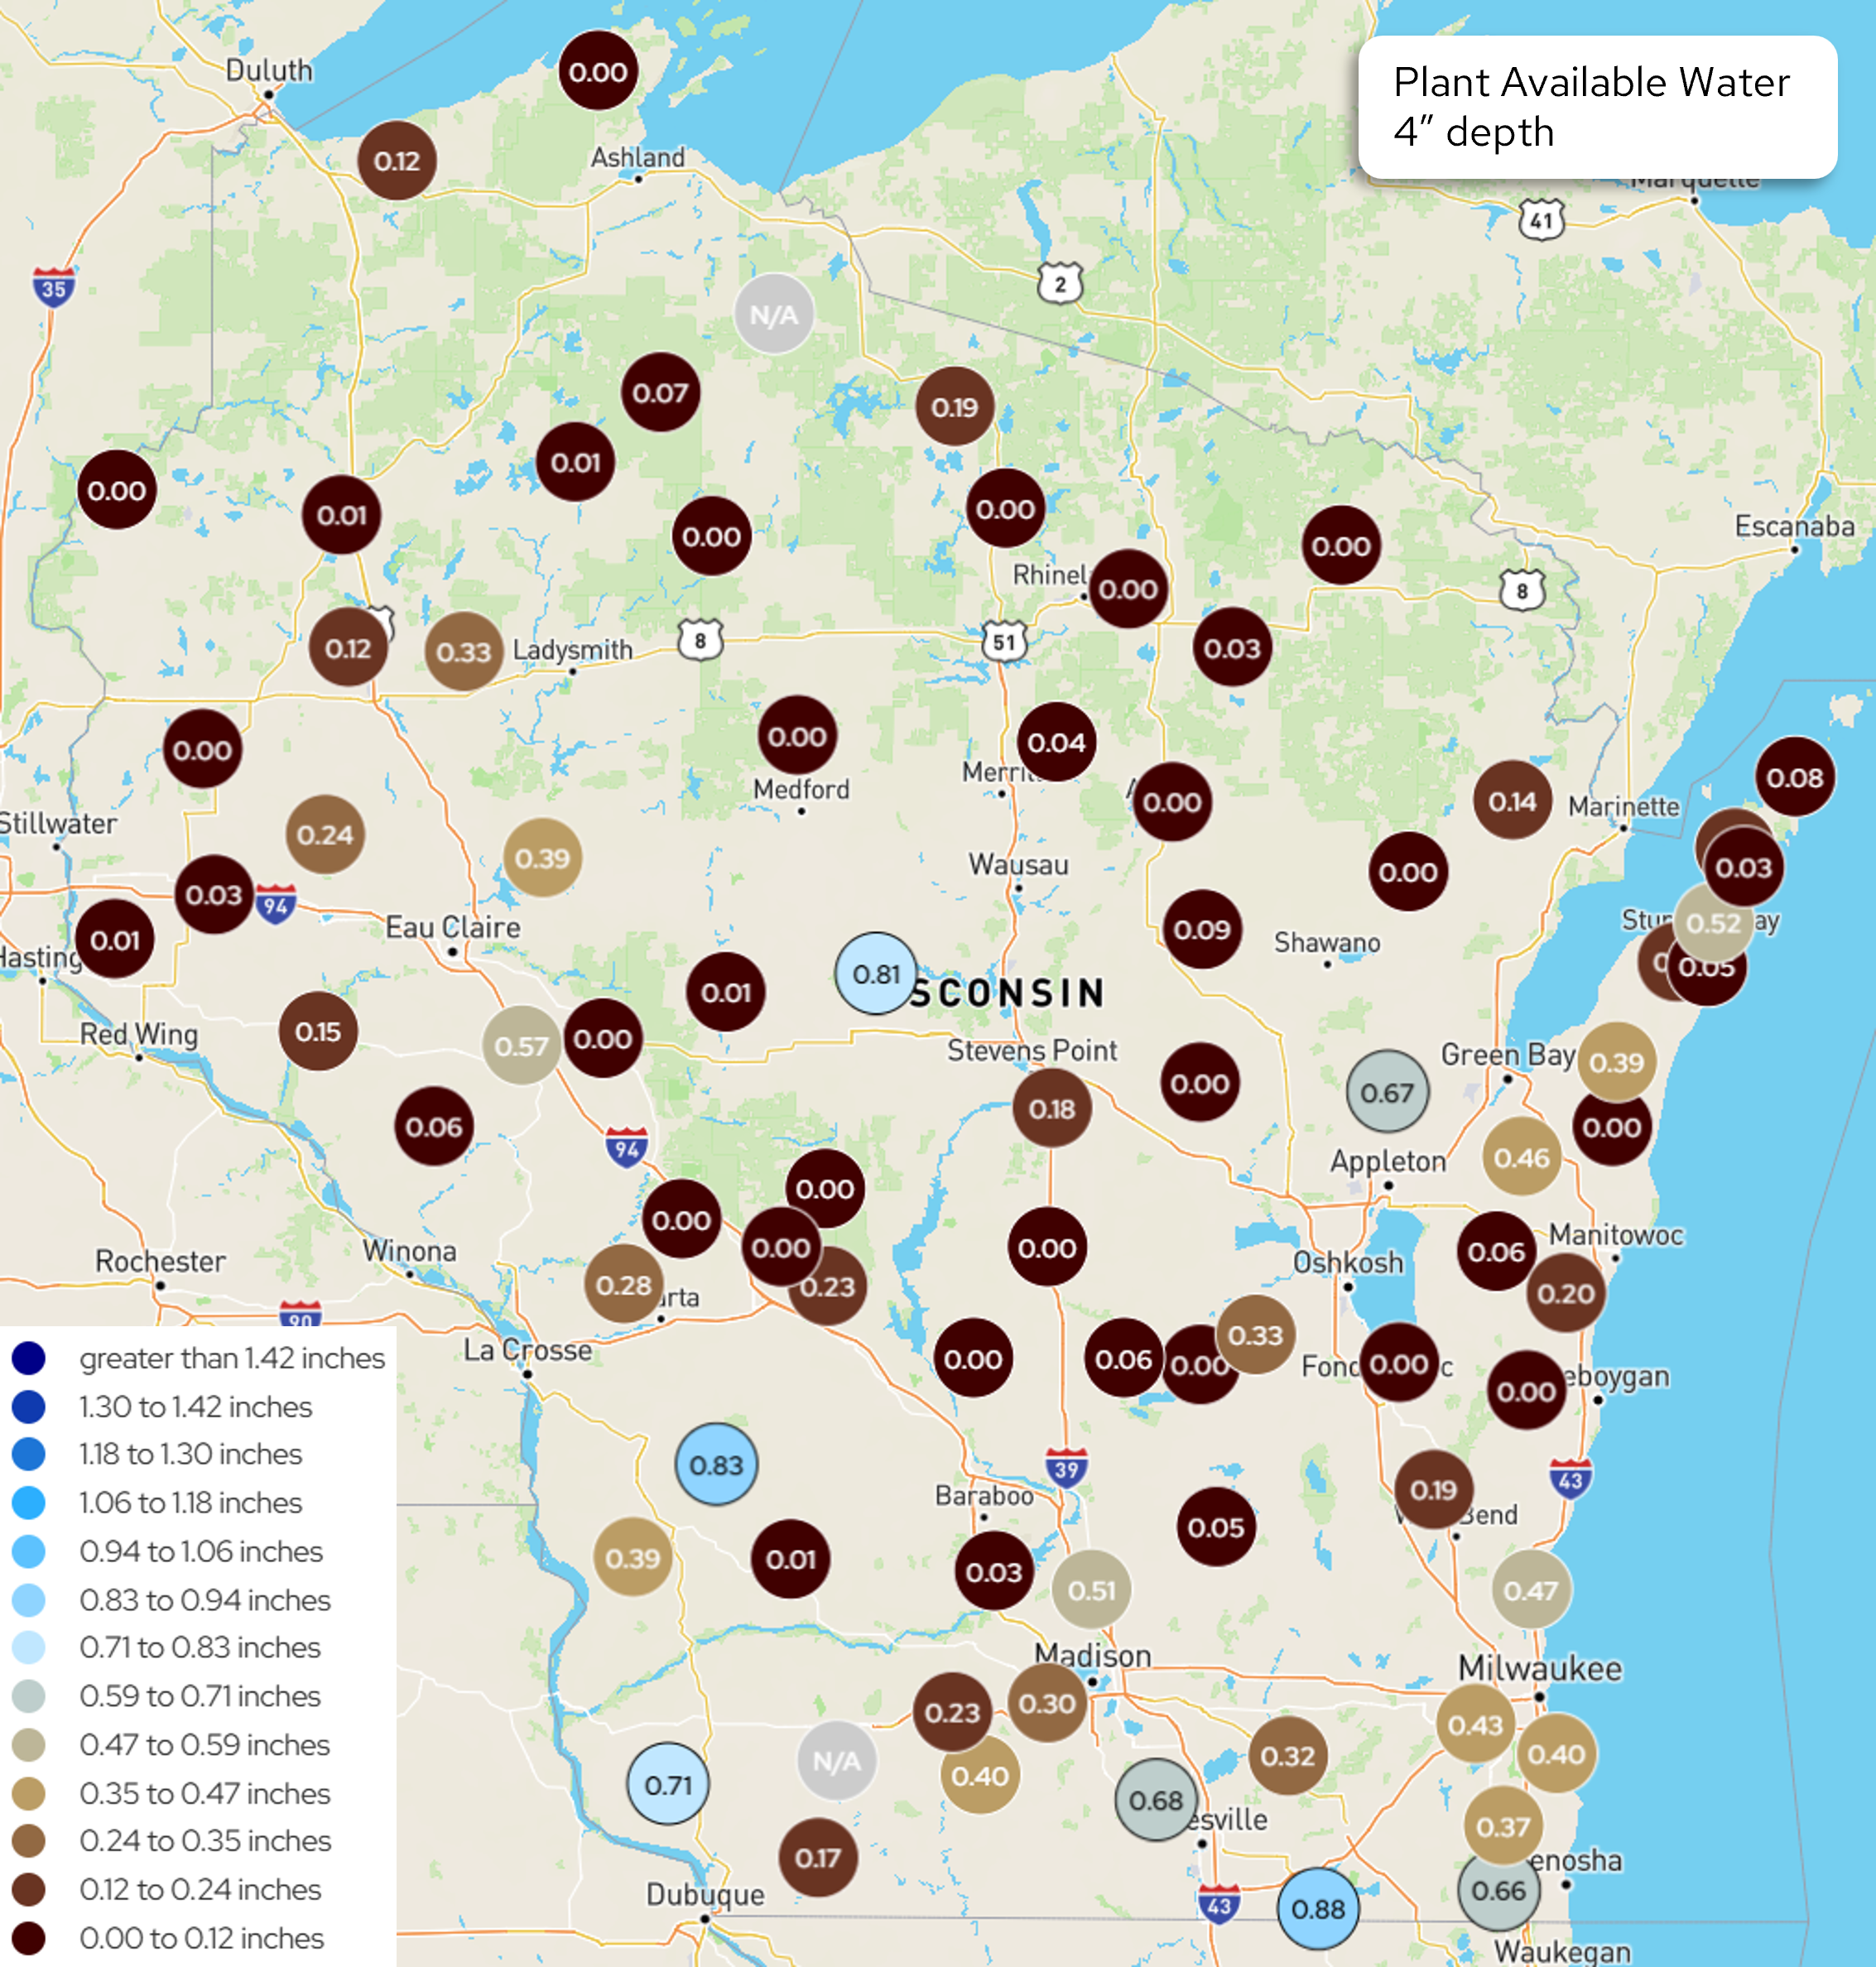
Image Description ↓
A Wisconet station map displaying plant available water measurements in inches at a 4-inch depth across Wisconsin. Individual station values appear inside circular color-coded markers scattered across the state. Most locations display dark brown circles with low values ranging from 0.00 to 0.24 inches, particularly across central, northern, and eastern counties. Select locations in southwestern and south-central Wisconsin show higher values represented by light blue circles, such as 0.83 and 0.81 inches.
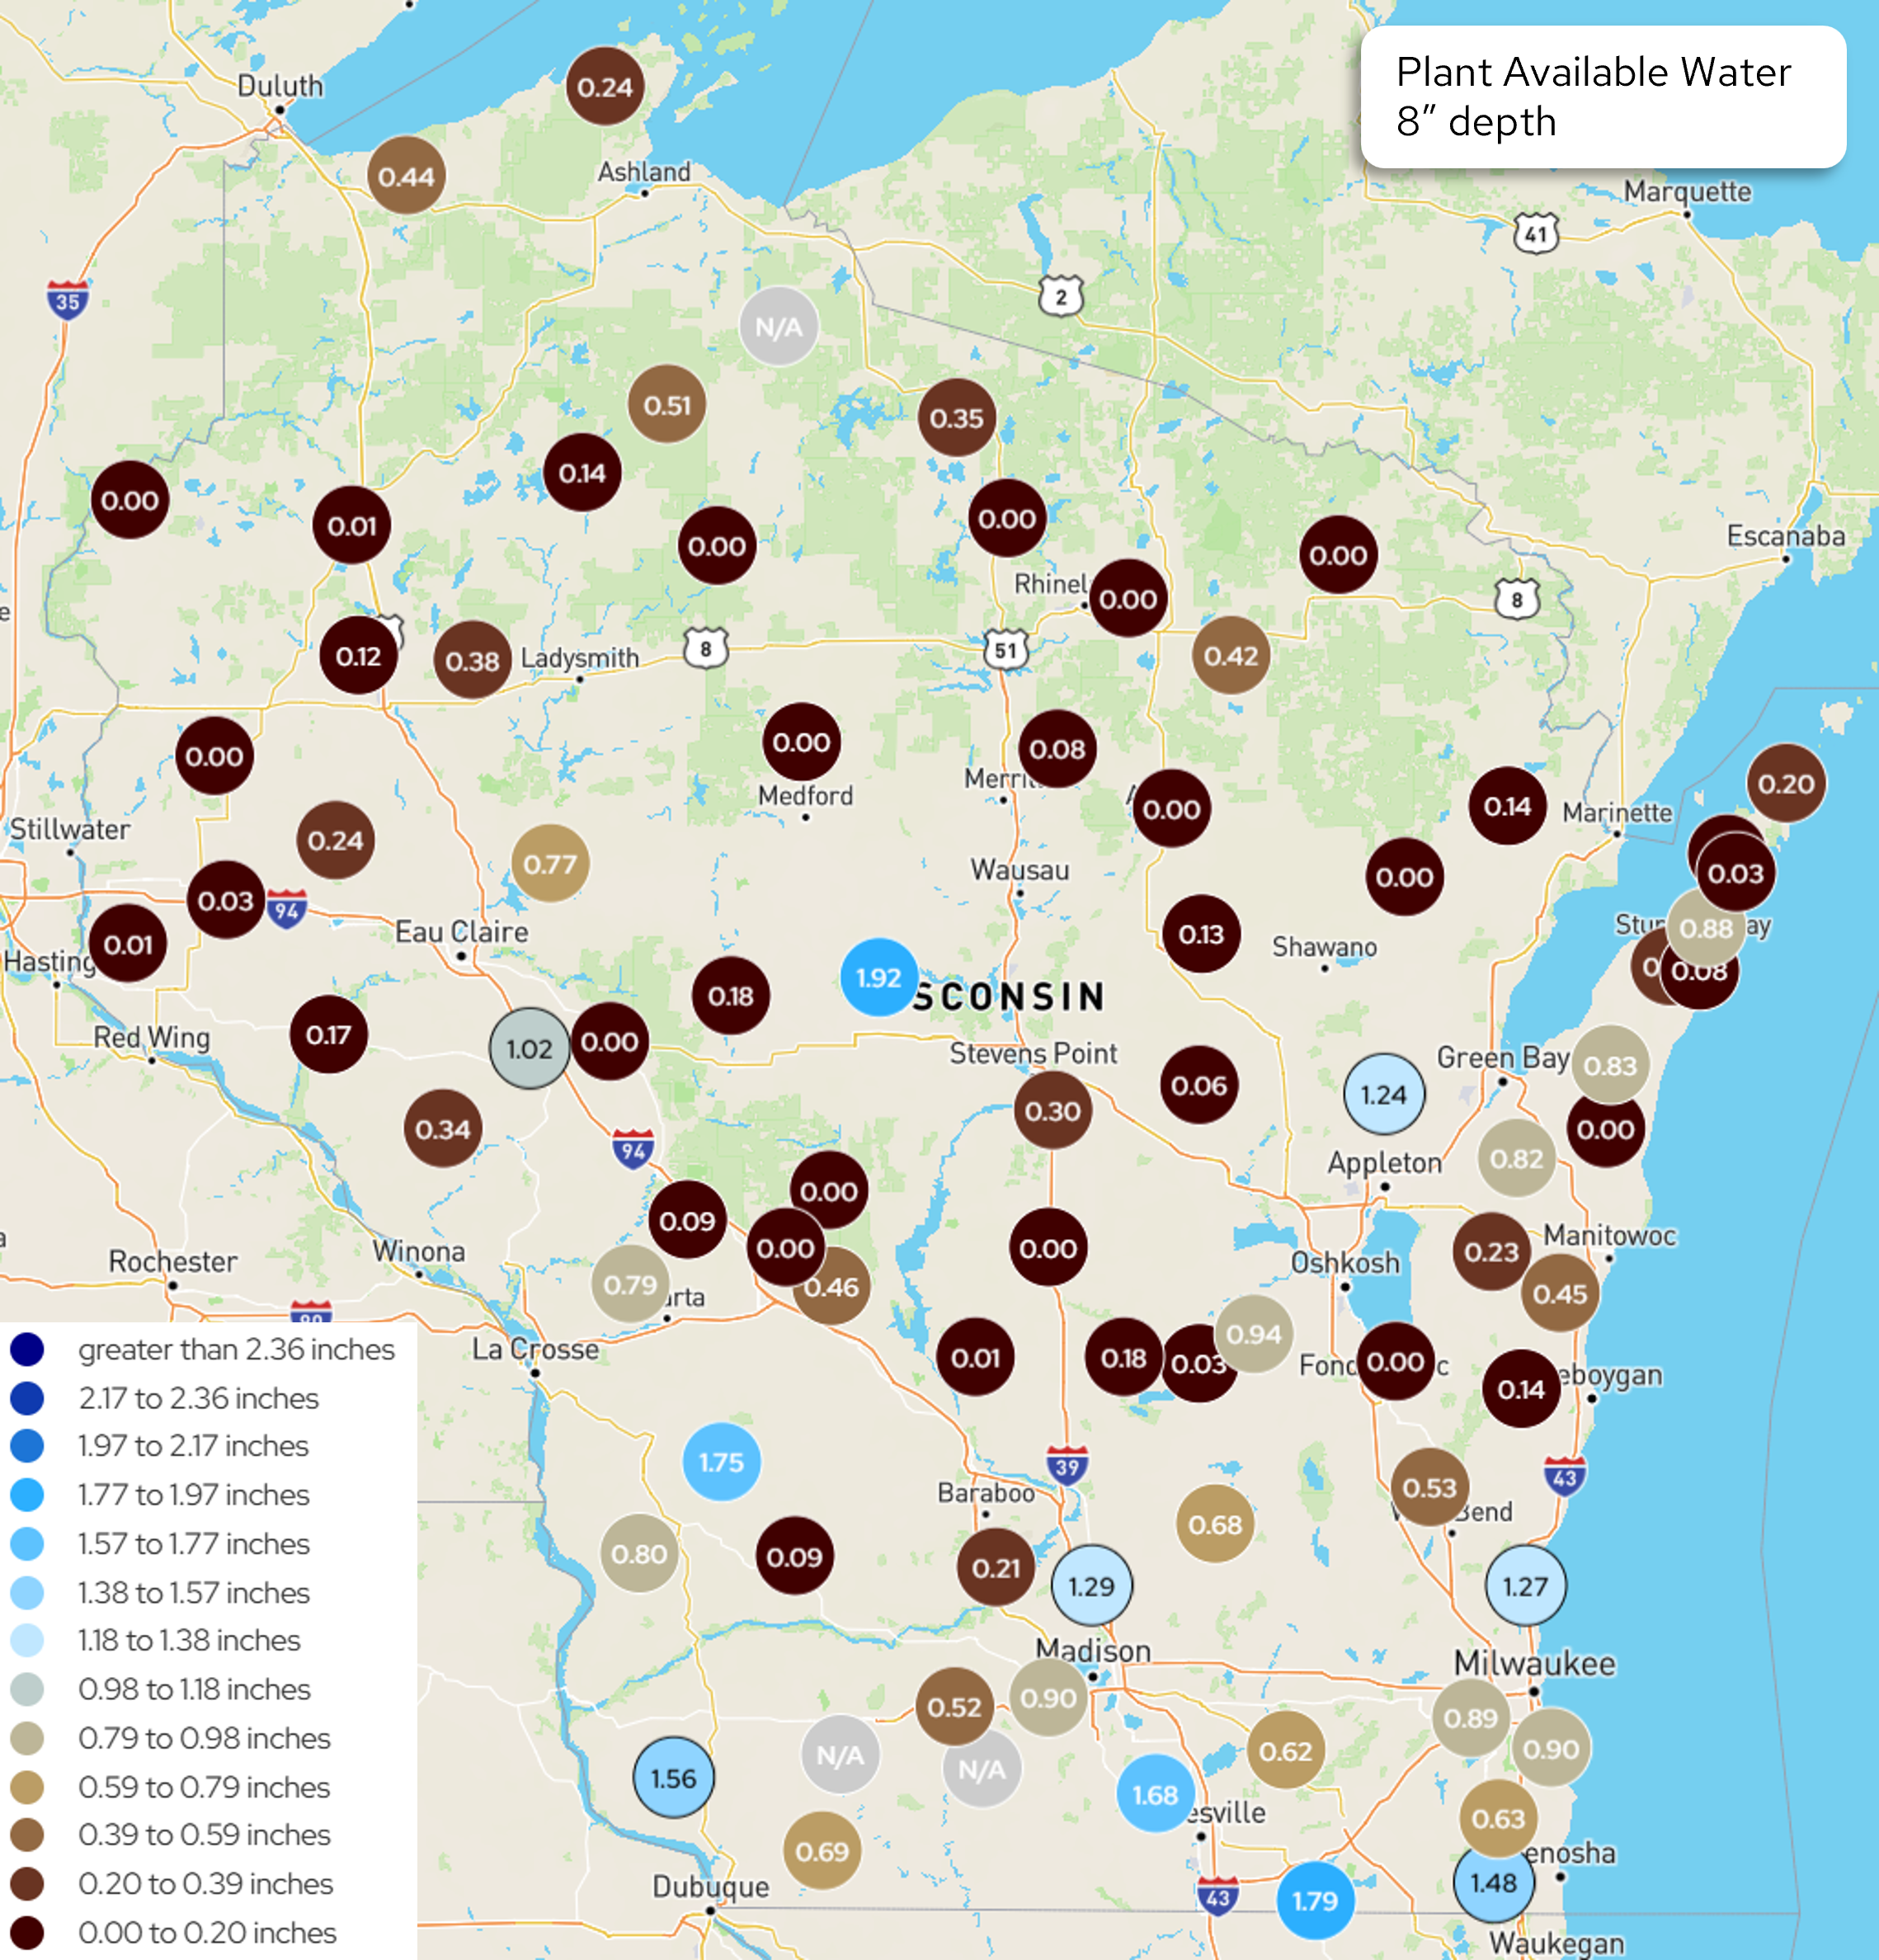
Image Description ↓
A Wisconet weather network map showing plant available water levels at an 8-inch soil depth throughout Wisconsin. Measurement stations are marked with colored circles containing numeric readings in inches. Many central and northern stations show dry soil with values between 0.00 and 0.38 inches marked in dark brown. A cluster of stations in western, southern, and eastern Wisconsin exhibit higher moisture levels, including readings of 1.75 inches near La Crosse, 1.92 inches near Stevens Point, and 1.79 inches in the far southeast.
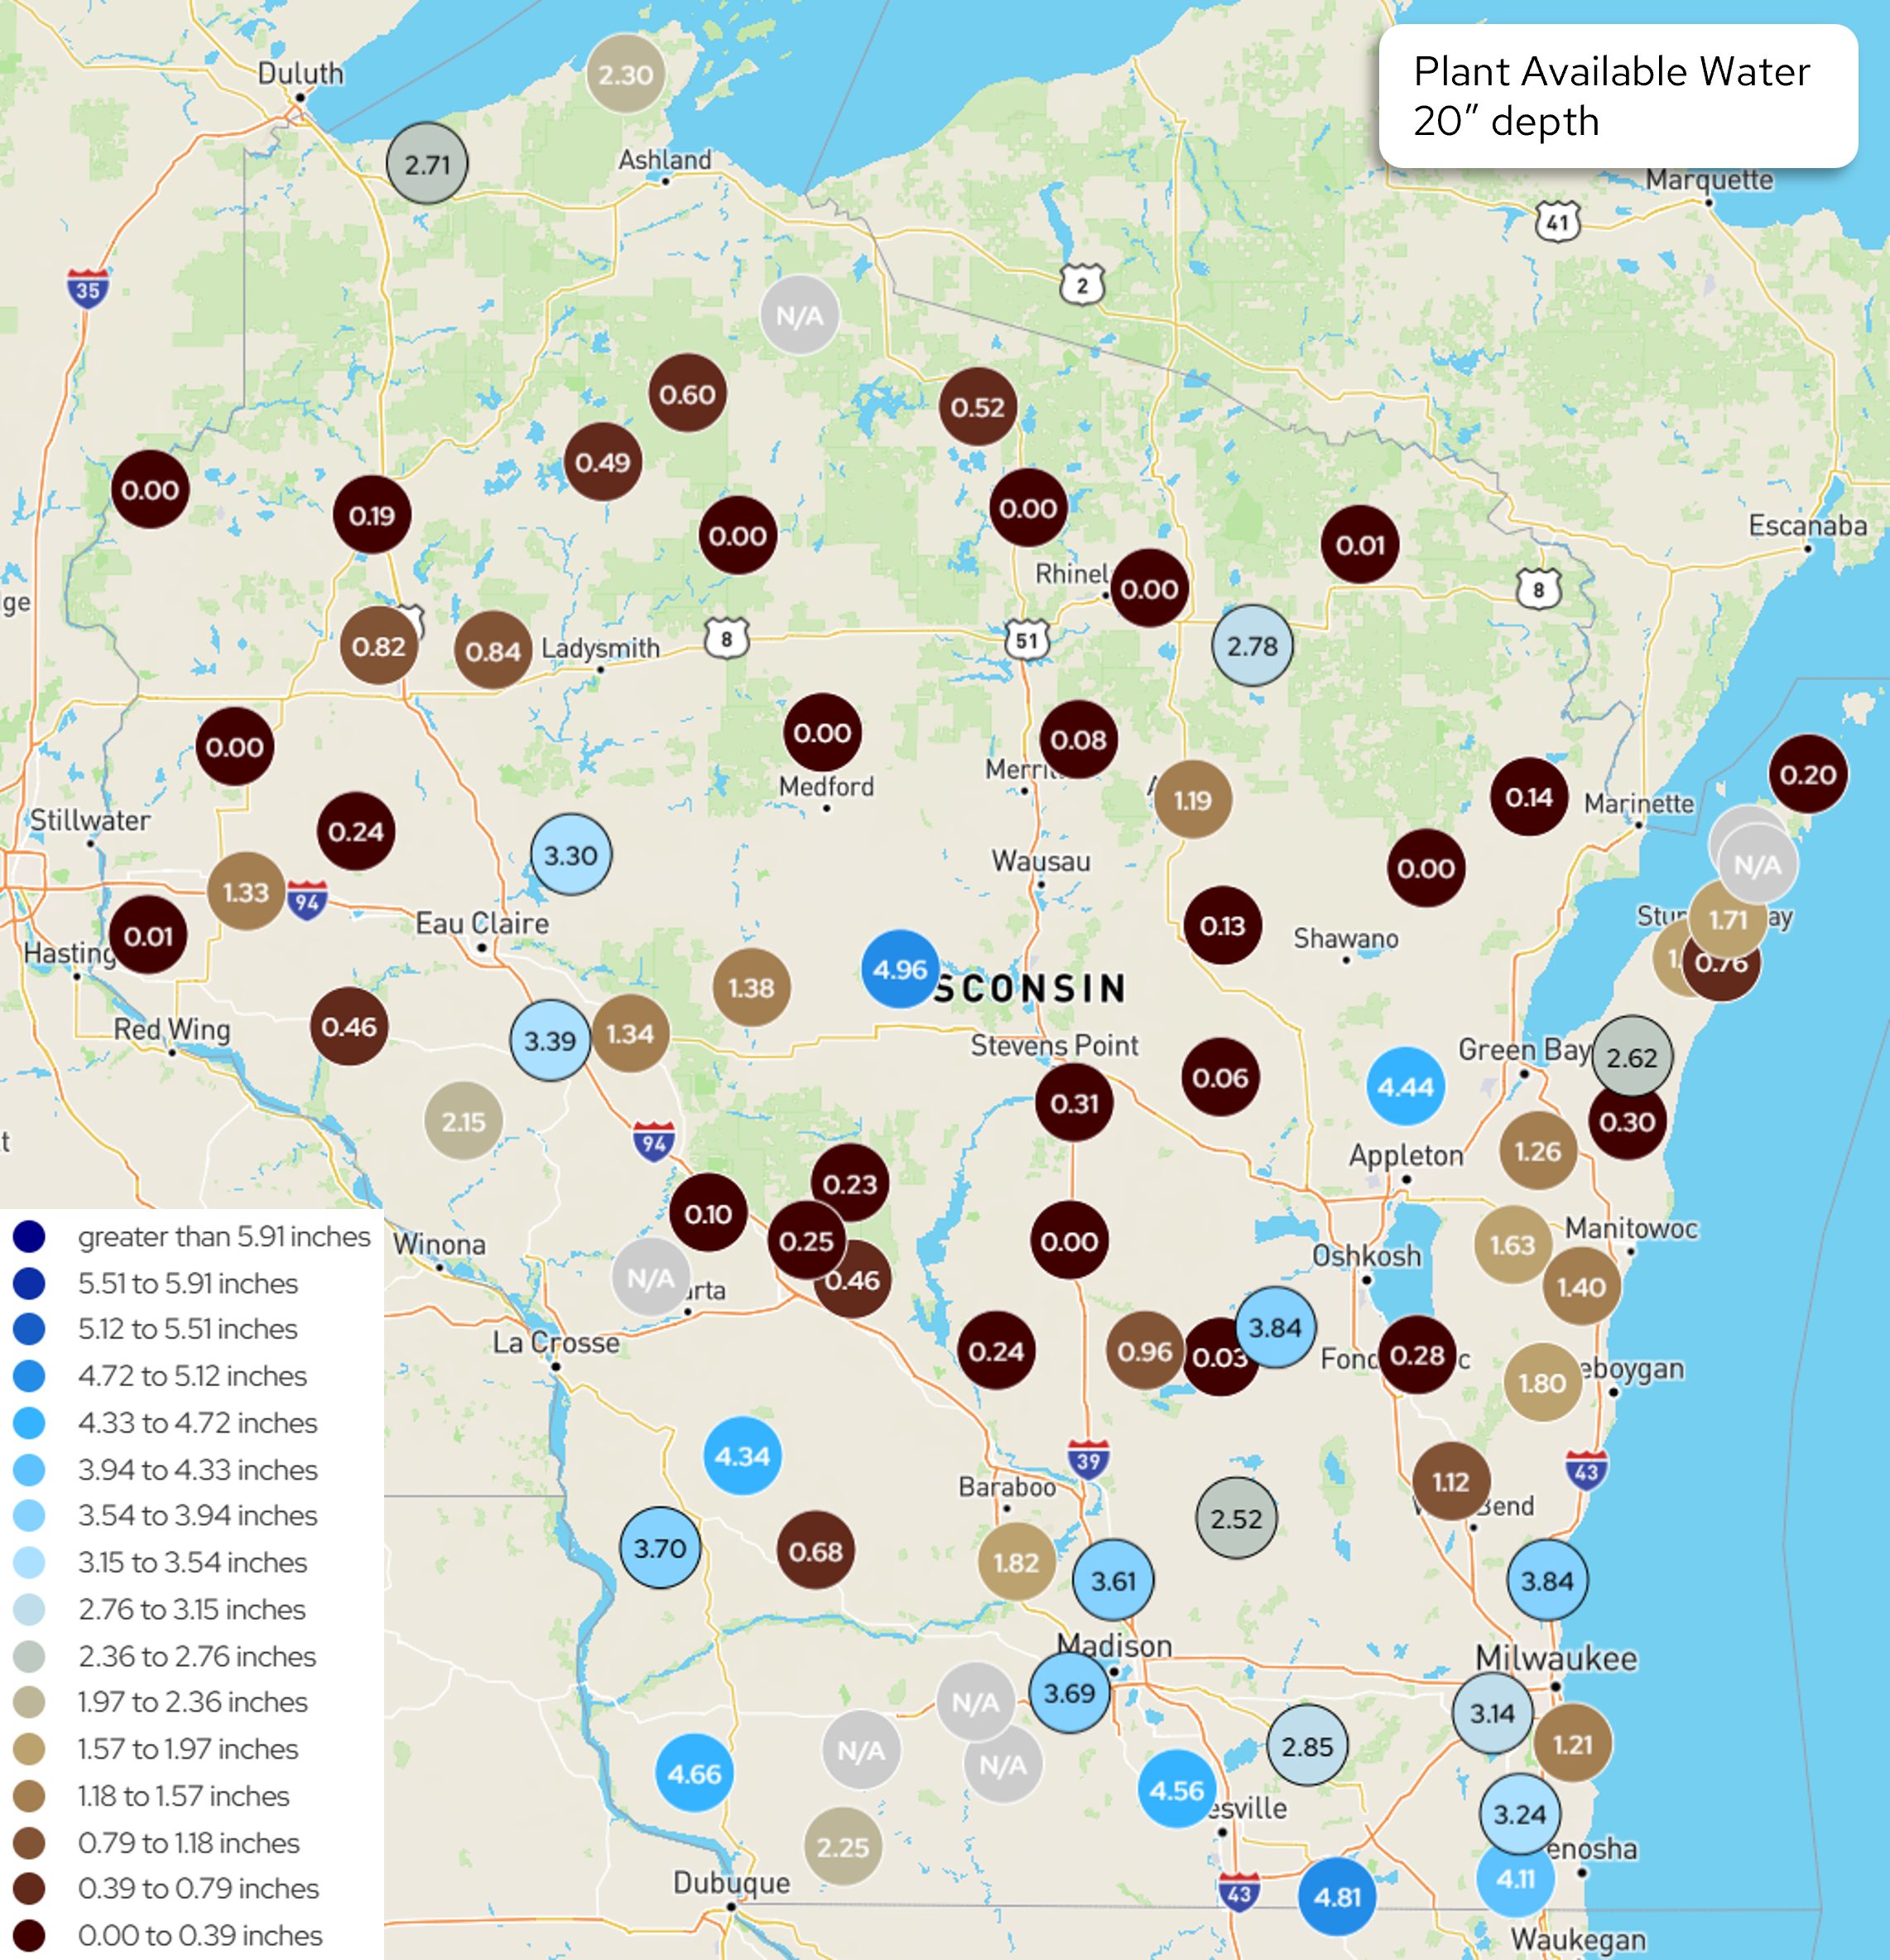
Image Description ↓
A statewide map from Wisconet plotting plant available water at a 20-inch depth across Wisconsin research stations. Circles over each station indicate measured soil water in inches, color-coded by amount. Higher water amounts above 3.00 inches appear in light blue circles across southern, south-central, and west-central Wisconsin, reaching a maximum of 4.96 inches near Stevens Point. Northern and east-central regions feature lower subsoil water values, with several stations reading between 0.00 and 0.80 inches.
- For Wisconet stations included in the chart and table, most saw decreased soil moisture from last week’s report. Most stations received less than a half inch of rain, but Osseo and Rice Lake saw soil moisture gains with higher amounts of rain (0.7-1.0”).
- Stations included in the chart and table that are currently in D1 drought are Hancock (Waushara), Marshfield (Marathon), Osseo (Trempealeau), Suring (Oconto), and Brillion (Calumet).
- Stations included in the chart and table that are currently in D2 drought are River Falls (Pierce) and Rice Lake (Barron). Plant available water (down to 8 inches deep) is less than 0.1 inches at these stations.
- The maps (above) show the daily average Wisconet plant available water (inches) on August 31st.
- The table (below) shows total precipitation and changes in plant available water from August 24th (Start) to August 31st (End).
- What is plant available water? To learn more, read this article from UW Extension Ag Water Quality on plant available water. There is also a webinar from UW Extension on soil water management that you can watch.
- Example: Imagine that you have 4 inches of soil in the bottom of a bucket. In that soil, there are 1.5 inches of plant available water. Therefore, if you removed the soil and left only the water available for plant roots to take up, you would have 1.5 inches of water in the bottom of the bucket.
- The wilting point is when plant available water is at 0 inches, and the plant can no longer access water at that depth in the soil.
| Wisconet Station | County | Total Precipitation (in.) | 4″ Start | 4″ End | 8″ Start | 8″ End | 20″ Start | 20″ End |
|---|---|---|---|---|---|---|---|---|
| Arlington | Columbia | 0.04 | 0.79 | 0.51 | 1.57 | 1.29 | 3.89 | 3.61 |
| Brillion | Calumet | 0.01 | 0.16 | 0.06 | 0.37 | 0.23 | 1.77 | 1.63 |
| Hancock | Waushara | 0.06 | 0.02 | 0.00 | 0.09 | 0.00 | 0.23 | 0.00 |
| Lancaster | Grant | 0.20 | 0.91 | 0.71 | 1.91 | 1.56 | 5.01 | 4.66 |
| Marshfield | Marathon | 0.22 | 1.03 | 0.81 | 2.14 | 1.92 | 5.17 | 4.96 |
| Osseo | Trempealeau | 0.93 | 0.14 | 0.57 | 0.61 | 1.02 | 3.10 | 3.39 |
| Porter | Rock | 0.33 | 0.99 | 0.68 | 1.99 | 1.68 | 4.87 | 4.56 |
| Rice Lake | Barron | 0.73 | 0.00 | 0.12 | 0.00 | 0.12 | 0.83 | 0.82 |
| River Falls | Pierce | 0.32 | 0.00 | 0.01 | 0.00 | 0.01 | 0.00 | 0.01 |
| Suring | Oconto | 0.31 | 0.02 | 0.00 | 0.02 | 0.00 | 0.02 | 0.00 |
| Walworth | Walworth | 0.59 | 0.97 | 0.88 | 1.95 | 1.79 | 4.97 | 4.81 |
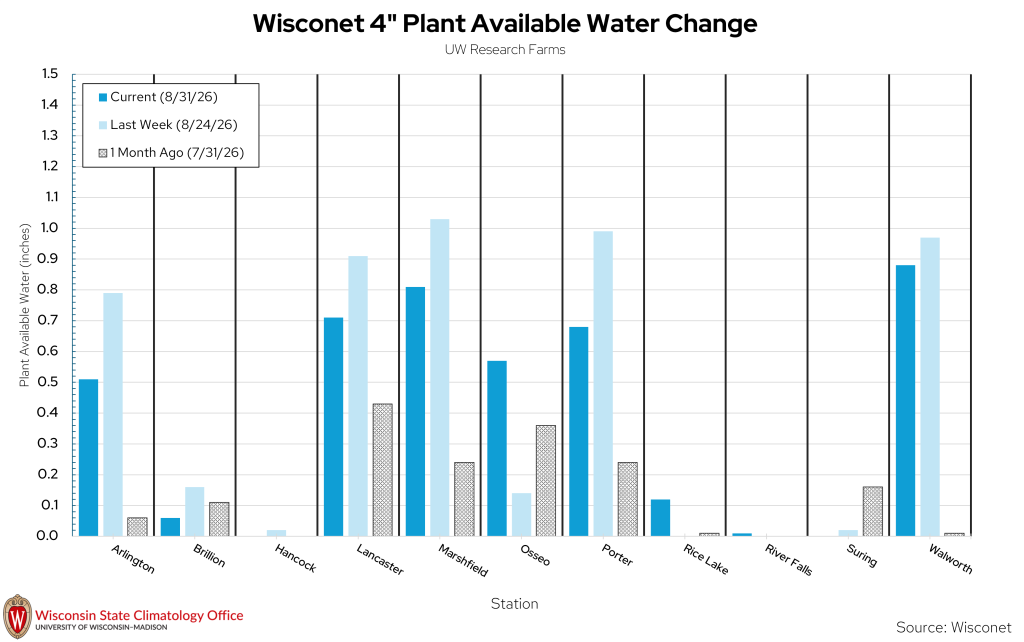
| Wisconet Station | Current 4″ Soil Moisture | Last Week’s 4″ Soil Moisture | 1 Month Ago 4″ Soil Moisture |
|---|---|---|---|
| Arlington | 0.51 | 0.79 | 0.06 |
| Brillion | 0.06 | 0.16 | 0.11 |
| Hancock | 0.00 | 0.02 | 0.00 |
| Lancaster | 0.71 | 0.91 | 0.43 |
| Marshfield | 0.81 | 1.03 | 0.24 |
| Osseo | 0.57 | 0.14 | 0.36 |
| Porter | 0.68 | 0.99 | 0.24 |
| Rice Lake | 0.12 | 0.00 | 0.01 |
| River Falls | 0.01 | 0.00 | 0.00 |
| Suring | 0.00 | 0.02 | 0.16 |
| Walworth | 0.88 | 0.97 | 0.01 |
USDA Soil Moisture Reports
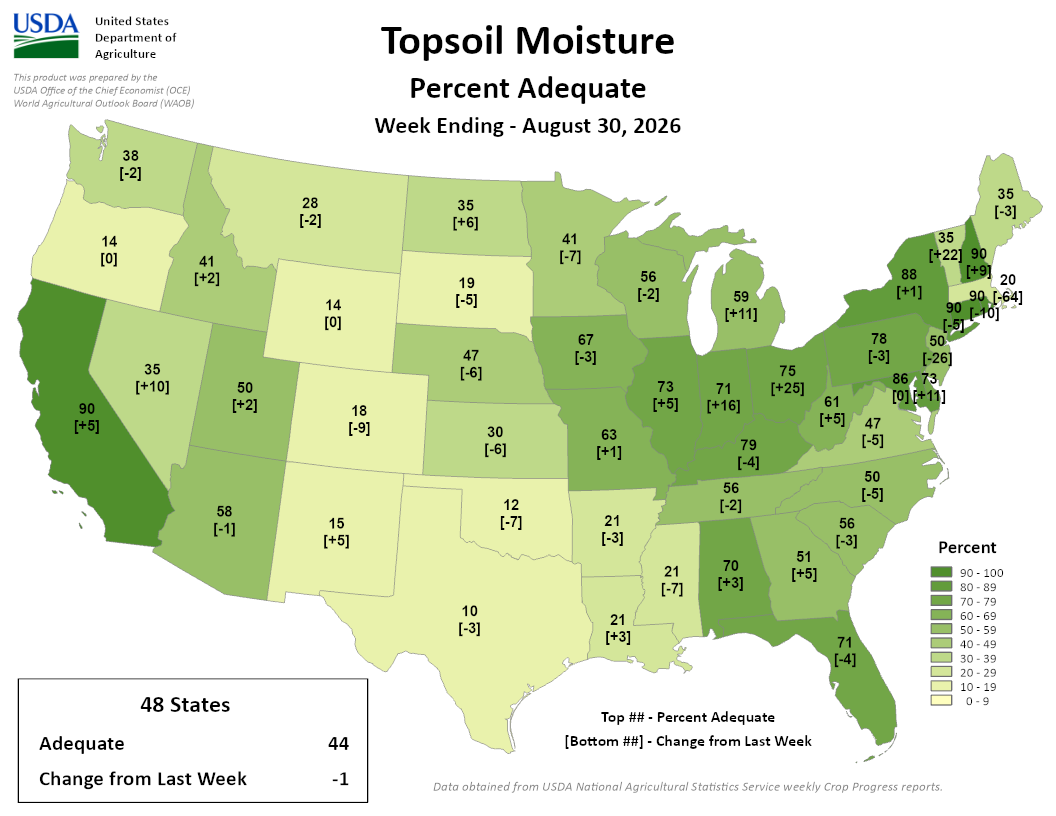
Image Description ↓
A United States Department of Agriculture map displaying topsoil moisture percent adequate per state for the week ending August 30, 2026. Color shading ranges from light yellow for low percentages to dark green for high percentages. High topsoil adequacy is reported in states like California at 90 percent and Pennsylvania at 90 percent, while central states like Texas display 10 percent and Nebraska displays 18 percent. Across all 48 contiguous states, national topsoil adequacy is 44 percent, down 1 point from last week.
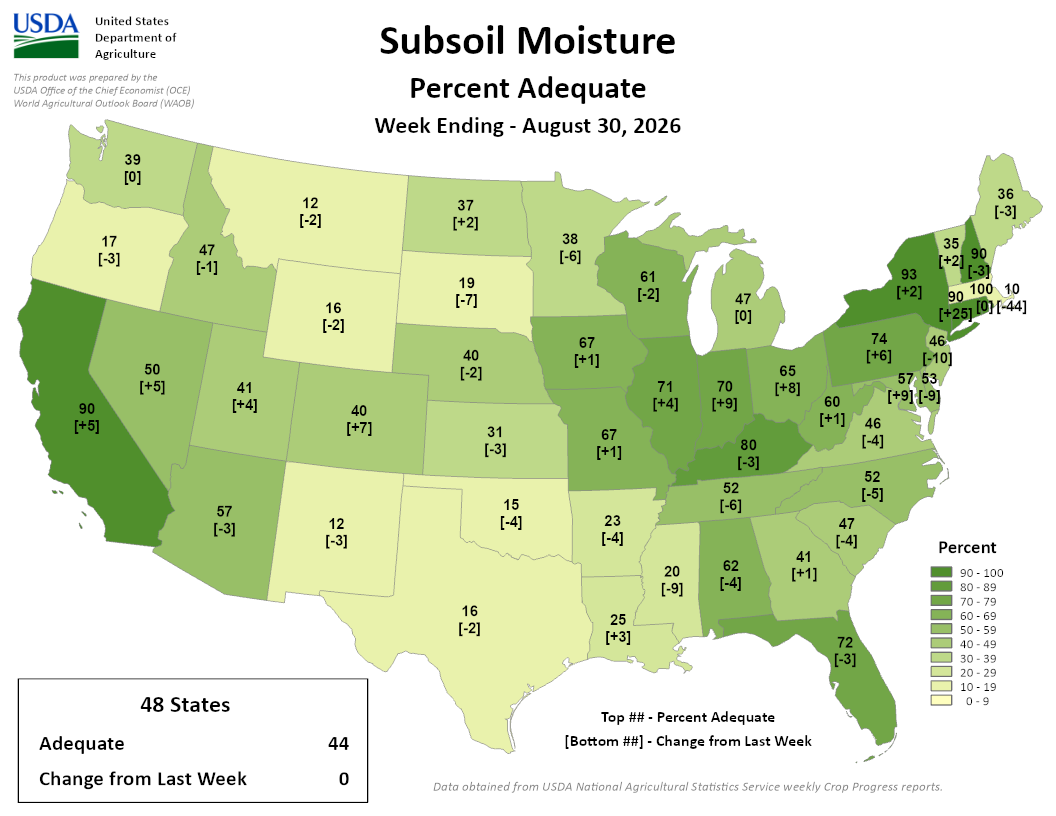
Image Description ↓
A United States Department of Agriculture map showing percent adequate subsoil moisture by state for the week ending August 30, 2026. Each state displays a top value for percent adequate subsoil moisture and a bottom bracketed value for weekly change. States in the Midwest and East range mostly from 40 to 93 percent adequate, highlighted in shades of green. Western and central plains states show lower adequacy, such as Wyoming at 16 percent and Texas at 16 percent. The national overall total across 48 states stands at 44 percent adequate with 0 change from the prior week.
- 56% and 61% of agricultural soils in the state are reported as having adequate topsoil and subsoil moisture. These values decreased from last week’s report.
- 43% and 38% of agricultural soils in the state are reported as having short to very short topsoil and subsoil moisture, respectively. These values increased from last week’s report.
Wisconet Soil Temperature
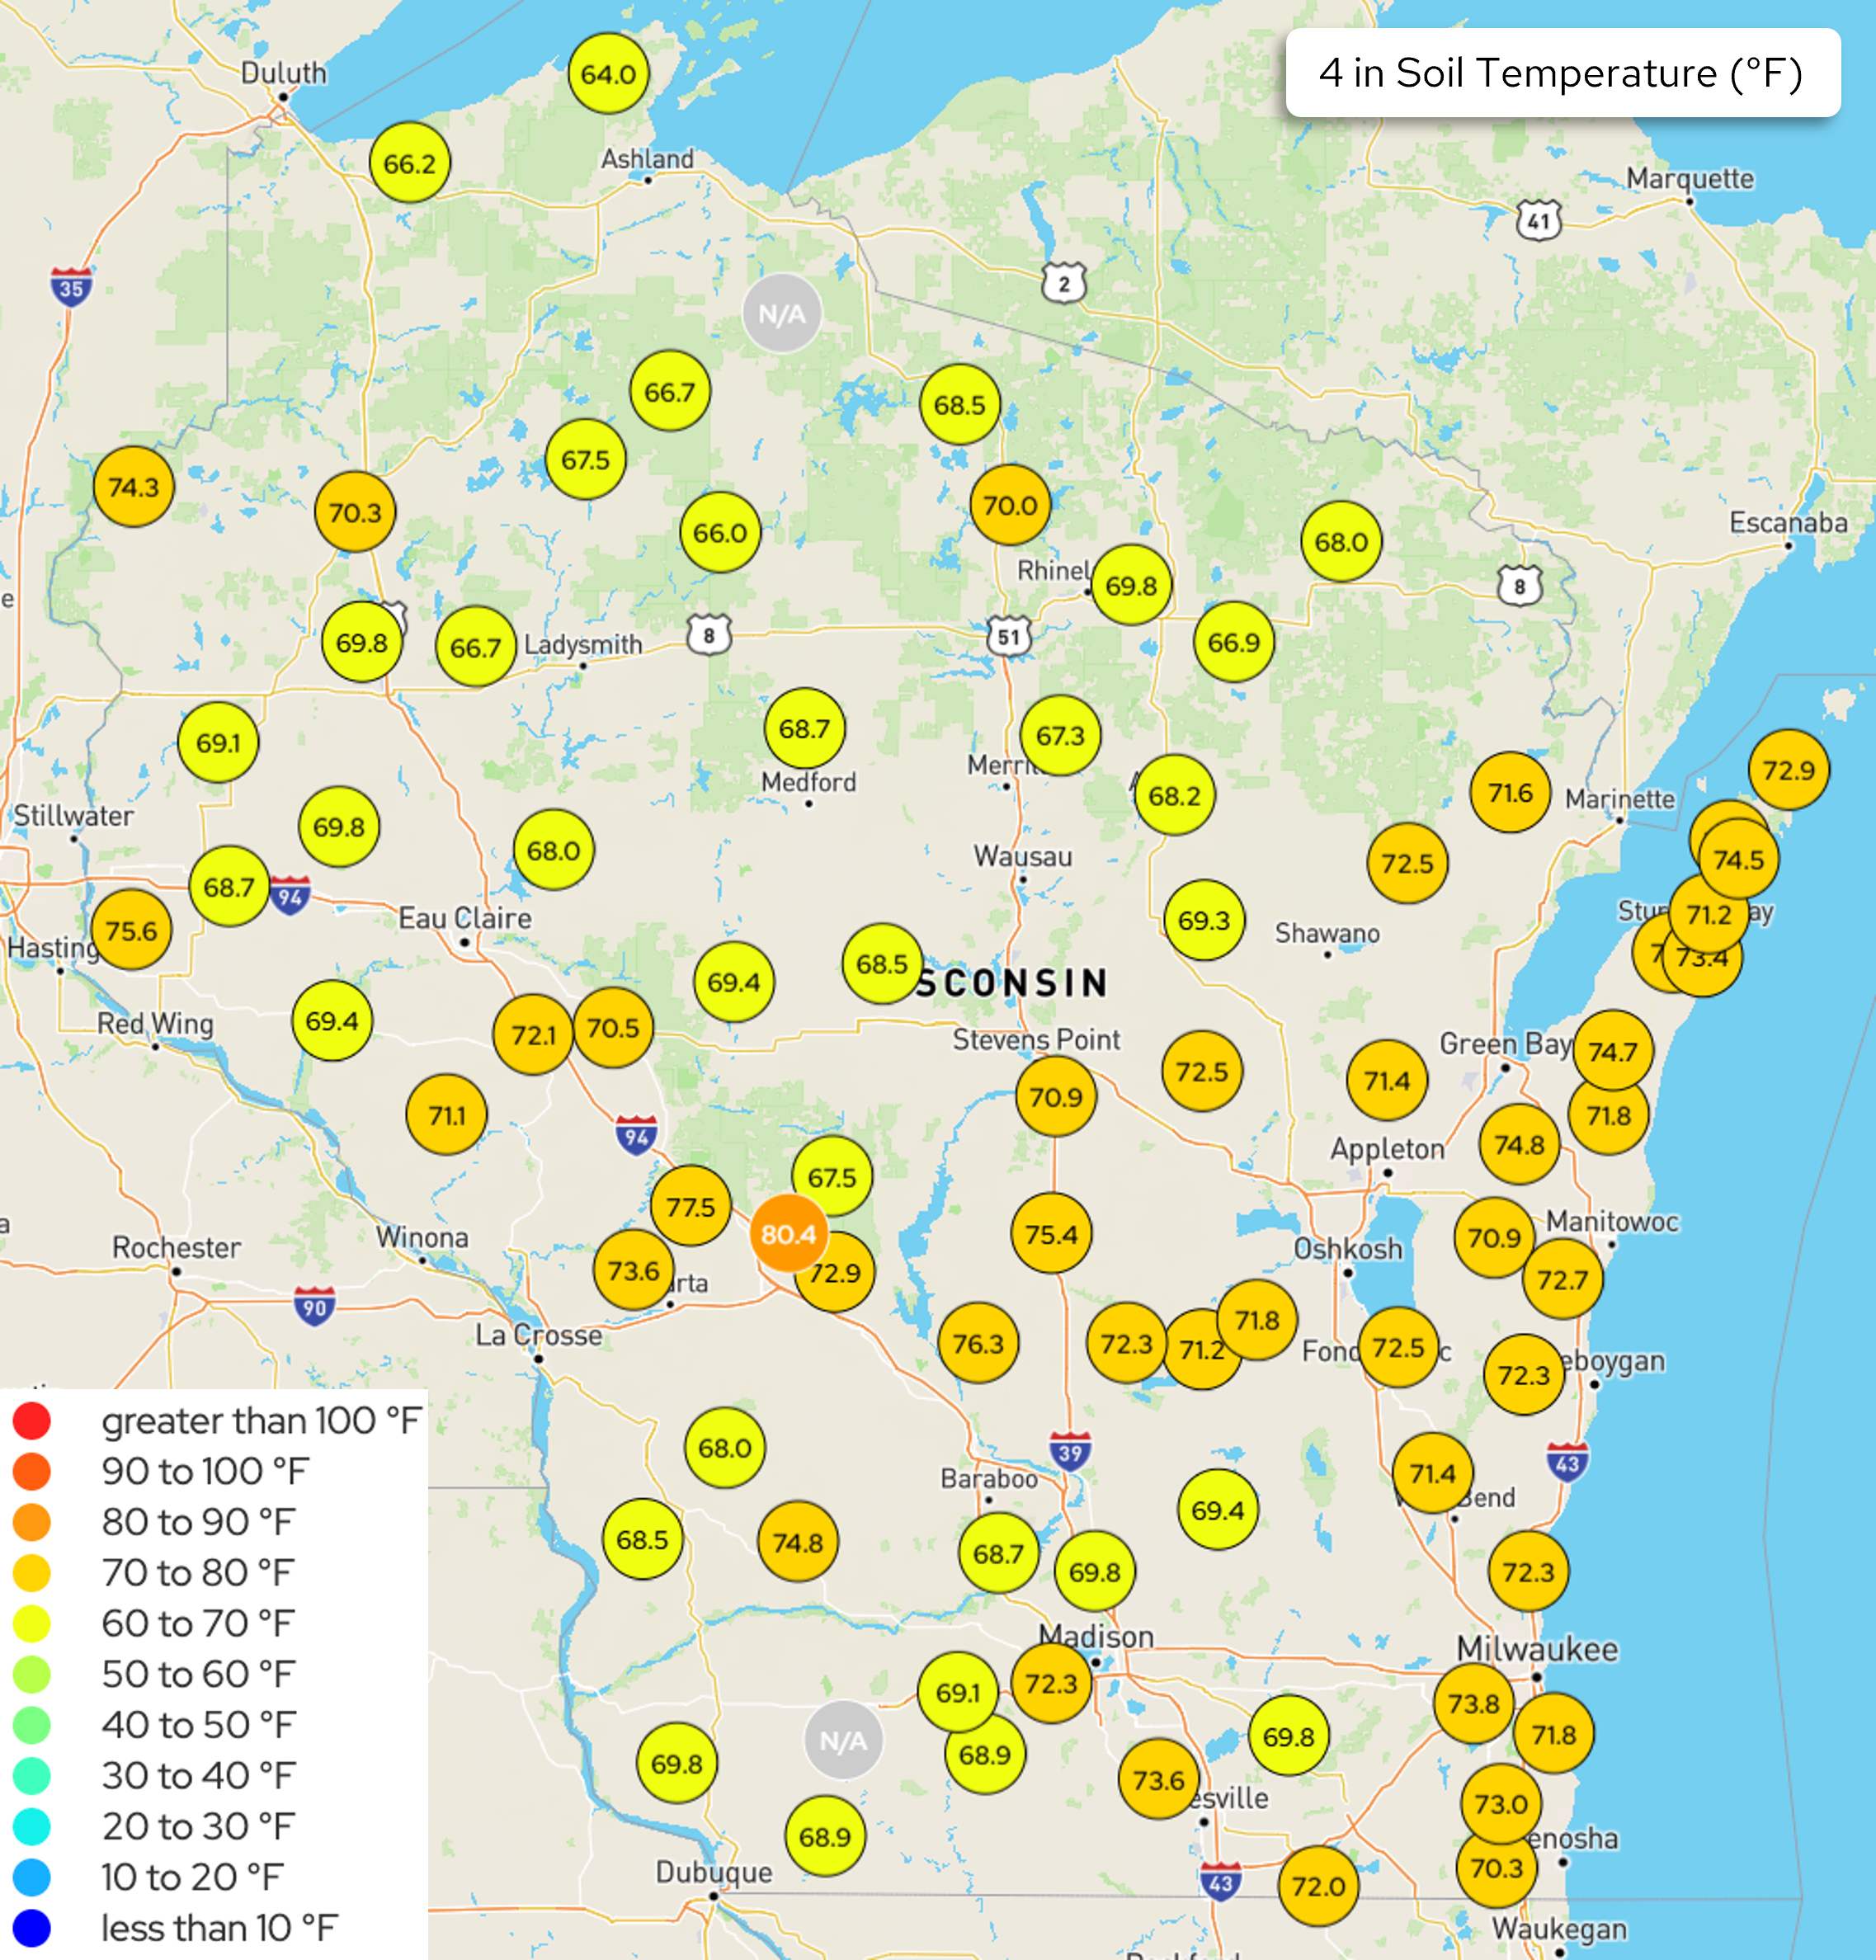
Image Description ↓
A Wisconet map displaying 4-inch soil temperature measurements in degrees Fahrenheit across Wisconsin. Station values are represented inside color-coded circular markers. Yellow-green circles across northern and central Wisconsin indicate temperatures primarily between 64.0 and 69.8 degrees Fahrenheit. Yellow and light orange circles in southern and southwestern regions show warmer soil temperatures ranging from 70.0 to 80.4 degrees Fahrenheit, with the peak reading of 80.4 degrees Fahrenheit located in west-central Wisconsin near Sparta.
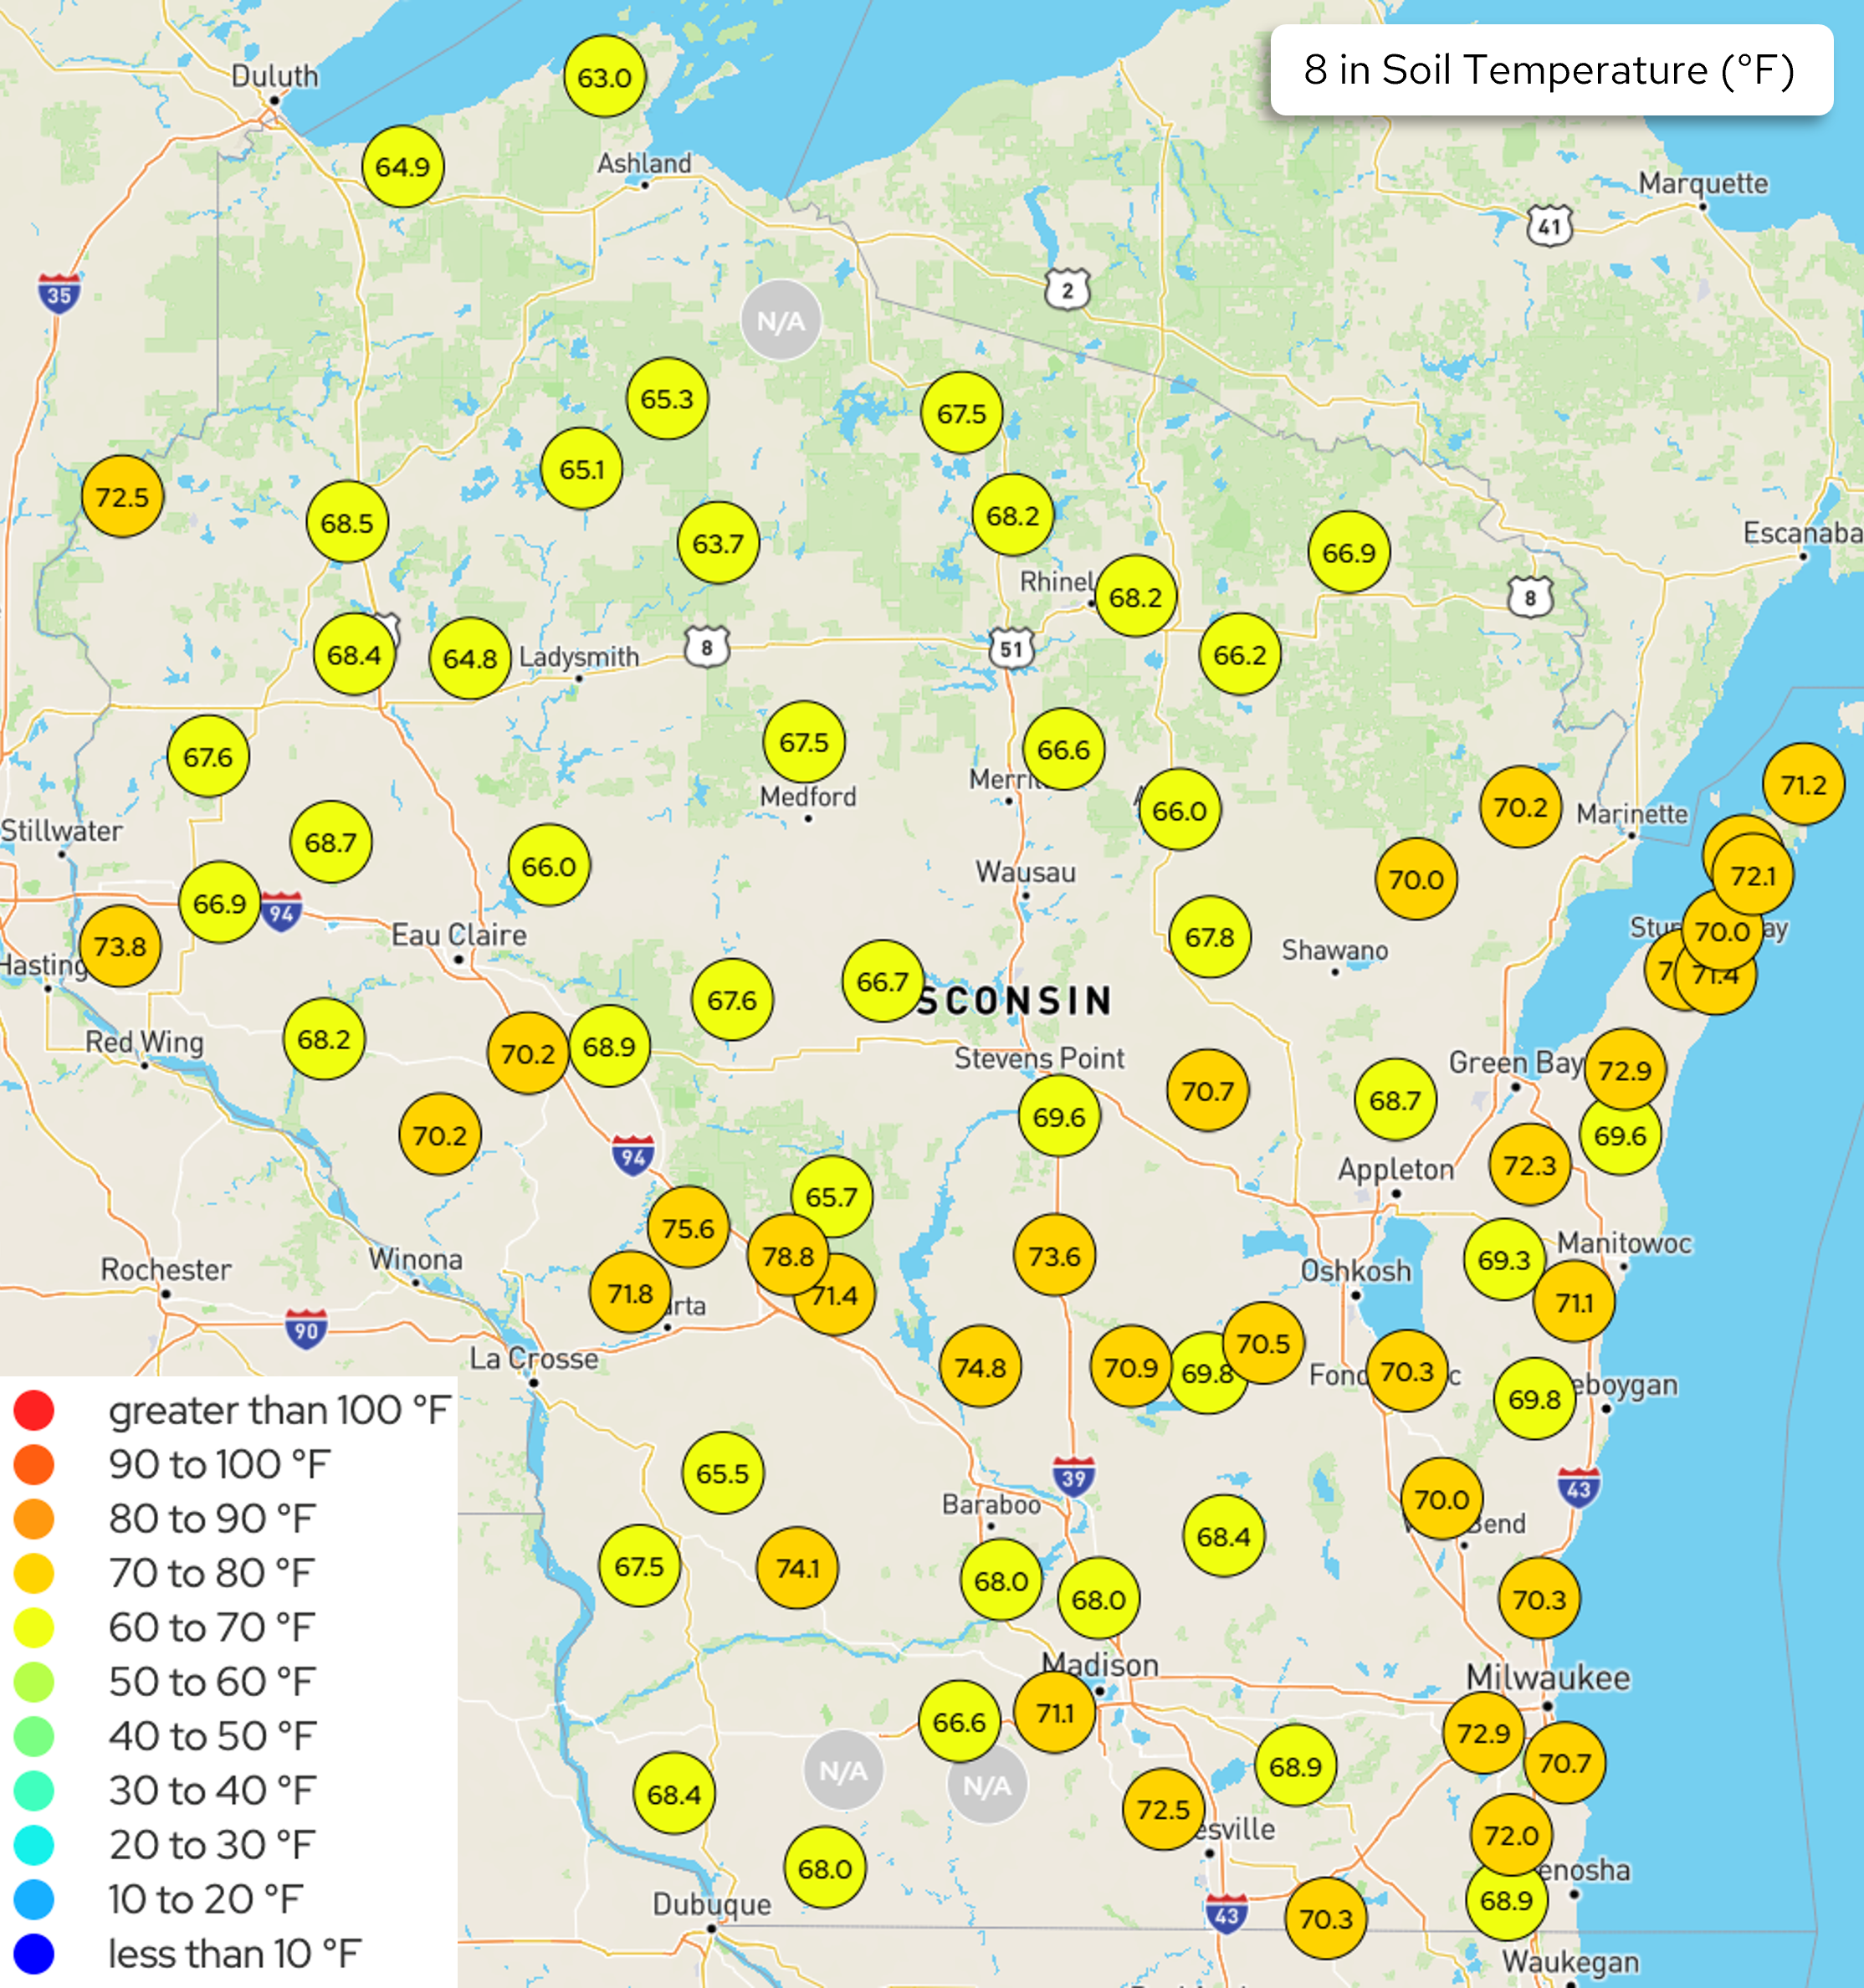
Image Description ↓
A Wisconet station map illustrating 8-inch depth soil temperatures in degrees Fahrenheit across Wisconsin. Station points feature circular markers with exact temperature readings. Northern Wisconsin stations display temperatures mainly between 63.0 and 68.5 degrees Fahrenheit, highlighted in lime green. Central and southern stations record higher temperatures mostly between 68.0 and 78.8 degrees Fahrenheit, rendered in yellow, with the highest temperatures concentrated in the west-central region.
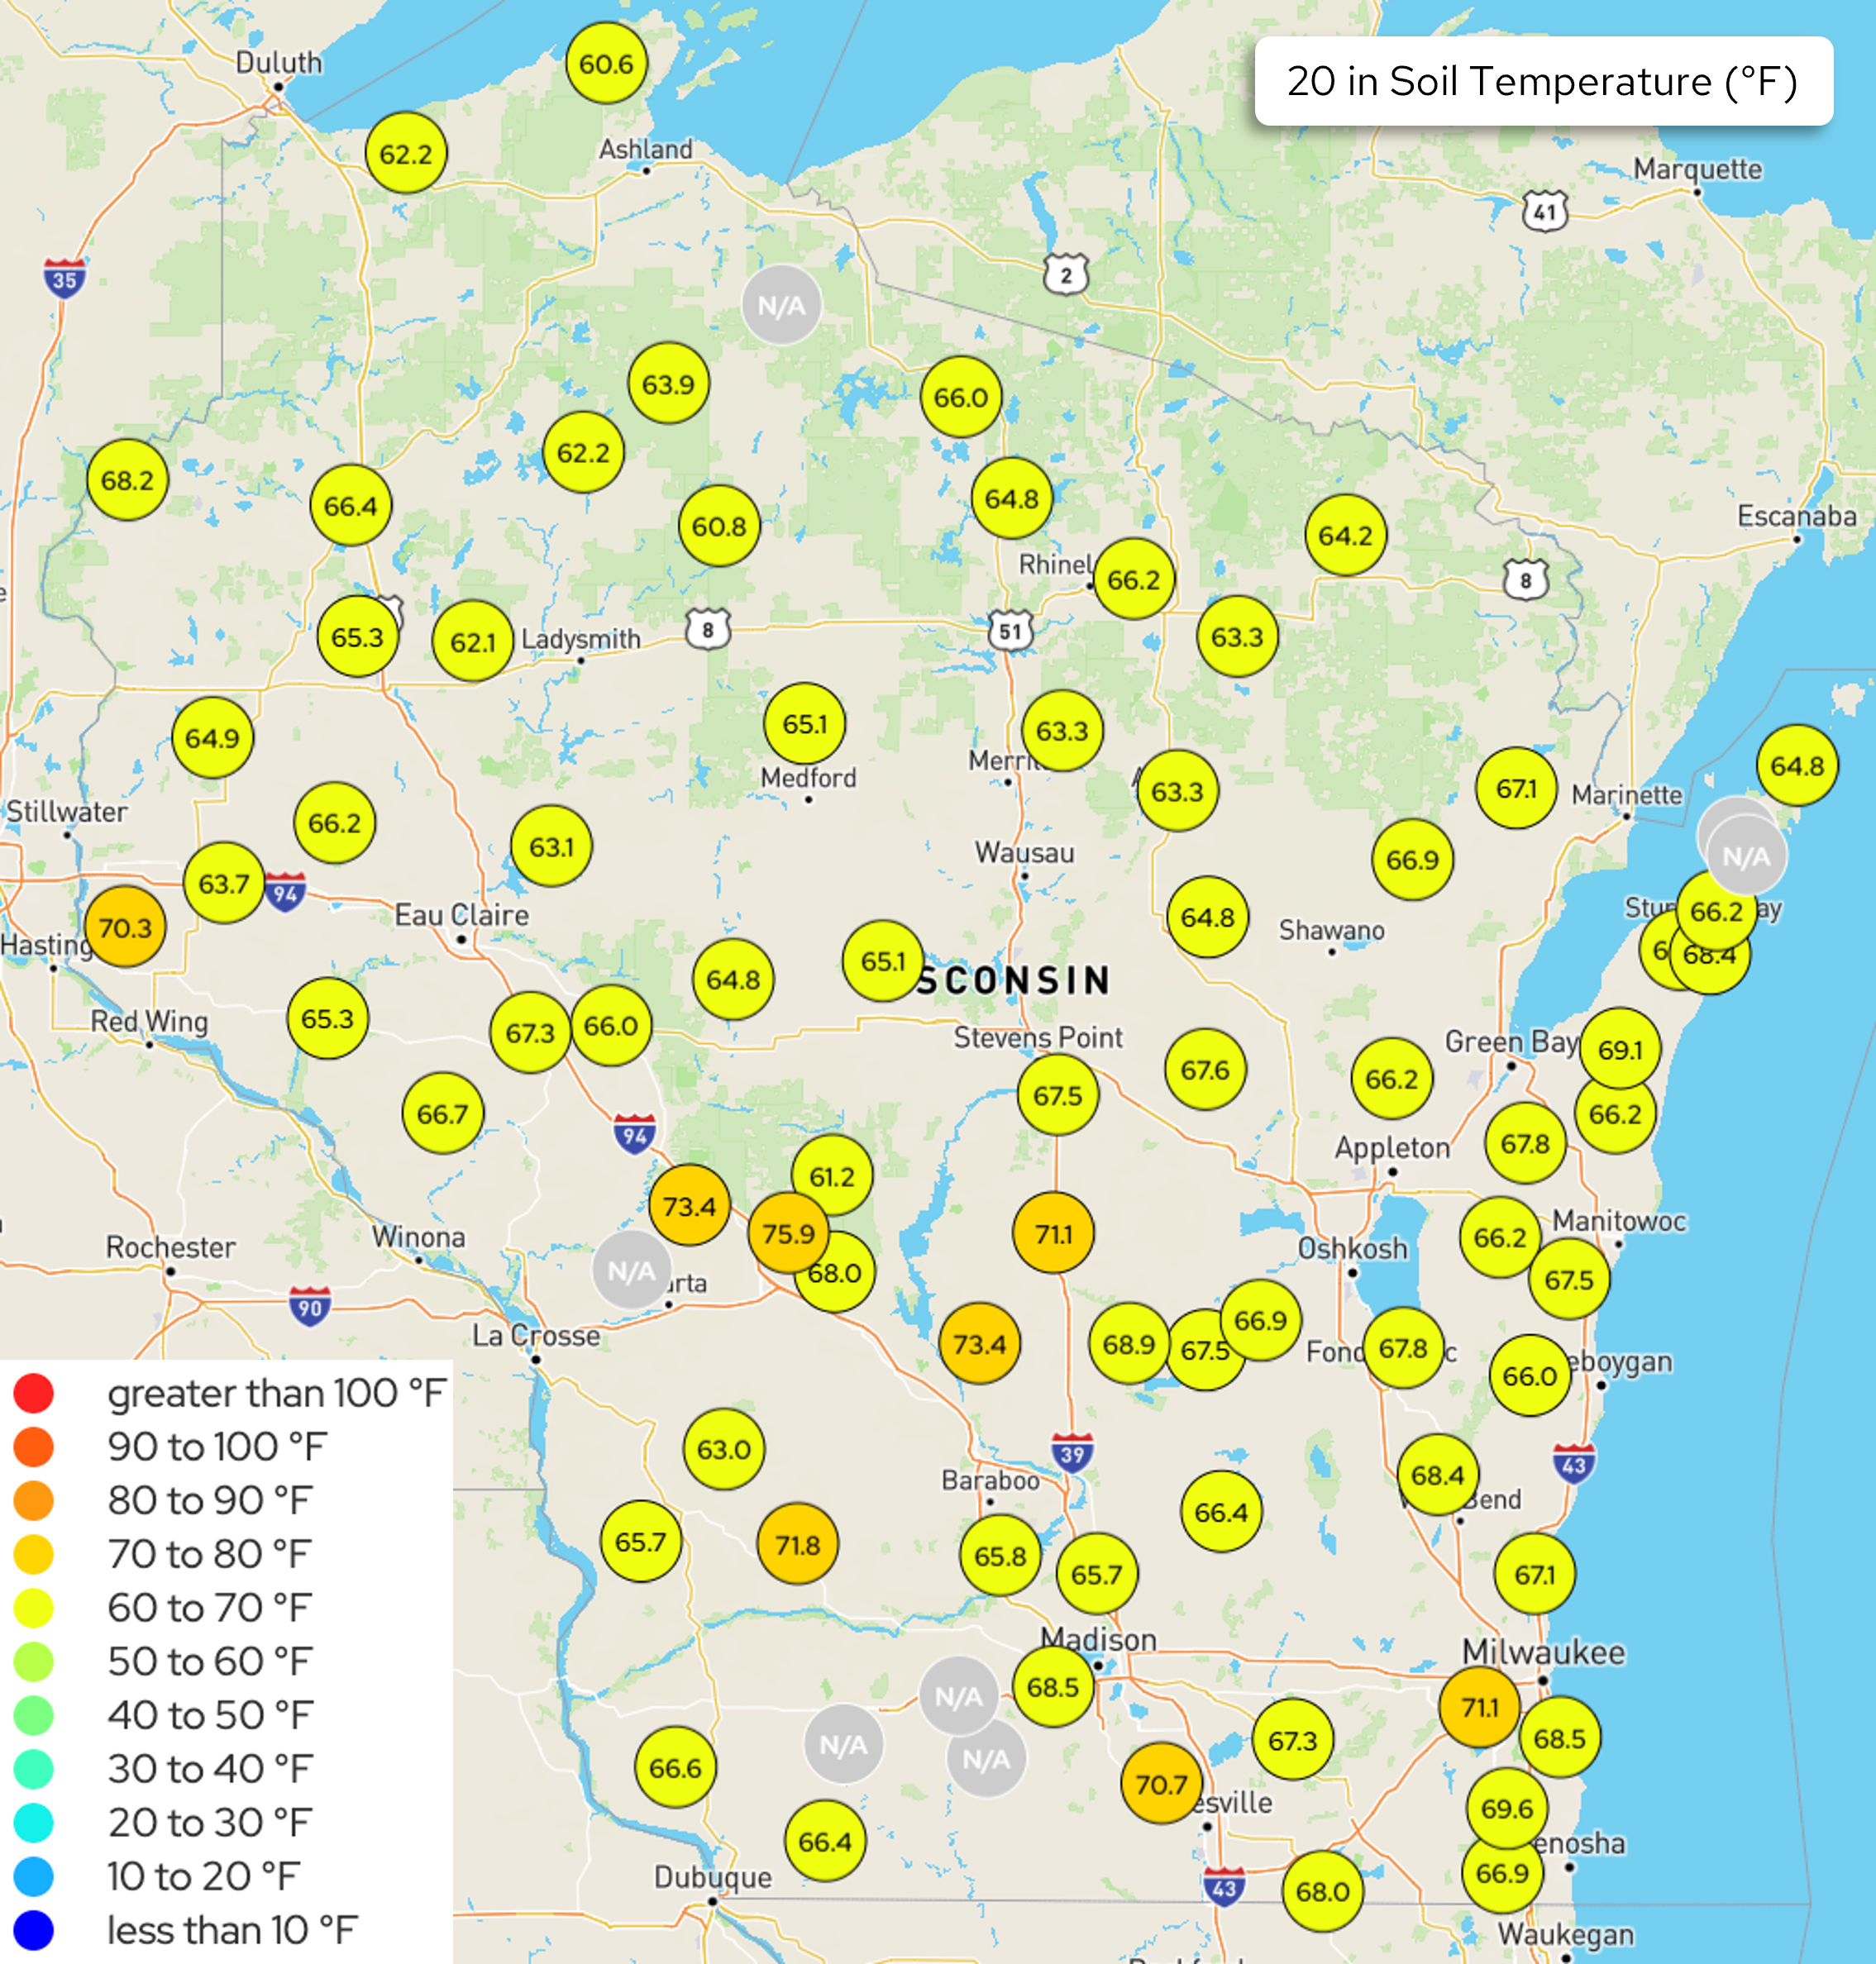
Image Description ↓
A geographic map of Wisconsin titled 20 in Soil Temperature (°F) displaying current readings across a network of monitoring stations marked by colored circle overlays. A temperature legend in the lower-left corner uses color coding ranging from red for greater than 100 °F to dark blue for less than 10 °F. Yellow circles dominate almost the entire map, representing readings in the 60 to 70 °F range. A few orange circles in west-central and southern regions indicate values in the 70 to 80 °F range, including 70.3 near Hastings, 73.4 and 75.9 near Sparta, 71.1 north of Baraboo, 73.4 west of Baraboo, 70.7 west of Janesville, and 71.1 in Milwaukee. Gray circles marked N/A indicate unavailable data at a few select locations.
- The maps show daily average Wisconet soil temperature conditions on August 31st.
U.S. Drought Monitor
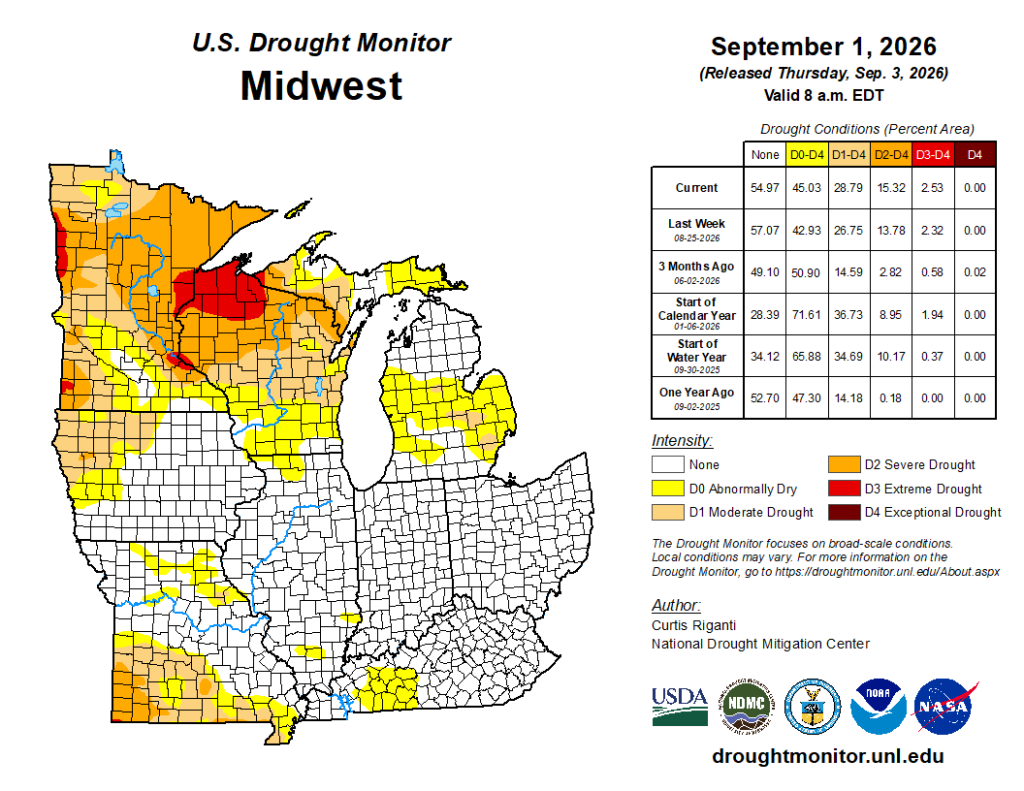
Image Description ↓
A U.S. Drought Monitor map for the Midwest region released on Thursday, September 3, 2026, valid September 1, 2026. The map uses color-coding to show drought intensity across the region: white for None, yellow for D0 Abnormally Dry, tan for D1 Moderate Drought, orange for D2 Severe Drought, bright red for D3 Extreme Drought, and dark red for D4 Exceptional Drought. Significant coverage of D2 Severe Drought (orange) and D3 Extreme Drought (red) is visible across Minnesota and northern Wisconsin, while Iowa, Illinois, Indiana, Ohio, Missouri, and southern Michigan feature lower drought levels or no drought. An accompanying data table lists percent area coverage: Current None is 54.97%, D0-D4 is 45.03%, D1-D4 is 28.79%, D2-D4 is 15.32%, D3-D4 is 2.53%, and D4 is 0.00%. Historical comparisons are included for Last Week, 3 Months Ago, Start of Calendar Year, Start of Water Year, and One Year Ago. Author listed is Curtis Riganti, National Drought Mitigation Center.
Compared to last week:
- Midwest: D1-D4 increased in coverage by 2% from last week’s report, with most of the expansion occurring in MN & MO.
- 71.2% of the Midwest region is drought free (~28.8% in D1-D4).
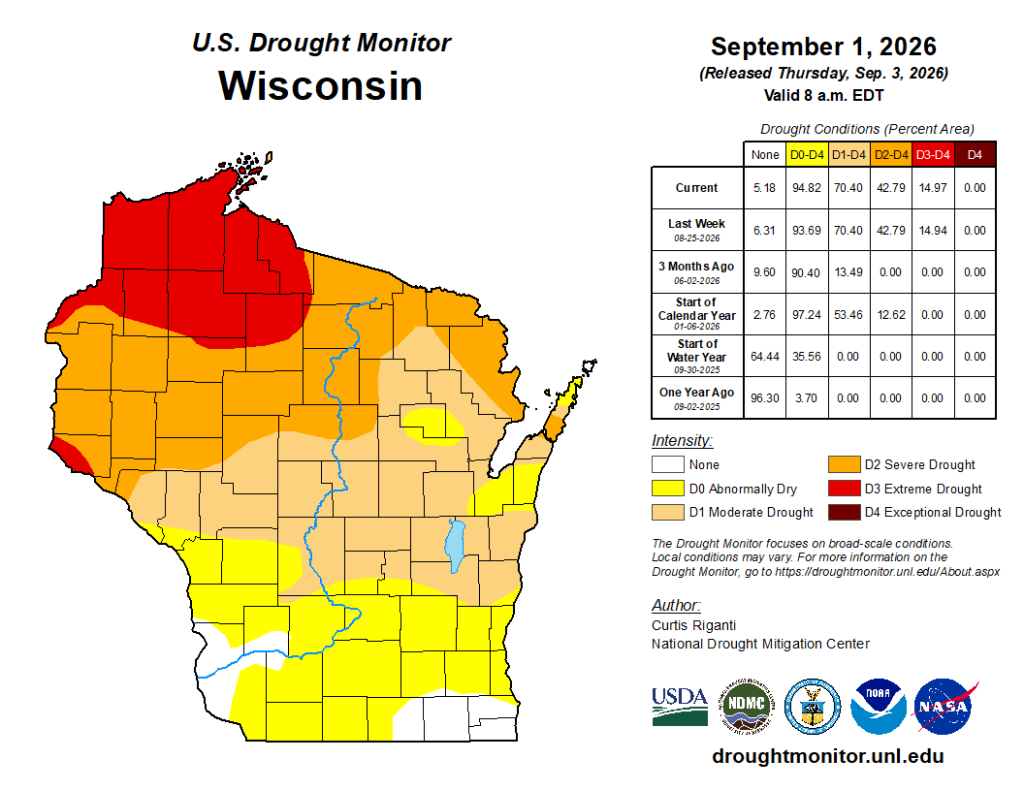
Image Description ↓
A U.S. Drought Monitor map focusing on Wisconsin, valid September 1, 2026, and released September 3, 2026. The map shows northern Wisconsin dominated by D3 Extreme Drought (red) and D2 Severe Drought (orange). Central Wisconsin is predominantly covered in D2 Severe Drought (orange) and D1 Moderate Drought (tan). Southern Wisconsin contains areas of D0 Abnormally Dry (yellow) with a small patch of white (None) along the southern border. A table displays percent area metrics: Current None at 5.18%, D0-D4 at 94.82%, D1-D4 at 70.40%, D2-D4 at 42.79%, D3-D4 at 14.97%, and D4 at 0.00%. Historical comparative metrics for previous periods back to one year ago are provided in the table. Author is Curtis Riganti from the National Drought Mitigation Center, with logos for USDA, NDMC, UNL, NOAA, and NASA shown at the bottom.
- Wisconsin: D0 expanded into Grant County (SW), but D1-D4 coverage was unchanged from last week.
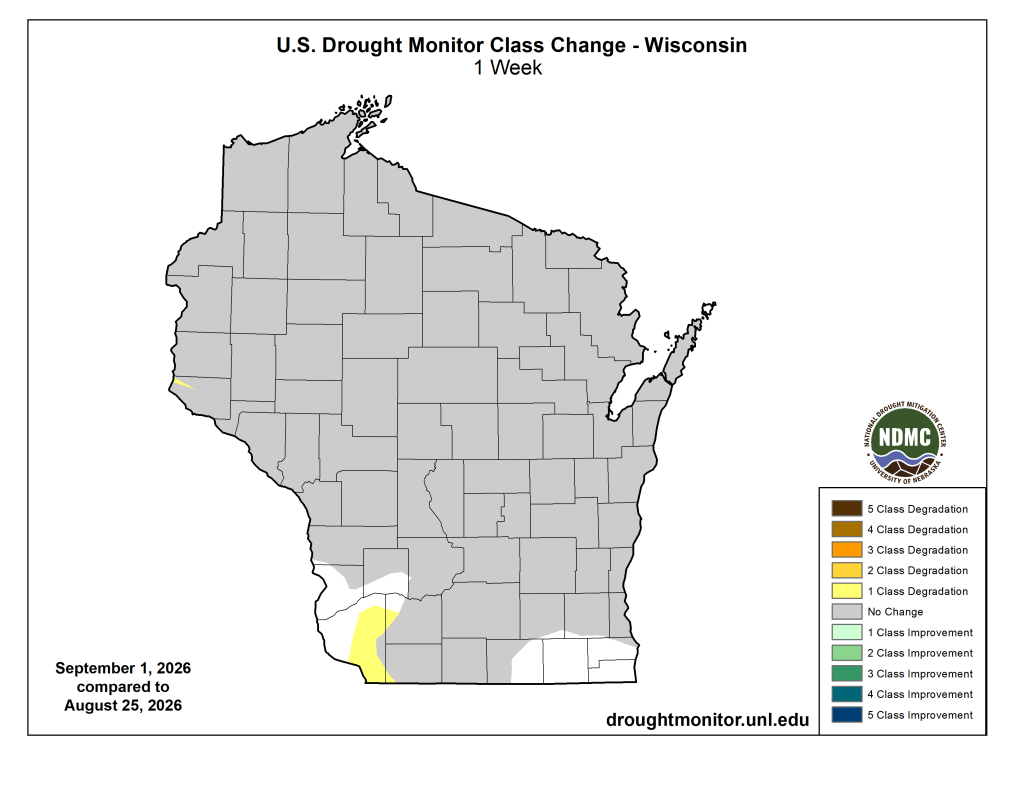
Image Description ↓
A map showing the 1-week U.S. Drought Monitor class change in Wisconsin comparing September 1, 2026, to August 25, 2026. The legend defines 10 categories ranging from 5 Class Degradation (dark brown) to No Change (gray) to 5 Class Improvement (dark blue). Nearly the entire state of Wisconsin is colored in solid gray, representing No Change in drought status over the 1-week period. A small section along the extreme southwestern boundary features yellow shading representing 1 Class Degradation, surrounded by white areas representing no classified change. The NDMC logo appears in the bottom right corner along with website URL droughtmonitor.unl.edu.
- One class degradation in southwest WI
U.S. Drought Monitor Time Series
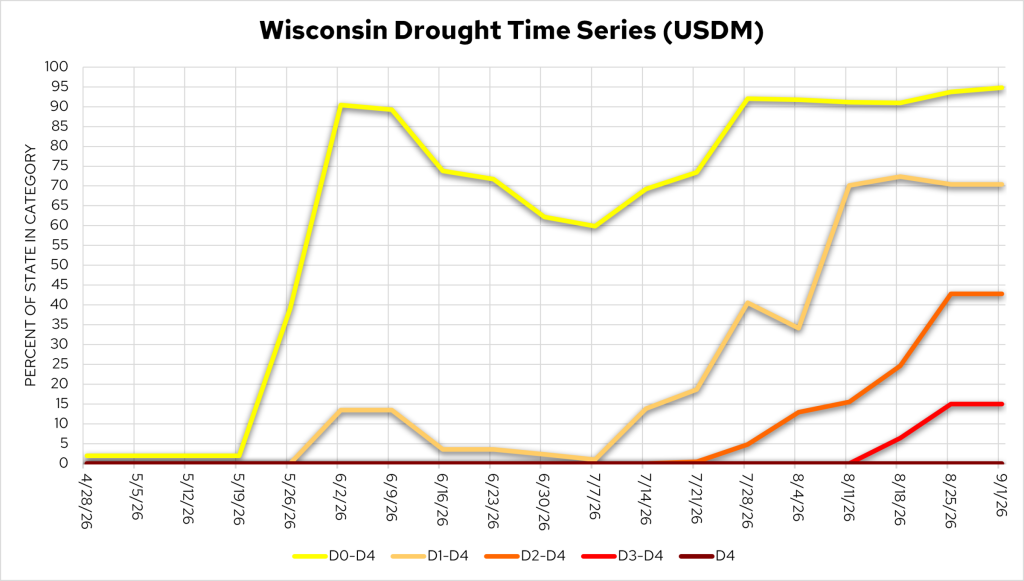
Image Description ↓
A line graph titled Wisconsin Drought Time Series (USDM) tracking the percentage of the state in various drought categories from April 28, 2026, through September 1, 2026. The vertical axis represents Percent of State in Category from 0 to 100 in increments of 5. The horizontal axis lists dates at weekly intervals. Five color-coded series are plotted: D0-D4 (yellow line), D1-D4 (tan line), D2-D4 (orange line), D3-D4 (red line), and D4 (maroon line). The D0-D4 line rises rapidly in late May 2026 from near 0 percent to approximately 90 percent by June 2, dips slightly mid-summer, and climbs to 95 percent by September 1. The D1-D4 line increases in July, reaching around 70 percent by mid-August. The D2-D4 line rises starting late July, reaching about 43 percent by late August. The D3-D4 line emerges in mid-August, leveling at 15 percent by August 25 and September 1. The D4 line remains flat at 0 percent throughout the entire timeframe.
- D0 coverage = 94.8%; D1 coverage = 70.4%; D2 coverage = 42.8%; D3 coverage = 15.0%
Temperature Trends
7 Day Temperatures
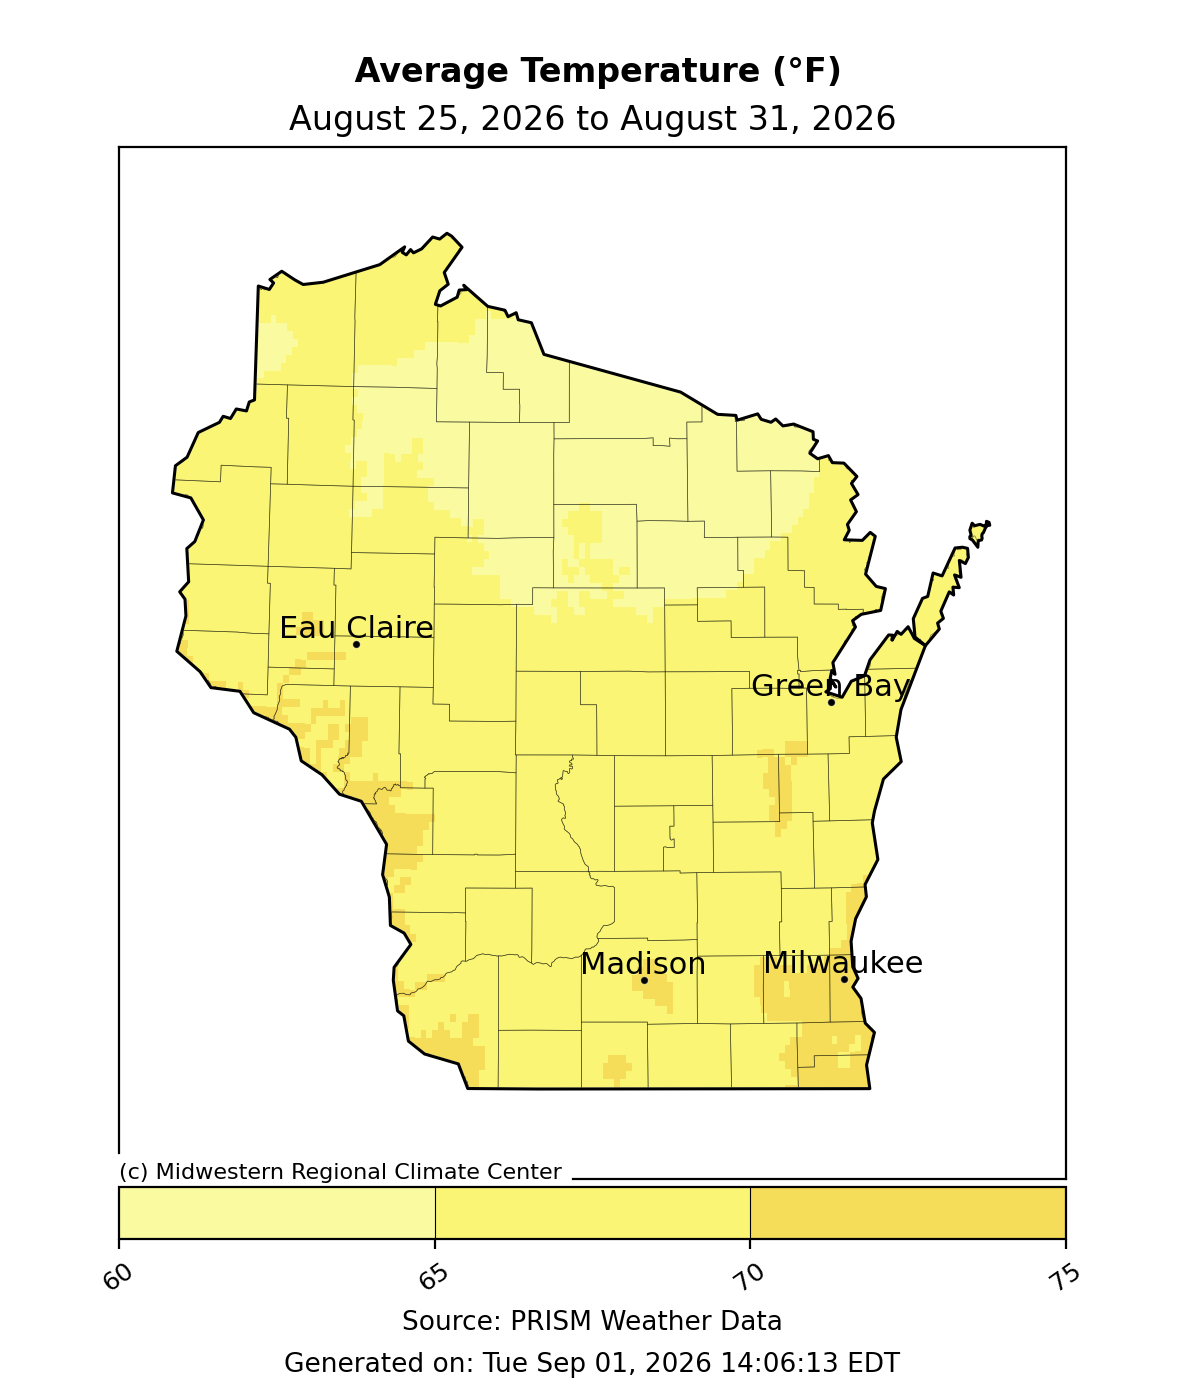
Image Description ↓
A Midwestern Regional Climate Center map showing average temperature across Wisconsin from August 25, 2026, to August 31, 2026. Temperature ranges across the state fall between 60 and 75 degrees Fahrenheit. Northern counties display cooler average temperatures between 60 and 65 degrees Fahrenheit, shaded in pale yellow. Central and southern regions, including areas around Eau Claire, Green Bay, Madison, and Milwaukee, show average temperatures between 65 and 70 degrees Fahrenheit in bright yellow. Isolated areas in the far south and southwest border reach 70 to 75 degrees Fahrenheit, indicated by darker yellow shading. Source data is credited to PRISM Weather Data.
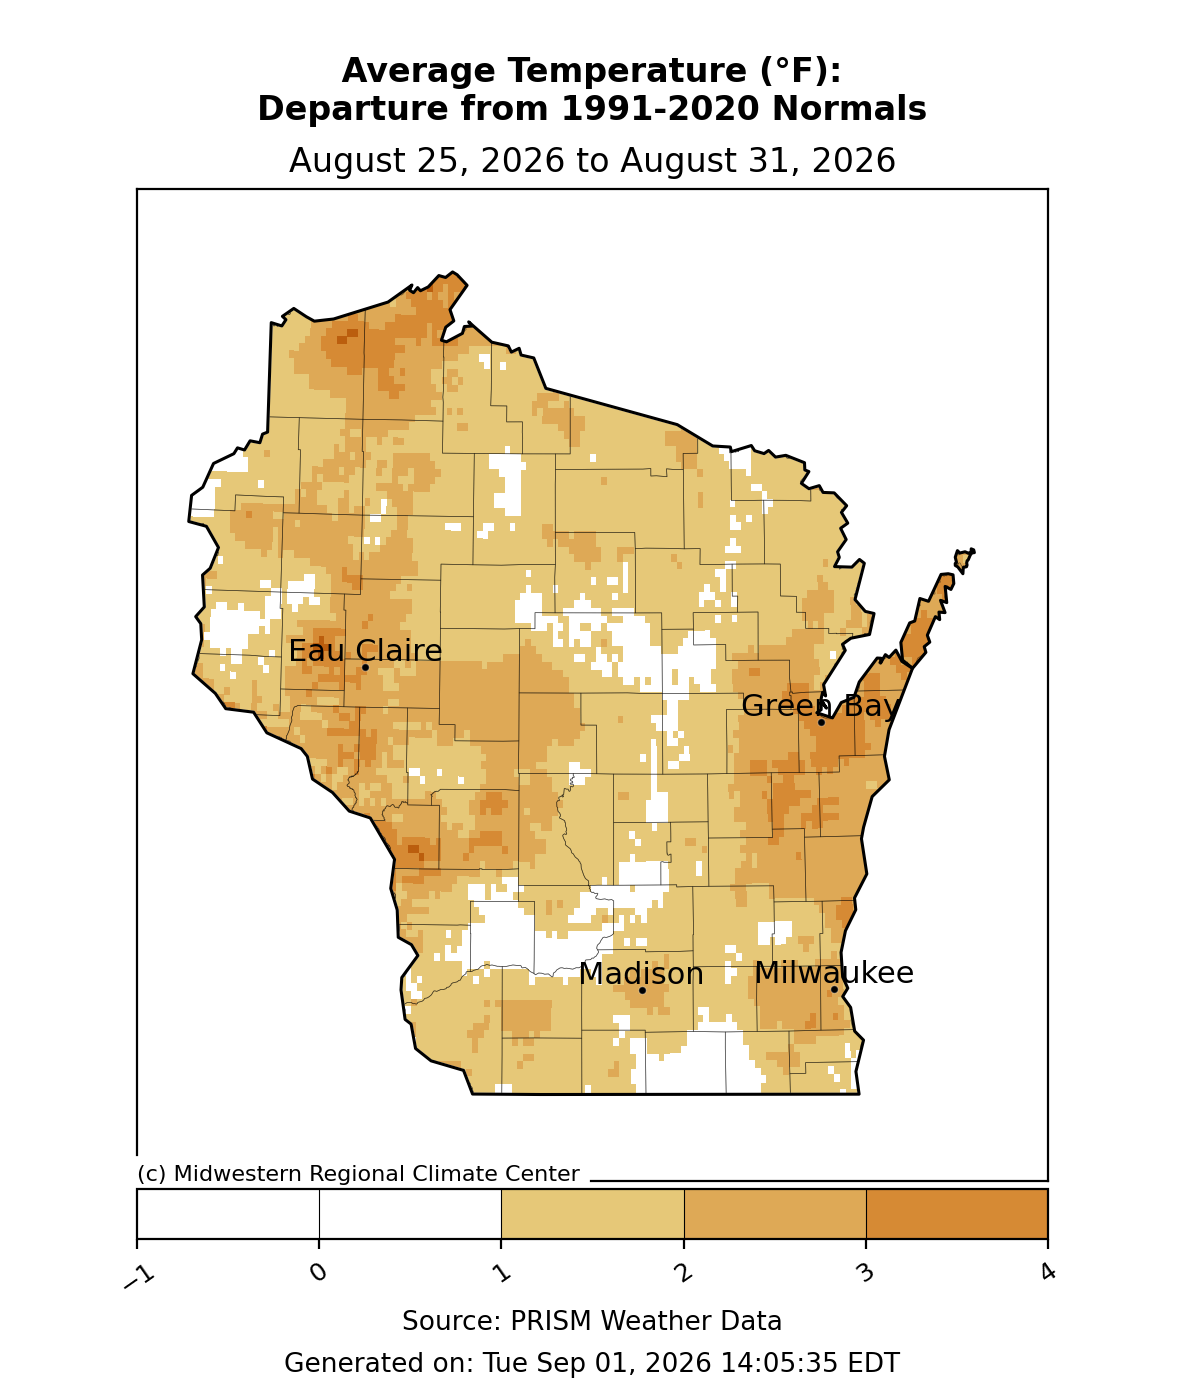
Image Description ↓
A Midwestern Regional Climate Center map depicting average temperature departure from 1991-2020 normals across Wisconsin from August 25, 2026, to August 31, 2026. Most of the state displays temperatures 1 to 3 degrees Fahrenheit above normal, indicated by tan and light orange shading. Pockets along the far north, central regions, and eastern shore around Green Bay show warmer departures up to 3 to 4 degrees Fahrenheit above normal in dark orange. Unshaded white areas across central and southern regions indicate departures near zero. Major labeled cities include Eau Claire, Green Bay, Madison, and Milwaukee. Source data is credited to PRISM Weather Data.
- Average temperatures were 65-70°F across almost all of Wisconsin. Southern and western locations were a bit warmer (low 70s).
- Temperatures were 1-3°F warmer than normal across most of the state.
30 Day Temperatures
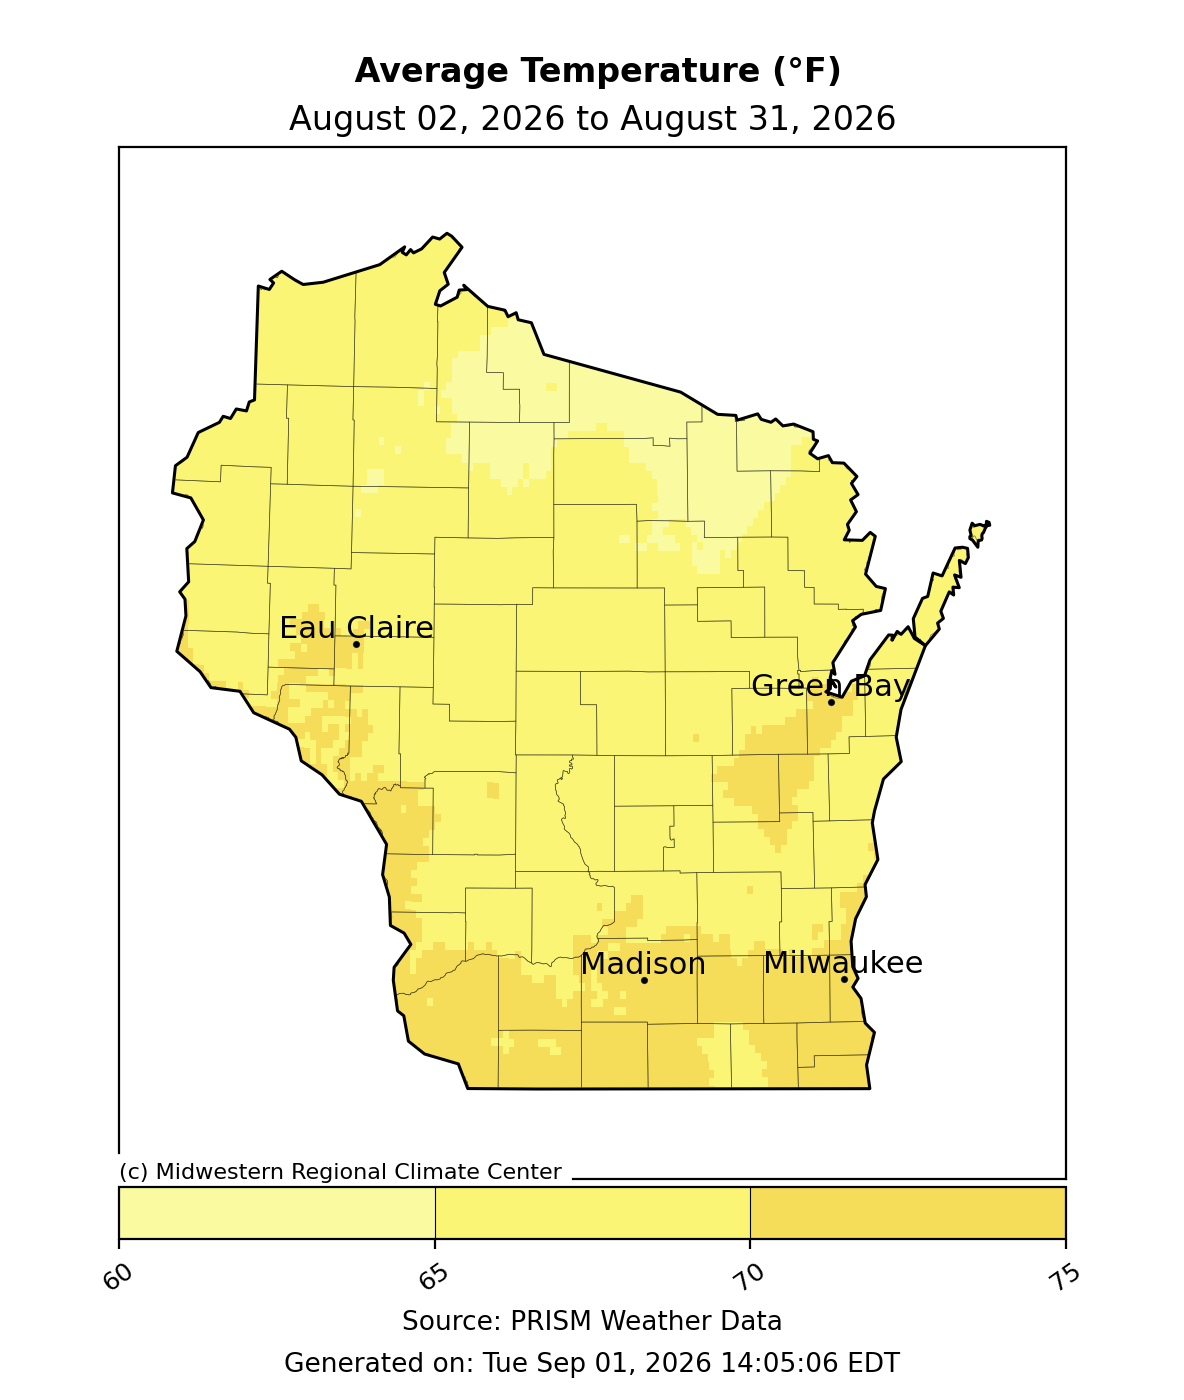
Image Description ↓
A Midwestern Regional Climate Center map depicting average temperature across Wisconsin from August 2, 2026, to August 31, 2026. Northern counties experience average temperatures ranging from 60 to 65 degrees Fahrenheit, rendered in pale yellow. Central regions, including Eau Claire and Green Bay, show averages between 65 and 70 degrees Fahrenheit in bright yellow. Southern counties, including Madison and Milwaukee, record the highest monthly averages between 70 and 75 degrees Fahrenheit, shaded in gold. Source data is credited to PRISM Weather Data.
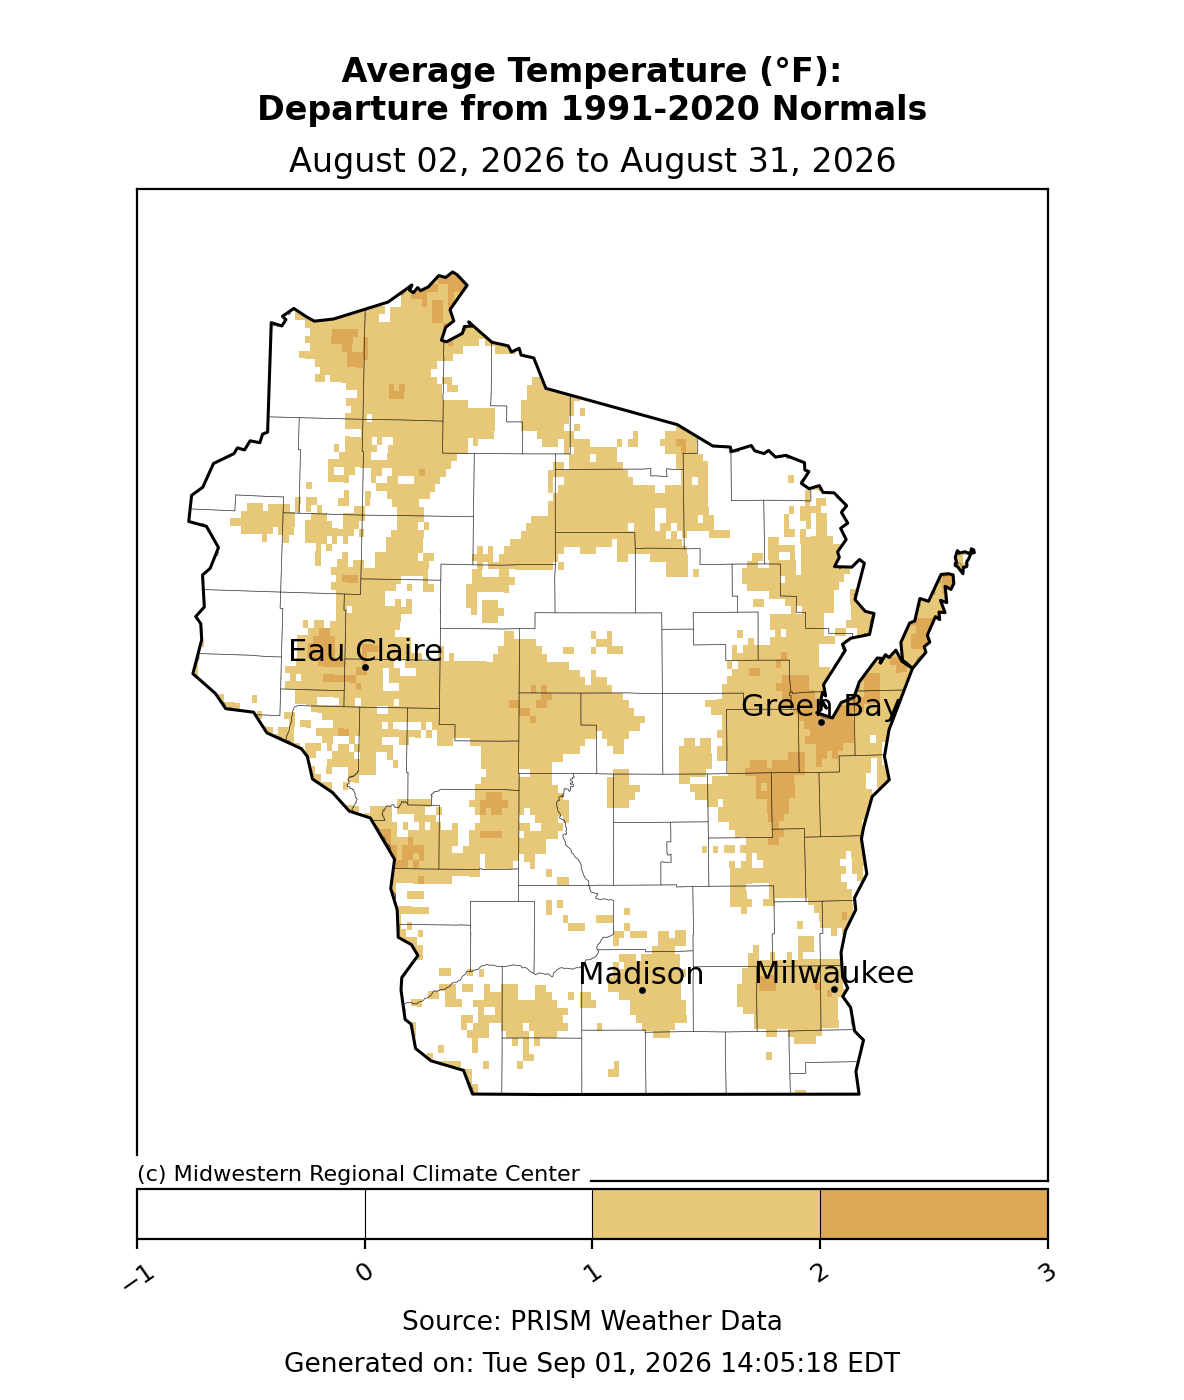
Image Description ↓
A Midwestern Regional Climate Center map showing average temperature departure from 1991-2020 normals across Wisconsin from August 2, 2026, to August 31, 2026. A majority of the state exhibits near-normal temperatures represented by white unshaded areas. Scattered central, eastern, and northern regions show temperatures 1 to 2 degrees Fahrenheit above normal, shaded in light tan. Portions of Door County, the far northern border, and areas near Green Bay show departures reaching 2 to 3 degrees Fahrenheit above normal in darker tan. Major labeled cities include Eau Claire, Green Bay, Madison, and Milwaukee. Source data is credited to PRISM Weather Data.
Growing Degree Days (Base 50°F)
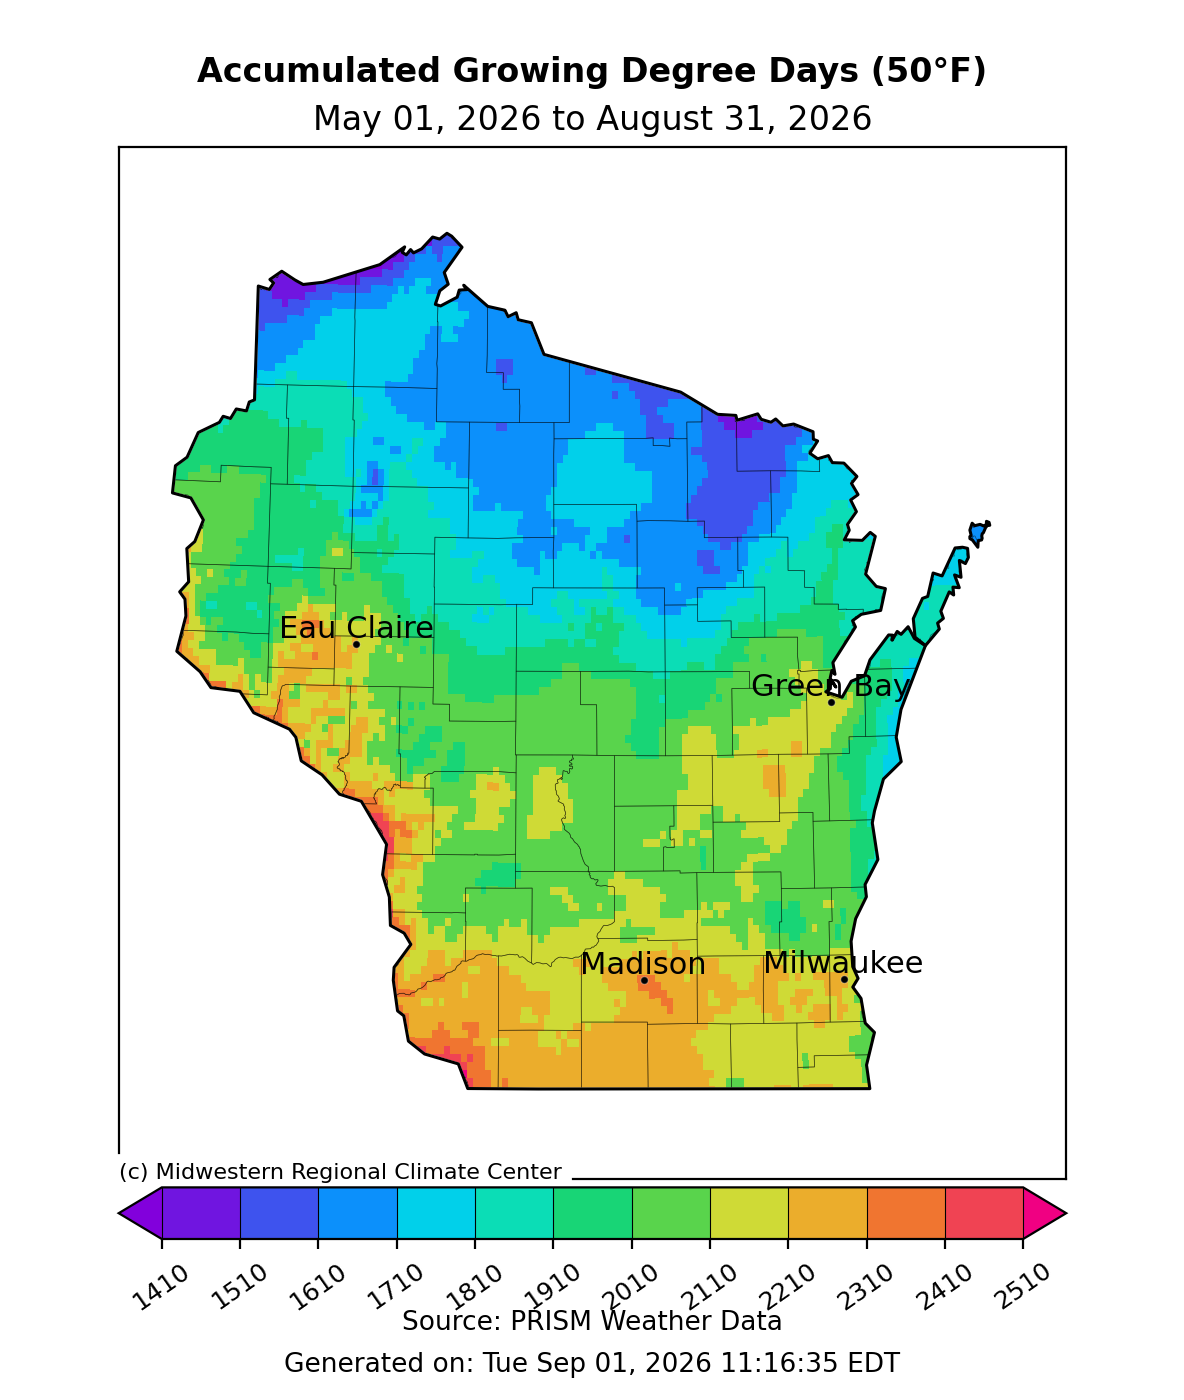
Image Description ↓
A Midwestern Regional Climate Center map displaying accumulated growing degree days with a base temperature of 50 degrees Fahrenheit across Wisconsin from May 1, 2026, to August 31, 2026. Accumulations range from under 1410 in the far north to over 2510 in the south. The northernmost region is colored purple and dark blue (1410 to 1610 GDD). Central regions transition through light blue and green (1710 to 2010 GDD) near Eau Claire and Green Bay. Southern regions show values between 2110 and 2410 GDD in yellow and orange near Madison and Milwaukee, with the southern border reaching red values up to 2510 GDD. Source data is credited to PRISM Weather Data.
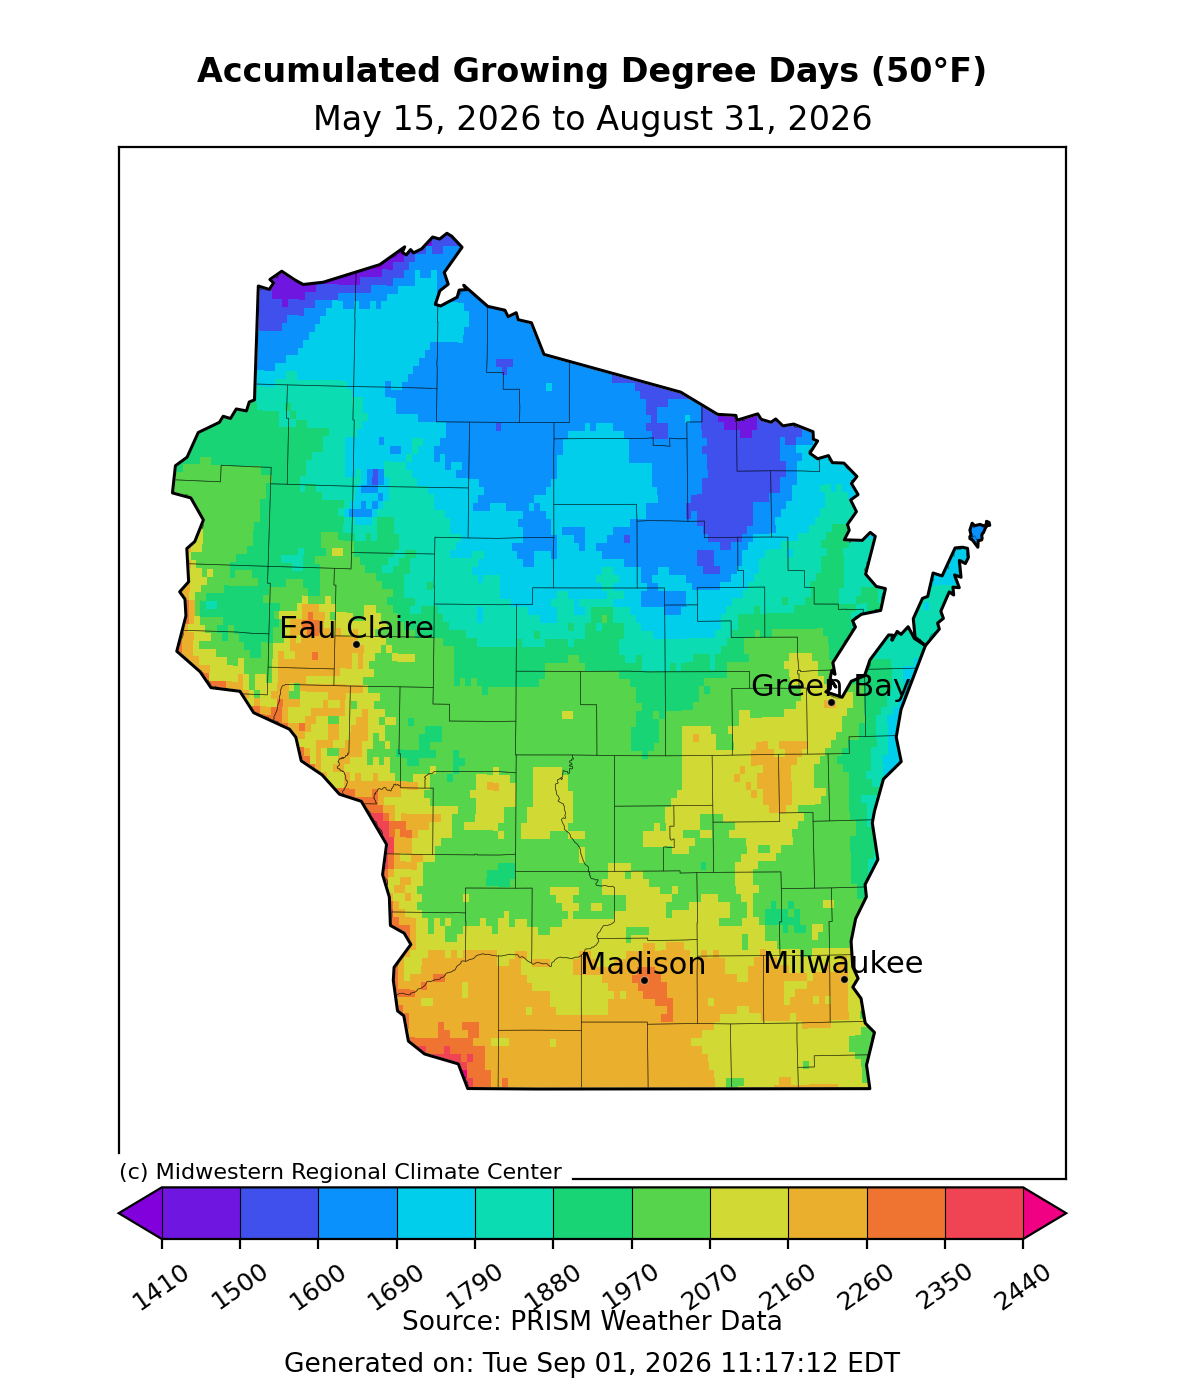
Image Description ↓
A Midwestern Regional Climate Center map showing accumulated growing degree days with a base temperature of 50 degrees Fahrenheit across Wisconsin from May 15, 2026, to August 31, 2026. Values range from 1410 in the north to 2440 in the south. The northern border displays values between 1410 and 1600 GDD in purple and dark blue. Central counties near Eau Claire and Green Bay display values between 1790 and 2070 GDD in green and yellow. Southern counties near Madison and Milwaukee show accumulations between 2160 and 2350 GDD in yellow-orange and light orange, with small southern border pockets reaching up to 2440 GDD in red. Source data is credited to PRISM Weather Data.
- Starting May 1 – Growing degree day accumulation ranges from 2410 GDD in the far south and west to 1710 GDD in the far north. These values are 105-110% of normal.
- Starting May 15 – Growing degree day accumulation ranges from 2350 GDD in the far south and west to 1690 GDD in the far north. These values are 110-115% of normal.
Crop Progress and Condition
Crop Progress Report for Corn
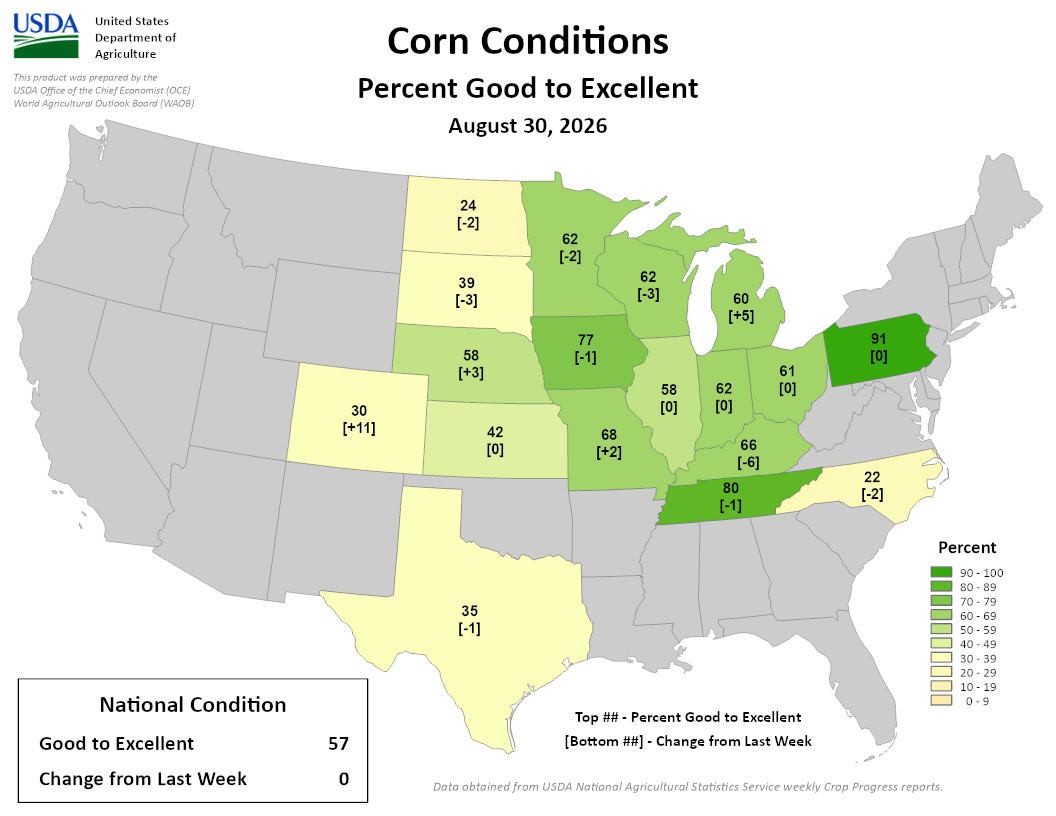
Image Description ↓
A United States Department of Agriculture map illustrating corn conditions by state as of August 30, 2026. Each tracked state displays the top number representing the percentage rated good to excellent and the bottom bracketed number showing change from the previous week. State percentages range from 22 percent in North Carolina to 91 percent in Pennsylvania. The national average for corn rated good to excellent is 57 percent, showing 0 change from the previous week.
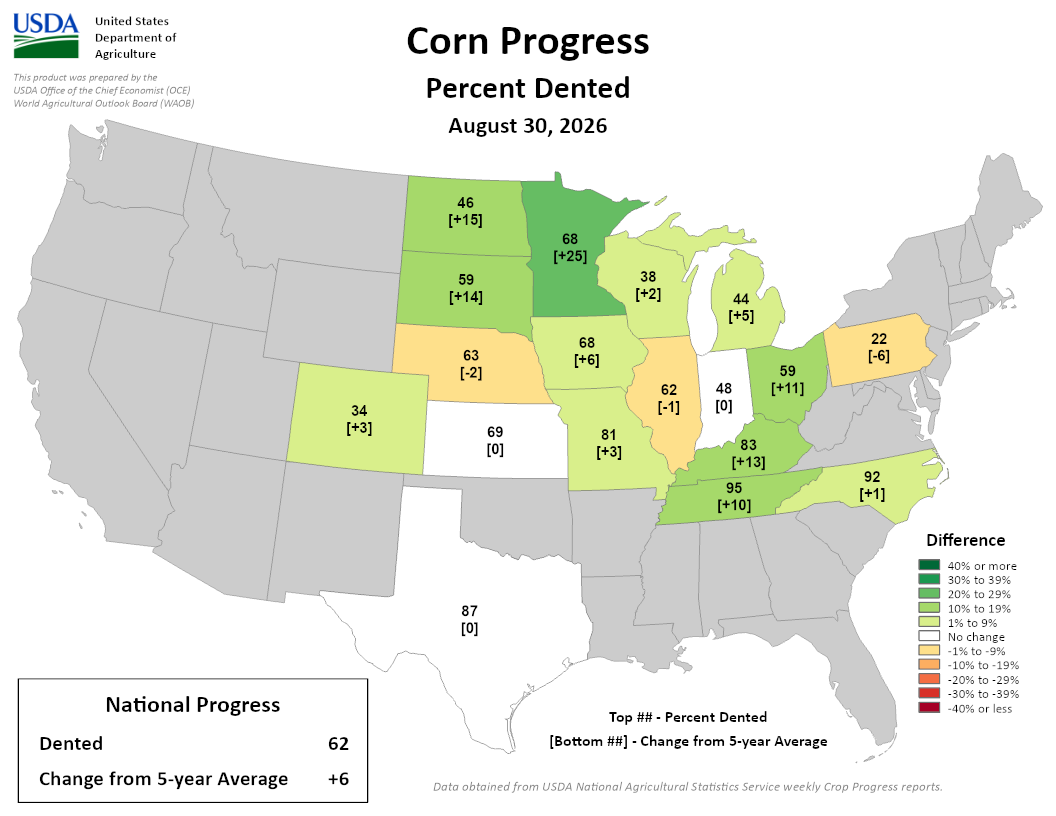
Image Description ↓
A United States Department of Agriculture map showing corn development progress across major producing states as of August 30, 2026. The top number in each state indicates the percentage of corn dented, while the bottom bracketed number displays the departure from the 5-year average. Values range from 22 percent dented in Pennsylvania to 95 percent in Mississippi. Nationally, 62 percent of corn is dented, representing a 6 percentage point increase above the 5-year average.
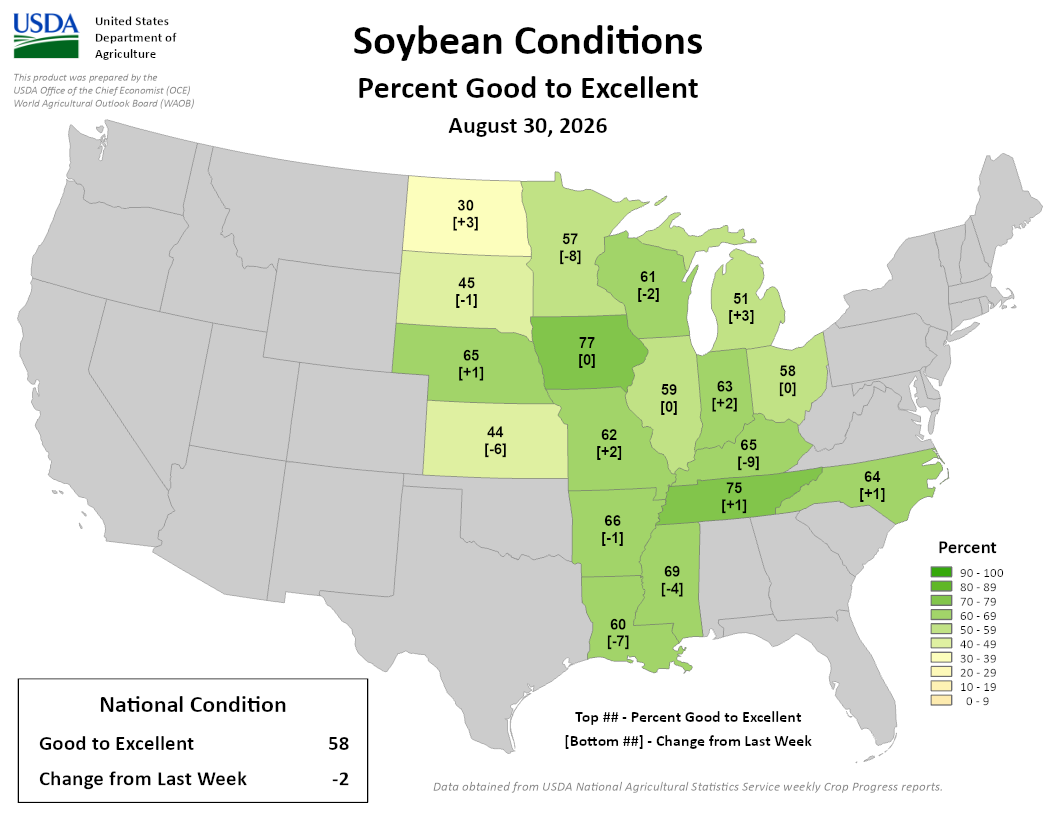
Image Description ↓
A United States Department of Agriculture map detailing soybean crop conditions across key states as of August 30, 2026. Individual state entries show the top value as percent good to excellent and the bottom bracketed value as the weekly change. Ratings vary from 30 percent good to excellent in North Dakota to 77 percent in Iowa. The national total shows 58 percent of soybeans rated good to excellent, a decrease of 2 percentage points from the previous week.
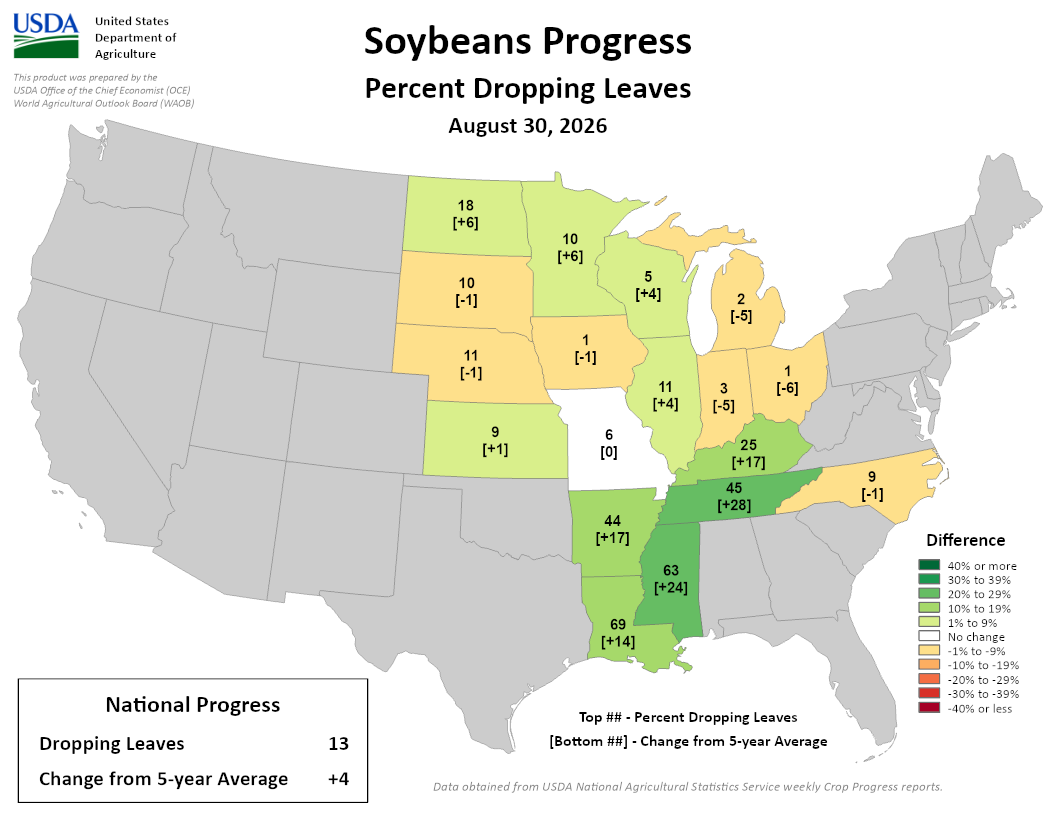
Image Description ↓
A United States Department of Agriculture map recording soybean progress measured by the percentage of crops dropping leaves as of August 30, 2026. Each state features a top number for percent dropping leaves and a bottom bracketed number for change from the 5-year average. Northern and central Midwest states report leaf drop percentages between 1 percent and 18 percent, while southern states report higher progress, including 69 percent in Louisiana. The national average stands at 13 percent dropping leaves, which is 4 percentage points ahead of the 5-year average.
- Wisconsin had 6.0 days suitable for fieldwork statewide.
- Soybeans are 96% setting pods, with 5% of the crop dropping leaves.
- Corn is 85% at dough stage and 38% at dent stage.
- Corn and soybean conditions are 62% and 61% good to excellent, respectively. Both values are down from last week’s report.
- Oats are 90% harvested.
- Potato harvest is starting to get underway in the state.
- Pasture and range were rated 45% good to excellent, down 3% from last week.
- The third cutting of alfalfa is 97% complete.
- Read the full USDA report.
Forecasts and Outlooks
7 Day Precipitation Forecast
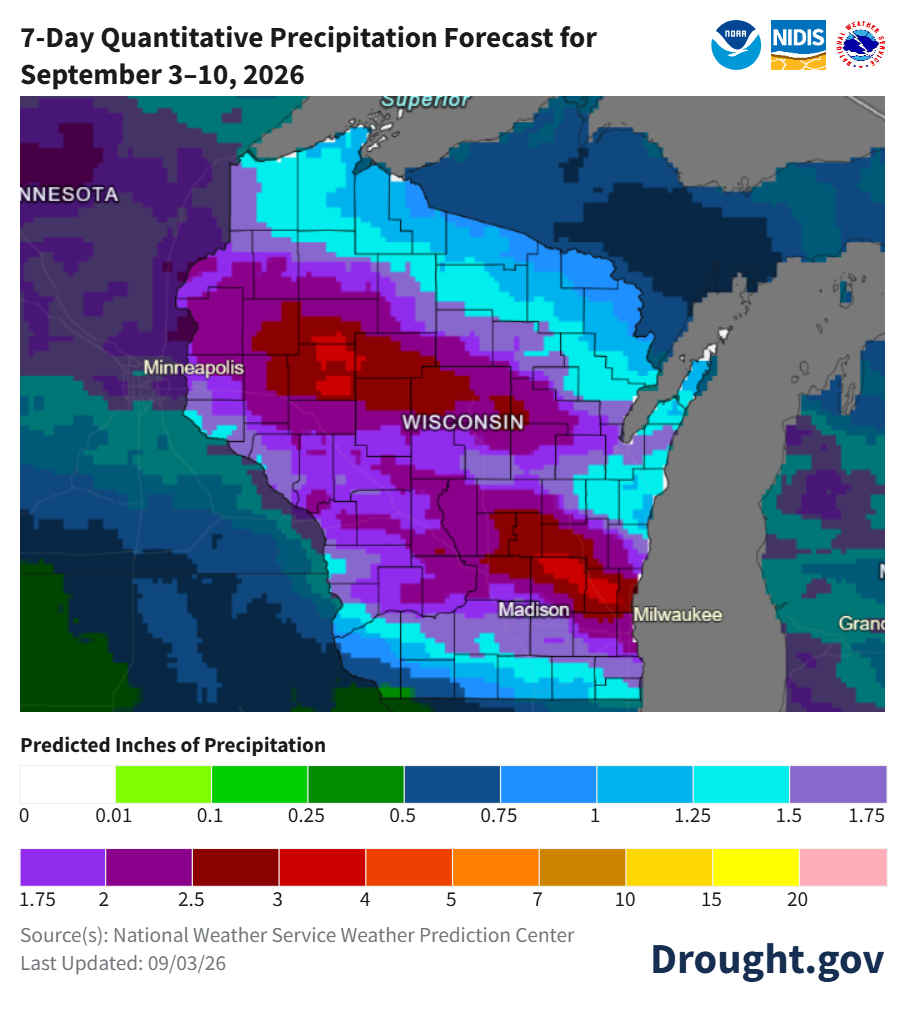
Image Description ↓
A weather map from Drought.gov, NOAA, NIDIS, and the National Weather Service showing predicted inches of precipitation from September 3 to 10, 2026. The color legend ranges from white (0 inches) up to pink (20 inches). Most of northern, central, and southwestern Wisconsin is shaded in dark red, purple, and magenta, representing predicted precipitation totals generally between 1.75 and 4 inches, with a band of red showing 3 to 4 inches across west-central to central Wisconsin. Eastern Wisconsin, including Milwaukee and areas near Lake Michigan, along with northwestern regions near Lake Superior, are shaded in cyan and light blue indicating 0.75 to 1.5 inches. The map includes city labels for Minneapolis, Madison, Milwaukee, and Superior. Source is National Weather Service Weather Prediction Center, updated September 03, 2026.
- When? – Rainfall chances are highest on Thursday (9/3), Friday (9/4), and Tuesday (9/8).
- Where? – All of Wisconsin has a chance for rain next week, with models indicating totals of over 2” for some.
- Check your local forecast for details on totals and timing.
- Average precip (1991-2020) for this week: 0.85”.
8-14 Day Temperature and Precipitation Outlook
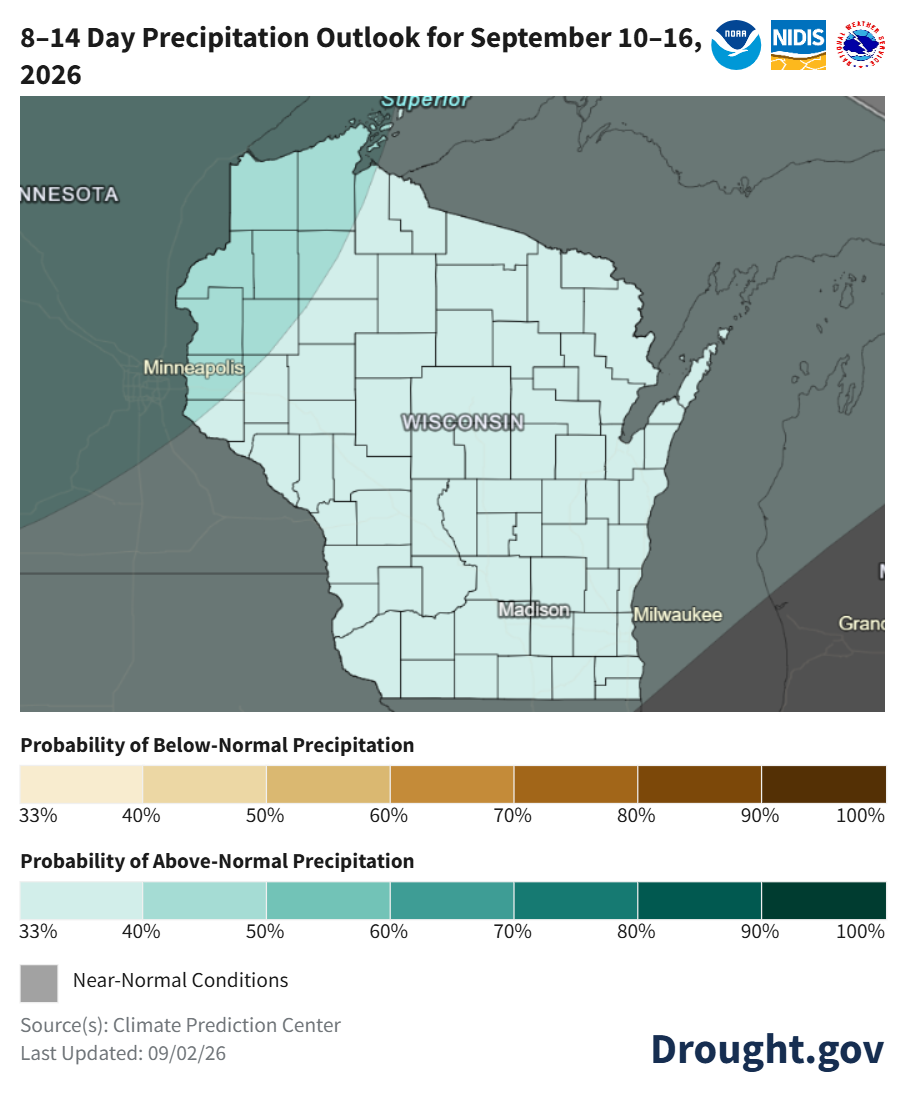
Image Description ↓
A climate prediction map from Drought.gov and NOAA displaying the 8 to 14 day precipitation outlook for Wisconsin covering September 10 to 16, 2026. The state of Wisconsin is entirely shaded in a light pale teal color. According to the bottom scale, this shading represents a 33 to 40 percent probability of above-normal precipitation. Surrounding states and areas outside Wisconsin are shaded in gray, representing near-normal conditions. Cities labeled on the map include Minneapolis, Superior, Madison, Milwaukee, and Grand Rapids. Source is the Climate Prediction Center, updated September 02, 2026.
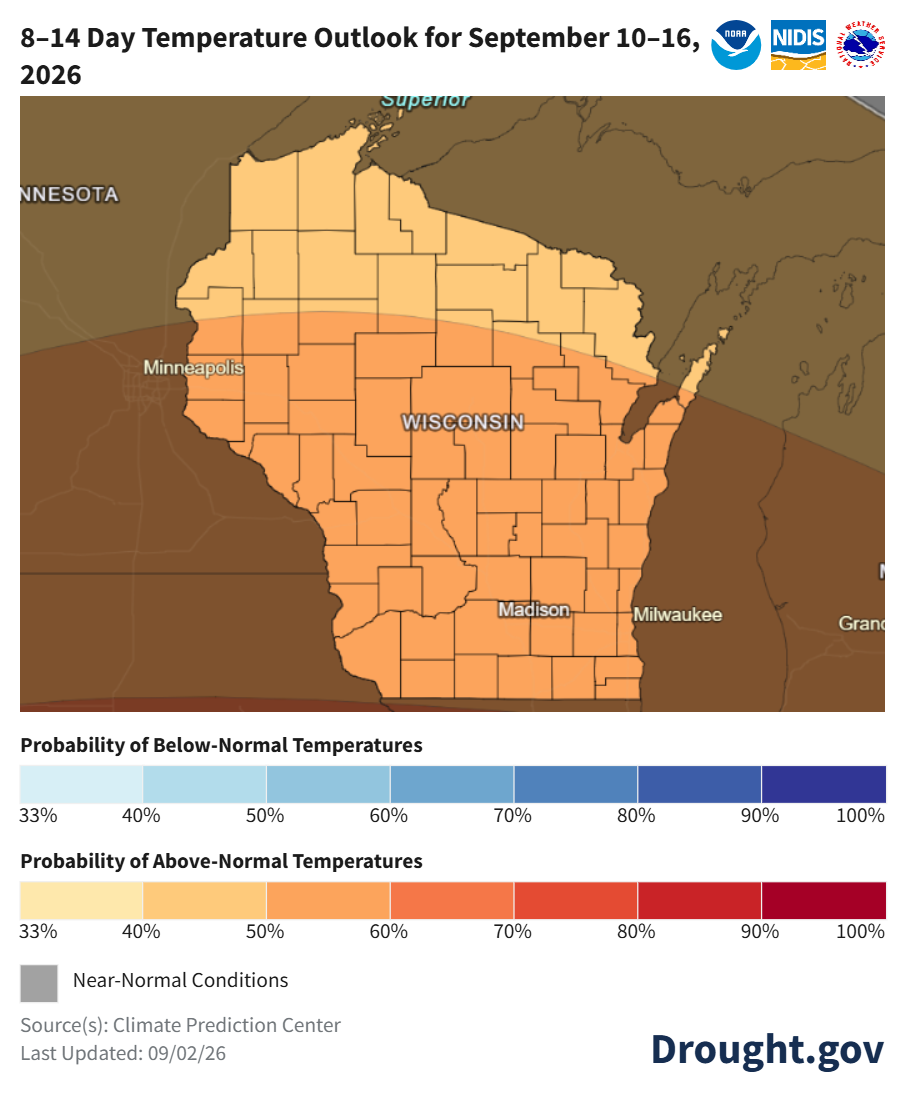
Image Description ↓
A climate prediction map from Drought.gov and NOAA showing the 8 to 14 day temperature outlook for Wisconsin from September 10 to 16, 2026. The entire state of Wisconsin is shaded in shades of light orange and soft tan. The northern half of the state is shaded in light yellow-orange representing a 40 to 50 percent probability of above-normal temperatures, while the southern half is shaded in a slightly darker orange representing a 50 to 60 percent probability of above-normal temperatures. Surrounding areas outside the main highlighted region are shaded dark brown for near-normal conditions. City markers include Superior, Minneapolis, Madison, Milwaukee, and Grand Rapids. Source is Climate Prediction Center, updated September 02, 2026.
- Mid-September: Temperatures in southern and central Wisconsin are likely to be above normal (50-60% odds), with an above-normal lean further north. Precipitation is leaning above normal statewide (33-40% odds), with a slightly higher probability in the northwest.
- Statewide normals (1991-2020) for September 10-16 are 60.6°F and 0.84”.
30 Day Temperature and Precipitation Outlook
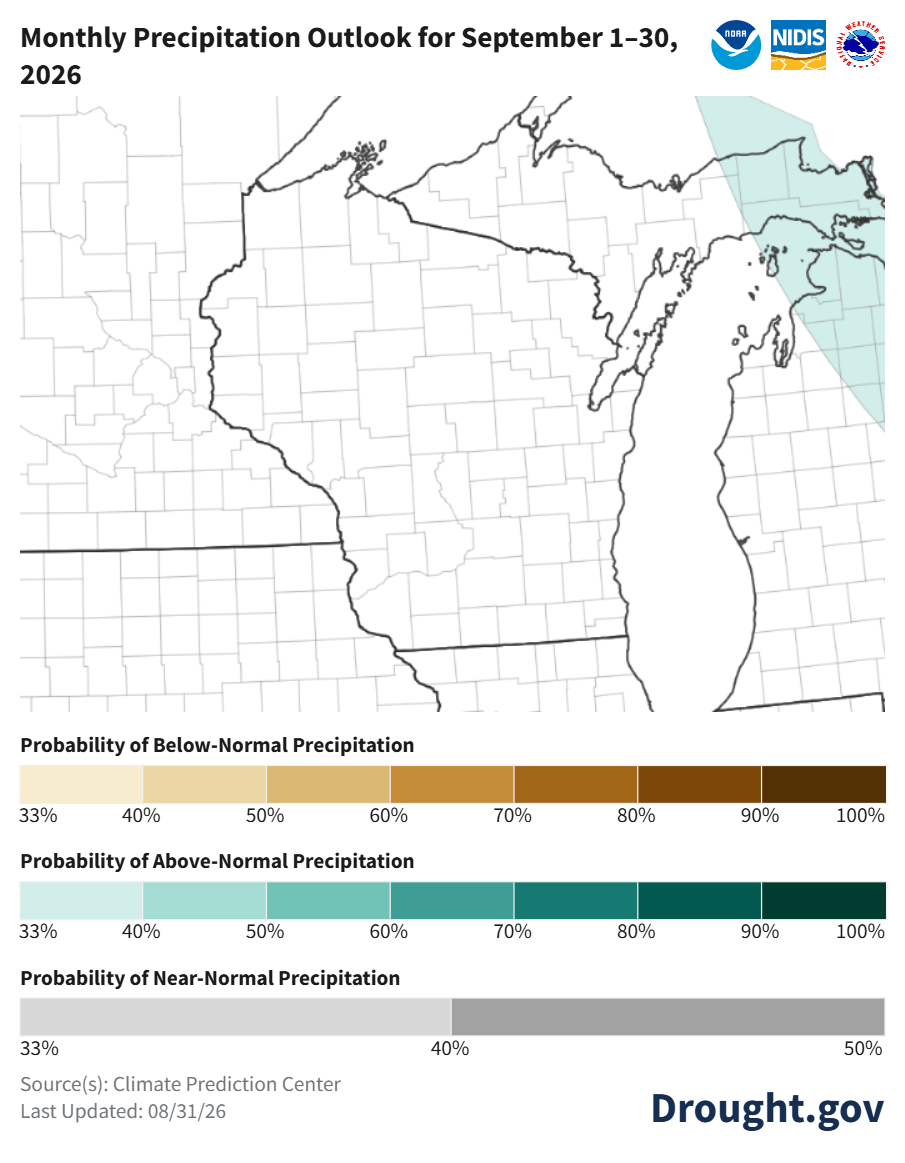
Image Description ↓
A Monthly Precipitation Outlook map from the Climate Prediction Center and Drought.gov for September 1 through 30, 2026. The entire state of Wisconsin and surrounding upper Midwest regions are unshaded white, indicating equal chances for above, below, or near-normal precipitation. Light teal shading covers parts of northern Lake Huron and Ontario, signaling a 33 to 40 percent probability of above-normal precipitation in that distant northeast zone. The legend at the bottom details color scales for below-normal, above-normal, and near-normal precipitation probabilities ranging from 33 to 100 percent. Source credits list the Climate Prediction Center, last updated August 31, 2026.
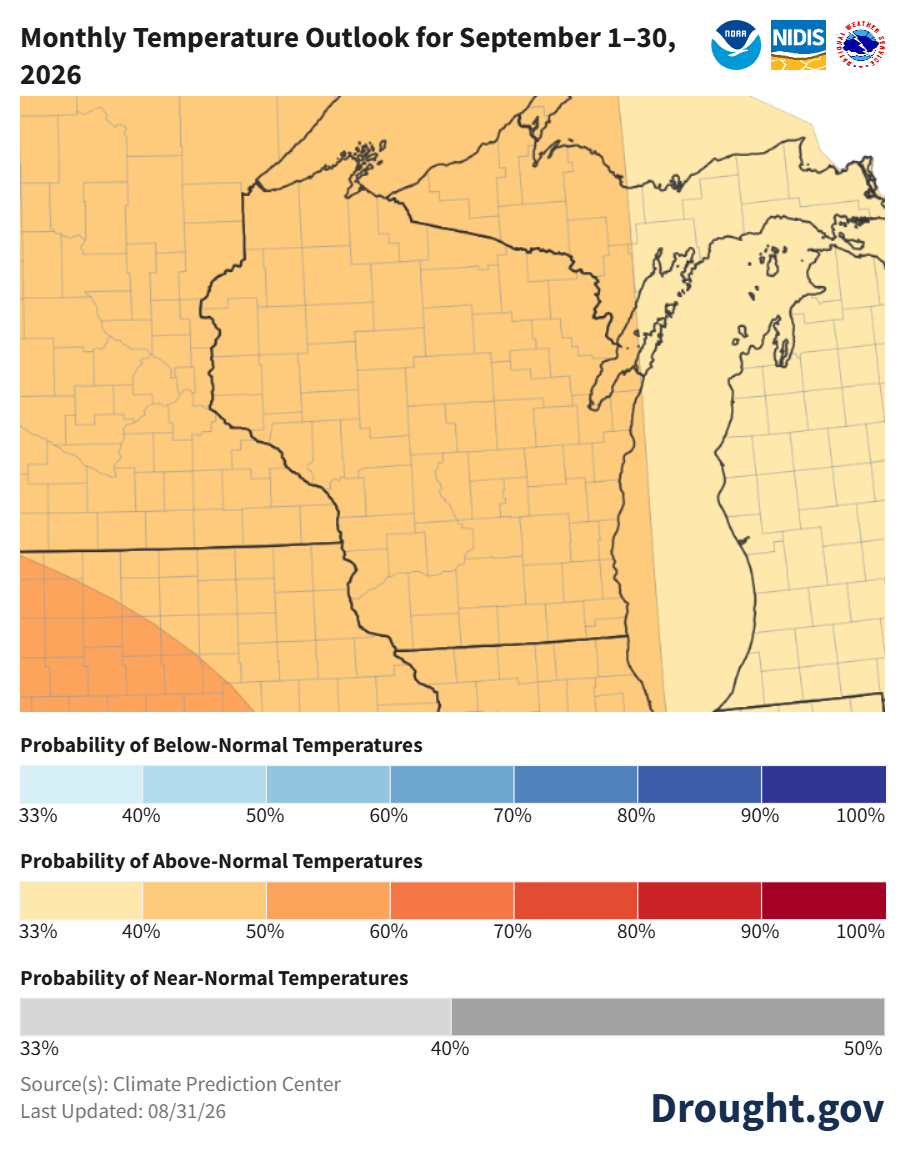
Image Description ↓
A Monthly Temperature Outlook map from the Climate Prediction Center and Drought.gov for September 1 through 30, 2026. Wisconsin, Minnesota, Iowa, and the Upper Peninsula of Michigan are covered in light orange shading, indicating a 40 to 50 percent probability of above-normal temperatures. A slightly darker orange band in southwestern Iowa and northwestern Missouri indicates a 50 to 60 percent probability of above-normal temperatures, while lighter yellow shading covers eastern Michigan and Lake Michigan, representing a 33 to 40 percent probability. The bottom legend outlines probability levels for below-normal, above-normal, and near-normal temperatures. Source credits list the Climate Prediction Center, last updated August 31, 2026.
- September: Temperatures are leaning towards above normal statewide (40-50% odds), with precipitation uncertain with “equal chances”.
- Statewide normals (1991-2020) for September 1-30 are 59.5°F and 3.59”.
90 Day Temperature and Precipitation Outlook

Image Description ↓
Seasonal (3-Month) Precipitation Outlook map for September 1 to November 30, 2026, published by Drought.gov and sourced from the Climate Prediction Center (last updated 08/20/26). The map covers Wisconsin and neighboring Upper Midwest states. Most of Wisconsin, Minnesota, Iowa, and Illinois are unshaded, indicating equal chances for above-, near-, or below-normal precipitation. A light tan shade covers eastern Michigan, representing a 33% to 40% probability of below-normal precipitation. Color scales at the bottom define probabilities ranging from 33% to 100% for below-normal (tan/brown), above-normal (teal/green), and near-normal (gray) precipitation.

Image Description ↓
Seasonal (3-Month) Temperature Outlook map for September 1 to November 30, 2026, published by Drought.gov and sourced from the Climate Prediction Center (last updated 08/20/26). The map shows the Upper Midwest region, including Wisconsin. A light yellow shade covers all of Wisconsin, Michigan’s Upper and Lower Peninsulas, Minnesota, Iowa, and northern Illinois and Indiana, indicating a 33% to 40% probability of above-normal temperatures. A white area in southern Illinois and Indiana indicates equal chances for above-, near-, or below-normal temperatures. Color scales at the bottom define probabilities ranging from 33% to 100% for below-normal (blue), above-normal (yellow/orange/red), and near-normal (gray) temperatures.
- Sep-Nov: Temperatures are leaning towards above normal (33-40% odds) for almost all of Wisconsin. Precipitation is uncertain statewide except for the far northeast (below normal lean).
- Statewide normals (1991-2020) for Sep-Nov are 46.6°F and 8.59”.
User Survey
Are you a regular user of the Ag Weather Outlook for Wisconsin (AgWOW)? Or maybe you are viewing this page for the first time this week? Either way, we want to hear your feedback on this resource! Please take a few minutes and fill out this survey. Your feedback will help us better serve your ag-weather data needs through AgWOW.
If you have any trouble accessing or filling out the survey, please email Josh Bendorf at jbendorf@wisc.edu. Thank you!