

Weather and climate conditions this week in Wisconsin
Here are this week’s take-home points about the weather. As a reminder, AgWOW reports will be published weekly throughout the growing season. Scroll down for the full report.
Additionally, we’re collecting user feedback. Regardless of whether it’s your first time here or if you are a regular user, we’d love to hear from you!
Key Points
Recent Conditions
- Temperatures were well above normal across the state last week. Most of the state was at least 6°F above normal, with 9-12°F above normal in the north and west.
- It was relatively dry week across most of Wisconsin last week. Most locations received less than 0.25” of rain, with higher totals in the northeast (0.25-1.0”).
Impact
- For Wisconet stations included in the chart and table, all experienced decreased soil moisture from last week’s report after receiving very little rain.
- Satellite-based soil moisture estimates indicate that dryness worsened across the state, with abnormally dry conditions expanding across northeast, east central, and southern counties.
- Drought (D1-D4) coverage increased by 1% from last week with 1 class degradation in the north. Extreme (D3) drought expanded by 2%.
- Corn (grain) harvest is running slightly behind the 5-year average pace, while dry conditions last week allowed for rapid progress in soybean harvest.
Outlook
- The best chances for rain over the next 7 days are on Thursday (10/15) and Friday (10/16), followed by a dry weekend and early work week.
- Late October temperatures will likely be above normal statewide, with precipitation leaning above normal.
- Temperatures will likely be above normal statewide through November into the first part of winter (Nov-Jan). Precipitation is uncertain for most of the state with “equal chances.”
Agronomic, Fruit, and Vegetable Considerations
Field Conditions
- Crop conditions are highly reflective of moisture throughout the state. Late season moisture is causing some issues with grain quality, especially in soybean. Prioritize any affected fields to ensure a timely harvest.
- Soybeans are rapidly being harvested ahead of averages with corn just slightly behind the average for mid-October.
- After harvest is a great time to take soil samples. Make plans to stay up to date with your nutrient management plan. Use a Certified Soil Lab.
Forage Management
- Use the Alfalfa Cutting Tool to plan your final cut to manage for persistence and winter survival.
- Read about the impacts of drought on alfalfa if your crop is affected.
- Silage season is almost complete, and dry down events have concluded for the year. View moistures collected from dry down events: Corn Silage Dry Down Monitoring Tool.
- If your silage crop has been impacted by drought, read these harvest considerations.
- In areas that are impacted by drought, take caution with annual forages such as sorghum-sudangrass for concerns related to nitrate toxicity.
- Consider planting a cover crop after silage. A cover crop can not only provide environmental benefits but also forage for livestock.
- Silo gas has been present again this year in various structures, potentially due to higher nitrate content in silage. Use caution when working with or near these storage structures.
Pest Management
- Scout fields to note what weed species are part of a late season flush. Pay special attention to winter annual species.
- Read the late-season field crops disease report. Diseases may be visible in corn and soybean fields, so make appropriate harvest plans if disease is present.
- Planting cover crops after grain harvest is a great way to reduce soil erosion and provide weed control.
- Reducing next year’s weed seed population can be accomplished with combine cleaning.
Manure Applications
- Reminder of Wisconsin’s NR 151 Runoff Rules with the timing of manure spreading and current runoff levels. Check DATCP Runoff Risk Advisory Forecast.
- As you conduct fall spreading, keeping field records is important to estimate crop nutrient needs. Refer to A2809 for guidance. Fall is also a great time to have manure samples analyzed for nutrient content.
Small Grains
- If you are planting winter wheat this fall, consider revisiting Small Grains Recommendations and Row Width and Seeding Rates in WI.
- Read the Top 9 Recommendations for Winter Wheat Establishment in 2026. Winter wheat planting is below average for mid-October with the planting window to maximize fall tiller growth ending. Check emerged stands for uniformity.
Fruit Considerations – General
- Fall Sanitation: Clean up weeds around trees and vines, mow aisles to allow for better light penetration to aid in decomposition of leaf/plant material.
- Fall Sanitation: After leaf drop, chop, compost, remove or burn (where permitted) fallen leaf and plant material to to limit potential for disease inoculum and any overwintering pests.
- Remember to note observable fruit damage at harvest to make adjustments in next year’s pest management plan.
- Wisconsin fruit growers can reference the Midwest Fruit Pest Management Guide for a list of registered products and recommended best practices. View the MFPMG Online.
- Reminder: Always read and follow directions on the label and keep in mind pre-harvest intervals (PHI) as we move through harvest!
Vegetable Considerations – General
- As fall weather gets colder you can still plant a cold tolerant cover crop such as cereal rye. Be sure to have a plan for terminating your cover crop before you plant. Consider your goals for your cover crop, and plan accordingly for the right amount of biomass to meet those goals.
- Consider how you can prepare for a strong El Niño this winter. This article from University of Minnesota Extension has tips including increased pest monitoring and planning for potential warm and wet spring conditions
- With frost moving in across the state, there’s still time to plant your fall garlic. Planting should occur within 1-2 weeks of the first fall frost for optimum growth.
Vegetable Considerations – Disease
- Continue to monitor for post-harvest storage issues on vegetables which could include soft rots and gray mold. Optimal storage conditions vary by crop, so be sure to know the right conditions for every crop.
Vegetable Considerations – Insects
- Pest management for next year’s crops starts this fall as many insects and diseases overwinter on crop residue. Residue management (either removing or tilling in residue) can help reduce next year’s pest and disease pressure. Pests include asparagus beetles, crucifer flea beetles, imported cabbage worms, squash bugs, onion maggots, and more.
Dive deeper into each report section by clicking a topic below.
Precipitation Trends
7 Day Precipitation
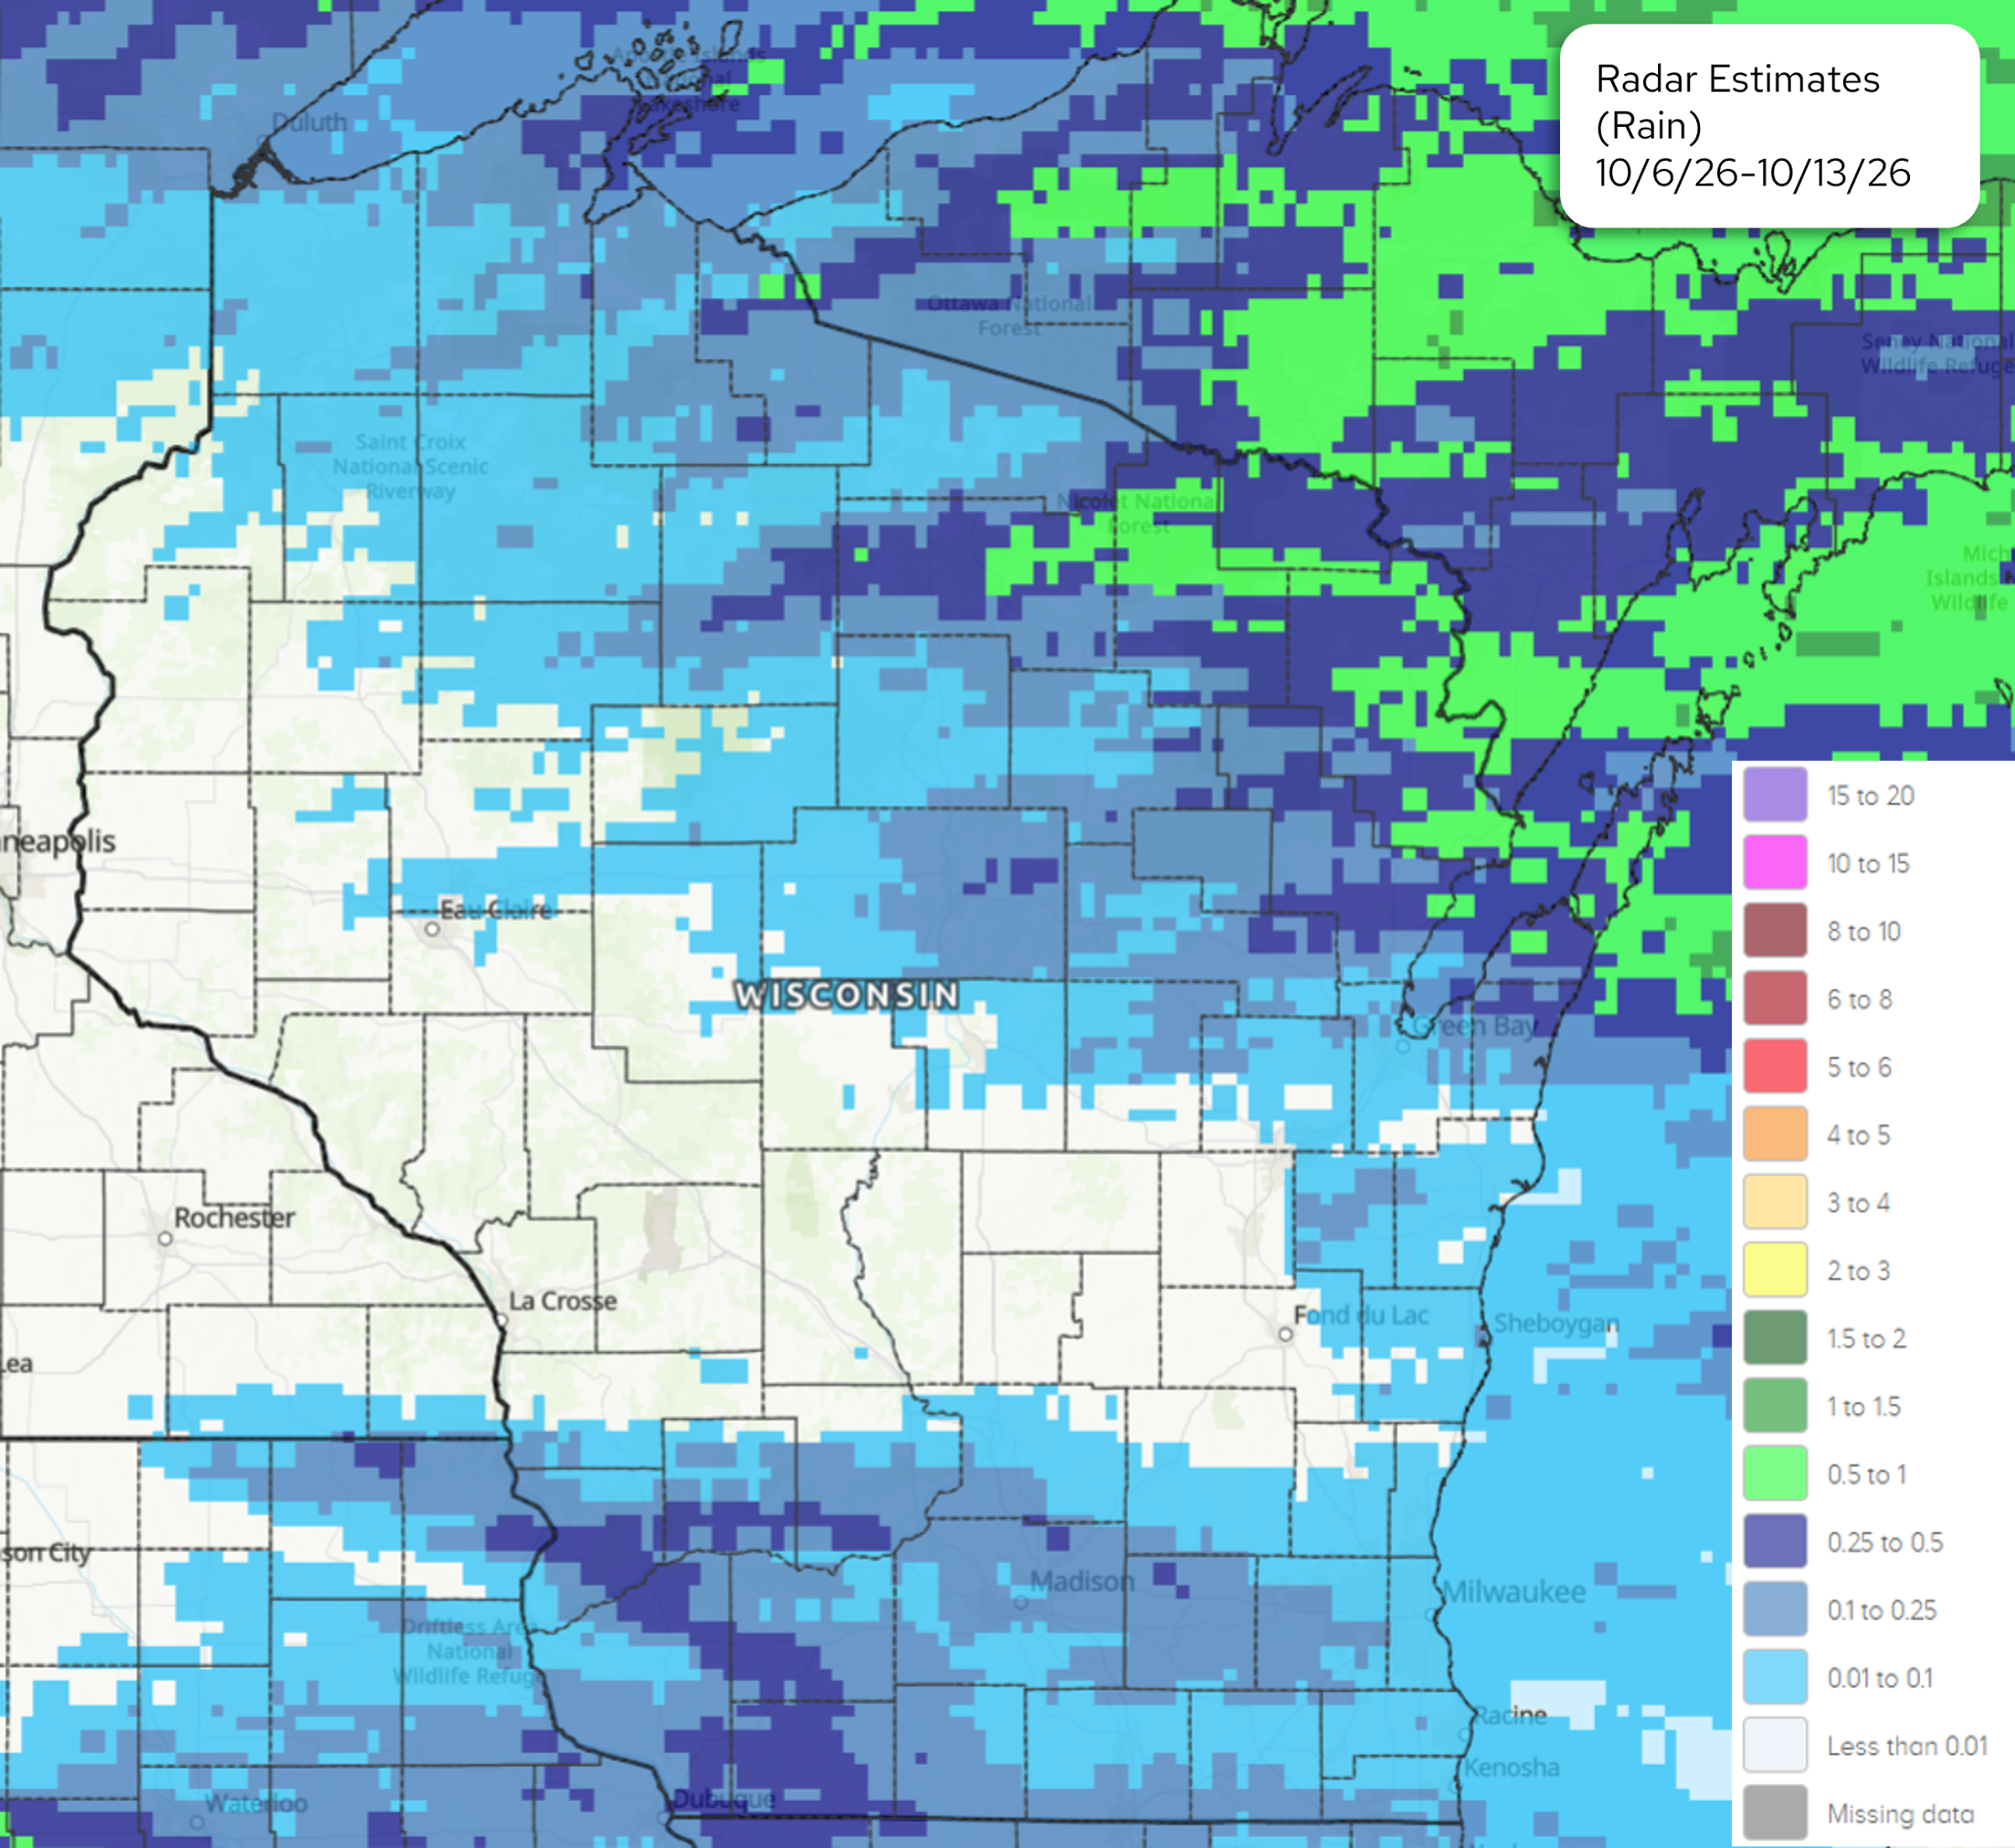
Image Description ↓
Long Description: Regional radar-estimated rainfall map covering Wisconsin and surrounding areas from October 6, 2026, to October 13, 2026. Western and southwestern Wisconsin, including La Crosse and areas near Minneapolis and Rochester, experienced less than 0.01 inches of rain (white area). Central Wisconsin received between 0.01 and 0.25 inches (light blue shading), while eastern and northeastern Wisconsin received between 0.25 and 1.0 inches of precipitation (dark blue and bright green shading). Cities referenced on the map include Eau Claire, Green Bay, Madison, Milwaukee, La Crosse, Racine, and Kenosha.
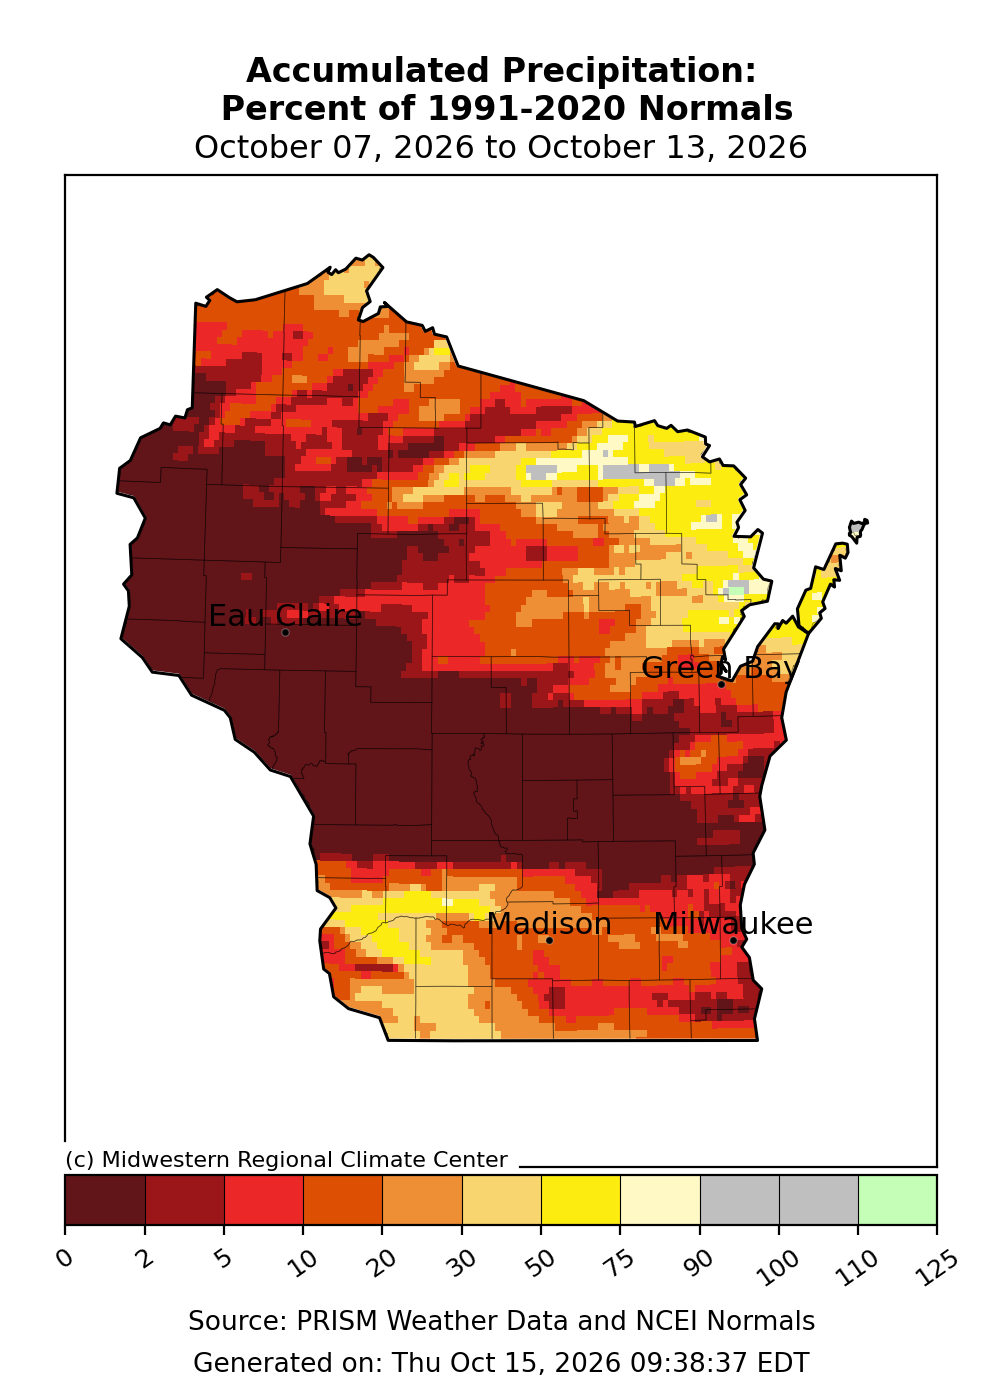
Image Description ↓
A precipitation map titled Accumulated Precipitation: Percent of 1991-2020 Normals covering October 07, 2026, to October 13, 2026. Most of western, central, and northern Wisconsin, including Eau Claire, are colored dark red and brown, indicating precipitation levels between 0 and 10 percent of normal. Eastern and southern regions, including Green Bay, Madison, and Milwaukee, show precipitation ranging from 20 to 75 percent of normal (orange to yellow). Small isolated pockets along the eastern border reach 90 to 100 percent (grey/light green). Text credits include (c) Midwestern Regional Climate Center, Source: PRISM Weather Data and NCEI Normals, Generated on: Thu Oct 15, 2026, 09:38:37 EDT. A color legend scale at the bottom runs from 0 to 125 percent.
- It was relatively dry week across most of Wisconsin last week. Most locations received less than 0.25” of rain.
- Totals were highest in the northeast, where 0.25-1.0” of rain was common. These totals were 50-100% of normal.
- Locations in the southwest received rainfall totals of up to 0.5” (30-75% of normal).
- Highest Wisconet station total from last week: 0.78” (Fence, Florence County). Totals in Florence County were as high as 90-110% of normal.
30 Day Precipitation
- Counties south of Wausau commonly received 3-8”, with pockets of 8-10” in the southwest and south-central regions. These totals were 110-200% of normal for most, with 200-300% in the far south/southwest.
- Across northern Wisconsin, conditions were dry. Most locations saw 2” or less of rain (≤50% of normal). The driest locations were along the Michigan border (1” or less).
90 Day Precipitation
- In the southern 2/3 of the state, totals ranged from 7.5-15” for most, with localized areas of 15-20”. Rainfall totals in this region were near to above average (90-150%).
- Northern counties were the driest, with most locations receiving totals that were at or below 75% of normal.
2026 Precipitation
- Southern and central counties – 2-8” above normal for the year.
- Far north and northwest counties – 4-12” below normal for the year.
Soil Moisture and Temperature Trends
Soil Moisture Models
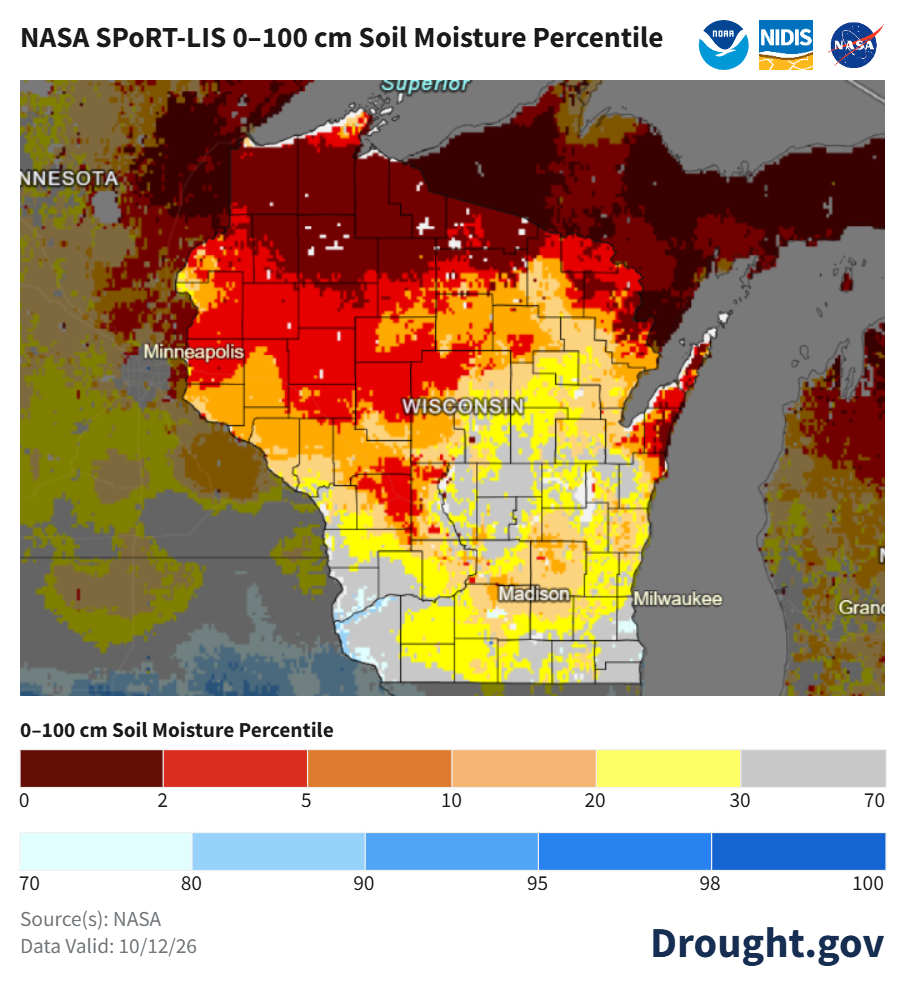
Image Description ↓
Map displaying NASA SPoRT-LIS 0-100 cm Soil Moisture Percentile for Wisconsin, valid October 12, 2026, sourced from NASA, NOAA, and NIDIS on Drought.gov. The map highlights widespread dry conditions across northern Wisconsin, where soil moisture remains critically low in the 0 to 5th percentile category (dark brown and red). Central and southwestern portions reflect 10th to 20th percentile levels (orange and yellow), while localized pockets in the far south around Madison show near-normal values in the 30th to 70th percentile range (gray).
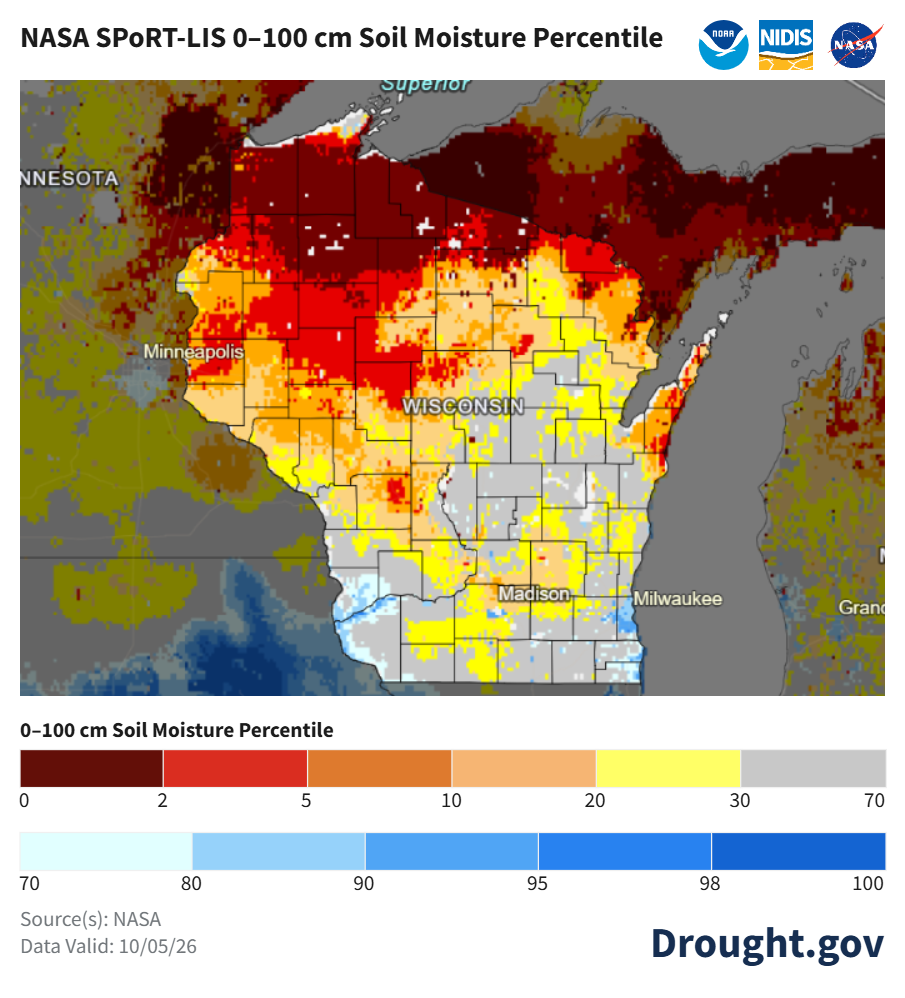
Image Description ↓
NASA SPoRT-LIS map from Drought.gov displaying 0 to 100 cm soil moisture percentiles across Wisconsin, valid October 5, 2026. Dryness has expanded compared to the previous week, with northern and western regions covered in dark red and red shading (0 to 5th percentile). Central and southwestern regions range from 5th to 30th percentiles (orange and yellow), while small areas in the far south near Madison and along Lake Michigan remain in the 30th to 70th percentile range.
- Satellite-based soil moisture estimates indicate that dryness worsened across the state, following a relatively dry week.
- Abnormally dry conditions have expanded across northeast, east central, and southern counties.
- Far northern counties remain much drier than normal for early October.
- Notes on how to interpret the maps:
- Red areas = top 5 driest in 100 years.
- Dark red areas = top 2 driest in 100 years.
- Dark blue areas = top 2 wettest in 100 years.
Wisconet Soil Moisture
- For Wisconet stations included in the chart and table, all experienced decreased soil moisture from last week’s report after receiving very little rain. Most stations received less than 0.2” of rain.
- Stations included in the chart and table that are currently in D1 drought are Suring (Oconto), Marshfield (Marathon), and Osseo (Trempealeau).
- Stations included in the chart and table that are currently in D2 drought are River Falls (Pierce) and Rice Lake (Barron).
- The table (below) shows total precipitation and changes in plant available water from October 5th (Start) to October 12th (End).
- What is plant available water? To learn more, read this article from UW Extension Ag Water Quality on plant available water. There is also a webinar from UW Extension on soil water management that you can watch.
- Example: Imagine that you have 4 inches of soil in the bottom of a bucket. In that soil, there are 1.5 inches of plant available water. Therefore, if you removed the soil and left only the water available for plant roots to take up, you would have 1.5 inches of water in the bottom of the bucket.
- The wilting point is when plant available water is at 0 inches, and the plant can no longer access water at that depth in the soil.
| Wisconet Station | County | Total Precipitation (in.) | 4″ Start | 4″ End | 8″ Start | 8″ End | 20″ Start | 20″ End |
|---|---|---|---|---|---|---|---|---|
| Arlington | Columbia | 0.18 | 0.81 | 0.71 | 1.59 | 1.49 | 3.91 | 3.81 |
| Brillion | Calumet | 0.05 | 0.66 | 0.40 | 1.40 | 1.05 | 4.07 | 3.63 |
| Hancock | Waushara | 0.00 | 0.01 | 0.00 | 0.07 | 0.02 | 0.07 | 0.02 |
| Lancaster | Grant | 0.15 | 0.94 | 0.83 | 1.94 | 1.78 | 5.04 | 4.88 |
| Marshfield | Marathon | 0.04 | 0.92 | 0.65 | 2.03 | 1.77 | 5.06 | 4.80 |
| Osseo | Trempealeau | 0.00 | 0.56 | 0.29 | 1.31 | 0.93 | 4.08 | 3.59 |
| Porter | Rock | 0.02 | 1.00 | 0.85 | 2.00 | 1.85 | 4.88 | 4.73 |
| Rice Lake | Barron | 0.00 | 0.27 | 0.09 | 0.64 | 0.36 | 1.32 | 1.02 |
| River Falls | Pierce | 0.00 | 0.33 | 0.16 | 1.00 | 0.60 | 1.00 | 0.60 |
| Suring | Oconto | 0.26 | 0.28 | 0.13 | 0.48 | 0.26 | 0.48 | 0.26 |
| Walworth | Walworth | 1.04 | 1.04 | 1.95 | 2.05 | 1.92 | 5.07 | 4.94 |
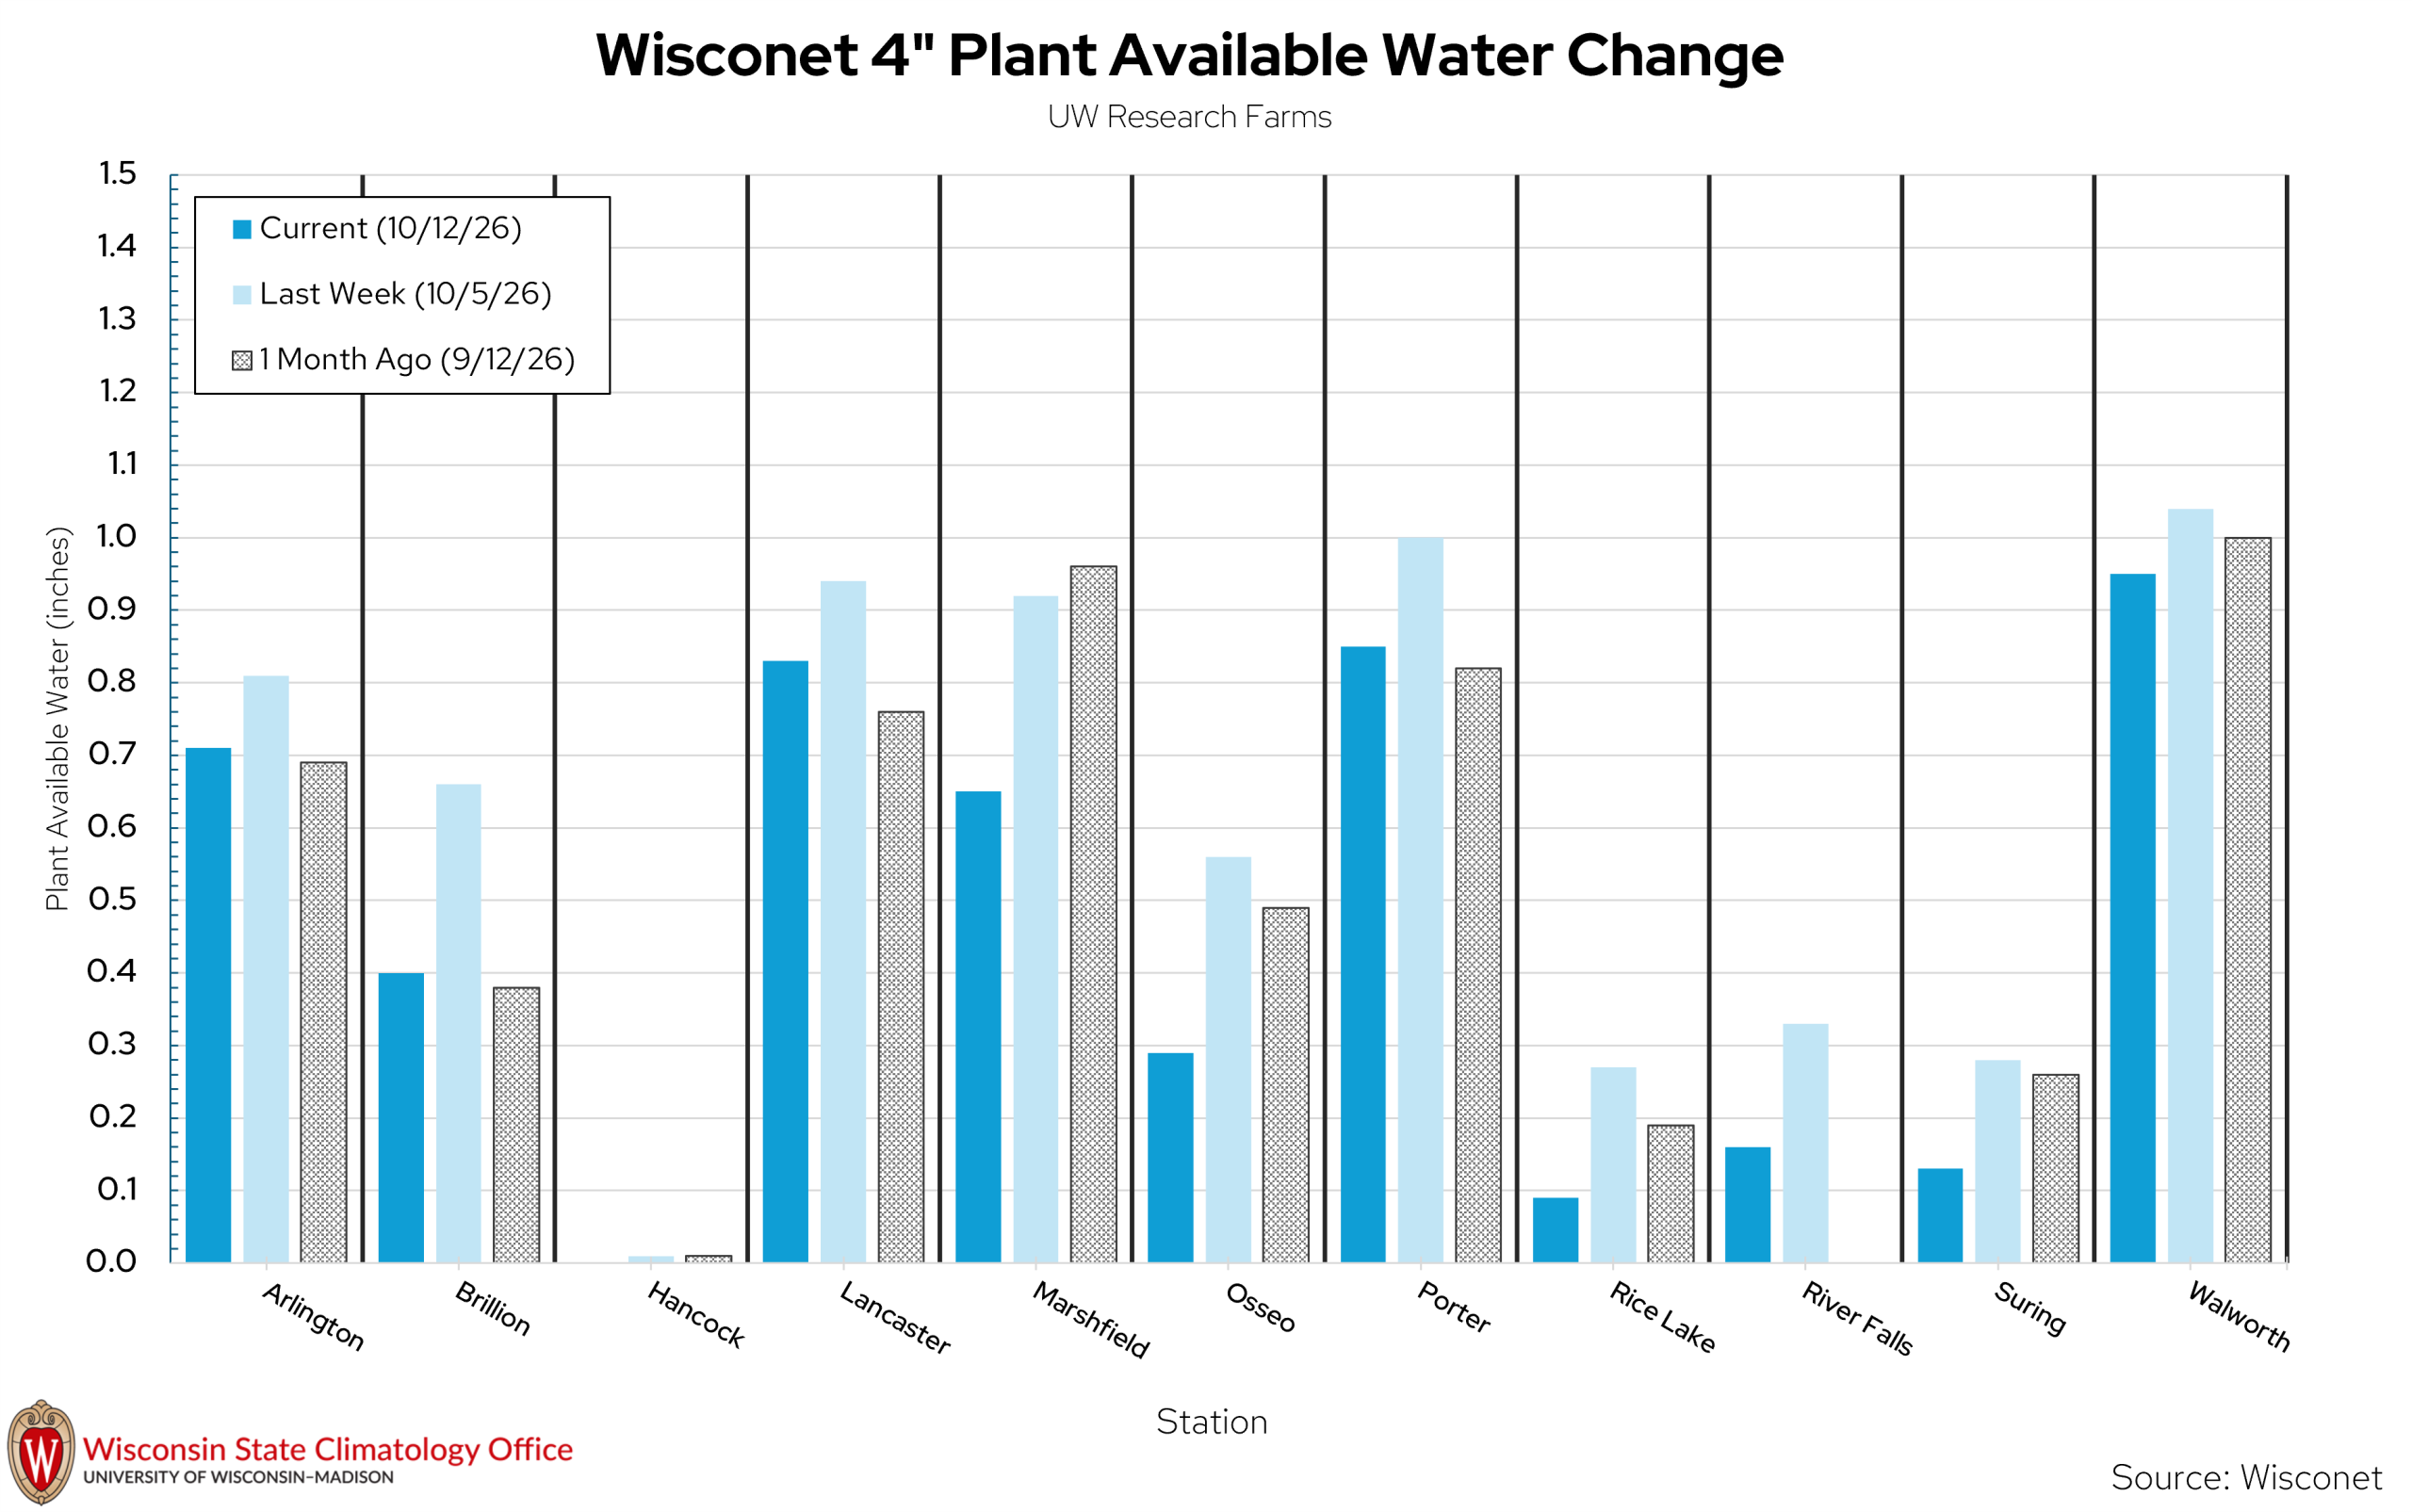
| Wisconet Station | Current 4″ Soil Moisture | Last Week’s 4″ Soil Moisture | 1 Month Ago 4″ Soil Moisture |
|---|---|---|---|
| Arlington | 0.71 | 0.81 | 0.69 |
| Brillion | 0.40 | 0.66 | 0.38 |
| Hancock | 0.00 | 0.01 | 0.01 |
| Lancaster | 0.83 | 0.94 | 0.76 |
| Marshfield | 0.65 | 0.92 | 0.96 |
| Osseo | 0.29 | 0.56 | 0.49 |
| Porter | 0.85 | 1.00 | 0.82 |
| Rice Lake | 0.09 | 0.27 | 0.19 |
| River Falls | 0.16 | 0.33 | 0.00 |
| Suring | 0.13 | 0.28 | 0.26 |
| Walworth | 0.95 | 1.04 | 1.00 |
USDA Soil Moisture Reports
- 67% and 66% of agricultural soils in the state are reported as having adequate topsoil and subsoil moisture, respectively. Both values increased from the previous week.
- 20% and 24% of agricultural soils in the state are reported as having short to very short topsoil and subsoil moisture, respectively. Both values decreased from the previous week.
Wisconet Soil Temperature
- At 4”, 8” and 20” depth – temperatures range form the upper 50s to upper 60s.
U.S. Drought Monitor
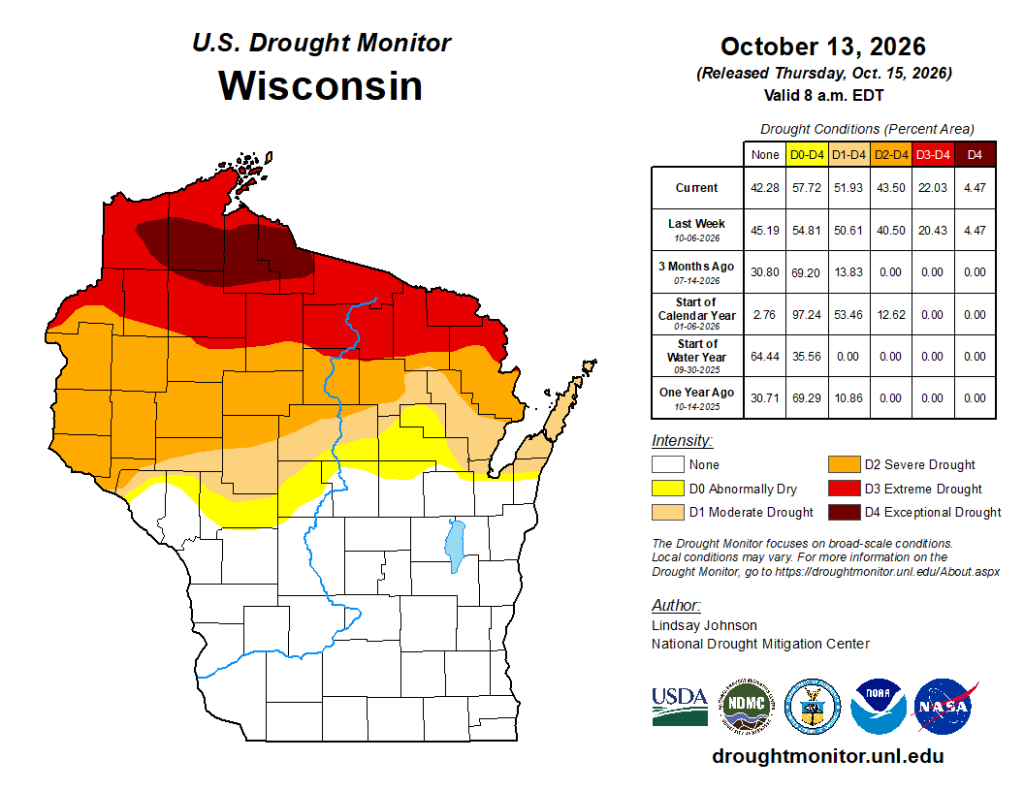
Image Description ↓
U.S. Drought Monitor map of Wisconsin released on October 15, 2026, with data valid for October 13, 2026. The map shows northern Wisconsin affected by D2 Severe Drought (orange), D3 Extreme Drought (red), and a zone of D4 Exceptional Drought (dark brown) near the upper border, while central Wisconsin experiences D0 Abnormally Dry (yellow) and D1 Moderate Drought (tan) conditions, and southern Wisconsin shows no drought (white).
Compared to last week:
- Midwest: Drought coverage and severity worsened from last week’s report. 1 class degradations were noted across portions of WI and MI, as well as in southern states.
- 70.1% of the Midwest region is drought free (~29.9% in D1-D4).
- Wisconsin: Drought (D1-D4) coverage increased by 1% from last week with 1 class degradation in the north. Extreme (D3) drought expanded by 2%.
U.S. Drought Monitor Time Series
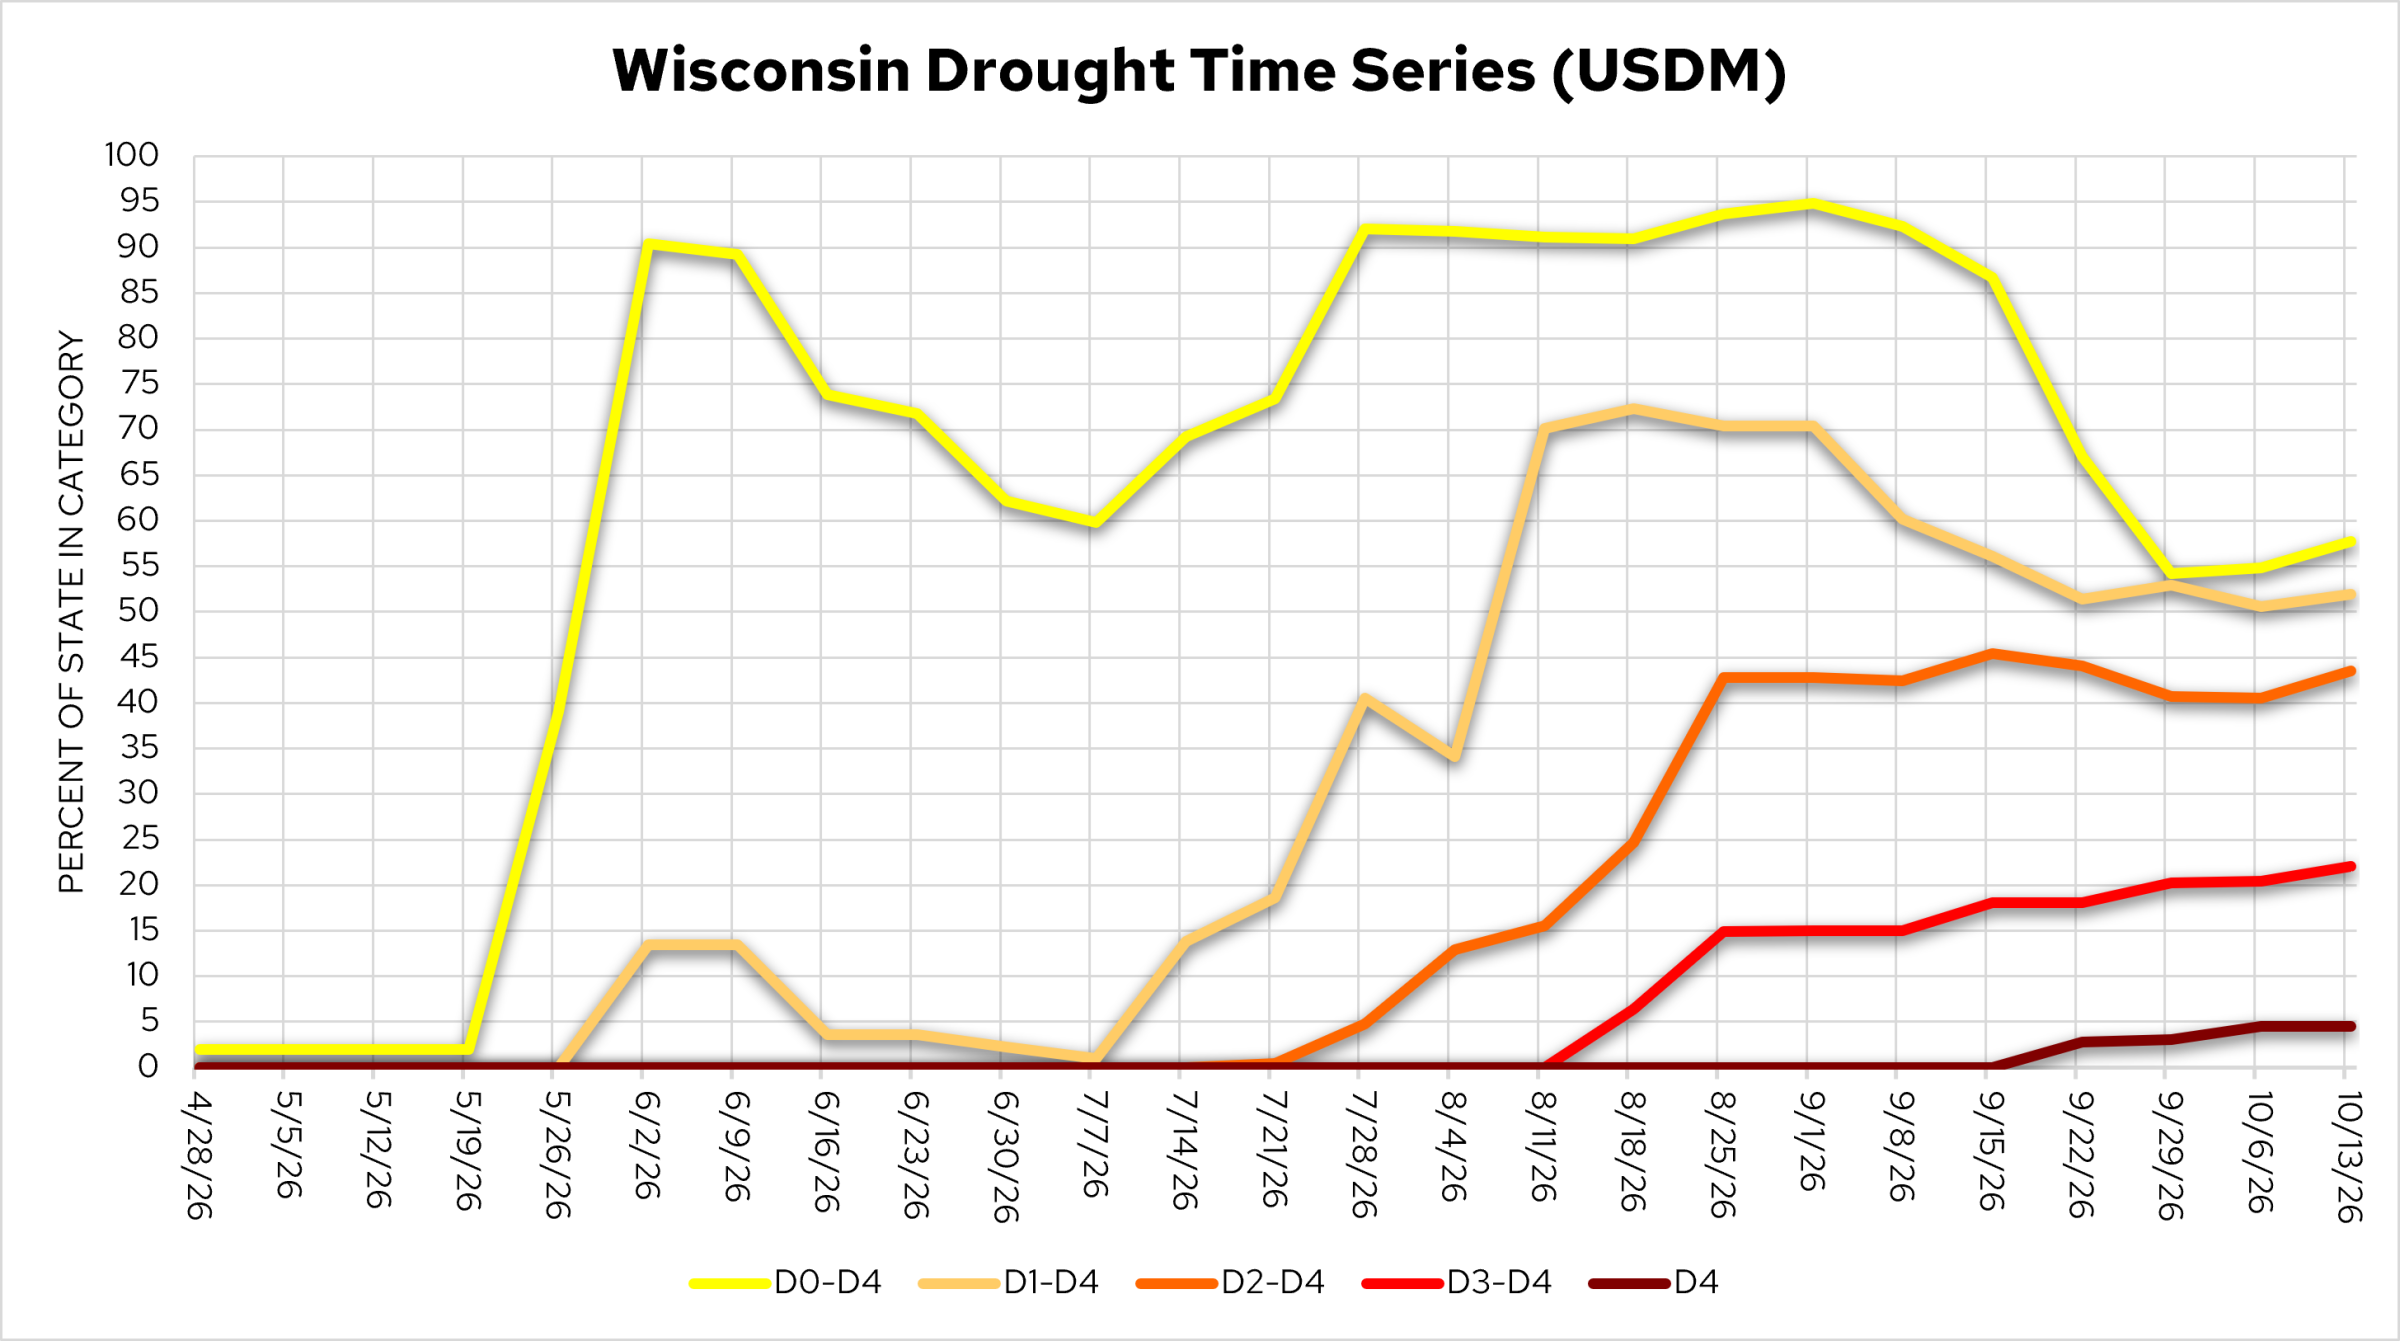
Image Description ↓
A line graph titled Wisconsin Drought Time Series (USDM) tracking percent of state in category on the y-axis (0 to 100) across dates from 4/28/26 to 10/13/26 on the x-axis. The D0-D4 line (yellow) spikes sharply from under 5 percent in mid-May to around 90 percent in early June, remains high through August around 90–95 percent, and declines to roughly 57 percent by mid-October. The D1-D4 line (tan) rises to around 13 percent in June, drops in early July, then rises sharply in late July to peak near 72 percent in mid-August, tapering to around 52 percent in October. The D2-D4 line (orange) climbs steadily starting in late July, reaching about 43 percent by October 13. The D3-D4 line (red) appears in mid-August, climbing to roughly 22 percent by October 13. The D4 line (dark brown) emerges in late September and reaches nearly 4.5 percent by October 13.
Temperature Trends
7 Day Temperatures
- Average temperatures were in the low to mid-60s across the south and west. Further north, temps were in the upper 50s.
- Temperatures were well above normal across the state last week. Most of the state was at least 6°F above normal, with 9-12°F above normal in the north and west.
30 Day Temperatures
- Average temperatures were in the low to mid-to upper 50s across most of the state.
- Temperatures were 2-4°F above normal across most of Wisconsin.
Growing Degree Days (Base 50°F)
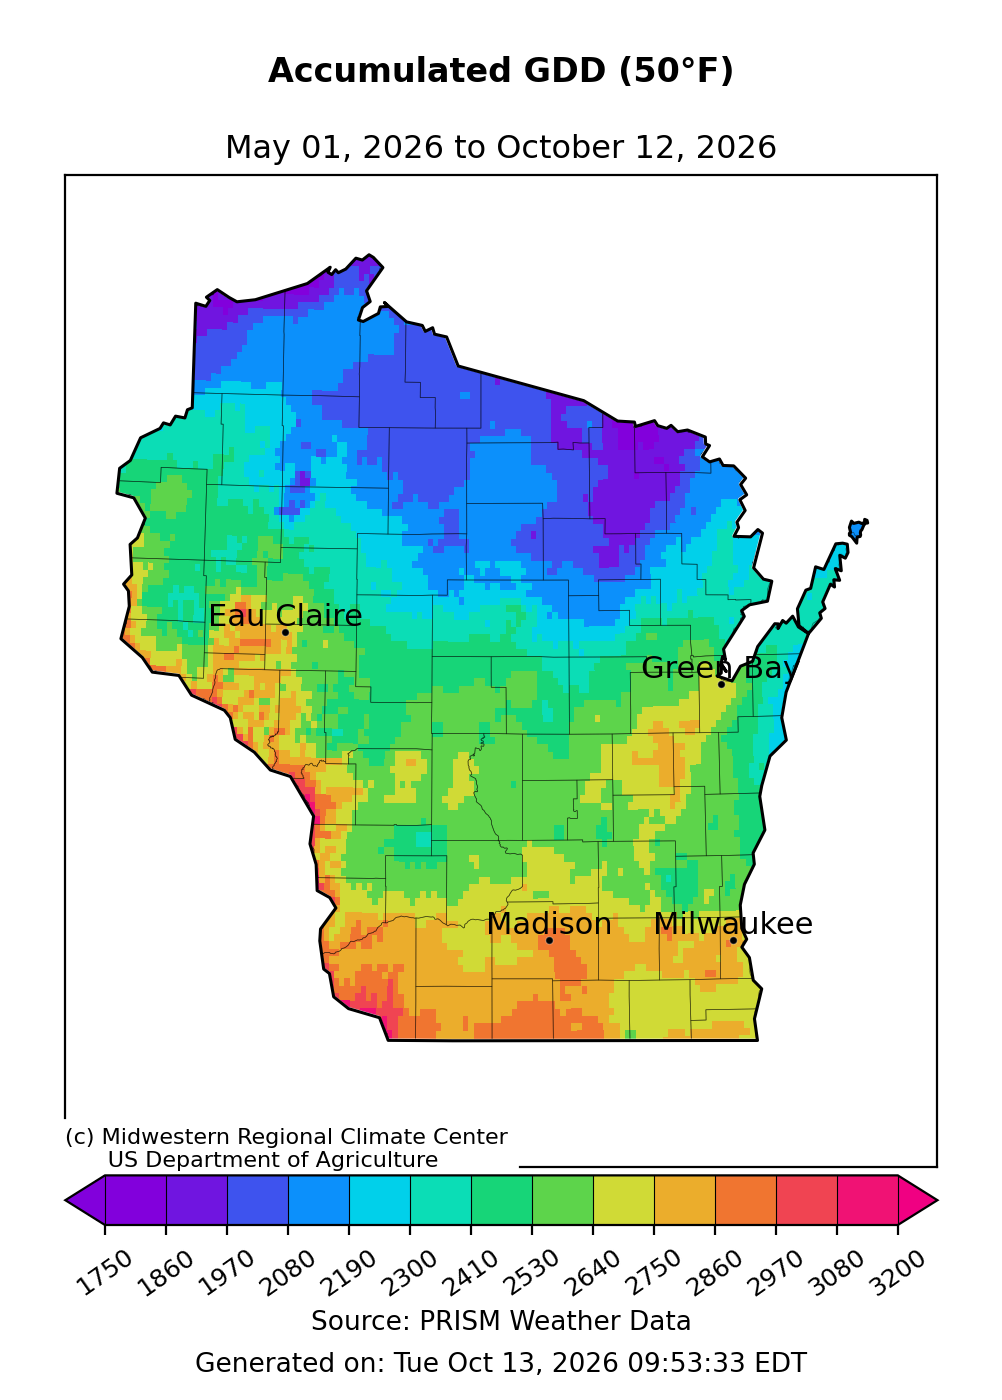
Image Description ↓
Map of Wisconsin showing Accumulated Growing Degree Days with a base of 50 degrees Fahrenheit from May 01, 2026, to October 12, 2026, produced jointly by the Midwestern Regional Climate Center and the US Department of Agriculture using PRISM Weather Data. The values follow a north-to-south gradient, with northernmost areas recording under 1,860 GDD (purple and blue shading), central areas around Green Bay and Eau Claire accumulating between 2,190 and 2,640 GDD (teal to light green shading), and southern regions near Madison and Milwaukee reaching 2,750 to over 2,970 GDD (orange and red shading).
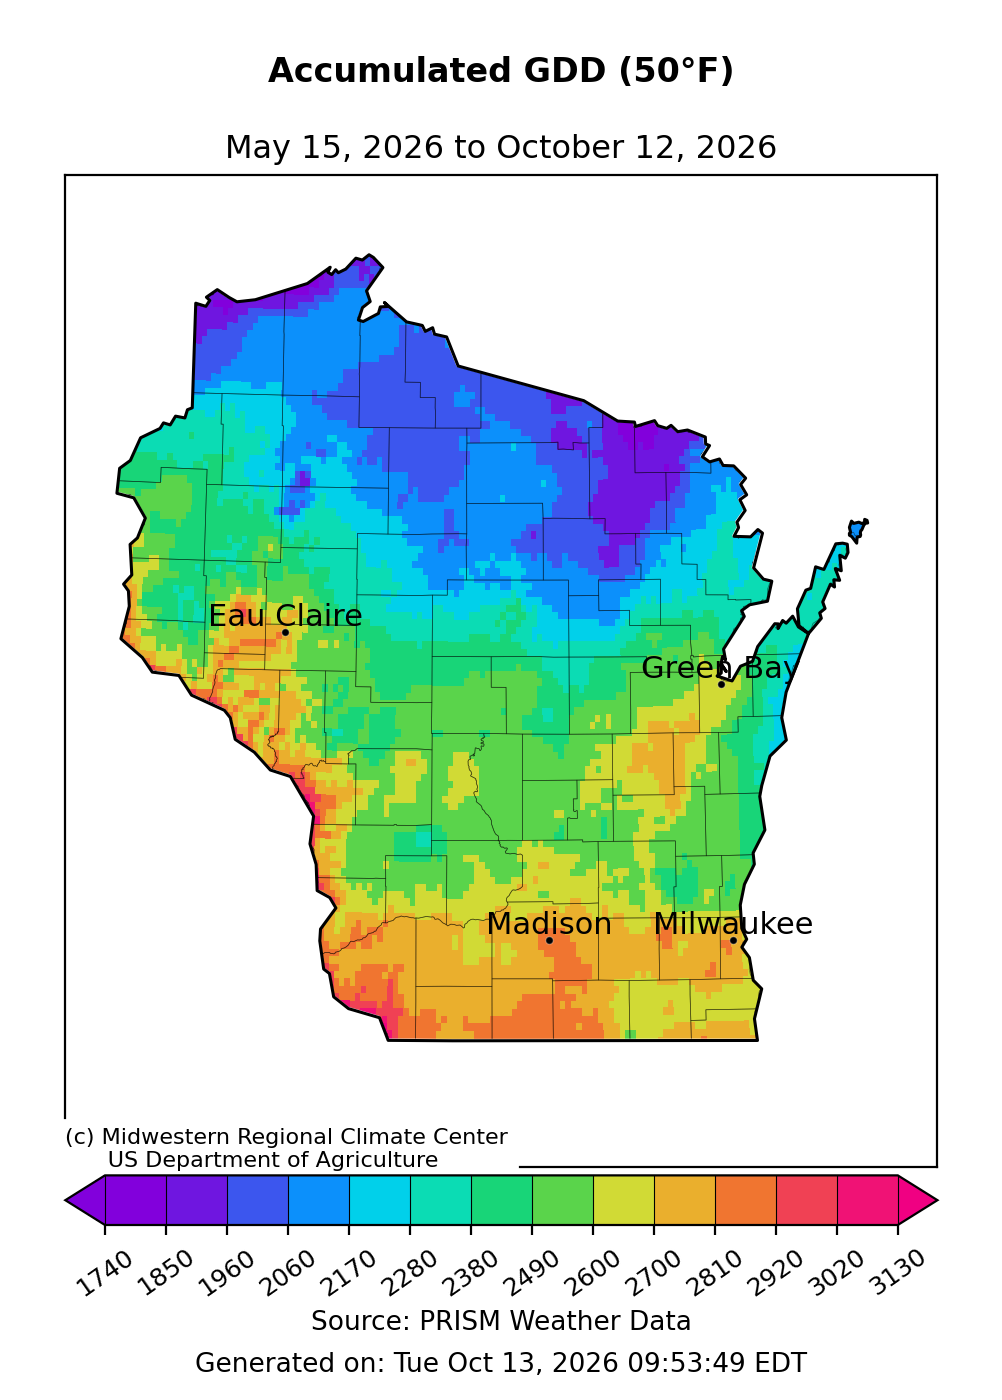
Image Description ↓
Map of Wisconsin showing Accumulated Growing Degree Days with a base of 50 degrees Fahrenheit from May 15, 2026, to October 12, 2026, generated by the Midwestern Regional Climate Center and the US Department of Agriculture. Northern regions show lower GDD accumulation ranging from 1,740 to 2,060 (purple and blue shading), central areas around Eau Claire and Green Bay show 2,170 to 2,490 GDD (teal to green shading), and southern regions around Madison and Milwaukee show higher accumulation from 2,600 to 2,920+ GDD (yellow, orange, and red shading).
- Starting May 1 – Growing degree day accumulation ranges from 3080 GDD in the far south and west to 2080 GDD in the far north. These values are 110-115% of normal.
- Starting May 15 – Growing degree day accumulation ranges from 3020 GDD in the far south and west to 2060 GDD in the far north. These values are 110-115% of normal.
Crop Progress and Condition
NASS Progress Report – October 11, 2026
- Wisconsin had 6.1 days suitable for fieldwork statewide. A dry week led to quick progress harvesting crops.
- 97% of the state’s soybeans are dropping leaves, with 54% of soybeans harvested.
- Corn is 89% at maturity and 16% harvested.
- Corn silage harvest is 95% complete.
- Corn and soybean conditions are 58% and 55% good to excellent, respectively. Both values are down from last week’s report.
- Winter wheat is 60% planted and 32% emerged.
- Pasture and range were rated 40% good to excellent, unchanged from last week.
- Read the full USDA report.
Forecasts and Outlooks
7 Day Precipitation Forecast
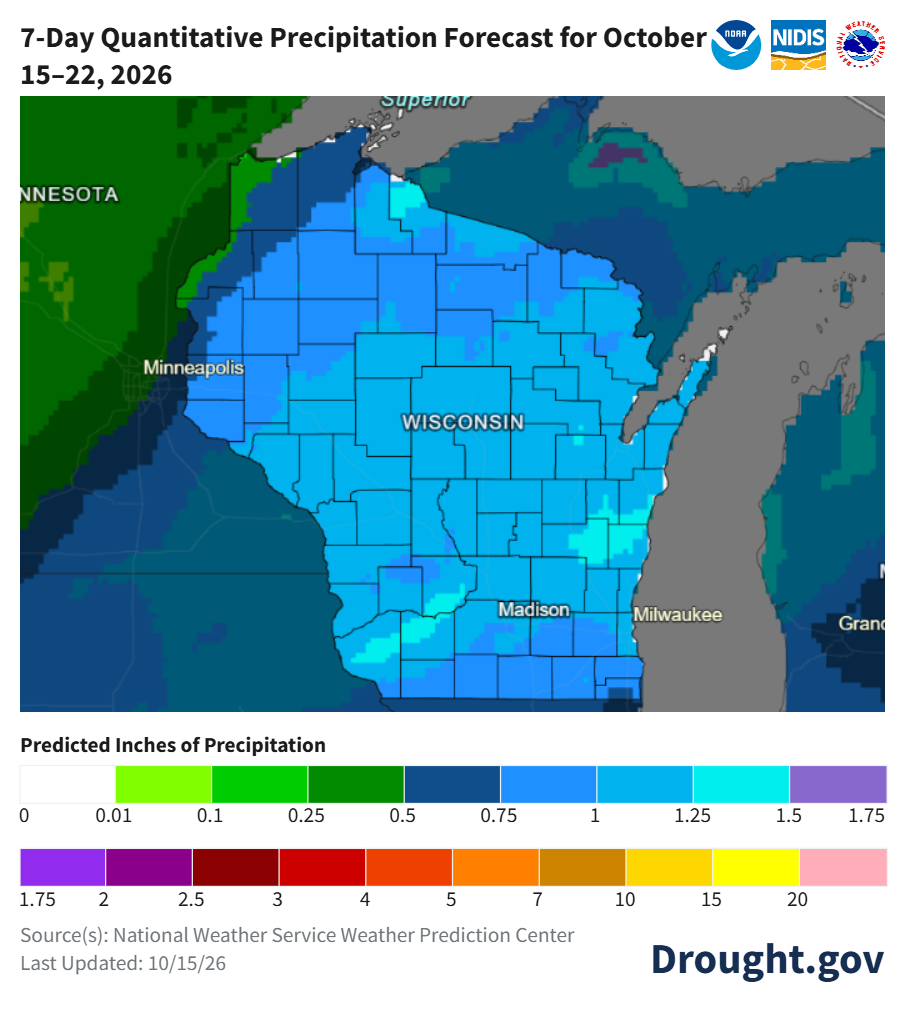
Image Description ↓
A weather map titled 7-Day Quantitative Precipitation Forecast for October 15–22, 2026, published by NOAA, NIDIS, and the National Weather Service. The map displays Wisconsin shaded in shades of light and medium blue, representing expected rainfall totals between 0.5 inches and 1.25 inches across the entire state. Cities marked include Minneapolis, Superior, Madison, and Milwaukee. The bottom legend shows Predicted Inches of Precipitation with a color scale from 0 to 20 inches. Metadata states Source(s): National Weather Service Weather Prediction Center, Last Updated: 10/15/26, and lists Drought.gov.
- When? – The best chances for rain are on Thursday (10/15) and Friday (10/16), followed by a dry weekend and early work week.
- Where? – Models indicate rain chances across the state for the upcoming week, with lesser chances in the far northwest.
- Average precip (1991-2020) for this week: 0.67”.
7 Day Frost/Freeze Outlook
- Overnight lows on Friday night into Saturday morning (10/16-10/17) could dip below freezing across most of Wisconsin.
- Chance of a below-freezing overnight low before October 22nd → ≥90% in northern counties; 75-99% in southern counties (odds are lower closer to Lake Michigan and the Mississippi River)
- To get the latest 7-day frost and freeze guidance, check out the NWS Frost Freeze Decision Support Services Page.
8-14 Day Temperature and Precipitation Outlook
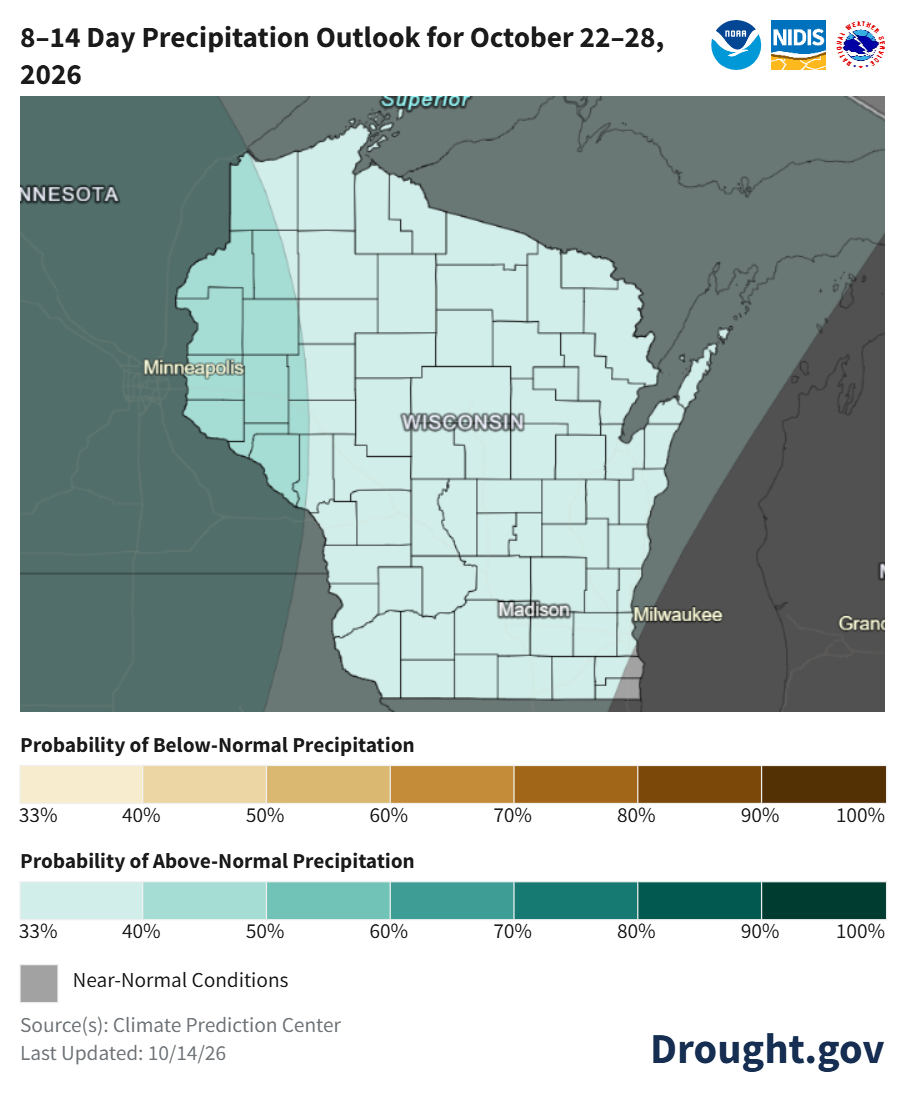
Image Description ↓
A climate forecast map titled 8–14 Day Precipitation Outlook for October 22–28, 2026, from NOAA, NIDIS, and the National Weather Service. The state of Wisconsin is shaded in light grey green, indicating Near-Normal Conditions across the region. Surrounding areas in Minnesota and Michigan also fall within the near-normal zone. Cities marked include Minneapolis, Superior, Madison, and Milwaukee. The bottom key defines scales for Probability of Below-Normal Precipitation (tan/brown), Probability of Above-Normal Precipitation (teal/green), and Near-Normal Conditions (grey). Metadata includes Source(s): Climate Prediction Center, Last Updated: 10/14/26, and Drought.gov.
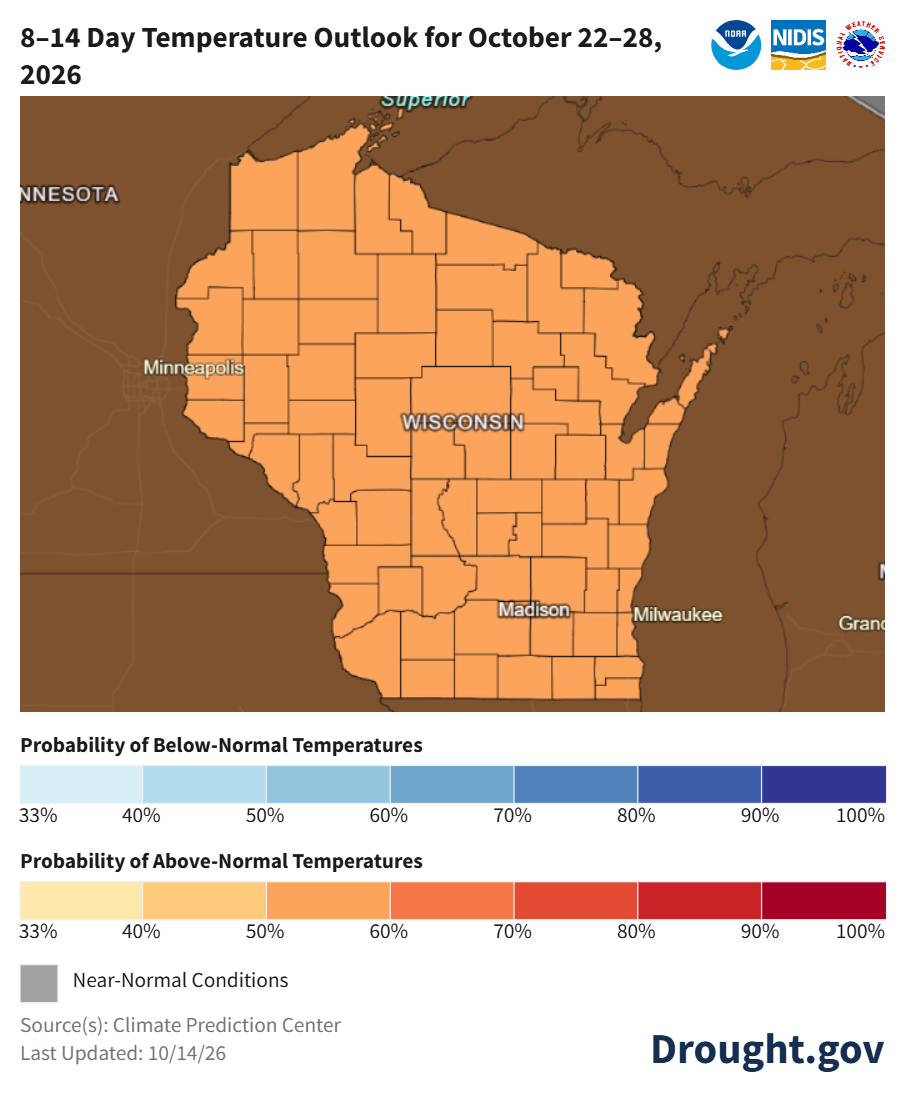
Image Description ↓
Longer Description: A climate outlook map titled 8–14 Day Temperature Outlook for October 22–28, 2026, published by NOAA, NIDIS, and the National Weather Service. The state of Wisconsin is shaded in light orange, corresponding to a 50 to 60 percent probability of above-normal temperatures. Cities marked on the map include Minneapolis, Superior, Madison, and Milwaukee. The key below outlines Probability of Below-Normal Temperatures in blue shades and Probability of Above-Normal Temperatures in orange and red shades from 33 to 100 percent. Metadata indicates Source(s): Climate Prediction Center, Last Updated: 10/14/26, and Drought.gov.
- Late October: Temperatures will likely be above normal statewide (50-60% odds), with precipitation leaning above normal (33-50% odds).
- Statewide normals (1991-2020) for October 22-28 are 42.9°F and 0.59”.
30 Day Temperature and Precipitation Outlook
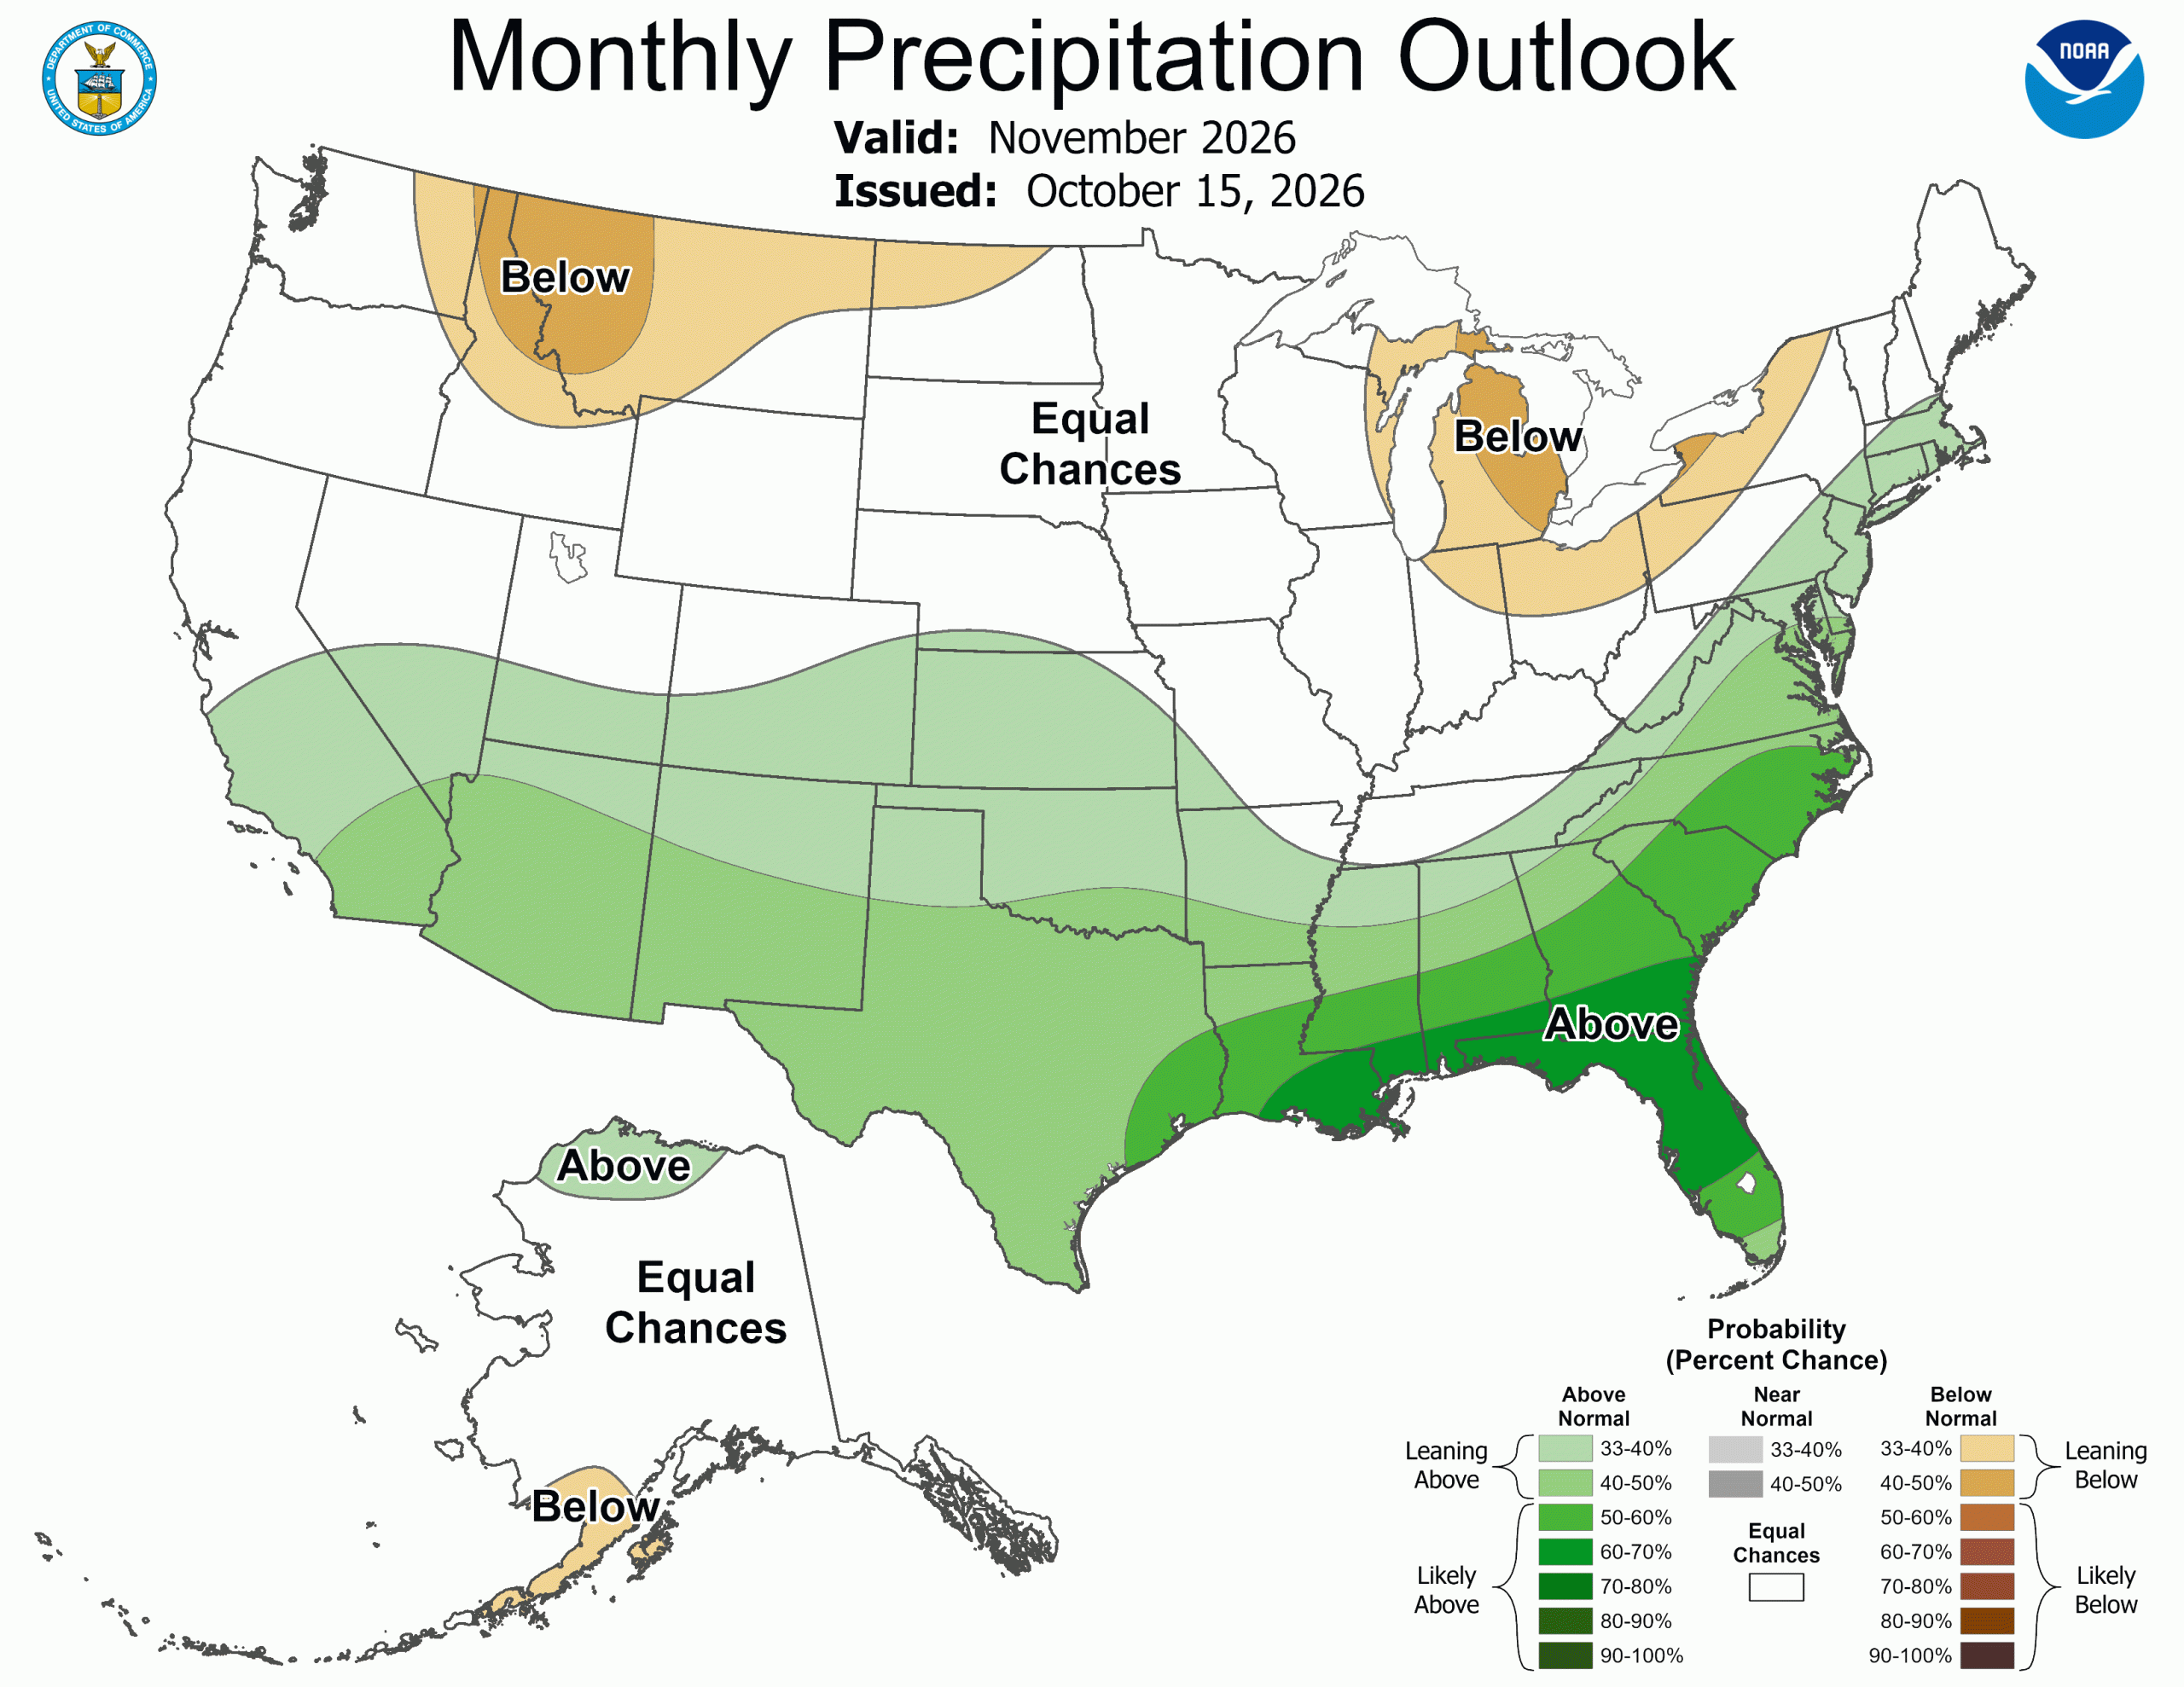
Image Description ↓
A U.S. map titled Monthly Precipitation Outlook, Valid: November 2026, Issued: October 15, 2026, by NOAA. The map illustrates a band across the southern U.S. and East Coast leaning or likely above normal precipitation (green). Regions around the Pacific Northwest, Northern Rockies, and northern Great Lakes (including Michigan’s Upper Peninsula) show leaning below normal (tan). Wisconsin and the broader Upper Midwest are unshaded, designating Equal Chances for above, below, or near-normal precipitation. Alaska displays areas of Above in the north and Below in the southwest. A probability legend is in the bottom right corner.
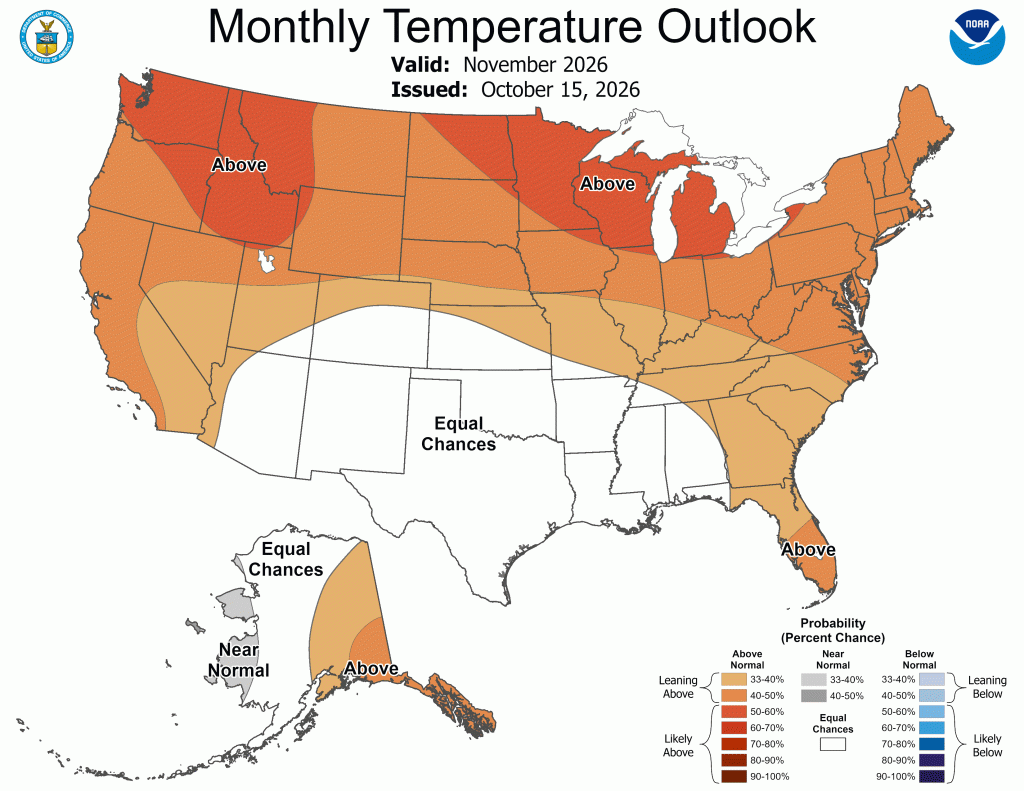
Image Description ↓
A national weather outlook map titled Monthly Temperature Outlook, Valid: November 2026, Issued: October 15, 2026, by NOAA. The northern tier of the United States, including Wisconsin, Minnesota, and the Great Lakes, is shaded in dark orange labeled Above, representing a 60 to 70 percent probability of above-normal temperatures. The surrounding central and eastern regions show 33 to 60 percent probabilities of above-normal temperatures (lighter orange), while the central Plains are designated Equal Chances (white). Alaska shows Near Normal in western regions and Above in the southeast. A probability key appears in the lower right.
- November: Temperatures will likely be above normal statewide (50-60% odds), with precipitation uncertain with equal chances. In eastern counties, there is a higher probability for below-normal precipitation (33-40% odds).
- Statewide normals (1991-2020) for November 1-30 are 33.4°F and 1.99”.
90 Day Temperature and Precipitation Outlook
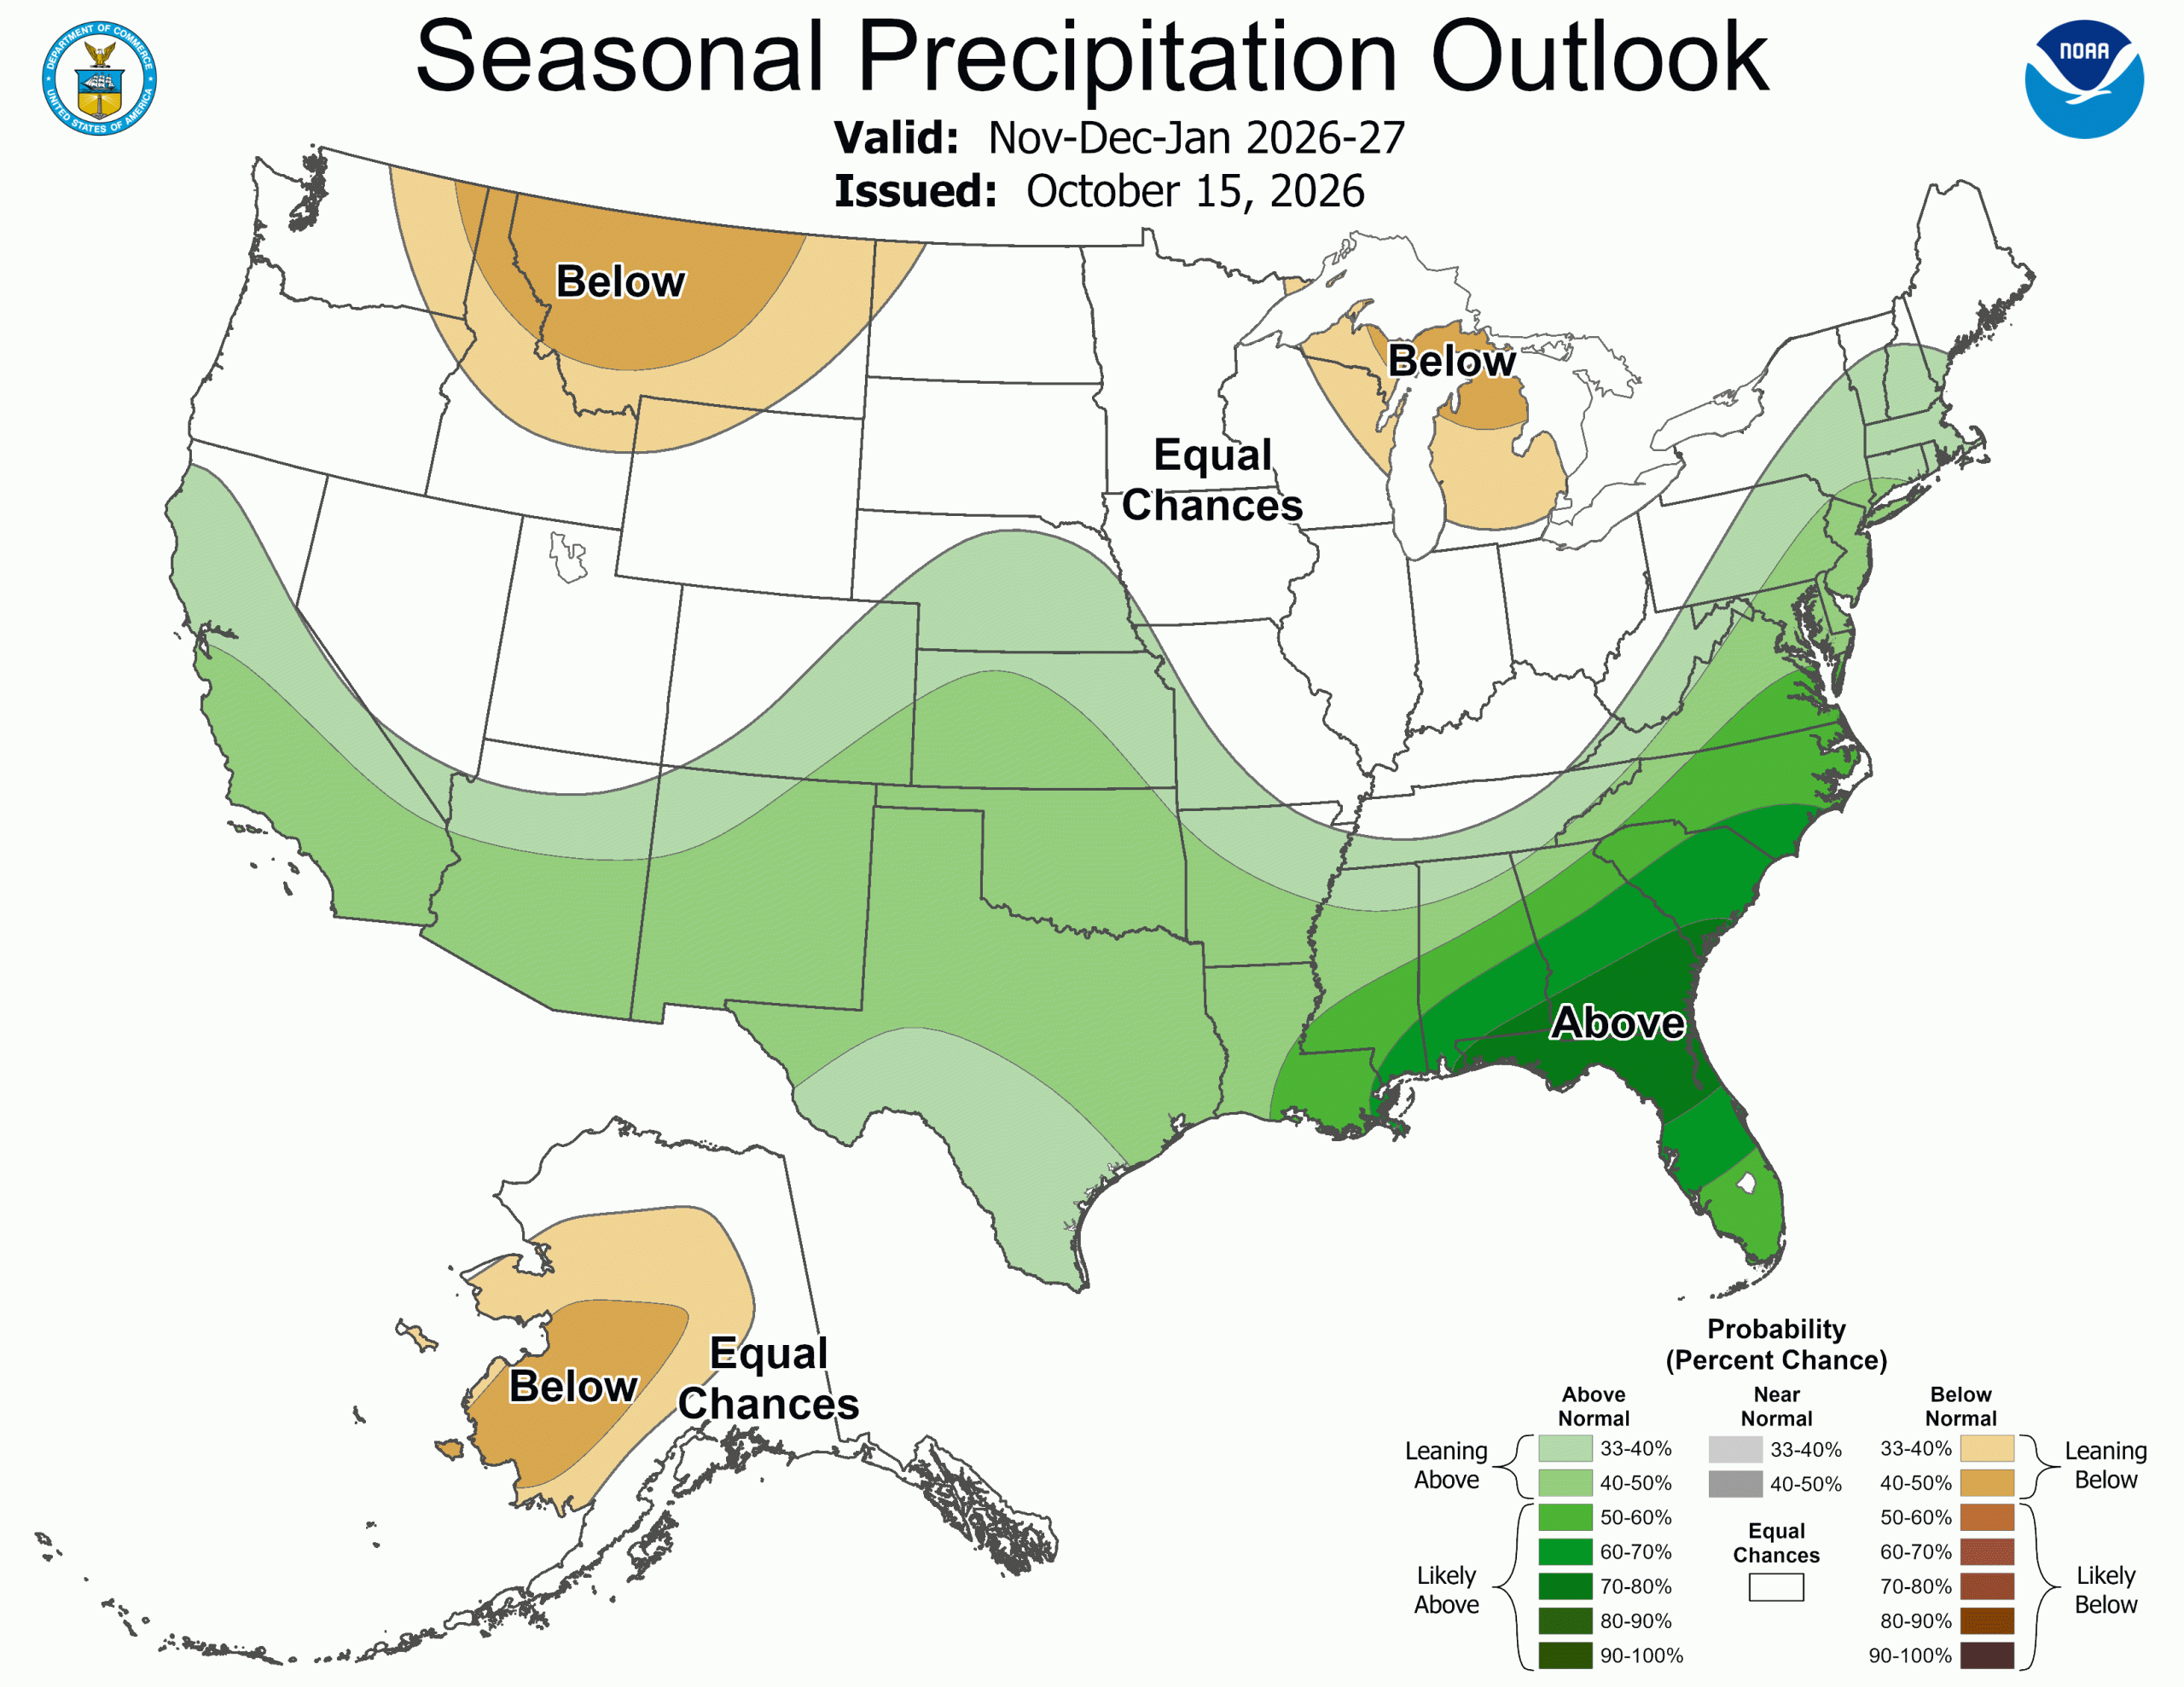
Image Description ↓
A United States map titled Seasonal Precipitation Outlook, Valid: Nov-Dec-Jan 2026-27, Issued: October 15, 2026, by NOAA. The map designates a large band across the southern U.S. and East Coast leaning/likely above normal precipitation (green), parts of the Pacific Northwest, Northern Rockies, and Great Lakes leaning below normal (tan), and central regions including Wisconsin under Equal Chances (unshaded white). Alaska shows Below near western regions and Equal Chances elsewhere. A legend at the bottom right details probabilities for Above Normal, Near Normal, and Below Normal precipitation ranging from 33 to 100 percent.
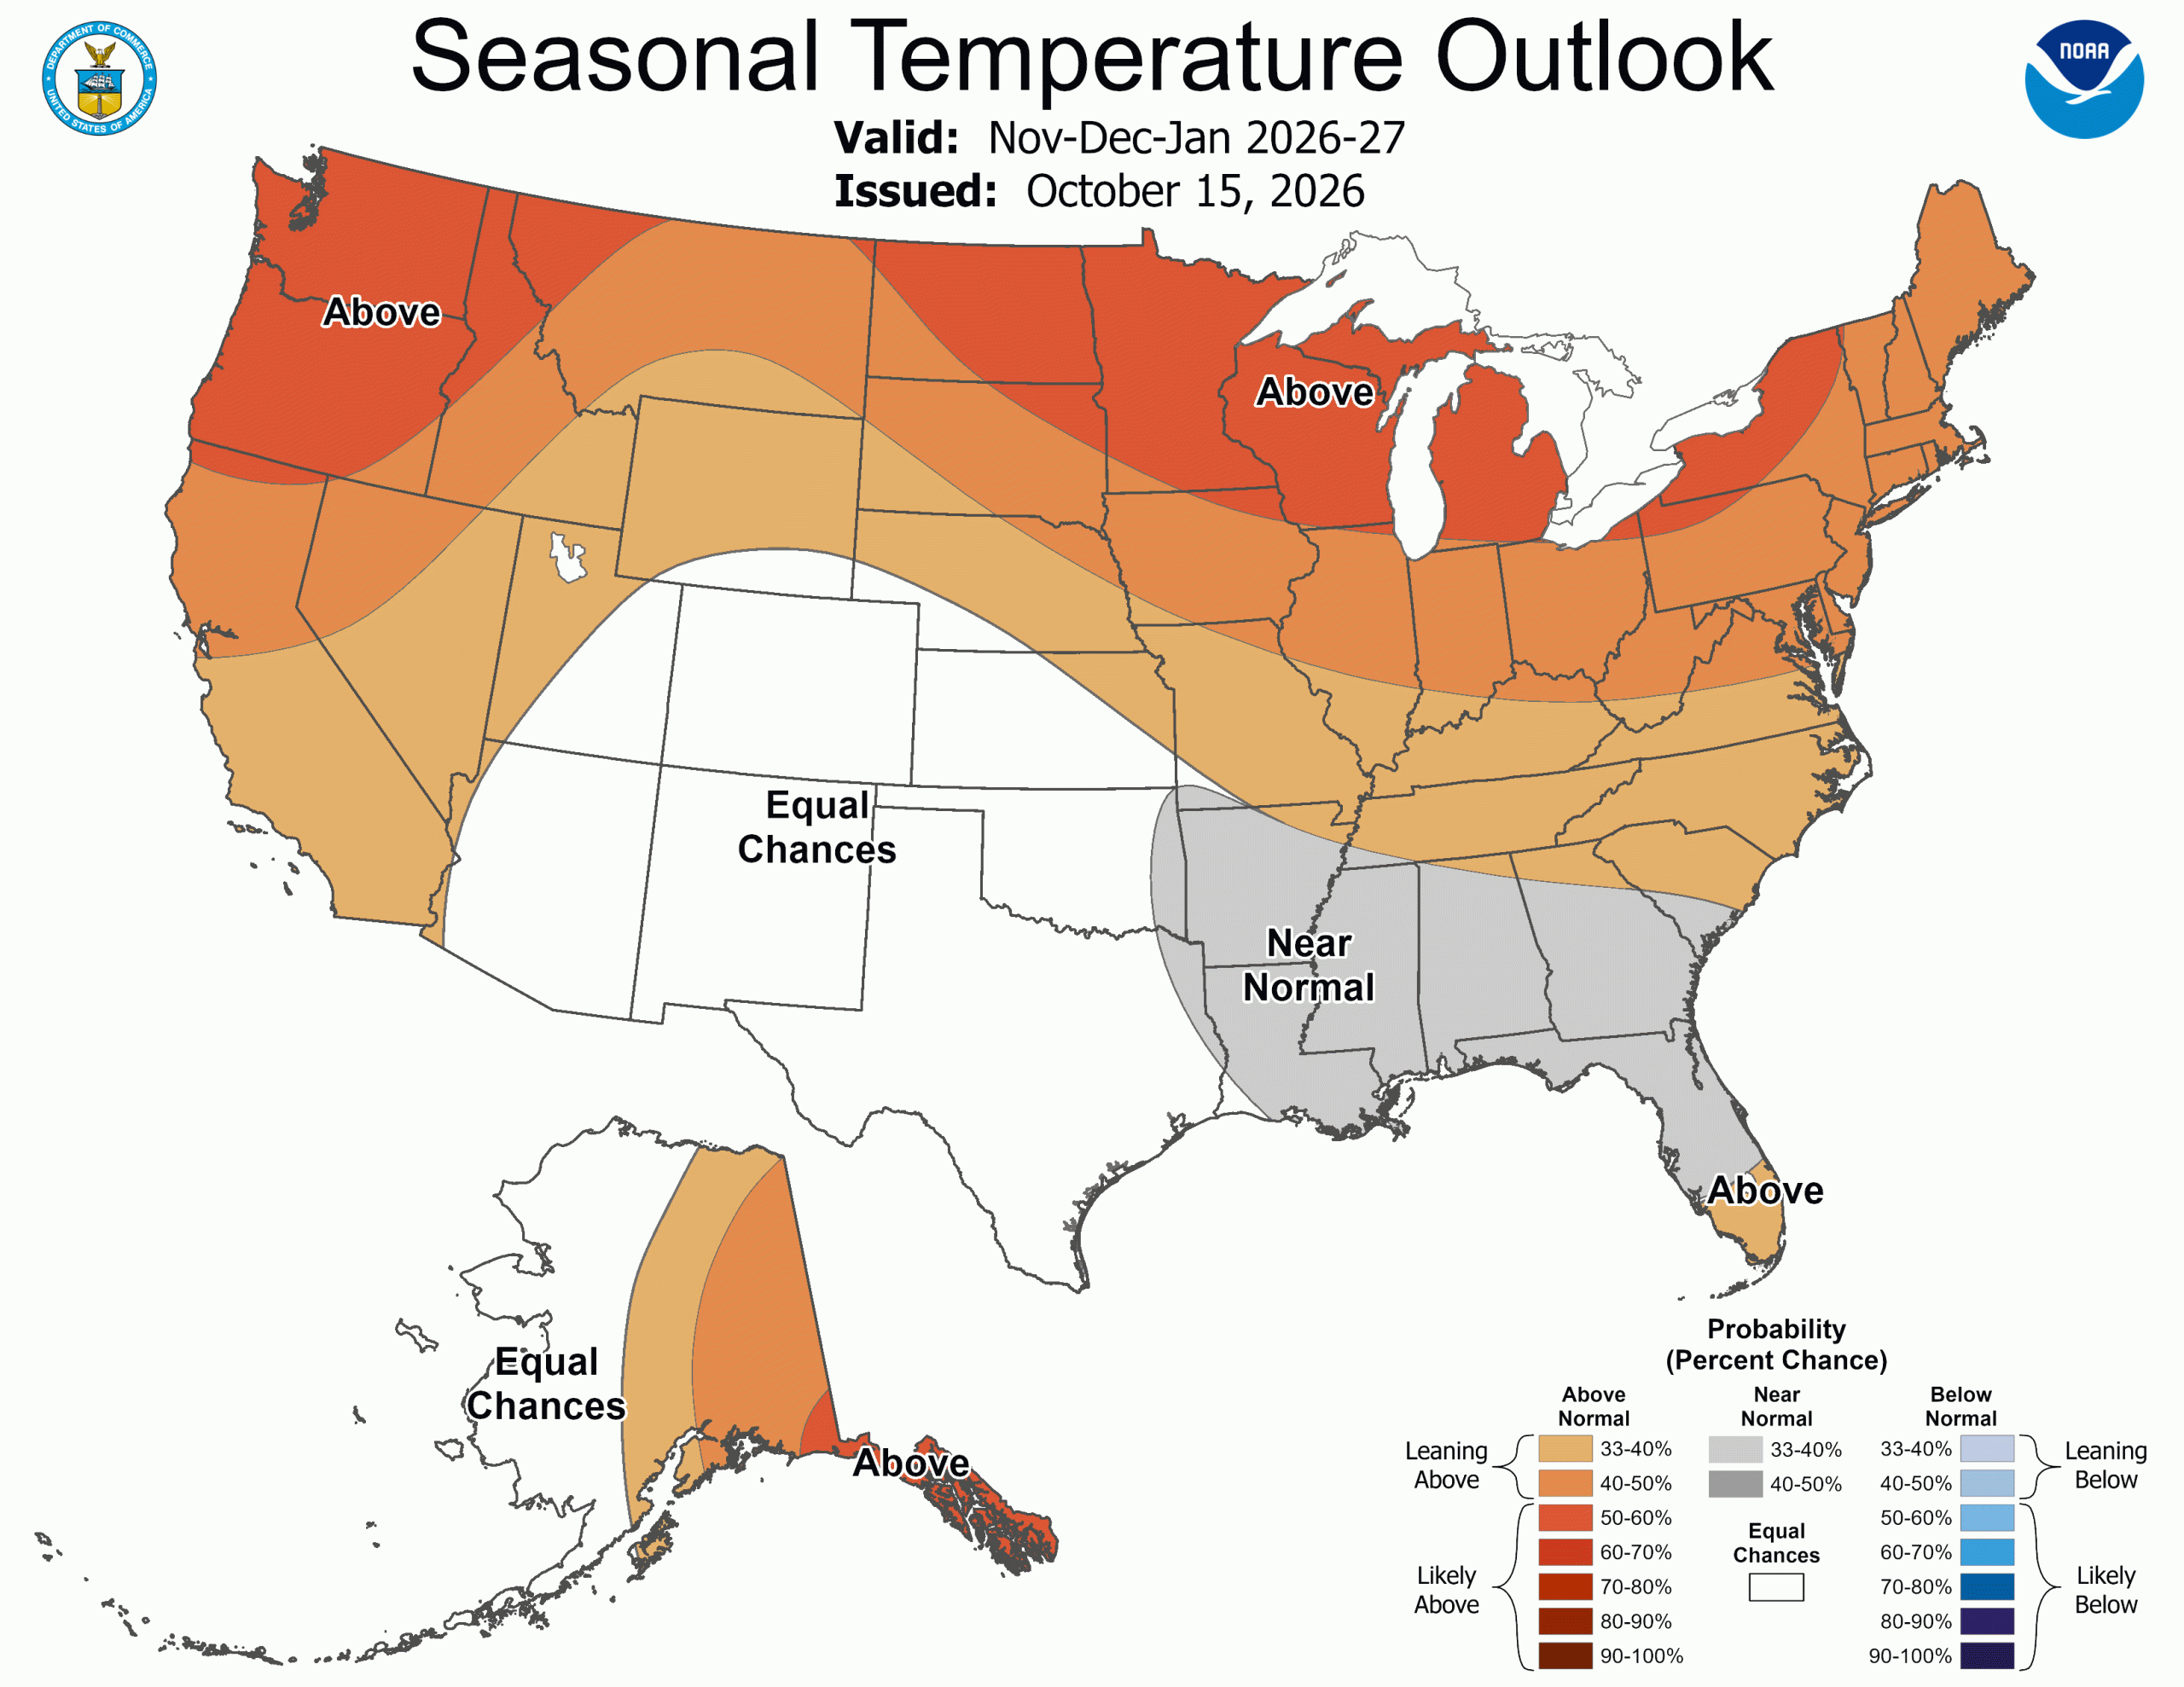
Image Description ↓
A national climate map titled Seasonal Temperature Outlook, Valid: Nov-Dec-Jan 2026-27, Issued: October 15, 2026, by NOAA. Most of the northern third of the United States, including Wisconsin, Michigan, and Minnesota, is shaded in medium to dark orange labeled Above, indicating a 50 to 70 percent probability of above-normal temperatures. The central Plains show Equal Chances (white), while parts of the mid-South are designated Near Normal (grey). Alaska shows Above in eastern areas and Equal Chances in the west. The bottom legend defines the percentage chances for above, near, and below normal temperatures.
- Nov-Jan: Temperatures will likely be above normal statewide (50-60% odds), with precipitation uncertain with equal chances. In northeastern counties, there is a higher probability for below-normal precipitation (33-40% odds).
- Statewide normals (1991-2020) for Nov-Jan are 23.2°F and 4.72”.
User Survey
Are you a regular user of the Ag Weather Outlook for Wisconsin (AgWOW)? Or maybe you are viewing this page for the first time this week? Either way, we want to hear your feedback on this resource! Please take a few minutes and fill out this survey. Your feedback will help us better serve your ag-weather data needs through AgWOW.
If you have any trouble accessing or filling out the survey, please email Josh Bendorf at jbendorf@wisc.edu. Thank you!