
Weather and climate conditions this week in Wisconsin
Here are this week’s take-home points about the weather. As a reminder, AgWOW reports will be published weekly throughout the growing season. Scroll down for the full report.
Additionally, we’re collecting user feedback. Regardless of whether it’s your first time here or if you are a regular user, we’d love to hear from you!
Key Points
Recent Conditions
- Temperatures were unseasonably warm last week, with many locations at 4-8°F above normal for late May.
- Portions of central and northwest Wisconsin received as much as 1.5” or more of rainfall last week, but most in the state received 0.25” or less. Over the past 30 days, most of the state has received 50% or less of normal precipitation.
Impact
- Soil moisture levels at 4” depth across Wisconet research farm stations decreased from last week’s levels, in some cases to zero inches of plant available water.
- Satellite-based soil moisture models indicate that soils in the top 1-meter depth dried out from last week’s report, with the southeast and west-central regions showing up as much drier-than-normal for early June.
- Drought has returned to Wisconsin, with southeastern and west-central counties in D1 drought.
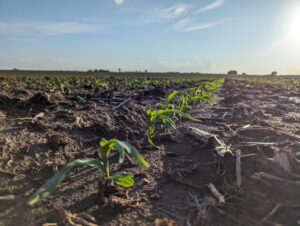
- Despite the lack of rainfall over recent weeks, crop conditions are rated as good to excellent for most Wisconsin fields.
Outlook
- Rain chances over the next 7 days are highest in the southern and southwestern counties, with the best chances up through Saturday morning (6/6).
- The outlook for mid-June indicates that most of Wisconsin will likely see above normal temperatures (50-60% odds).
- Across most of Wisconsin, the June outlook indicates a lean towards above-normal temperatures (40-50% odds) and below-normal precipitation (33-40% odds for most).
Agronomic, Fruit and Vegetable Considerations
Field Conditions
- Pay attention to drought stress on sandier grounds with lack of recent precipitation.
- June is the time for pre-sidedress nitrate soil sampling. See guidelines for PSNT sampling.
Forage Management
- First crop alfalfa is being harvested throughout WI. Consider using a PEAQ (Predictive Equations for Alfalfa Quality) stick to estimate relative feed value as you decide when to make each cut.
- As scissor clips are concluding throughout the state, find UW and UMN quality data using the Alfalfa Harvest Alert dashboard.
Pest Management
- Start scouting fields on foot to note which weed species are emerging.
- Be observant of black cutworm and true armyworm moths migrating through the state. Check the DATCP Pest Trap Network Maps. Look for true armyworm larvae in corn (especially around V5).
- Scout emerging corn until V5 for signs of cutworm feeding.
- Hot and dry weather can reduce herbicide efficacy. Forecasted rains, if they occur, will help push PRE herbicides below the soil surface.
- Continue scouting for alfalfa weevil larva. Weevil larvae have the greatest impact (quality and yield) on first and second alfalfa cuts. Fields that have been harvested are seeing feeding on second crop regrowth.
- SlugNet is trapping again in 2026! Review weekly trap catches across the state. Observe fields (especially fields with reduced tillage and cover crops) for any signs of slug damage.
Manure Applications
- Reminder of Wisconsin’s NR 151 Runoff Rules with the timing of manure spreading and current runoff levels. Check DATCP Runoff Risk Advisory Forecast.
Small Grains
- Scout small grains for signs of disease. This includes powdery mildew and stripe rust, especially in susceptible varieties. Stripe rust was confirmed in Wisconsin last week. Use the Crop Risk Tool and Fusarium Risk Tool for guidance as Fusarium Head Blight becomes the next disease of concern.
- Staging small grain growth is important for fungicide timing as diseases are emerging. Review growth stages here.
Fruit Considerations
- Wisconsin fruit growers can reference the Midwest Fruit Pest Management Guide for a list of registered products and recommended best practices. View the MFPMG Online.
- Apple growers can reference the NEWA weather station network to monitor disease infection events for apple scab and fire blight. Make sure to keep track of green tip and petal fall dates. Check out your nearest weather station: NEWA Weather Station Network (Cornell).
- Codling moth have been captured in Southern WI. Make sure to check traps after warm, calm evenings to establish a biofix date. Biofix occurs when ~5 or more moths are captured in one evening, or captured across consecutive nights. First generation larvae will emerge after ~250 degree-days base 50℉ from the biofix date.
- Keep track of degree-days (base 50℉) from petal fall to determine the end of plum curculio movement into the orchard. Plum curculio will continue movement into the orchard until ~308 degree-days base 50℉ have accumulated from petal fall.
- Grape growers can begin fertilization prior to bloom and should review last year’s petiole analysis to determine nutrient needs. Check out this recent UW Fruit News article on Fertilizing Wine Grapes.
- Grape growers can reference the NEWA weather station network to monitor disease infection events for phomopsis, powdery mildew and black rot. Check out your nearest weather station: NEWA Grape Diseases Model.
- Strawberry growers may consider reviewing scouting and management strategies for thrips, tarnished plant bug and mites.
Vegetable Considerations
- Ensure garlic is receiving adequate moisture, between 1 and 2 inches per week, during bulb formation. For more information on growing garlic, check out this resource from Michigan State.
- Whether you use drip or a center pivot to irrigate, it is important to monitor water pressure to maintain effective irrigation of crops especially during recent dry conditions. Check out this article from Michigan State to learn more.
- It is a great time to consider summer cover crops before planting fall crops. Summer cover crop options include buckwheat, cowpea, and sorghum sudangrass. Check out these videos from UW Madison Extension and Iowa State Extension to learn more about what might work on your farm. Purdue also has a great article on this topic.
- While weather that is favorable to late blight has occurred since approximately 50% of potato crops have emerged, we still have not reached that point that preventative applications are necessary.
- Problems of onion thrips have been reported. Onion thrips can cause serious damage on onions, cabbage, cauliflower, cucumber, and tomatoes. They overwinter in legume fields and as the first alfalfa crop is harvested, risk of them migrating into your vegetables increases. Scout weekly and pay particular attention to field edges are this pest is more common there early in the season. Scouting tips and management information can be found here and here.
- Alfalfa harvest also means that aster leafhoppers will be on the move. MSU traps and checks infectivity levels in Michigan. Sign up for text alerts here to get an idea of how infectivity levels are changing throughout the season. Aster leafhoppers spread aster yellows which can cause significant damage to a range of crops including garlic, lettuce, carrots, and parsley. Control of aster yellows depends on control of the aster leafhopper. Management options include floating row covers, planting resistant cultivars, and insecticides.
- Potato leafhopper is another pest that is common to find on your vegetable crop post alfalfa harvest. Pay attention to beans and potatoes for signs of damage which include veins turning yellow and leaf curling during early stages and later appears as the characteristic “hopper burn” that leads to the yellowing or browning of leaf tips. Damage occurs most rapidly under hot and dry conditions. Management information and action thresholds can be found here.
- Continue scouting for Colorado potato beetle. Focus on border rows and scan soil surrounding plants to help as adults will drop from plants as a defense tactic. The highest density is typically in fields adjacent to last year’s crop. If you plan to use a set of perimeter sprays, early detection is key. Perimeter sprays of adults are most effective when large amounts of adults are colonizing perimeter rows and have not dispersed through the field. In southern WI (south of the WI river) 10% egg hatch will be approaching this week. Find more information in the Vegetable Crop Update.
- The risk of western flower thrips is now high or very high north of WI Dells. Thrips particularly like the recent dry conditions. Early detection is key as control can be very difficult. Iowa State has a few useful videos on scouting: tip on finding thrips and tips on spotting thrips damage on cucumber transplants. Control options include row cover, reflective mulch and weed management as weeds such as chickweed and lambsquarters serve as alternative hosts.
- Continue to scout for striped cucumber beetles. Eggs are laid at the base of cucurbit plants. Once larvae hatch, they feed on roots and stems and can cause stunted growth or even kill seedlings. Adults feed on foliage and fruit and can spread bacterial wilt which can cause severe losses in cucumber and muskmelon. It is important to scout and, when necessary, control beetles early in the season to reduce risk of spreading this bacterial wilt. Control measures include dipping seedlings in kaolin clay prior to transplanting, floating row cover or high tunnel insect exclusion screens, and perimeter trap cropping.
- Scout for imported cabbageworm and diamondback moth eggs and larvae. Eggs are laid on the underside of leaves or occasionally on the stem. Diamondback eggs are tiny, flat, cream colored and laid either singly or in clusters while cabbageworm eggs are yellow, conical, and laid singly. One way to help identify the larvae is by their behavior when disturbed. Cabbageworm larvae will typically remain motionless while diamondback larvae will wiggle around and often fall off the plant. Young transplants and from early heading to harvest plants are more susceptible to damage so the management threshold is when 10% of plants are affected. More information on treatment thresholds and management options can be found here.
- Swede midge is another pest of brassicas from mid-May through June. They feed on growing points leading to distortion and scarring on leaves. Depending on when infestation occurs, they can also lead to uneven or even complete loss of a head or crown. While there are pheromone traps for swede midge, they can be difficult to use as it is hard to distinguish from other flies. They can be difficult to detect because larvae hide in growth points but an indicator can be a wet growing tip due to burst cells from larvae feeding. Some control options include insect netting, avoiding the use of brassica cover crops, and removing brassica weeds that can serve as alternative hosts.
- The second generation of adult seed corn maggots is now active across central WI. The risk will last for 8-10 in central WI. Injury is caused exclusively by larvae which feeds on the cotyledons and below ground tissue of seedlings. Poor germination can be an indicator of seed corn maggots. If possible, delay planting crops including beets, green beans, and pumpkins until the risk has decreased. If you cannot delay planting, promote faster germination by planting seeds as shallowly as agronomically possible. More management options can be found here.
- Cabbage maggot peak egg laying is now occurring in central and northern WI. Cabbage maggots overwinter as larvae in the top several inches of soil. Treatment is primarily preventative. When possible, till in cover crops 2 to 3 weeks before planting to reduce attractiveness. If possible, delay planting to avoid peak activity. Floating row covers are also a good option during peak activity. To monitor activity in your area, use the Vegetable Disease and Insect Forecasting Network.
- Black cutworm moths continue to migrate into WI with trap catches reported by DATCP. Check the DATCP trap catch maps for counts in your area. Black cutworm larvae feed on newly emerged crops and prefer direct seeded crops over transplants. Many crops are susceptible to damage including beets, carrots, cucumber, leafy greens, sweet corn and squash. Management options include weed management as females prefer to lay eggs in weedy areas and avoiding the use of green manure in areas where cutworms tend to be a problem. For chemical control to be effective, early detection is key. If chemical treatment is necessary, begin treating at the first signs of cutting and repeat every 7 days until 1000 degree days are reached.
Dive deeper into each report section by clicking a topic below.
Precipitation Trends
7 Day Precipitation
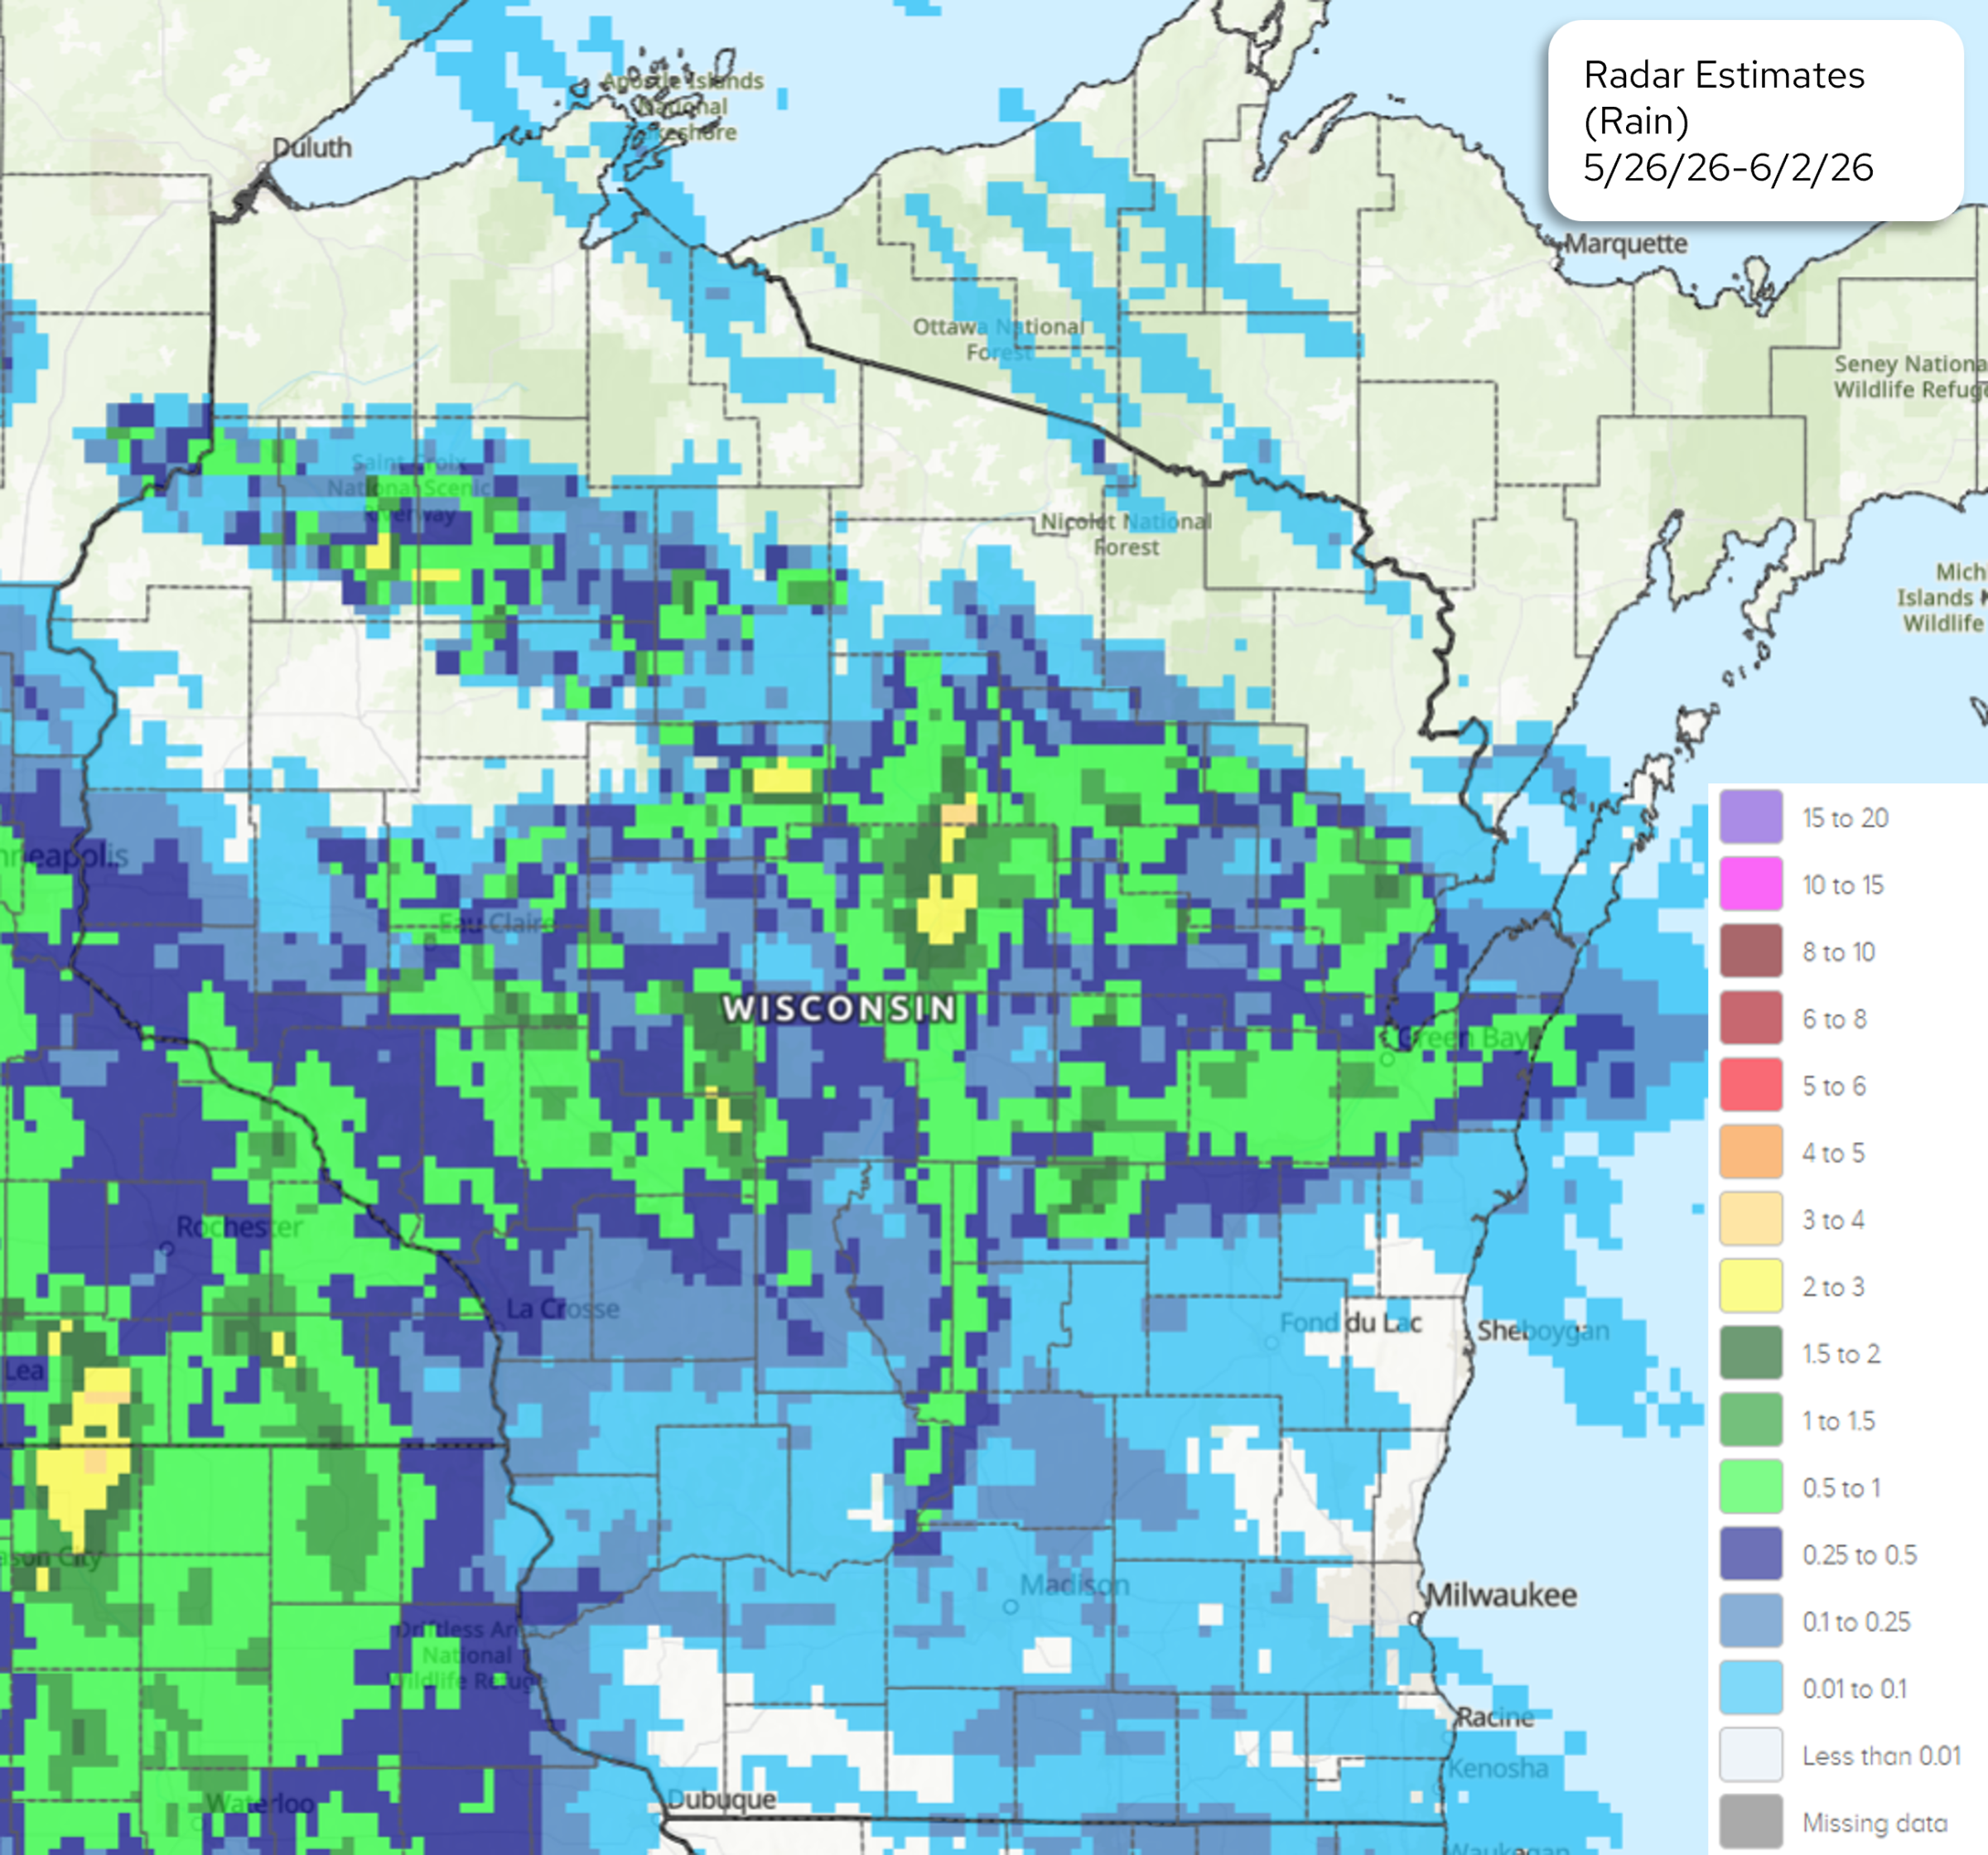
Image Description ↓
A color-coded map of Wisconsin titled “Radar Estimates (Rain) 5/26/26–6/2/26.” County outlines and nearby locations are labeled. A broad band of higher rainfall (greens, yellows) stretches west to east across central and north-central Wisconsin, with pockets around 3–5 inches. Surrounding areas show moderate totals (1–3 inches in greens and light blues). Southern and southeastern Wisconsin and areas near Lake Michigan display lighter amounts (light blue to near white, generally under 1 inch). Northern fringes and parts of Upper Michigan show scattered lighter precipitation. A legend on the right indicates rainfall ranges from less than 0.01 inch to 15–20 inches (though highest colors are not present on the map).
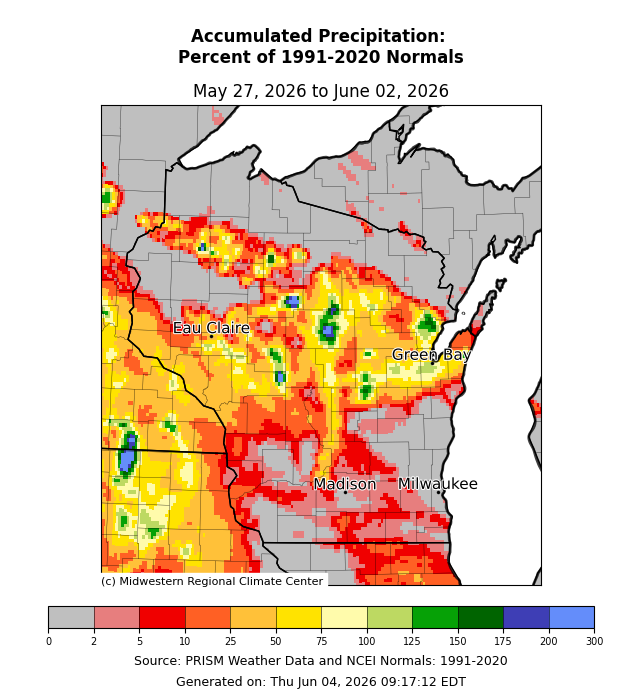
Image Description ↓
Map of Wisconsin titled “Accumulated Precipitation: Percent of 1991–2020 Normals” with dates “May 27, 2026 to June 02, 2026.” Cities labeled include Eau Claire, Green Bay, Madison, and Milwaukee. Colors range from gray (0%) through red/orange (below normal), yellow (~75%), to green/blue (above normal, up to 300%). Central and north-central Wisconsin show near to above normal precipitation (yellow to green patches, ~75–150%+). Southern and southeastern Wisconsin display below normal conditions (orange to red, ~25–75% or lower), with some gray areas indicating very low percentages. Northwestern and northeastern regions have mixed values with pockets of near to above normal. Footer text: “Source: PRISM Weather Data and NCEI Normals: 1991–2020” and “Generated on: Thu Jun 04, 2026 09:17:12 EDT.” Credit: Midwestern Regional Climate Center.
- Rainfall totals of 0.5-1.5” were common across the central belt of counties last week, with isolated pockets of over 1.5”. Isolated spots in northwest counties also received 1” or more.
- In southern and northern counties, totals were commonly 0.25” or less.
- Almost all of Wisconsin had precipitation totals that were 50% or less of normal last week, excluding isolated regions that received 1” or more.
30 Day Precipitation Total and Departure from Normals
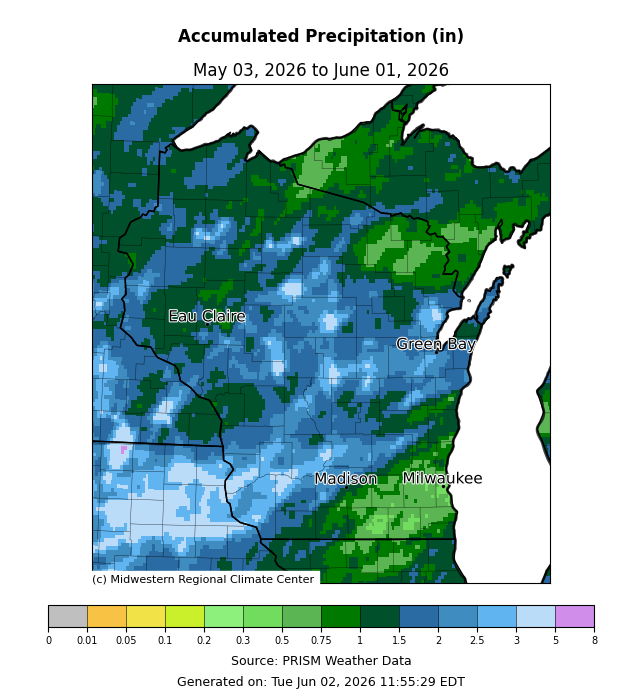
Image Description ↓
Map titled “Accumulated Precipitation (in)” with date range “May 03, 2026 to June 01, 2026.” The map shows Wisconsin with labeled locations including Eau Claire, Green Bay, Madison, and Milwaukee. Colors represent rainfall totals, with a legend ranging from 0 inches (gray) through light blues (under ~1 inch), darker blues (~1–2.5 inches), greens (~0.5–1.5 inches), and purple (up to ~8 inches). Central Wisconsin shows moderate to higher accumulations (mostly 2–4 inches in darker blues), with some localized higher pockets. Northern Wisconsin has widespread moderate totals (1–3+ inches, greens to blues). Southern and southeastern Wisconsin generally show lighter totals (mostly under 2 inches), especially toward the Illinois border and Lake Michigan shoreline. Footer text includes “Source: PRISM Weather Data” and “Generated on: Tue Jun 02, 2026 11:55:29 EDT,” with credit to the Midwestern Regional Climate Center.
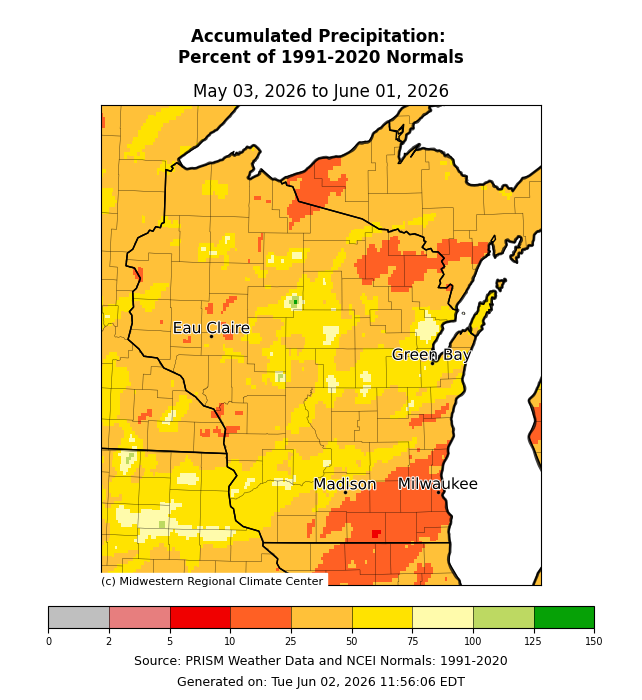
Image Description ↓
Map titled “Accumulated Precipitation: Percent of 1991–2020 Normals” with dates “May 03, 2026 to June 01, 2026.” The Wisconsin map includes labeled cities such as Eau Claire, Green Bay, Madison, and Milwaukee. Colors show percent of normal precipitation, with a legend ranging from 0% (gray), 2–10% (reds), 25–50% (orange), 50–75% (yellow), up to 150% (green). Most of Wisconsin is shaded yellow to orange (about 25–75% of normal), indicating below-normal precipitation. Southern and southeastern areas, including near Madison and Milwaukee, show darker orange to red (about 5–25%), indicating the lowest percentages. Northern Wisconsin and areas near Lake Superior show mixed values but remain mostly below normal, with occasional small patches closer to 75–100%. Footer text: “Source: PRISM Weather Data and NCEI Normals: 1991–2020” and “Generated on: Tue Jun 02, 2026 11:56:06 EDT,” credited to the Midwestern Regional Climate Center.
- The last 30 days have been drier-than-normal across the state, with most locations receiving totals that were 25-75% of normal (2.5” or less).
- In the southeast and northeast corners of the state, precipitation totals were 1” or less (25% or less of normal).
90 Day Precipitation Total and Percent of Normals
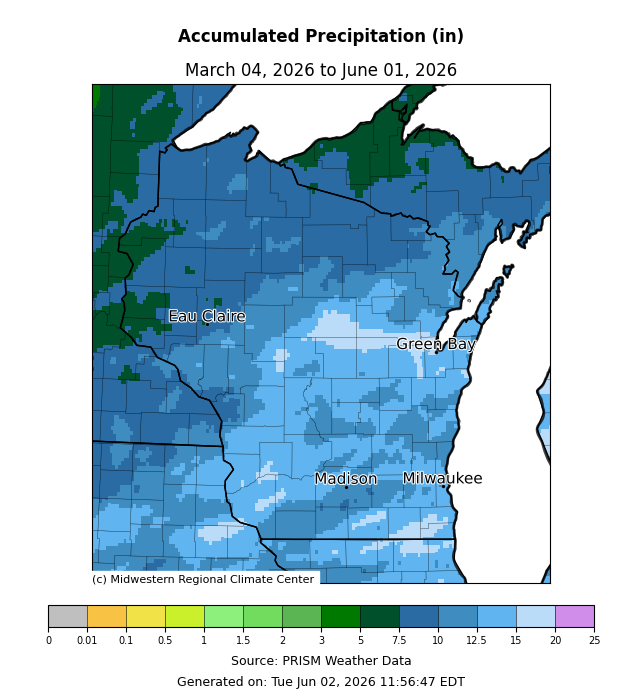
Image Description ↓
Map titled “Accumulated Precipitation (in)” with date range “March 04, 2026 to June 01, 2026.” Wisconsin is shaded by total rainfall using a color scale from near 0 inches (gray) to 25 inches (purple). Most of the state shows moderate totals in blue shades, generally about 5–12 inches. Northern and northwestern Wisconsin, including areas near Lake Superior, show higher totals (darker blue to green, roughly 10–15+ inches). Central Wisconsin is mostly mid-range (about 7–12 inches). Southern and southeastern areas, including around Madison and Milwaukee, show somewhat lower totals (lighter blue, about 5–9 inches). Labeled cities include Eau Claire, Green Bay, Madison, and Milwaukee. Footer text: “Source: PRISM Weather Data” and “Generated on: Tue Jun 02, 2026 11:56:47 EDT,” credited to the Midwestern Regional Climate Center.
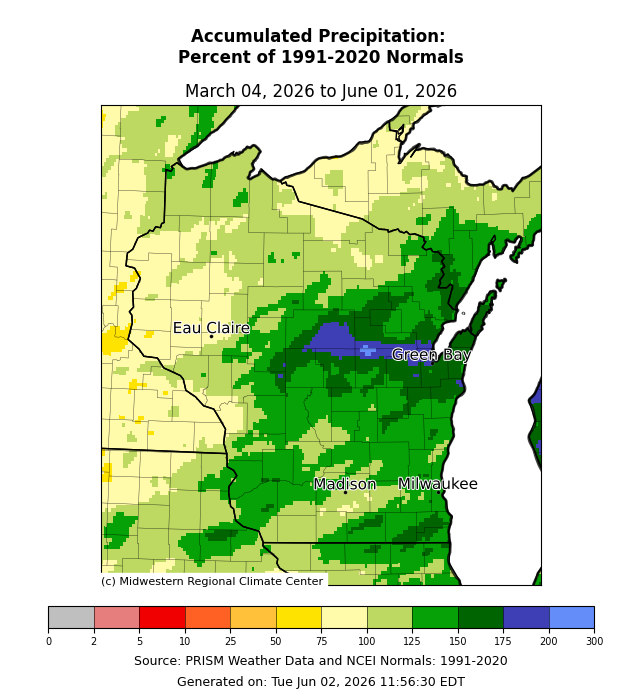
Image Description ↓
Map titled “Accumulated Precipitation: Percent of 1991–2020 Normals” with date range “March 04, 2026 to June 01, 2026.” Wisconsin is shaded using a percent-of-normal scale from 0% (gray) through red/orange (below normal), yellow (~75%), green (100–150%), to blue (~175–300%). East-central Wisconsin, including the Green Bay area, shows above-normal precipitation (green to blue, roughly 125–200% or higher). Central and southern Wisconsin are mostly near to moderately above normal (light to medium green, about 100–150%). Western and northwestern Wisconsin show below to near-normal values (tan to light yellow, about 50–90%). Cities labeled include Eau Claire, Green Bay, Madison, and Milwaukee. Footer text reads “Source: PRISM Weather Data and NCEI Normals: 1991–2020” and “Generated on: Tue Jun 02, 2026 11:56:30 EDT,” with credit to the Midwestern Regional Climate Center.
- Totals of 15” or more were observed in portions of southwest, southeast, and northeast counties. These totals were 150% of normal or greater.
- Most of the state received precipitation totals that were at or above normal, with most receiving at least 10” of precipitation (rain plus melted snow).
- Precipitation totals were lowest in the northwest, along the St. Croix River (5-7.5”). In the northwest, 90-day totals were 75-100% of normal.
2026 Precipitation
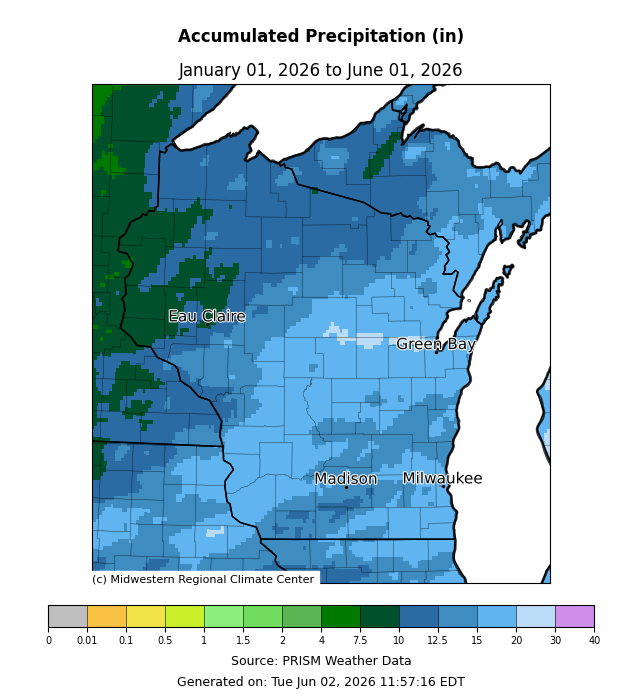
Image Description ↓
Map titled “Accumulated Precipitation (in)” with date range “January 01, 2026 to June 01, 2026.” Wisconsin is shaded by total precipitation using a color scale from near 0 inches (gray) to 40 inches (purple). Most of the state appears in blue shades, indicating roughly 8–20 inches of precipitation. Western Wisconsin, especially near the Minnesota border, shows darker blue to green colors, indicating higher totals of about 20–30 inches. Central and eastern Wisconsin, including areas near Madison, Green Bay, and Milwaukee, show somewhat lower totals (light to medium blue, about 8–15 inches). Labeled cities include Eau Claire, Green Bay, Madison, and Milwaukee. Footer text reads “Source: PRISM Weather Data” and “Generated on: Tue Jun 02, 2026 11:57:16 EDT,” with credit to the Midwestern Regional Climate Center.
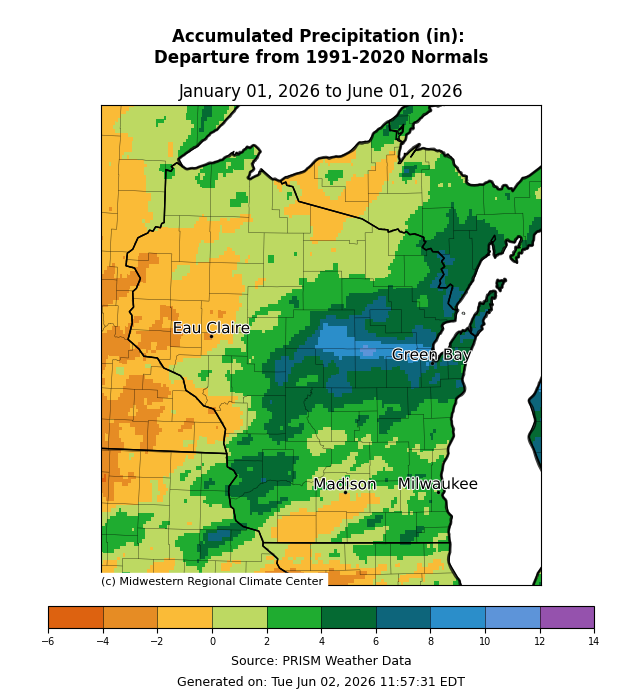
Image Description ↓
Map titled “Accumulated Precipitation (in): Departure from 1991–2020 Normals” with date range “January 01, 2026 to June 01, 2026.” The Wisconsin map uses a color scale showing departures from about -6 inches (brown/orange) to +14 inches (blue/purple). Western Wisconsin, including areas near Eau Claire, shows below-normal precipitation (orange shades, roughly -2 to -6 inches). Central Wisconsin transitions to near normal (light green, around 0 to +2 inches). East-central Wisconsin, including the Green Bay area, shows above-normal precipitation (darker green to blue, about +4 to +10 inches, with localized higher values). Southern Wisconsin, including Madison and Milwaukee, shows mixed conditions, generally near to slightly above normal (+0 to +4 inches). Footer text reads “Source: PRISM Weather Data” and “Generated on: Tue Jun 02, 2026 11:57:31 EDT,” credited to the Midwestern Regional Climate Center.
Soil Moisture and Temperature Trends
Soil Moisture Models
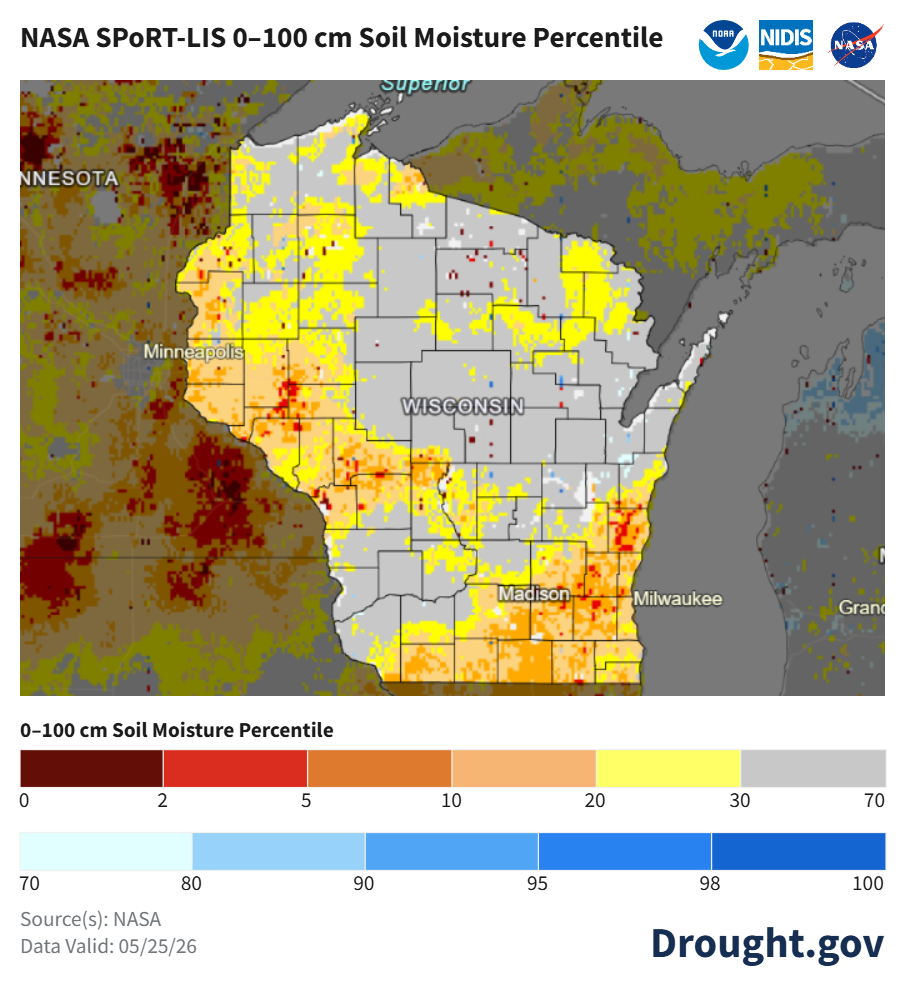
Image Description ↓
Map titled “NASA SPoRT-LIS 0–100 cm Soil Moisture Percentile” with NOAA, NIDIS, and NASA logos. The map shows Wisconsin and surrounding areas with cities labeled. A color scale ranges from very low percentiles (0–2, dark red) through orange and yellow (5–30), gray (~30–70, near normal), and blue shades (70–100, above normal). Most of Wisconsin is shaded gray (near normal) to yellow (10–30%), indicating below-normal soil moisture. Southwestern and southern Wisconsin show more orange to red areas (roughly 2–10%), indicating drier conditions. Small scattered areas in northern and central Wisconsin show slightly higher percentiles (near normal gray or light yellow). Surrounding regions to the west (Minnesota) include larger zones of very low percentiles (dark red). Text at bottom: “0–100 cm Soil Moisture Percentile,” “Source(s): NASA,” “Data Valid: 05/25/26,” and “Drought.gov.”
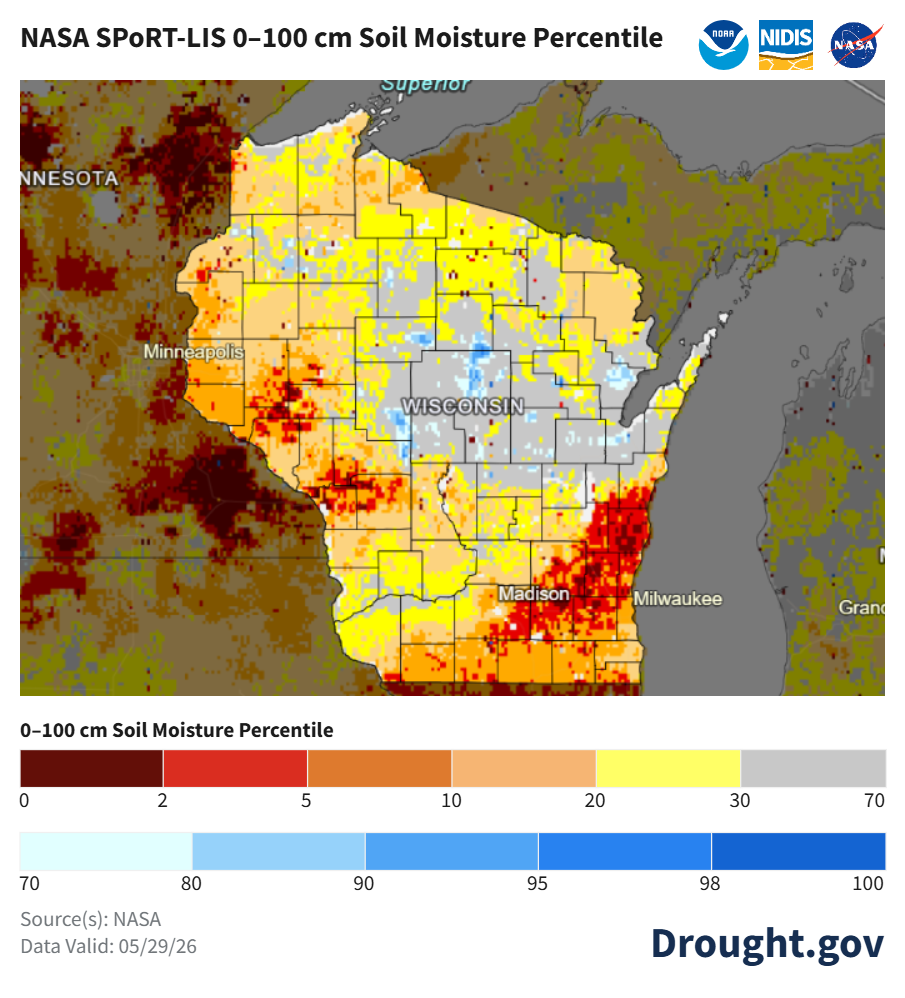
Image Description ↓
Map titled “NASA SPoRT-LIS 0–100 cm Soil Moisture Percentile” with NOAA, NIDIS, and NASA logos. Displays Wisconsin and surrounding areas with labeled cities. The legend shows percentiles from 0–100: dark red (0–2), red/orange (2–10), yellow (10–30), gray (~30–70, near normal), and blue (70–100, above normal). Central Wisconsin is mostly gray (near normal, ~30–70%). Southern and southeastern Wisconsin, including areas near Madison and Milwaukee, show extensive red and dark red (very low, ~0–10%). Western Wisconsin shows orange to red (below normal, ~5–20%). Northern Wisconsin is mixed, with yellow (10–30%) and some gray patches. Surrounding Minnesota areas include large zones of very low soil moisture (dark red). Footer text: “0–100 cm Soil Moisture Percentile,” “Source(s): NASA,” “Data Valid: 05/29/26,” and “Drought.gov.”
- Current soil moisture levels at 4” depth across Wisconet research farm stations are lower than last week’s levels, following a week with little rainfall. Some stations have no plant available water in the 4” depth.
- Satellite-based soil moisture estimates also indicate that soils have dried out compared to last week. The model indicates that soils in the southeast and west-central counties are much drier-than-normal.
- Soils in central counties have moisture levels that are near to normal, according to satellite-based estimates.
- Notes on how to interpret the maps:
- Red areas = top 5 driest in 100 years.
- Dark red areas = top 2 driest in 100 years.
- Dark blue areas = top 2 wettest in 100 years.
Wisconet Soil Moisture
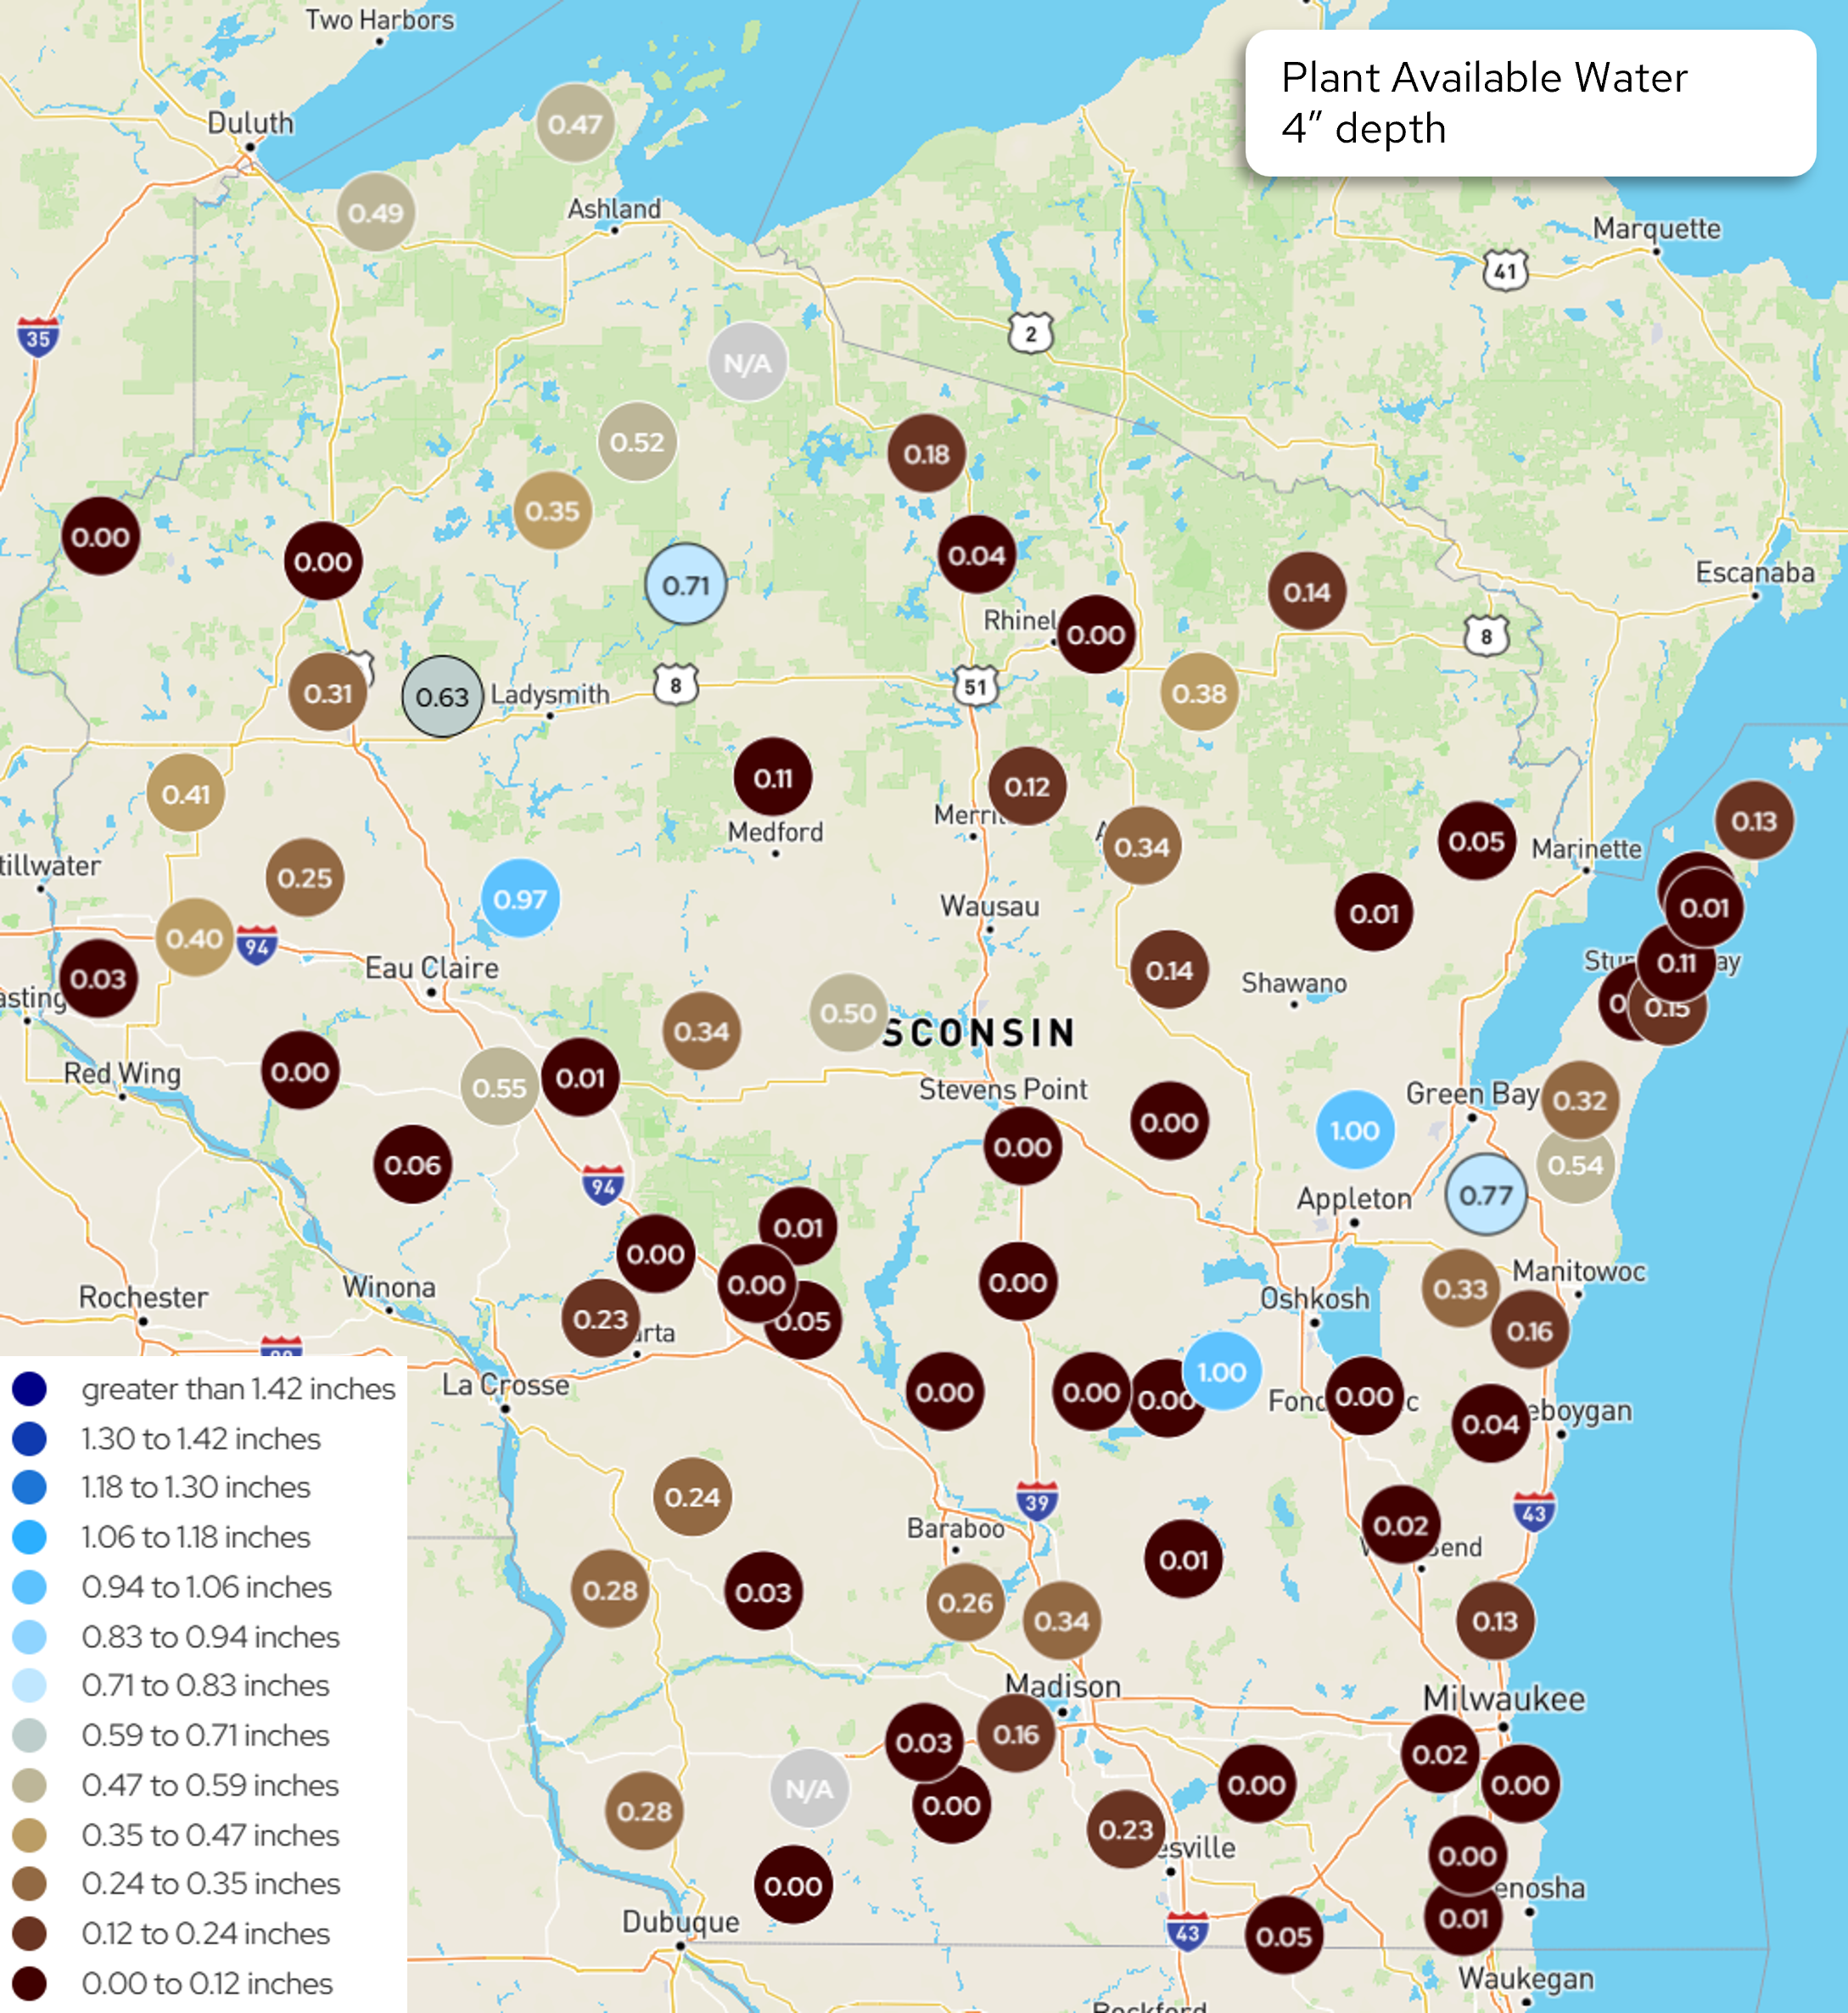
Image Description ↓
Map titled “Plant Available Water 4” depth” showing Wisconsin and nearby areas (Duluth, Ashland, Eau Claire, Wausau, Green Bay, Madison, Milwaukee). Colored circles mark station values with labels (e.g., 0.00, 0.01, 0.04, 0.11, 0.18, 0.34, 0.52, 0.63, 0.71, 0.97, 1.00; one “N/A”). Legend at left lists inches: 0.00–0.12 (dark red), 0.12–0.24, 0.24–0.35, 0.35–0.47, 0.47–0.59, 0.59–0.71, 0.71–0.83, 0.83–0.94, 0.94–1.06, 1.06–1.18, 1.18–1.30, 1.30–1.42, and >1.42 (dark blue). Most southern and western Wisconsin sites show very low values (0.00–0.12 inches). Central and north-central areas include moderate values (~0.3–0.7 inches) with isolated higher points (0.71–1.00 inches) near Ladysmith, Appleton, and Fond du Lac. Northeastern lakeshore sites show mixed low to moderate values (~0.01–0.54 inches).
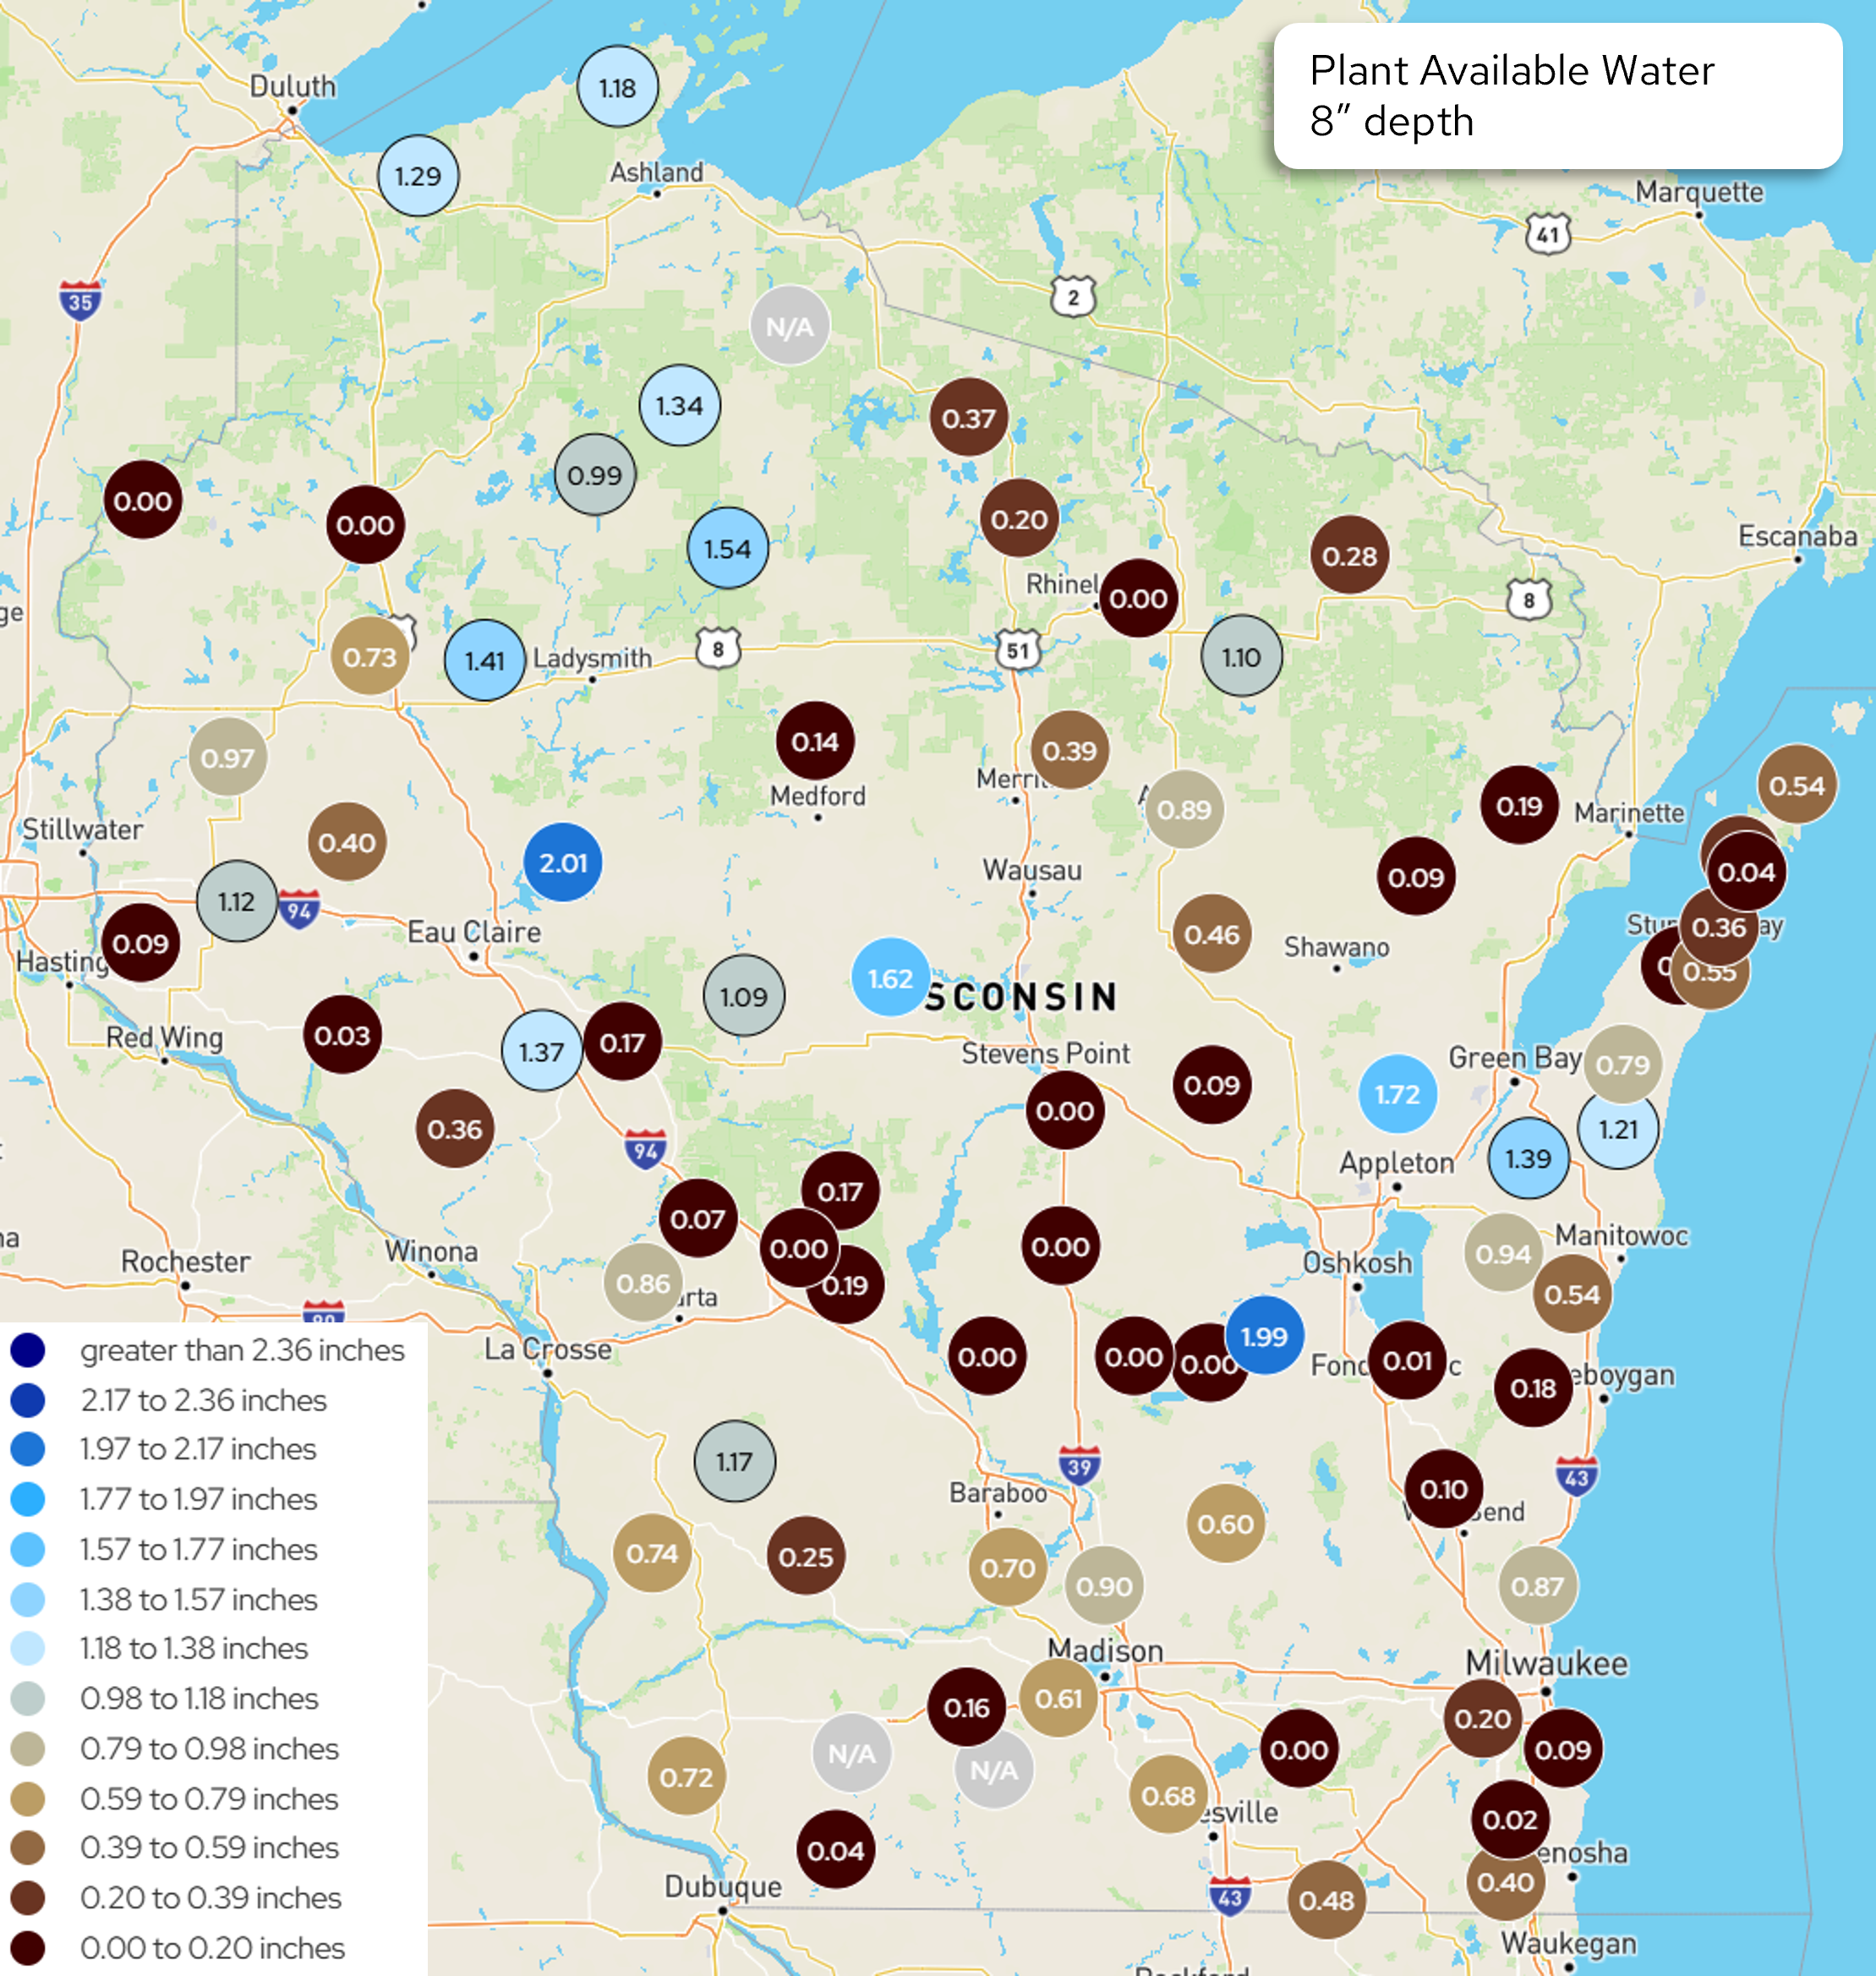
Image Description ↓
Map titled “Plant Available Water 8” depth” showing Wisconsin with labeled cities. Circular markers display site values in inches (e.g., 0.00, 0.03, 0.09, 0.17, 0.28, 0.46, 0.73, 0.99, 1.18, 1.34, 1.54, 1.62, 1.72, 1.99, 2.01; some “N/A”). Legend (left) shows ranges from 0.00–0.20 inches (dark red), increasing through browns and tans (0.20–0.79), then light gray (~0.98–1.18), and blue shades for higher water (1.18–2.36+ inches). Southern and central Wisconsin show many low values (0.00–0.20 inches), especially near Madison, La Crosse, and central counties. Western Wisconsin is mixed, with low values and some moderate readings (0.4–0.9 inches). Northern and north-central Wisconsin show higher values (about 1.0–1.5 inches, with isolated points above 1.5). Eastern Wisconsin near Appleton and Green Bay includes several higher values (about 1.3–1.7+ inches), while lakeshore areas show mixed low to moderate values.
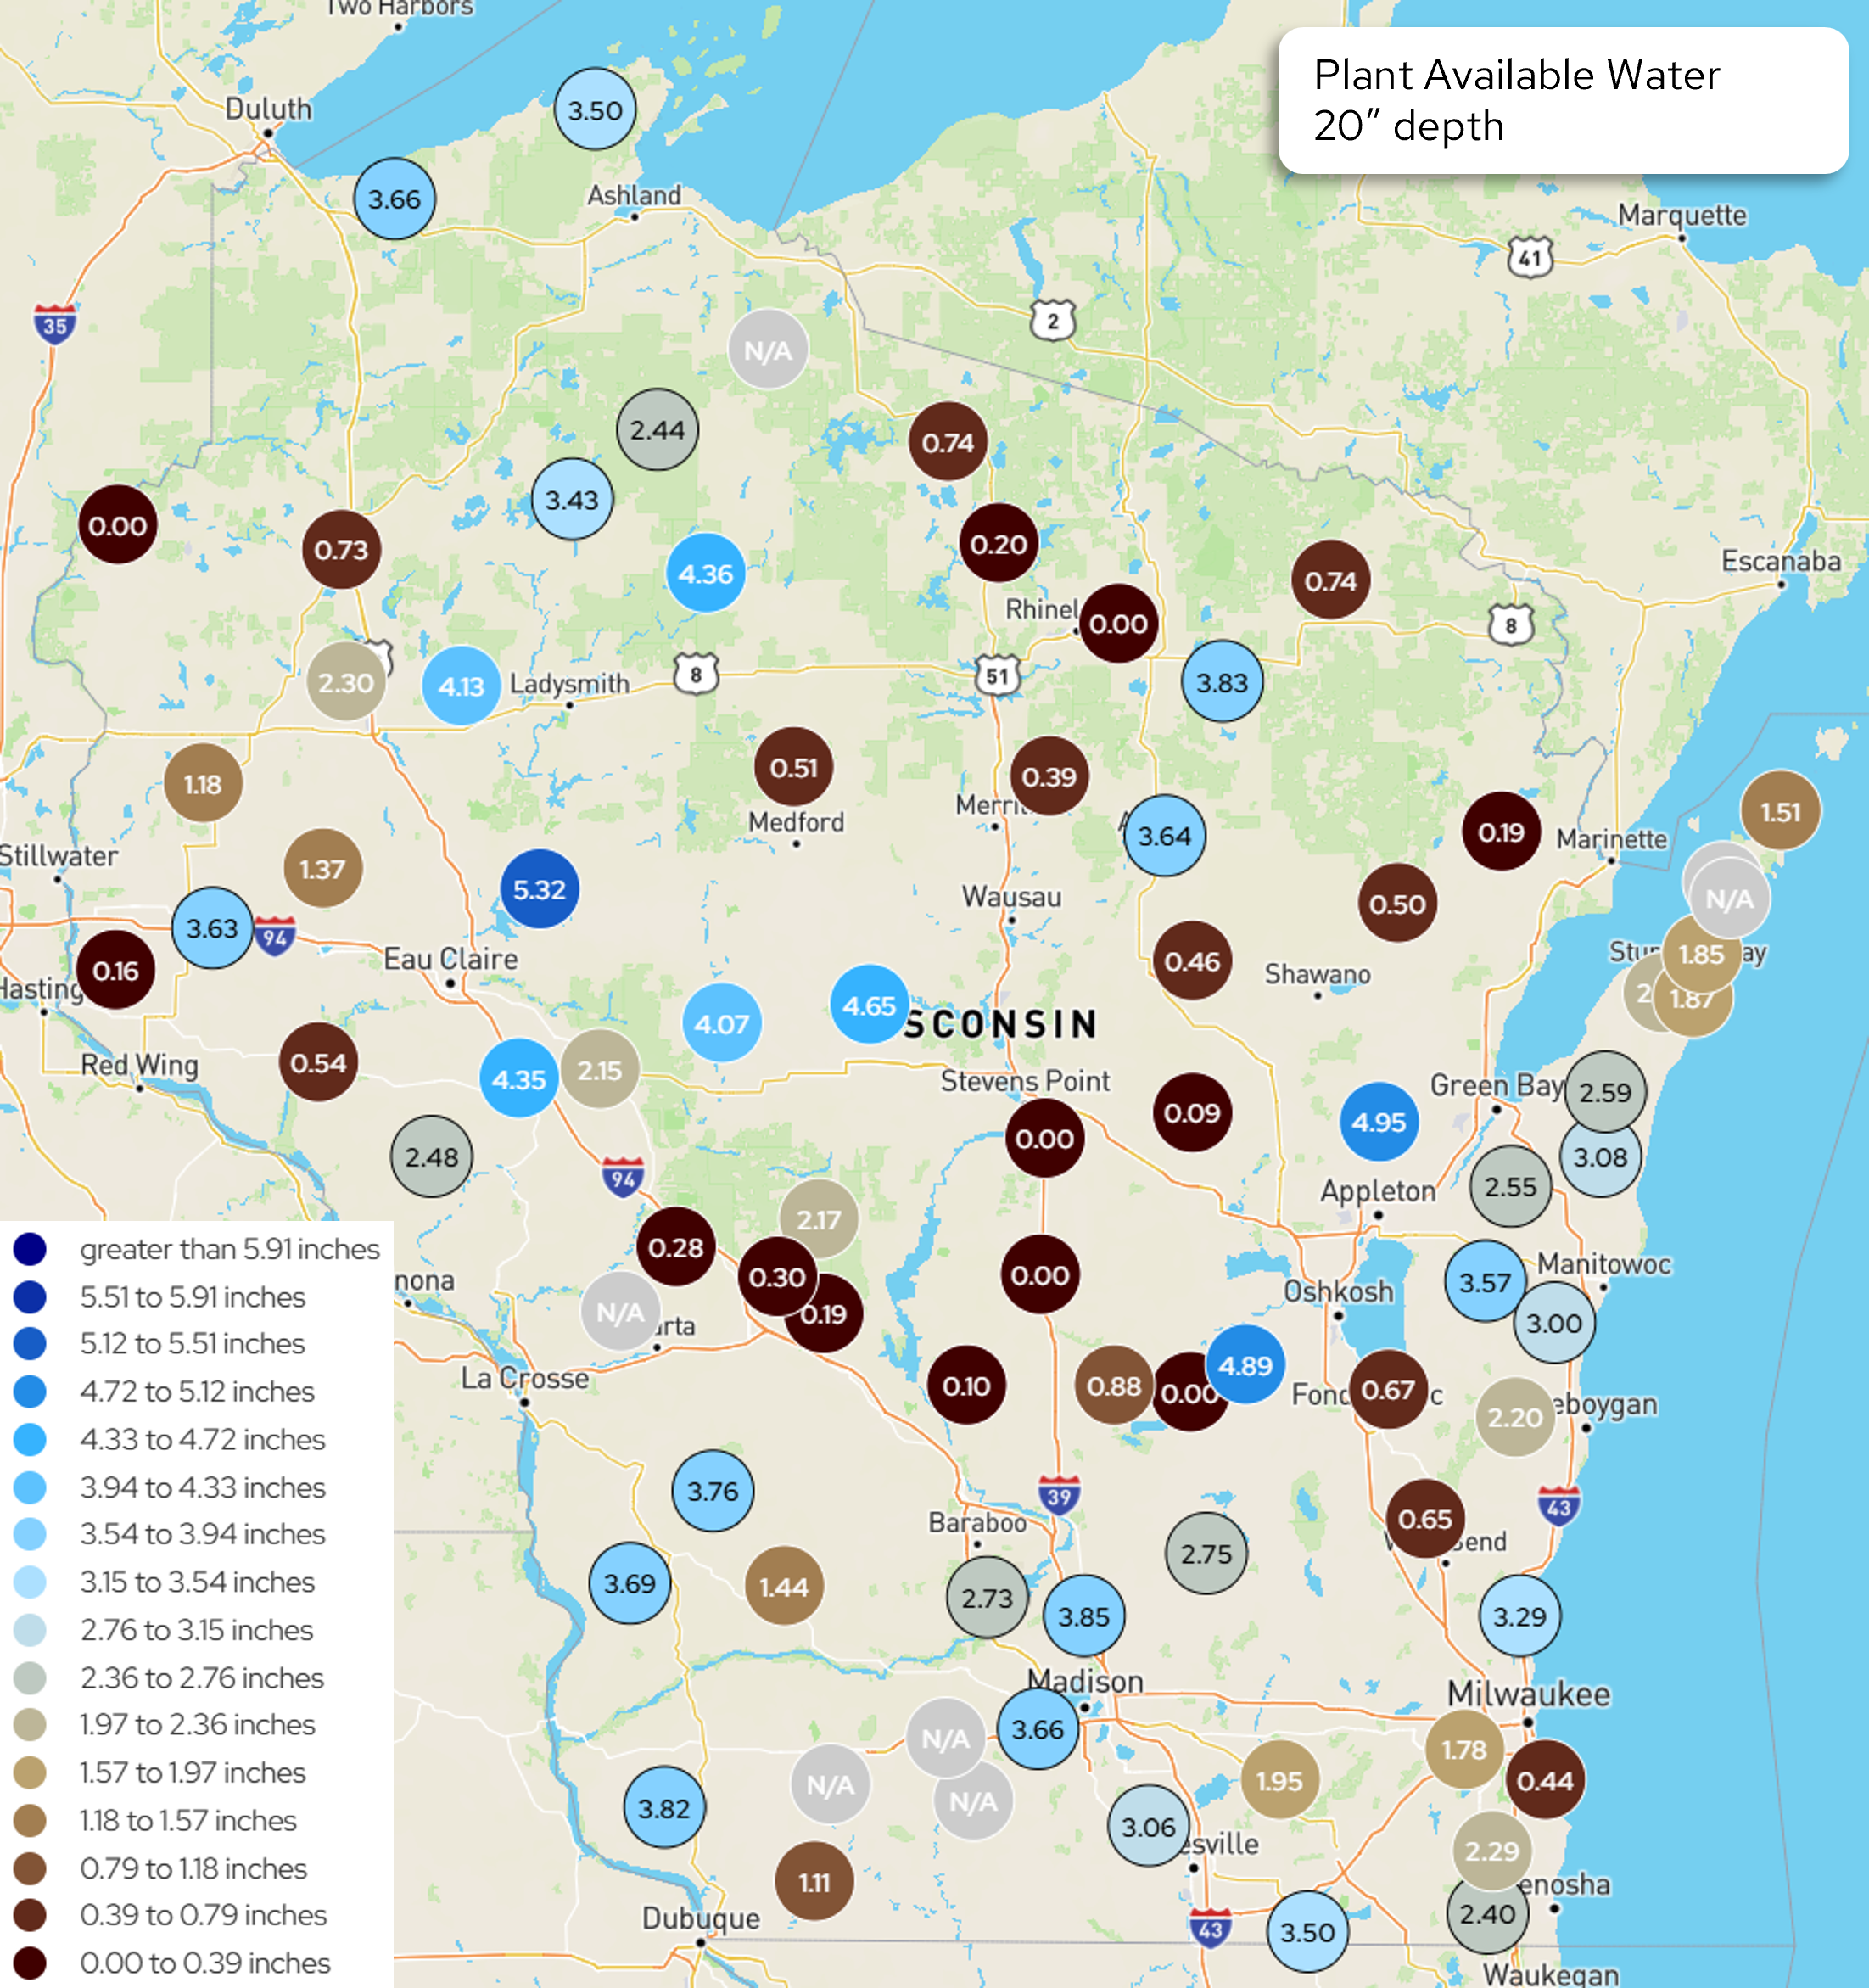
Image Description ↓
Map titled “Plant Available Water 20” depth” showing Wisconsin and surrounding areas. Circular markers display site values in inches, including very low values (0.00–0.30), moderate values (0.7–2.5), and higher values (3.0–5.3+), with some “N/A” points. Legend at left ranges from 0.00–0.39 inches (dark red) through increasing browns/tans (0.39–1.97 inches), light gray (2.36–3.15 inches), and blue shades (3.15–5.91+ inches, highest in dark blue). Southern and central Wisconsin (including Madison, La Crosse, and central counties) show many low values (0.00–0.79 inches). Western Wisconsin is mixed, with low values and scattered moderate readings (1–2.5 inches). Northern and north-central Wisconsin show higher soil water (about 3–4.5 inches, with some above 5 inches). Eastern Wisconsin (Green Bay to Appleton and lakeshore) includes moderate to high values (2.5–5 inches), though some lakeshore points remain below 1 inch.
- The maps show the daily average Wisconet plant available water (inches) on June 1st.
- The table shows total precipitation and changes in plant available water from May 25th (Start) to June 1st (End).
- What is plant available water? To learn more, read this article from UW Extension Ag Water Quality on plant available water. There is also a webinar from UW Extension on soil water management that you can watch.
- Example: Imagine that you have 4 inches of soil in the bottom of a bucket. In that soil, there are 1.5 inches of plant available water. Therefore, if you removed the soil and left only the water available for plant roots to take up, you would have 1.5 inches of water in the bottom of the bucket.
- The wilting point is when plant available water is at 0 inches, and the plant can no longer access water at that depth in the soil.
| Research Farm | County | Total Precipitation (in.) | 4″ Start | 4″ End | 8″ Start | 8″ End | 20″ Start | 20″ End |
|---|---|---|---|---|---|---|---|---|
| Arlington | Columbia | 0.02 | 0.82 | 0.34 | 1.68 | 0.90 | 4.86 | 3.85 |
| Black River Falls | Jackson | 0.62 | 0.00 | 0.00 | 0.13 | 0.07 | 0.43 | 0.28 |
| Dairy Forage ARS | Sauk | 0.38 | 0.60 | 0.26 | 1.14 | 0.70 | 3.31 | 2.73 |
| Hancock | Waushara | 0.40 | 0.00 | 0.00 | 0.04 | 0.00 | 0.18 | 0.00 |
| Kemp | Oneida | 0.00 | 0.31 | 0.04 | 0.66 | 0.20 | 0.79 | 0.20 |
| Lancaster | Grant | 0.00 | 0.66 | 0.28 | 1.44 | 0.72 | 4.54 | 3.82 |
| Marshfield | Marathon | 0.00 | 1.01 | 0.50 | 2.13 | 1.62 | 5.16 | 4.65 |
| O.J. Noer (Turfgrass) | Dane | 0.02 | 0.48 | 0.16 | 1.21 | 0.61 | 4.27 | 3.66 |
| Peninsular | Door | 0.06 | 0.41 | 0.11 | 0.78 | 0.36 | 2.40 | 1.85 |
| Rhinelander | Oneida | 0.11 | 0.03 | 0.00 | 0.07 | 0.00 | 0.07 | 0.00 |
| Spooner | Washburn | 0.06 | 0.28 | 0.00 | 0.41 | 0.00 | 1.20 | 0.73 |
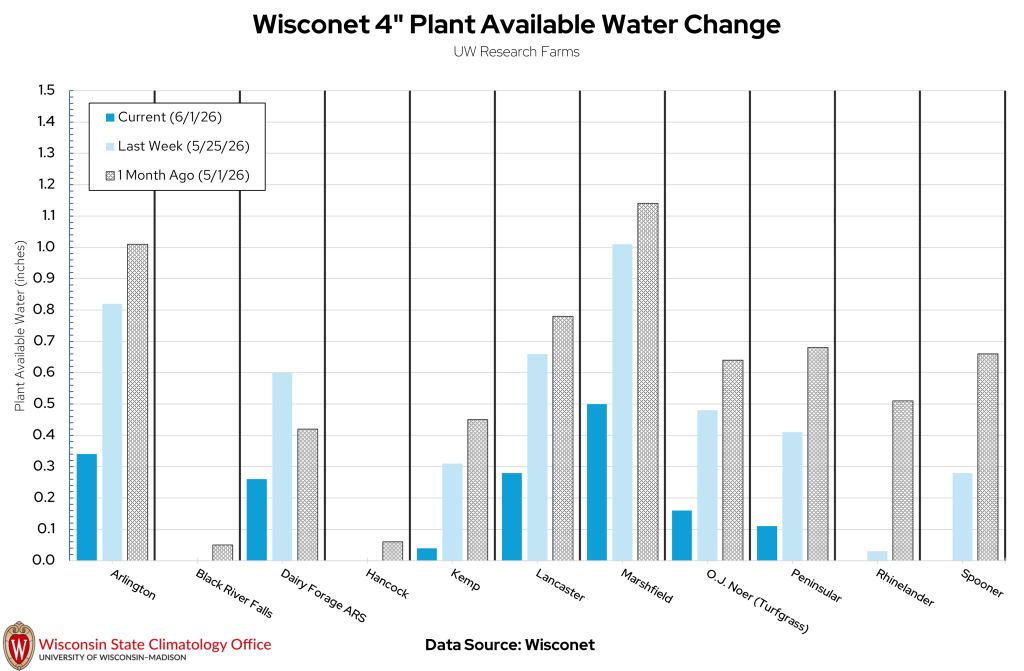
| Research Farm | Current 4″ Soil Moisture | Last Week’s 4″ Soil Moisture | 1 Month Ago 4″ Soil Moisture |
|---|---|---|---|
| Arlington | 0.34 | 0.82 | 1.01 |
| Black River Falls | 0.00 | 0.00 | 0.05 |
| Dairy Forage ARS | 0.26 | 0.60 | 0.42 |
| Hancock | 0.00 | 0.00 | 0.06 |
| Kemp | 0.04 | 0.31 | 0.45 |
| Lancaster | 0.28 | 0.66 | 0.78 |
| Marshfield | 0.50 | 1.01 | 1.14 |
| O.J. Noer (Turfgrass) | 0.16 | 0.48 | 0.64 |
| Peninsular | 0.11 | 0.41 | 0.68 |
| Rhinelander | 0.00 | 0.03 | 0.51 |
| Spooner | 0.00 | 0.28 | 0.66 |
USDA Soil Moisture Reports
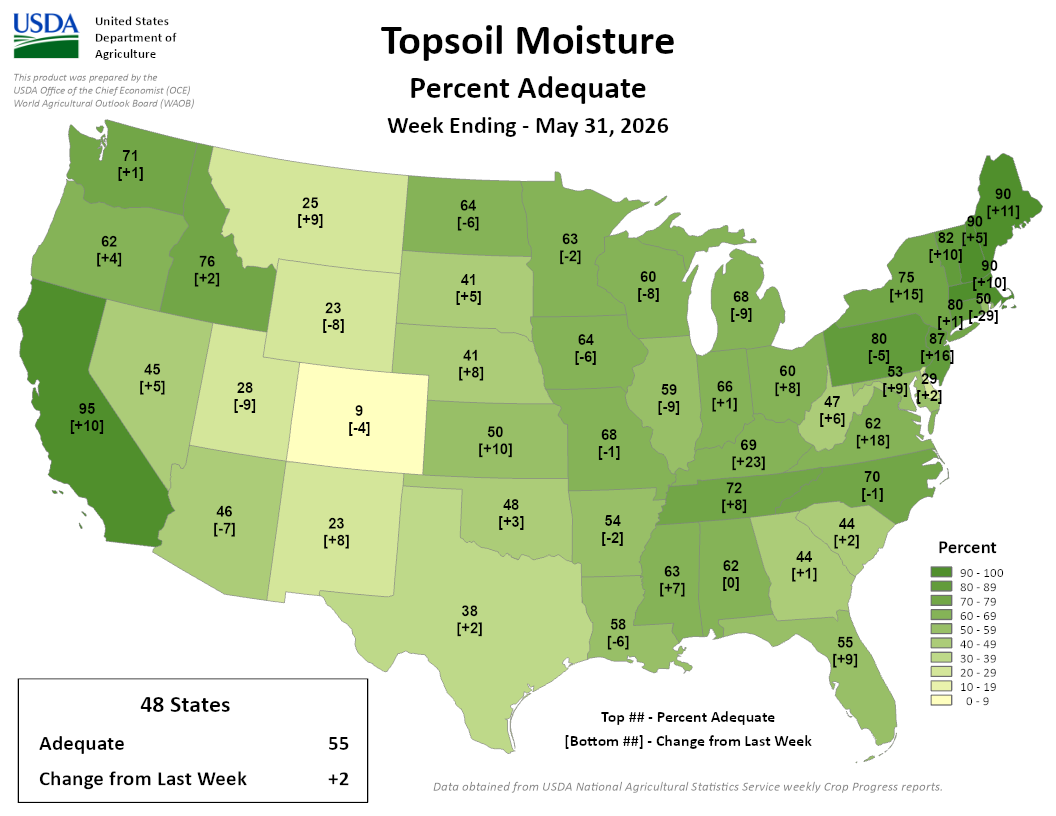
Image Description ↓
Map titled “Topsoil Moisture – Percent Adequate, Week Ending May 31, 2026” with USDA branding. Each U.S. state shows a percentage and weekly change in brackets (e.g., Illinois 59 [-9], Iowa 64 [-6], Michigan 68 [-9], Wisconsin 60 [-8]). Color scale ranges from low (0–9%, pale) to high (90–100%, dark green). Midwest states generally show moderate values around 59–68%. Plains vary from 41–64%. Western states include lower values (e.g., Colorado 9 [-4], Utah 28 [-9]). Northeast shows higher percentages (e.g., New York 75 [+15], Maine 90 [+11]). Southeast ranges widely (e.g., Florida 55 [+9], Georgia 44 [+1]). Bottom box reads “48 States Adequate: 55; Change from Last Week: +2.” Legend indicates percent ranges.
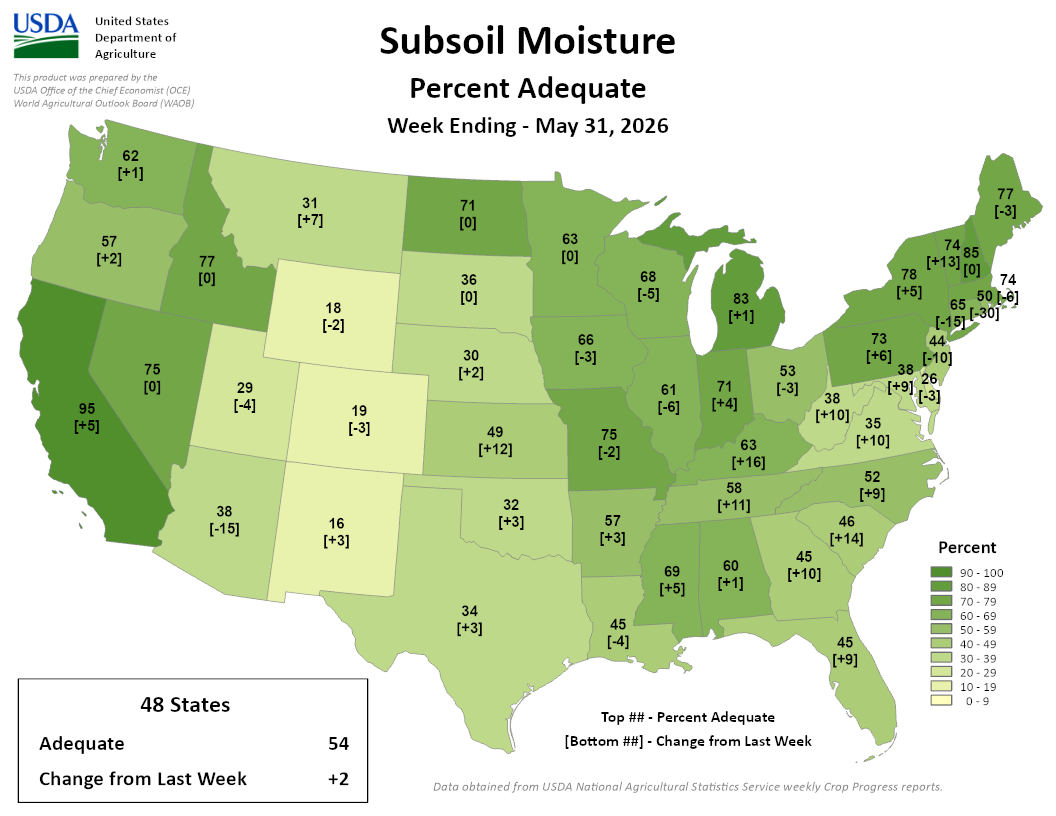
Image Description ↓
Map titled “Subsoil Moisture – Percent Adequate, Week Ending May 31, 2026” with USDA branding. Each U.S. state displays a percentage and weekly change in brackets (e.g., Wisconsin 63 [+0], Illinois 61 [-6], Iowa 66 [-3], Michigan 83 [+1]). A color scale ranges from low (0–9%, pale) to high (90–100%, dark green). Midwest states generally show moderate to high values: Wisconsin 63, Iowa 66, Minnesota 63, Michigan 83. Plains states vary from low to moderate (e.g., Nebraska 30 [+2], Kansas 49 [+12], North Dakota 71 [0]). Western states include lower values (e.g., Colorado 19 [-3], Wyoming 18 [-2], Arizona 16 [+3]). Northeast states show higher values (e.g., New York 73 [+6], Vermont 78 [+5], Maine 77 [-3]). Southeast ranges widely (e.g., Florida 45 [+9], Georgia 46 [+14], Alabama 60 [+1]). A summary box reads: “48 States Adequate: 54; Change from Last Week: +2.” Legend labels percent classes (0–9 up to 90–100).
- 60% and 68% of agricultural soils in the state are reported as having adequate topsoil and subsoil moisture, respectively. These values have decreased from last week.
- 34% and 22% of agricultural soils in the state are reported as having short to very short topsoil and subsoil moisture, respectively. These values have increased by over 10% from last week.
Wisconet Soil Temperature
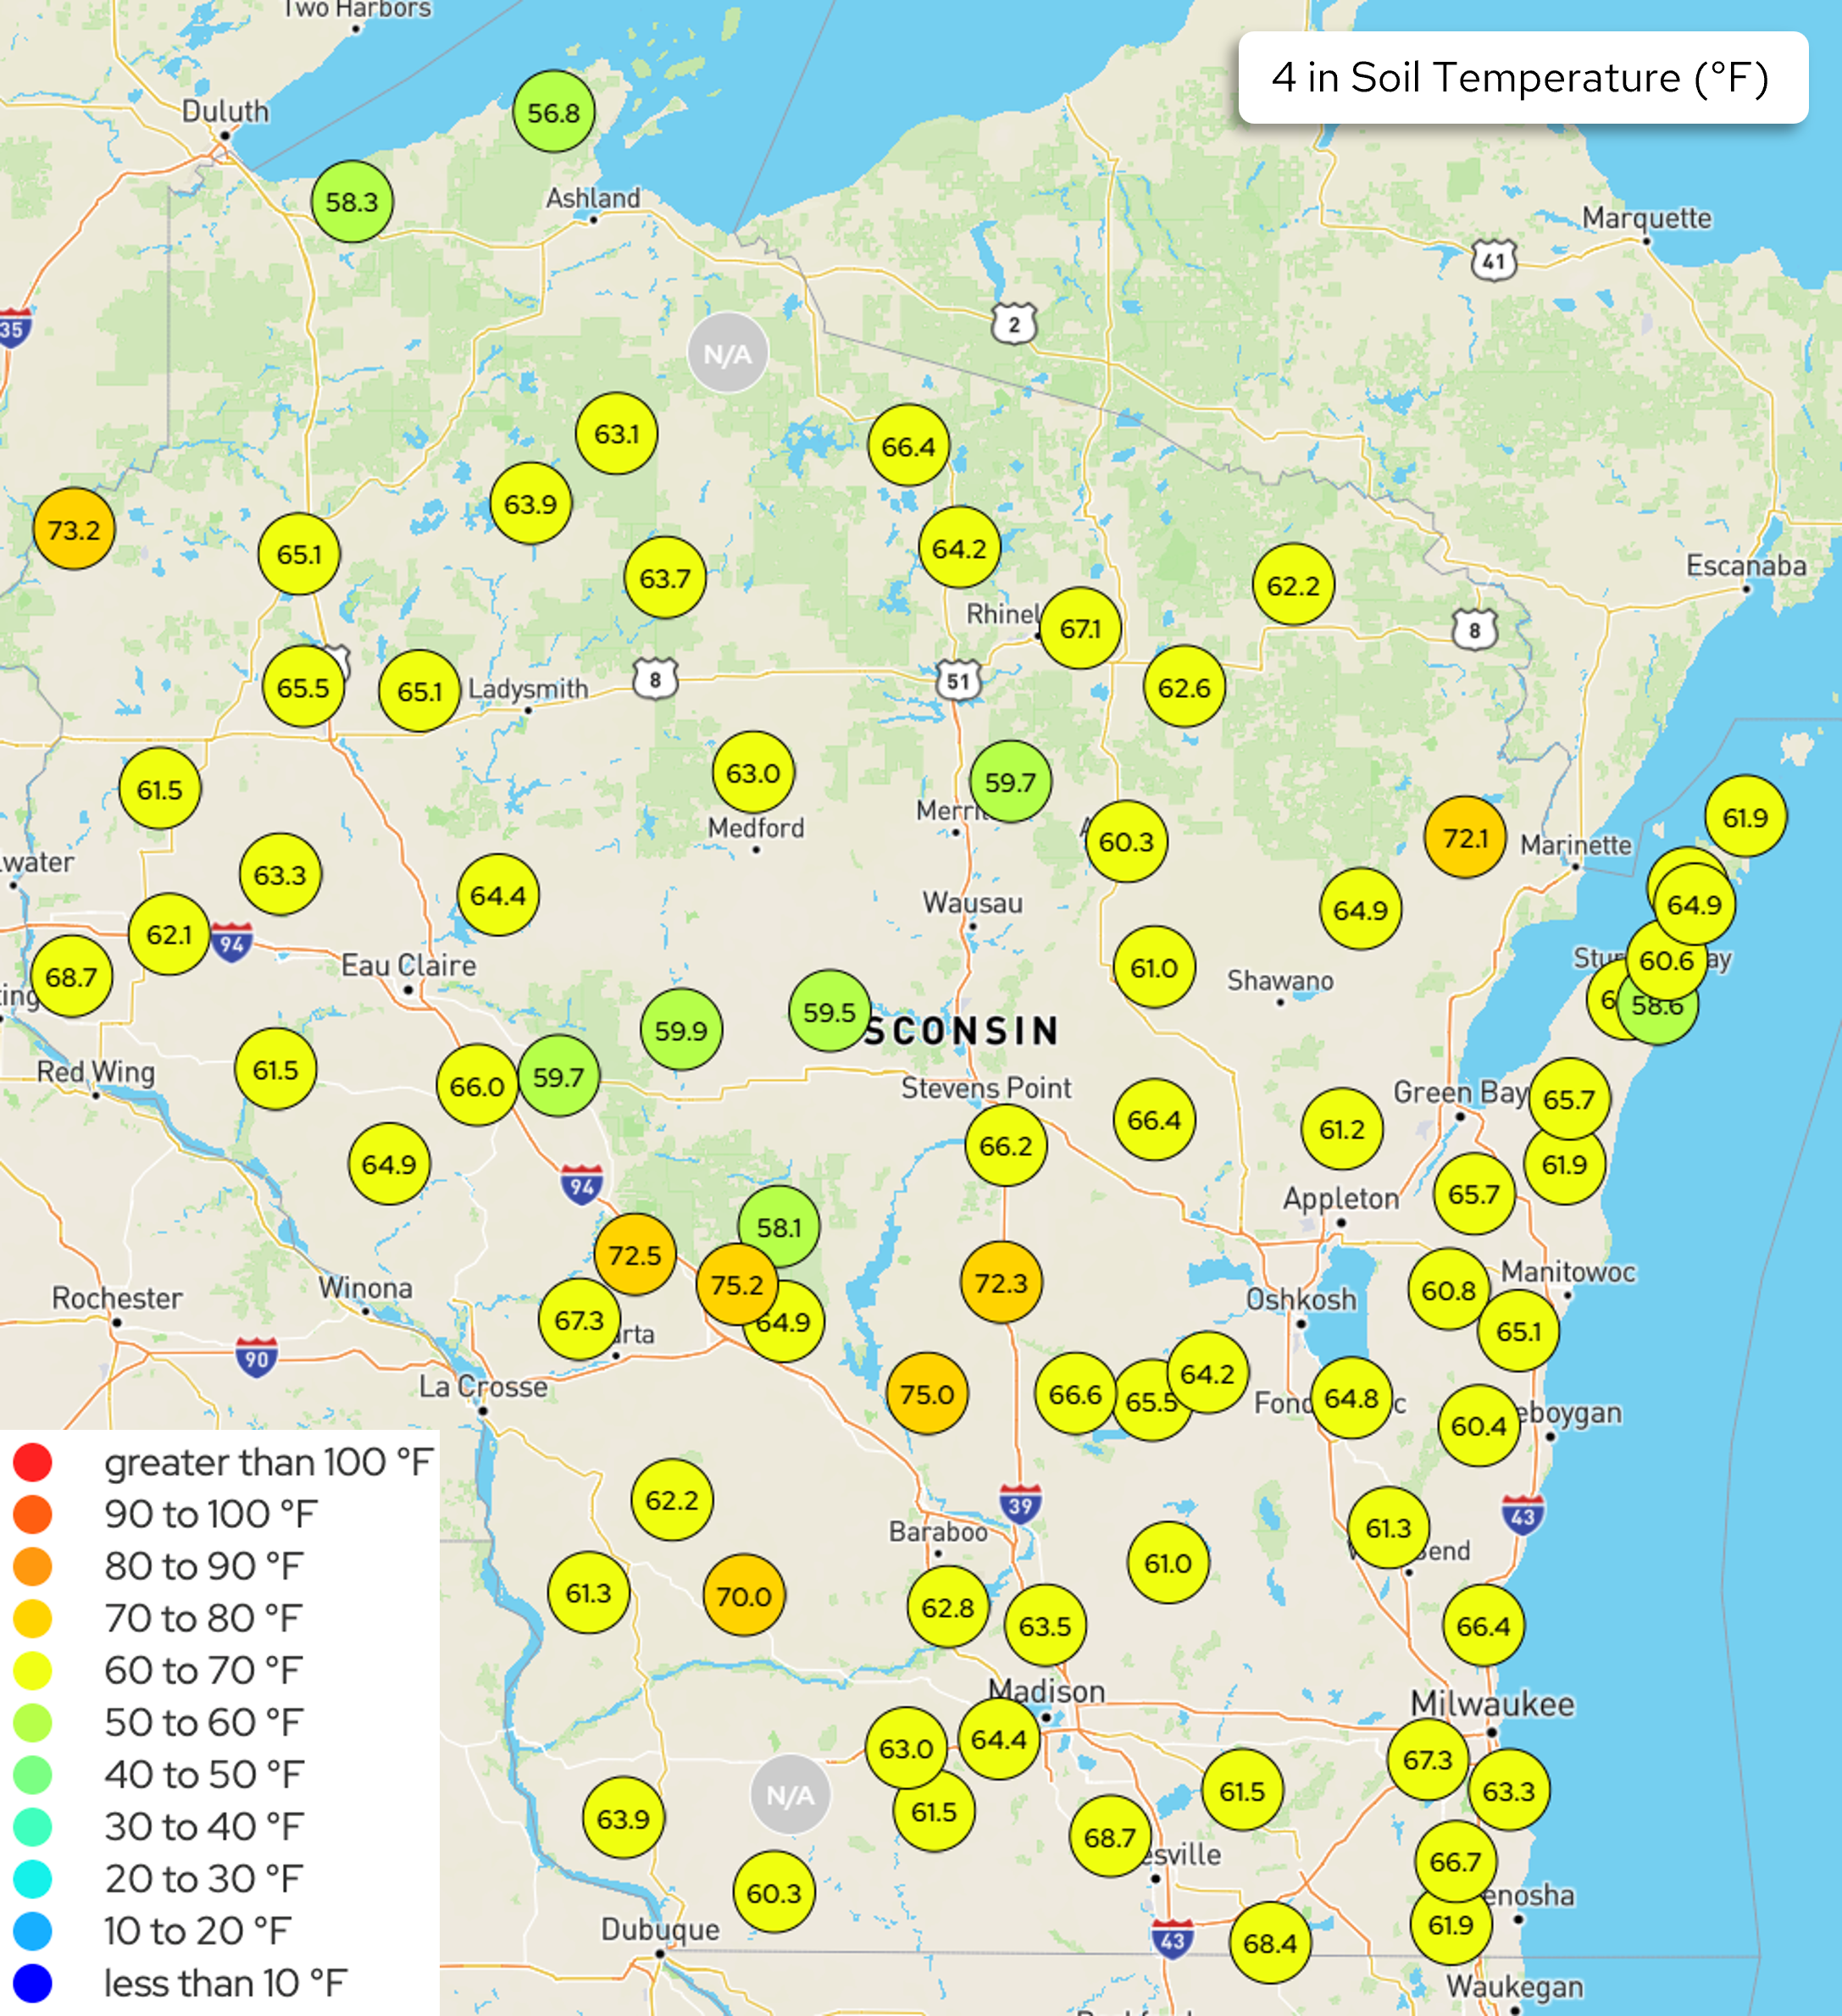
Image Description ↓
Map titled “4 in Soil Temperature (°F)” showing Wisconsin with labeled cities. Circular markers display soil temperatures in degrees Fahrenheit. A legend at left shows categories from less than 10°F (dark blue) up to greater than 100°F (red), with yellow indicating 60–70°F and green 50–60°F. Most stations across Wisconsin report temperatures in the 60–70°F range (yellow circles), including values such as 63.7, 64.4, 65.7, and 67.1°F. Northern Wisconsin is slightly cooler, with readings in the mid‑50s to low‑60s (e.g., 56.8°F, 58.3°F near Ashland). Southern and southwestern Wisconsin show warmer values in the low to mid‑70s (e.g., 72.3–75.2°F near La Crosse and southwest counties). Central areas (Wausau, Stevens Point) are generally in the low 60s. Eastern and lakeshore areas (Green Bay, Milwaukee) mostly range from about 61–68°F. One station shows “N/A.”
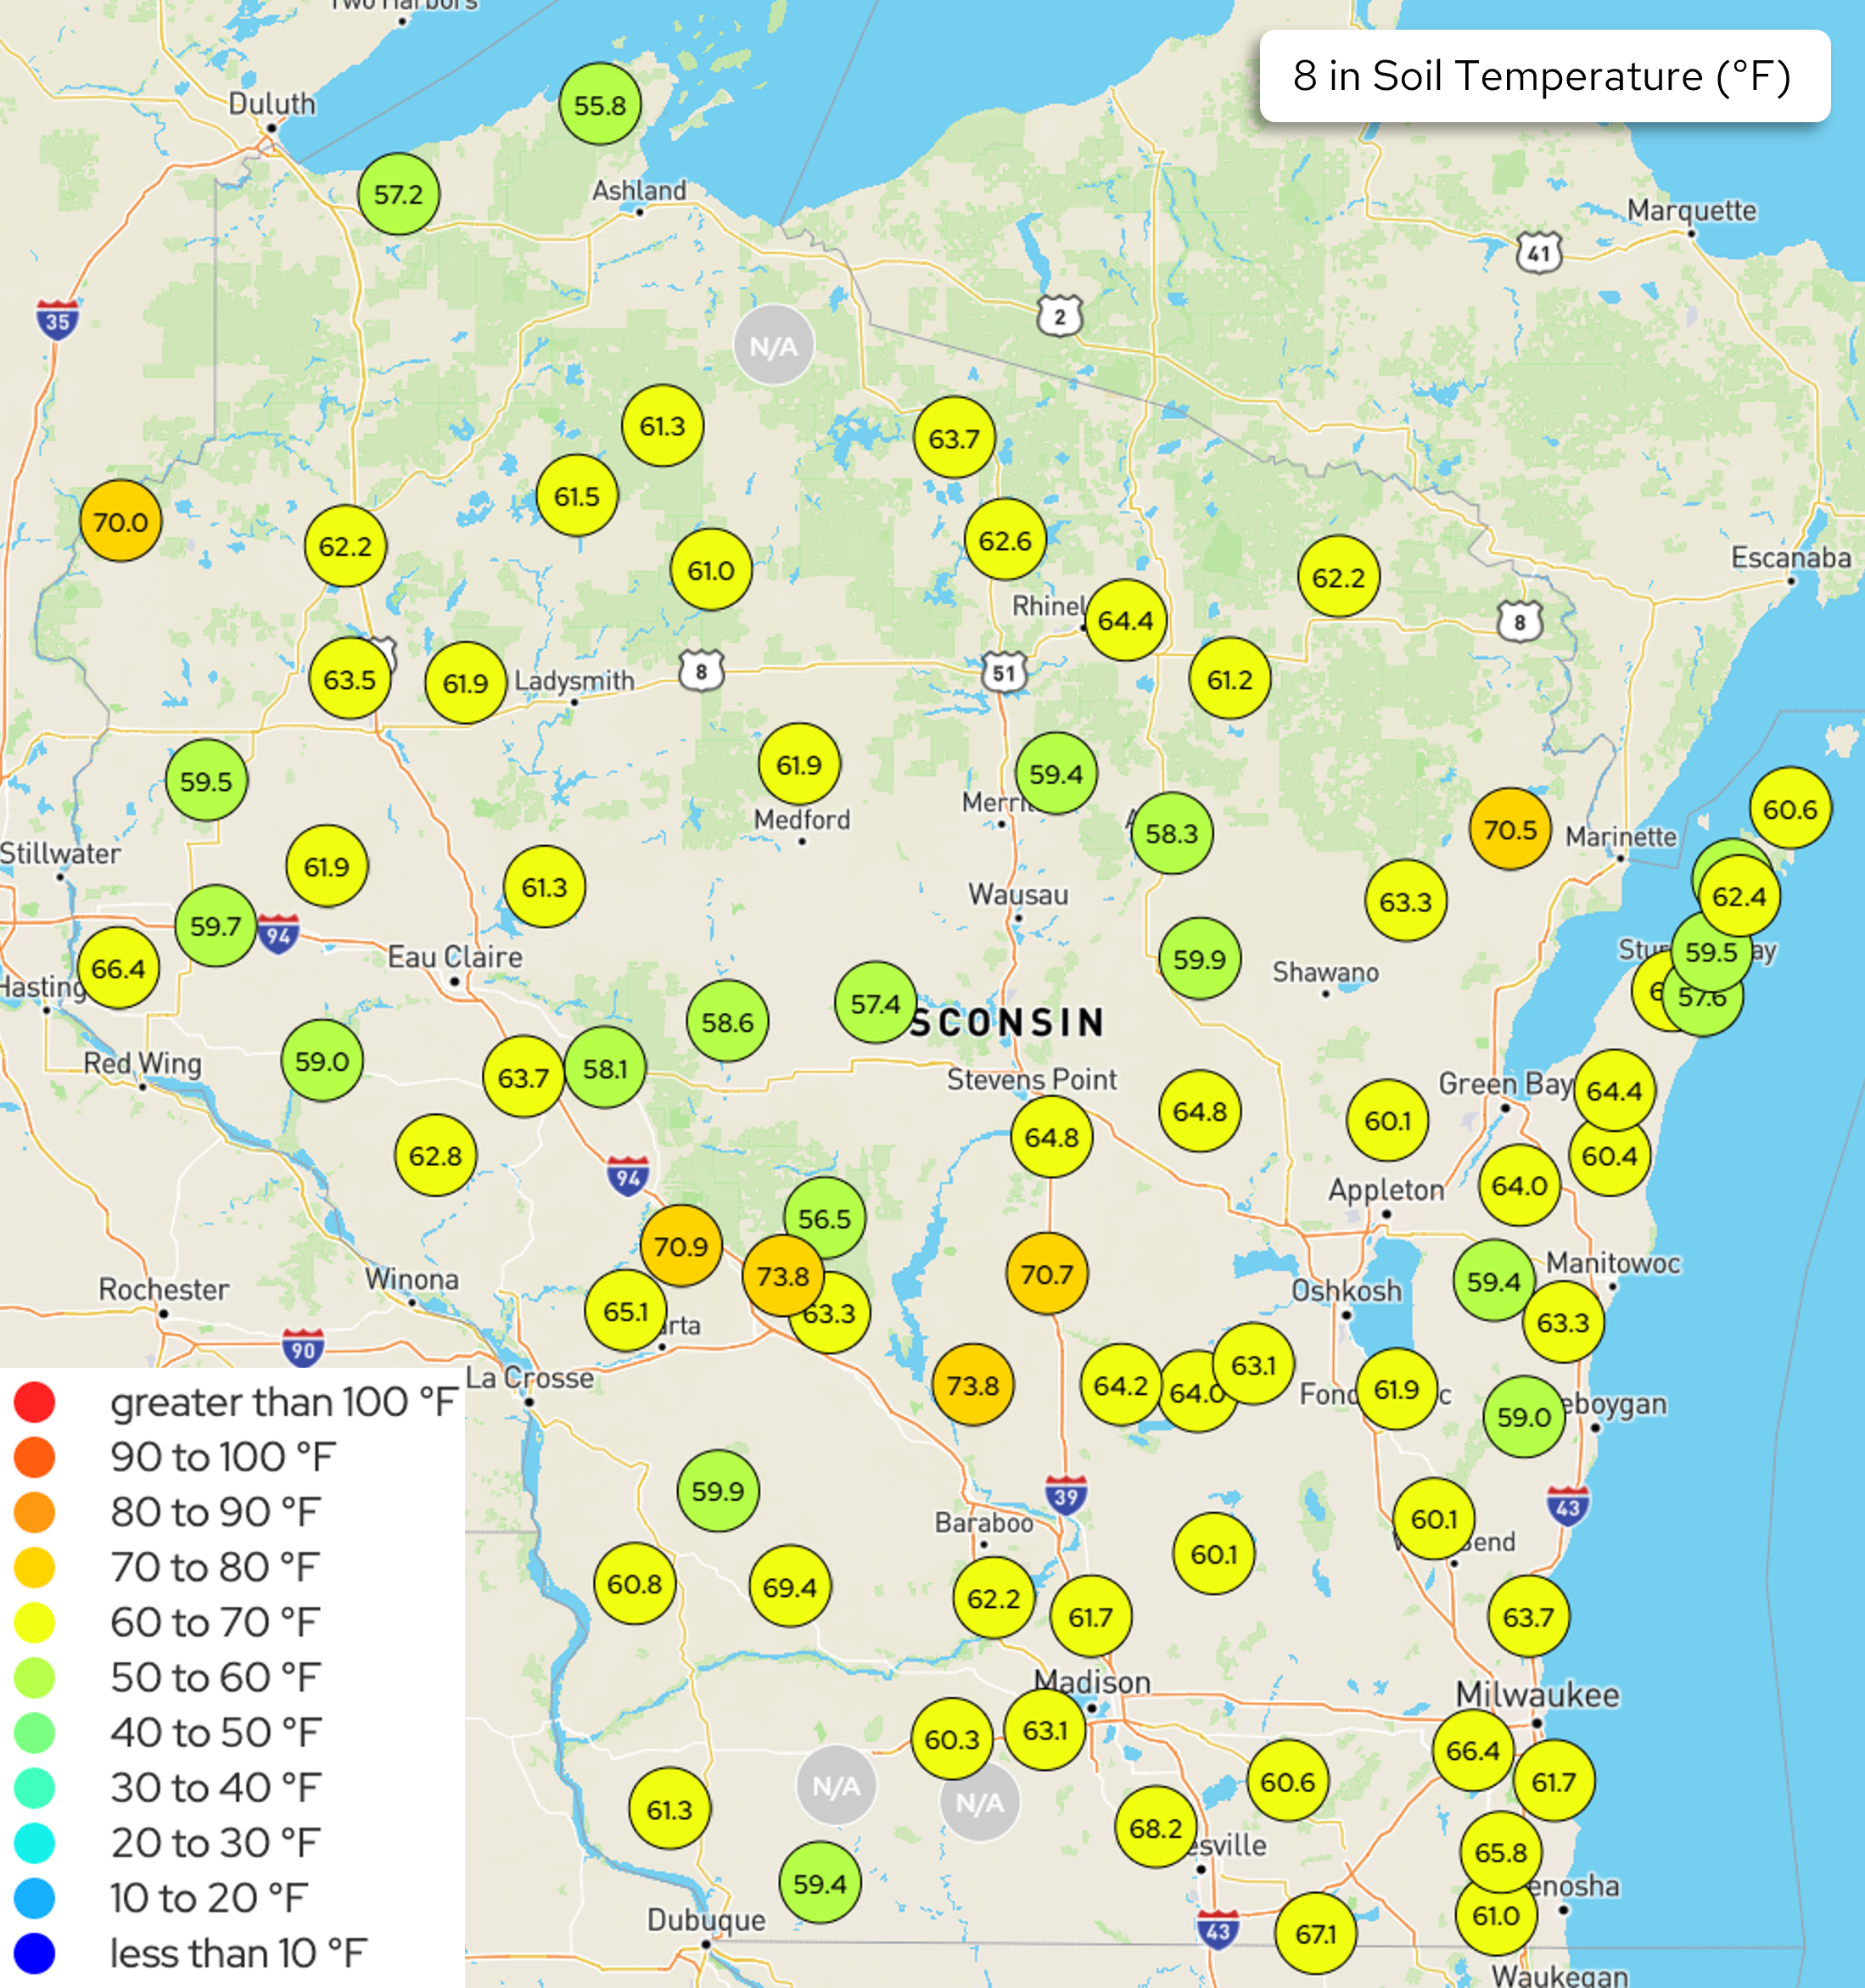
Image Description ↓
Map titled “8 in Soil Temperature (°F)” showing Wisconsin with labeled cities. Circular markers display soil temperatures in degrees Fahrenheit at monitoring sites. A legend at left shows ranges from less than 10°F (dark blue) up to greater than 100°F (red), with yellow representing 60–70°F and green 50–60°F. Most sites across Wisconsin fall between 60–65°F (yellow markers), including examples such as 61.0, 61.9, 63.1, and 64.8°F. Northern Wisconsin (near Ashland and Duluth) shows cooler readings in the mid‑50s to upper‑50s (e.g., 55.8, 57.2°F). Central regions (Wausau, Stevens Point) are largely in the upper‑50s to low‑60s (e.g., 58.3–62.6°F). Southern and southwestern Wisconsin (near La Crosse and southwest counties) include the highest readings, typically 70–74°F (e.g., 70.5, 70.9, 73.8°F). Eastern and lakeshore areas (Green Bay, Manitowoc, Milwaukee) show moderate values, mostly around 60–65°F, with some upper‑60s readings near the southeast. A few stations display “N/A.”
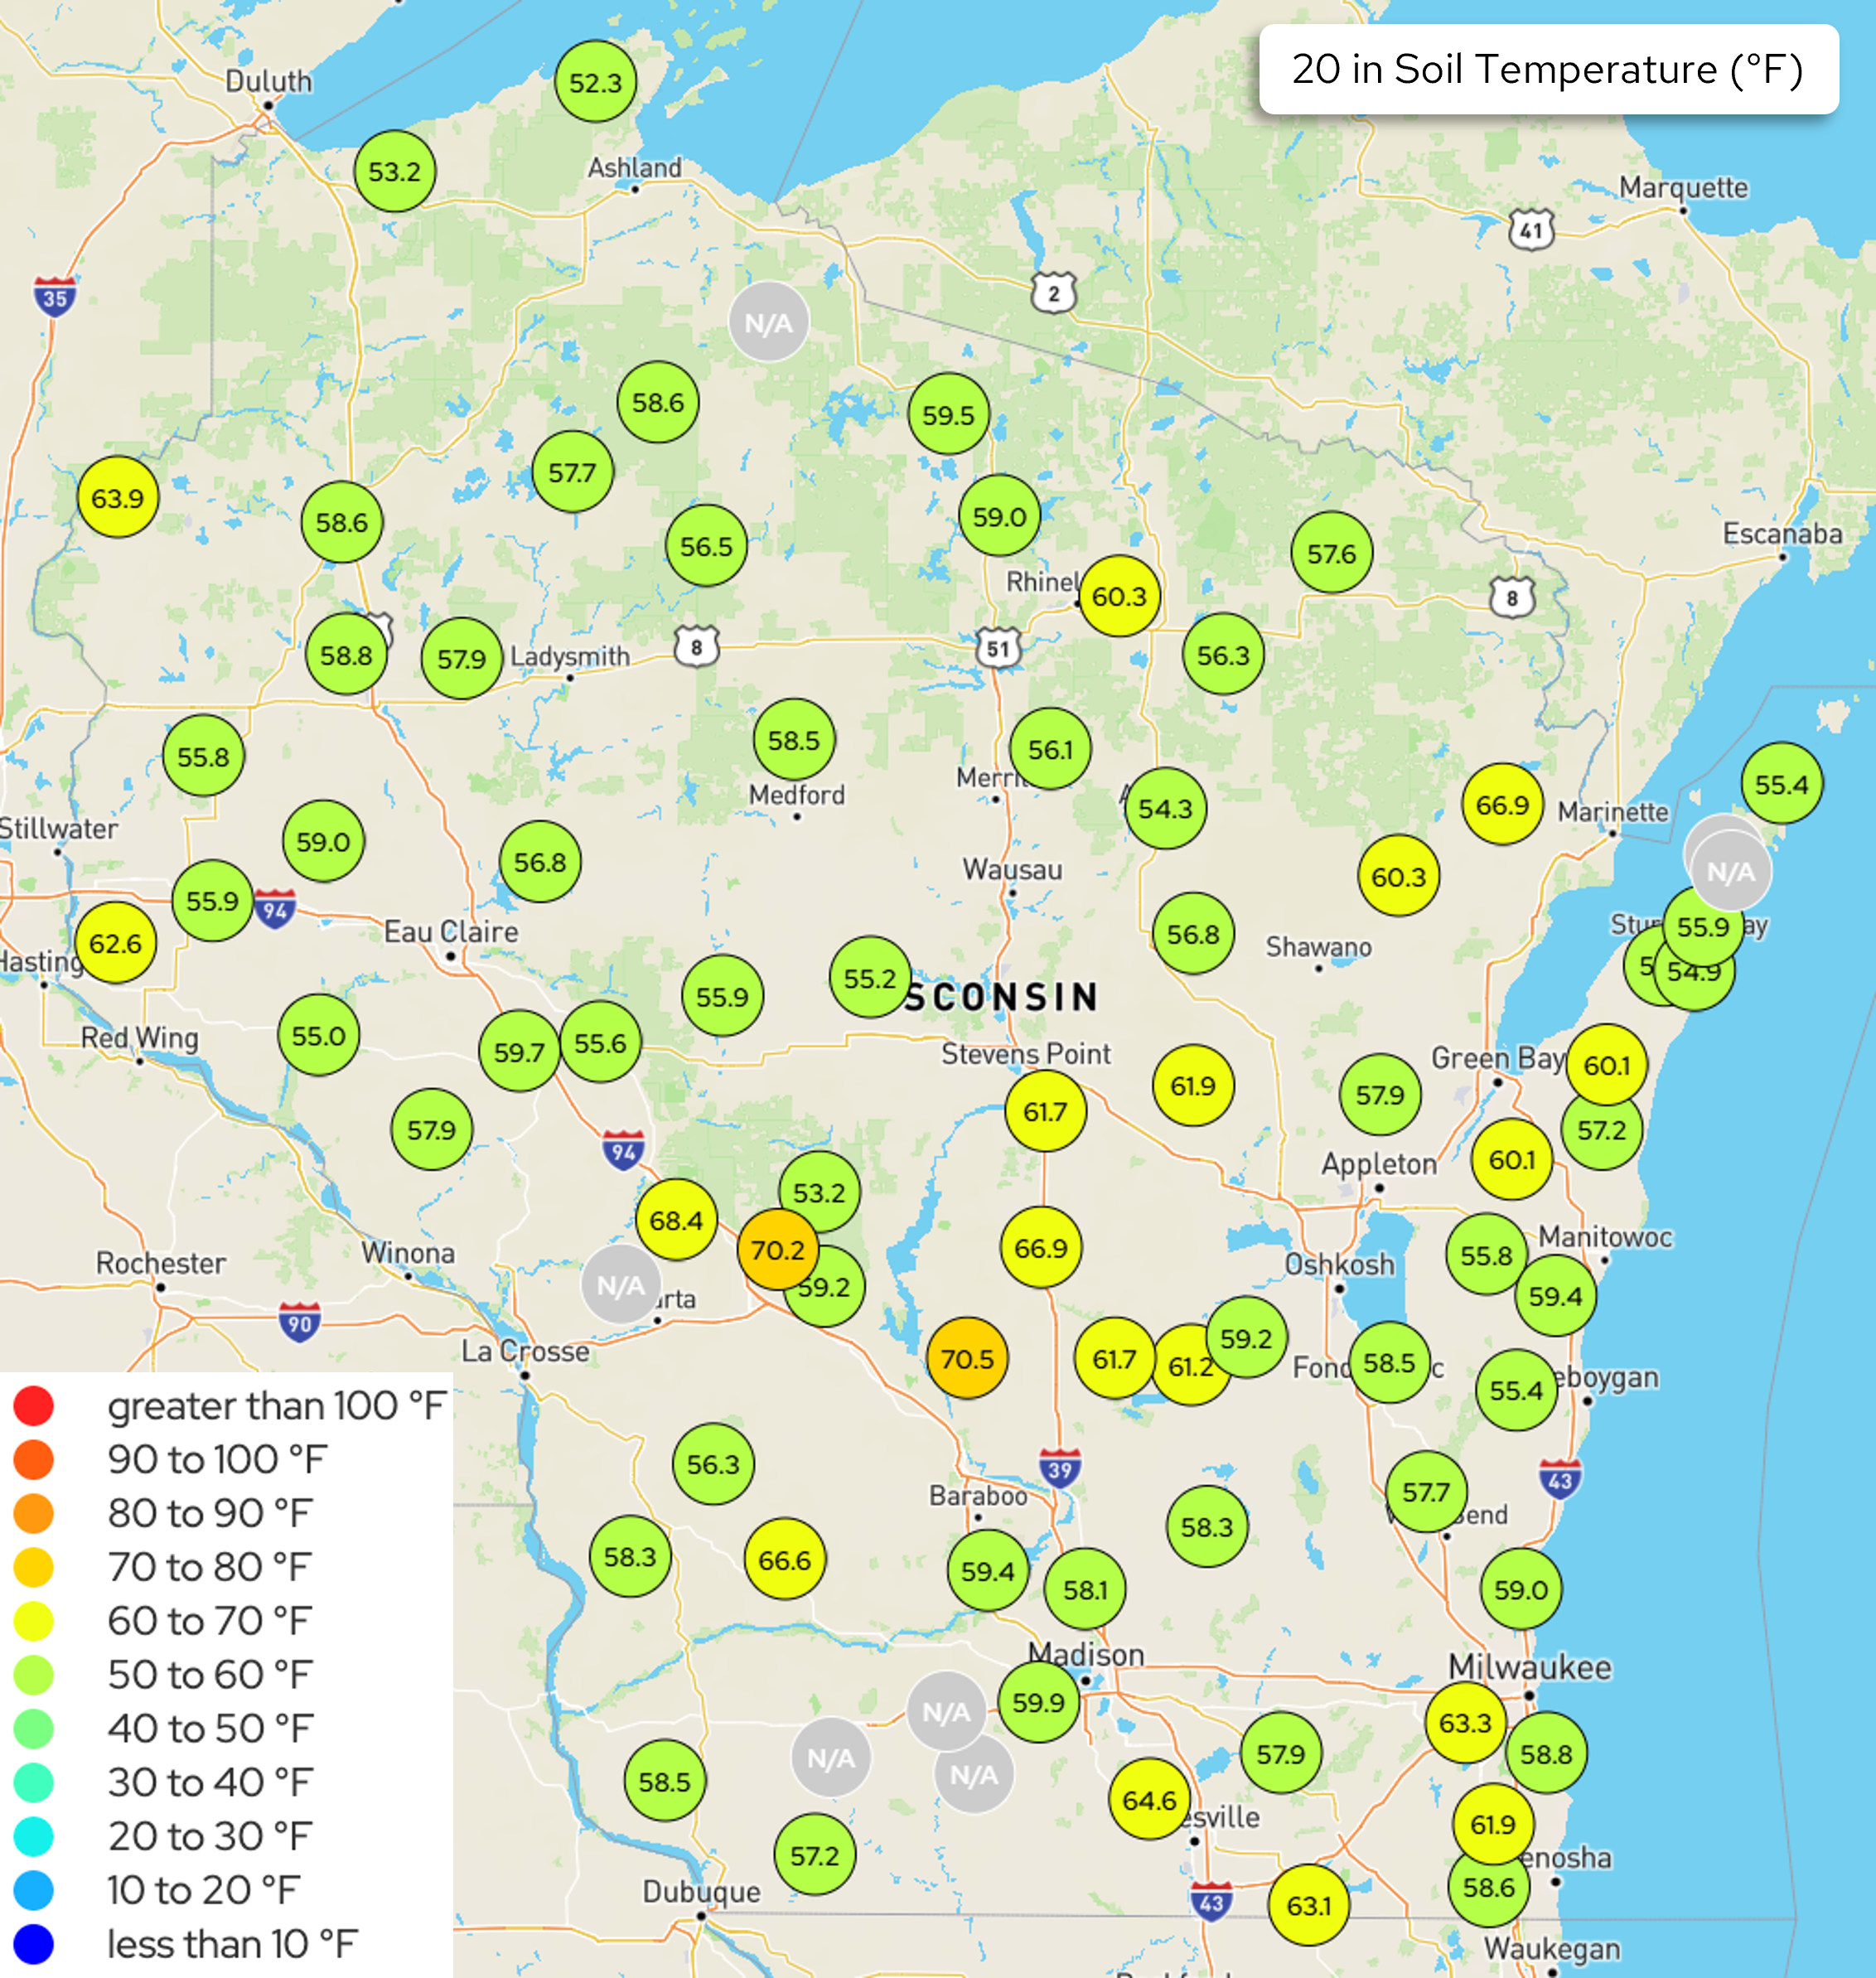
Image Description ↓
Map titled “20 in Soil Temperature (°F)” showing Wisconsin with labeled cities. Circular markers display soil temperatures in degrees Fahrenheit at monitoring locations. A legend at left shows temperature categories from less than 10°F (dark blue) to greater than 100°F (red), with green shades indicating 50–60°F and yellow 60–70°F. Most stations across Wisconsin fall in the 55–62°F range (green to yellow), with examples such as 56.5, 57.9, 59.4, and 60.3°F. Northern Wisconsin (near Ashland and Duluth) shows the coolest values, generally 52–56°F (e.g., 52.3, 53.2°F). Central areas (Wausau, Stevens Point, Medford) mostly range from mid‑50s to about 60°F (e.g., 54.3–59.5°F). Southern and southwestern Wisconsin shows the warmest readings, typically high‑60s to near 70°F (e.g., 66.9, 68.4, 70.2°F near La Crosse and southwest counties). Eastern and lakeshore areas (Green Bay, Manitowoc, Milwaukee) show moderate values, often around 57–61°F. Several stations display “N/A.”
- The maps show daily average Wisconet soil temperature conditions on June 1st.
U.S. Drought Monitor
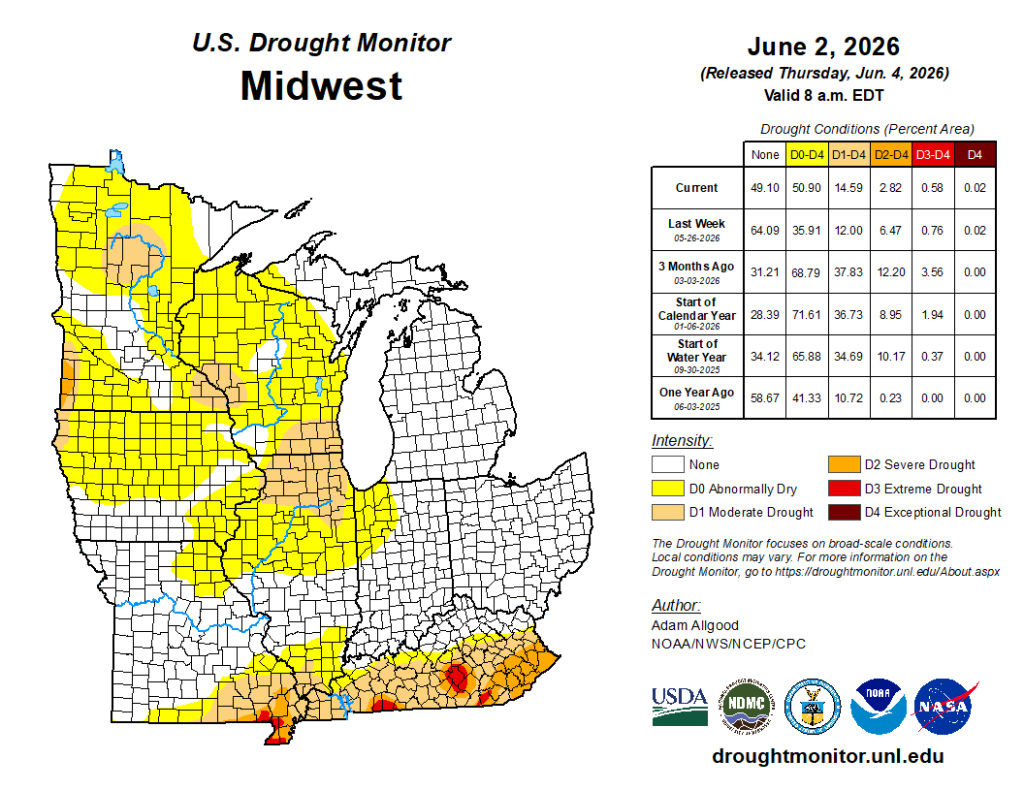
Image Description ↓
Map titled “U.S. Drought Monitor – Midwest” with date “June 2, 2026” and note “(Released Thursday, Jun. 4, 2026) Valid 8 a.m. EDT.” The map shows county-level drought intensity across Midwestern states (Minnesota, Wisconsin, Michigan, Illinois, Indiana, Ohio, Iowa, Missouri, Kentucky).
Color legend: None (gray), D0 Abnormally Dry (yellow), D1 Moderate Drought (tan), D2 Severe (orange), D3 Extreme (red), D4 Exceptional (dark red).
Most of Wisconsin, Minnesota, Iowa, Illinois, and parts of Indiana show D0 (yellow), indicating abnormally dry conditions. Areas of D1 (tan) appear in southern Wisconsin, Illinois, and parts of Missouri and Kentucky. More severe drought (D2–D3, orange to red) is concentrated farther south, especially in southern Missouri and Kentucky. Michigan and Ohio are largely “None” (gray), indicating no drought.
A table labeled “Drought Conditions (Percent Area)” lists:
- Current: None 49.10%, D0–D4 50.90%, D1–D4 14.59%, D2–D4 2.82%, D3–D4 0.58%, D4 0.02%
- Last Week: None 64.09%, D0–D4 35.91%
- 3 Months Ago: None 31.21%, D0–D4 68.79%
- Start of Year: None 28.39%, D0–D4 71.61%
- Start of Water Year: None 34.12%, D0–D4 65.88%
- One Year Ago: None 58.67%, D0–D4 41.33%
Text notes: “The Drought Monitor focuses on broad-scale conditions. Local conditions may vary.” Author: Adam Allgood (NOAA/NWS/NCEP/CPC). Logos for USDA, NDMC, NOAA, and droughtmonitor.unl.edu appear at bottom.
Compared to last week:
- Widespread 1 class degradation across the northern part of the region. D0 coverage increased by 15 percent. Further south, 1 class improvement was common across Kentucky and Missouri.
- 85.4% of the Midwest region is drought free (~14.6% in D1-D4).
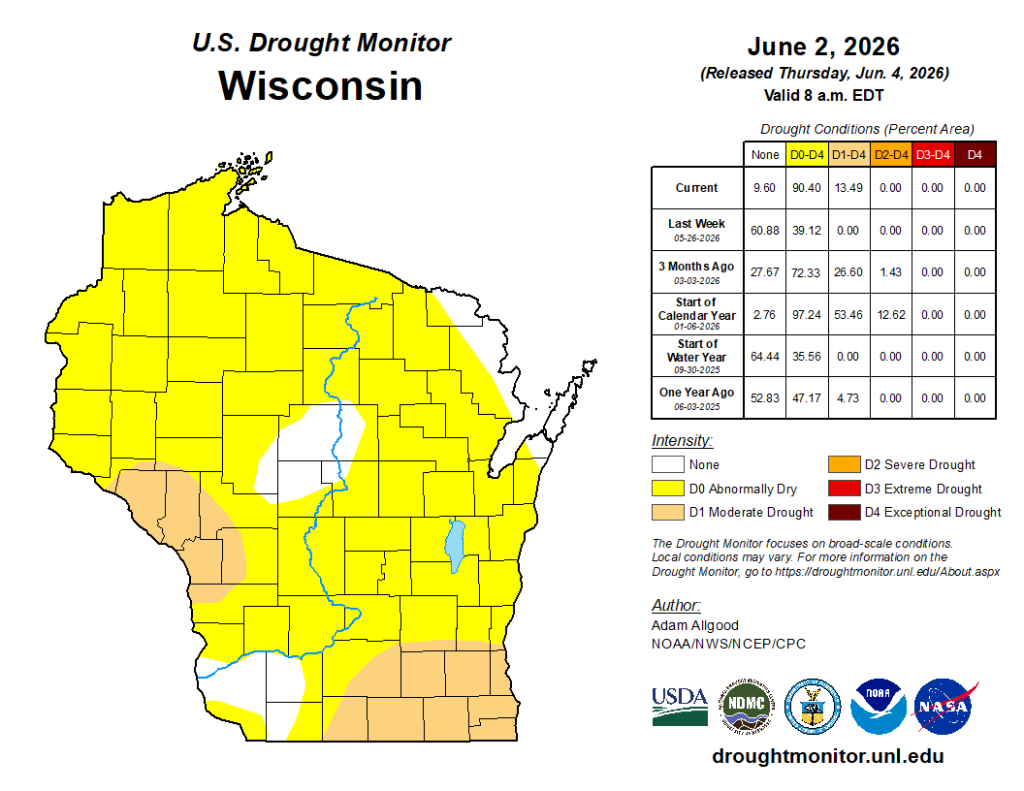
Image Description ↓
Map titled “U.S. Drought Monitor – Wisconsin” with date “June 2, 2026 (Released Thursday, Jun. 4, 2026), Valid 8 a.m. EDT.” County-level shading shows drought intensity.
Most of Wisconsin is yellow (D0 Abnormally Dry). Southern and southwestern counties show tan (D1 Moderate Drought). Small central and southwestern pockets are gray (None). No areas show D2–D4 (severe to exceptional drought).
A table labeled “Drought Conditions (Percent Area)” lists:
- Current: None 9.60%, D0–D4 90.40%, D1–D4 13.49%, D2–D4 0.00%, D3–D4 0.00%, D4 0.00%
- Last Week (05‑26‑2026): None 60.88%, D0–D4 39.12%
- 3 Months Ago: None 27.67%, D0–D4 72.33%, D1–D4 26.60%, D2–D4 1.43%
- Start of Calendar Year: None 2.76%, D0–D4 97.24%, D1–D4 53.46%, D2–D4 12.62%
- Start of Water Year: None 64.44%, D0–D4 35.56%
- One Year Ago: None 52.83%, D0–D4 47.17%, D1–D4 4.73%
Legend: None (gray), D0 (yellow), D1 (tan), D2 (orange), D3 (red), D4 (dark red). Text notes that drought conditions are broad-scale; local conditions may vary. Author: Adam Allgood, NOAA/NWS/NCEP/CPC; logos for USDA, NDMC, NOAA.
- D0 coverage jumped up to 90% of the state, with D1 drought now in southeastern and west-central counties.
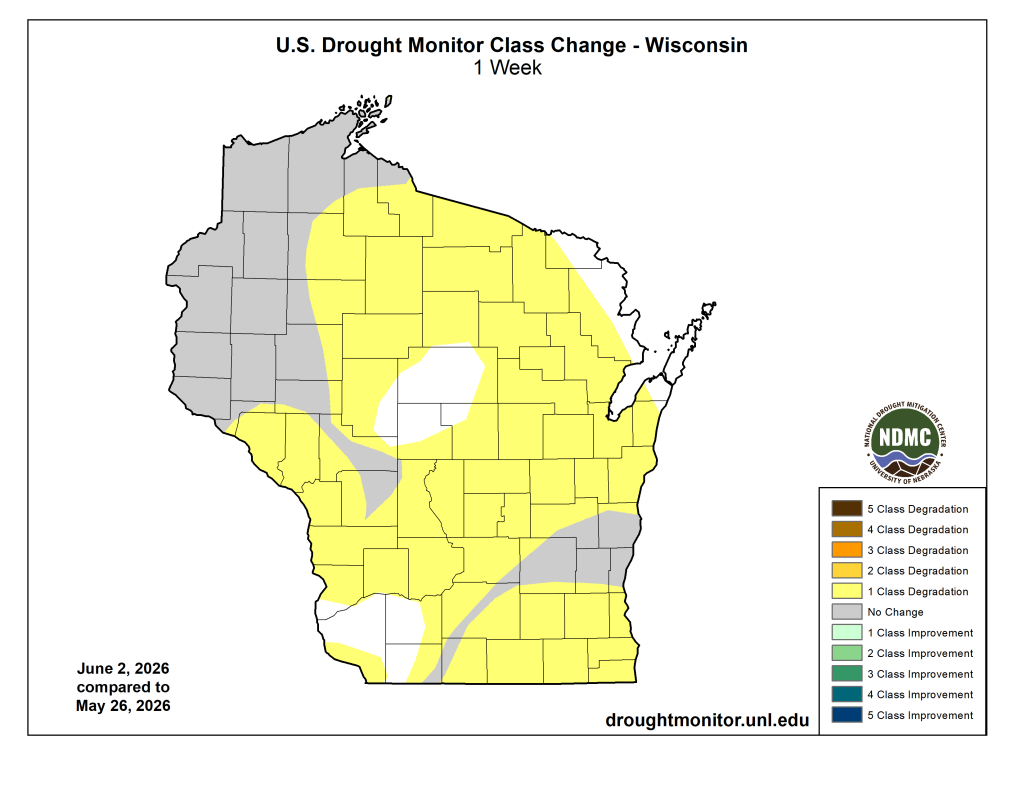
Image Description ↓
Map titled “U.S. Drought Monitor Class Change – Wisconsin, 1 Week.” Date note reads “June 2, 2026 compared to May 26, 2026.” The map shows county boundaries across Wisconsin with color-coded drought class changes.
Most of the state is shaded light yellow, representing “1 Class Degradation,” indicating drought conditions worsened by one category across the majority of counties. Gray areas (“No Change”) appear in parts of central, northwestern, and scattered southern counties. No counties display improvement colors (green/blue), and no areas show higher-level degradation (2–5 classes).
A legend on the right lists categories from “5 Class Degradation” (dark brown) down to “1 Class Degradation” (light yellow), “No Change” (gray), and “1–5 Class Improvement” (greens to blue). Only light yellow and gray are present on the map.
- Some areas of the state are now in D1 (moderate drought).
U.S. Drought Monitor Time Series
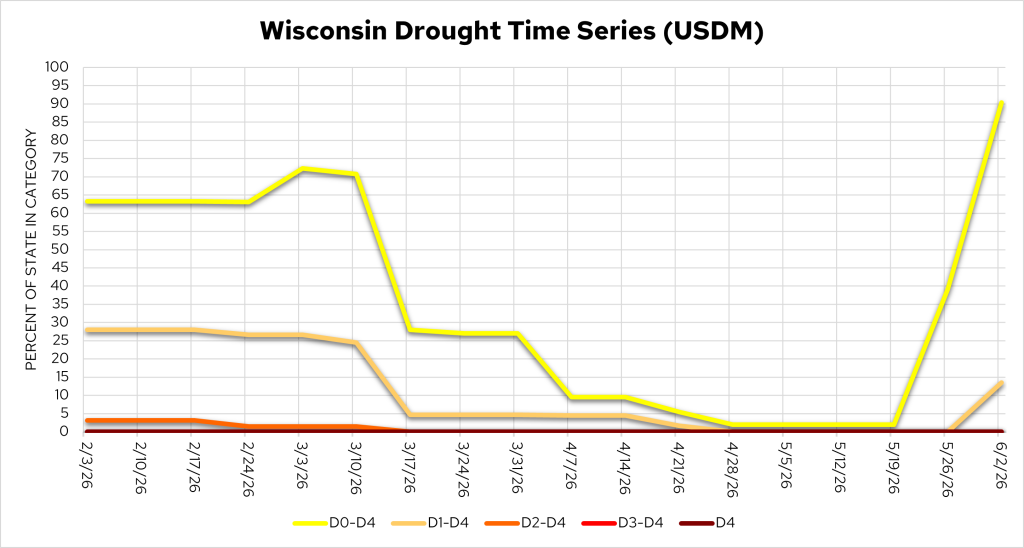
Image Description ↓
Line chart titled “Wisconsin Drought Time Series (USDM).” Y‑axis: “Percent of State in Category” from 0 to 100. X‑axis: weekly dates from early February 2026 (2/3/26) through June 2, 2026.
Five color-coded lines show drought coverage:
- D0–D4 (yellow): Starts near ~63% in early February, increases to ~72% in early March, drops sharply to ~27% by mid-March, declines to ~10% early April, reaches ~0–2% late April through mid-May, then rises rapidly to ~40% late May and ~90% by June 2.
- D1–D4 (tan): About ~27–28% in February, ~26% early March, falls to ~4–5% mid-March, near 0% by late April, then increases to ~13% by June 2.
- D2–D4 (orange): Around ~2–3% in early February, declines to 0% by mid-March and remains at 0%.
- D3–D4 (red) and D4 (dark red): Remain at 0% throughout the period.
Overall pattern shows drought conditions improving to near zero coverage in late April, followed by a rapid increase in late May into early June, driven mainly by D0 and some D1 categories.
Legend identifies categories (D0–D4 through D4).
- The state is no longer drought-free, with 13.4% of Wisconsin now in D1 drought.
Temperature Trends
7 Day Temperatures
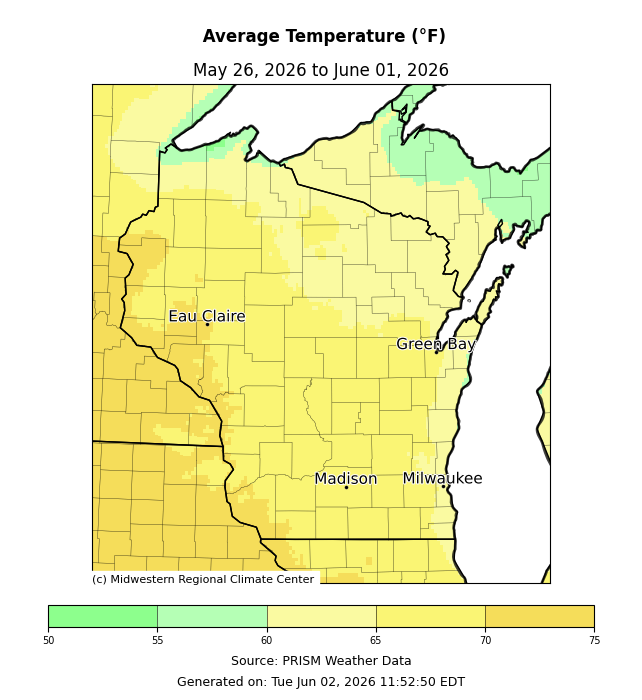
Image Description ↓
Map titled “Average Temperature (°F)” with date range “May 26, 2026 to June 01, 2026.” Wisconsin is shown with county boundaries and labeled cities.
A color scale ranges from 50°F (green) to 75°F (yellow/orange). Most of the state is shaded light yellow, indicating average temperatures around 65–70°F. Southwestern and western Wisconsin show warmer values (deeper yellow/orange), generally about 70–75°F. Northern and northeastern Wisconsin, including near Lake Superior and Lake Michigan, show cooler temperatures (green to light yellow), about 55–63°F. Central Wisconsin falls mostly in the mid‑60s to near 70°F.
Footer text reads “Source: PRISM Weather Data” and “Generated on: Tue Jun 02, 2026 11:52:50 EDT,” with credit to the Midwestern Regional Climate Center.
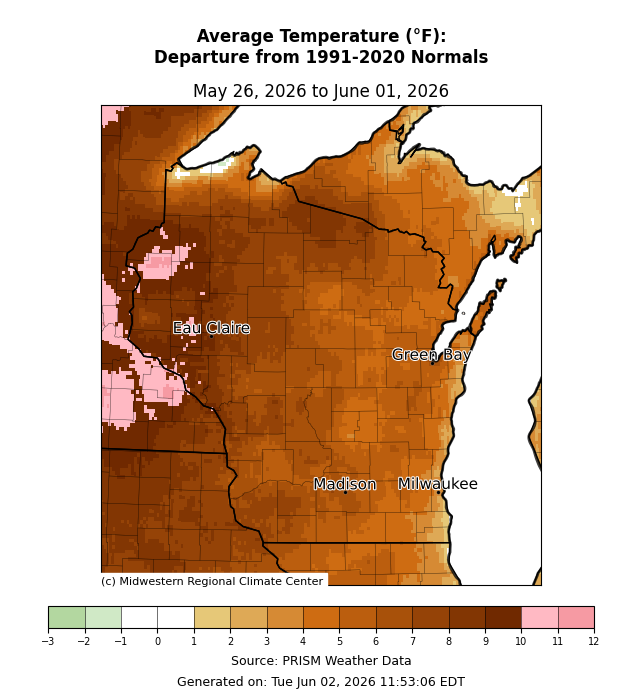
Image Description ↓
Map titled “Average Temperature (°F): Departure from 1991–2020 Normals” with date range “May 26, 2026 to June 01, 2026.” Wisconsin is shown with county boundaries and labeled cities.
A color scale ranges from −3°F (green) to +12°F (pink). Nearly all of Wisconsin is shaded in orange to brown tones, indicating above-normal temperatures. Most areas fall roughly in the +4 to +9°F range. Western and northwestern Wisconsin show the largest positive departures (dark brown to pink), about +8 to +12°F above normal. Central and southern Wisconsin are mostly +5 to +8°F above normal. Eastern Wisconsin near Lake Michigan shows slightly smaller departures (lighter orange/tan), generally around +3 to +6°F above normal. No widespread below-normal areas are present.
Footer text reads “Source: PRISM Weather Data” and “Generated on: Tue Jun 02, 2026 11:53:06 EDT,” with credit to the Midwestern Regional Climate Center.
- Average temperatures ranged from 70-75°F along the Mississippi River to 55-60°F along Lake Superior.
- Temperatures were 4-8°F above normal across most of the state, with areas of 10°F or more above normal in the northwest.
30 Day Temperatures
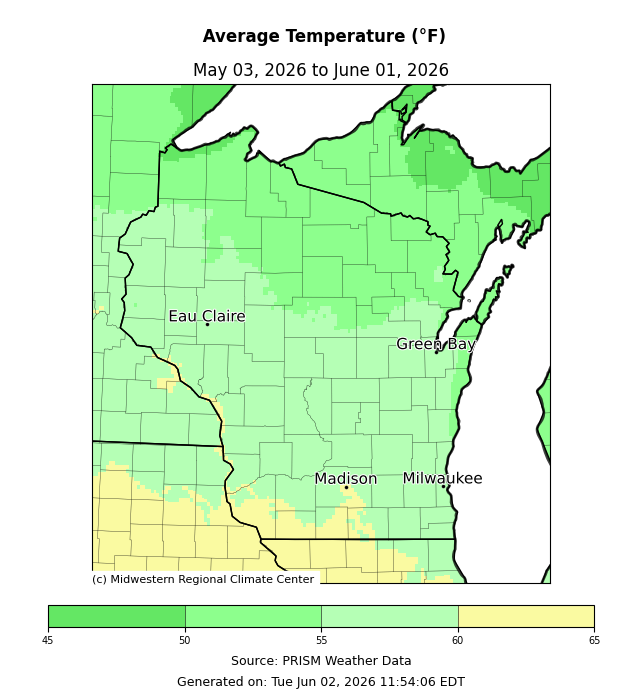
Image Description ↓
Map titled “Average Temperature (°F)” with date range “May 03, 2026 to June 01, 2026.” Wisconsin is shown with county boundaries and labeled cities.
A color scale at the bottom ranges from 45°F (dark green) to 65°F (light yellow). Most of Wisconsin is shaded green to light green, indicating average temperatures around 50–60°F. Northern Wisconsin, especially near Lake Superior, shows cooler values (darker green), generally about 45–55°F. Central Wisconsin falls mainly in the mid‑50s. Southern Wisconsin, including areas near Madison and toward the Illinois border, shows warmer values (lighter green to yellow), typically about 58–65°F.
Text at bottom reads “Source: PRISM Weather Data” and “Generated on: Tue Jun 02, 2026 11:54:06 EDT,” with credit to the Midwestern Regional Climate Center.
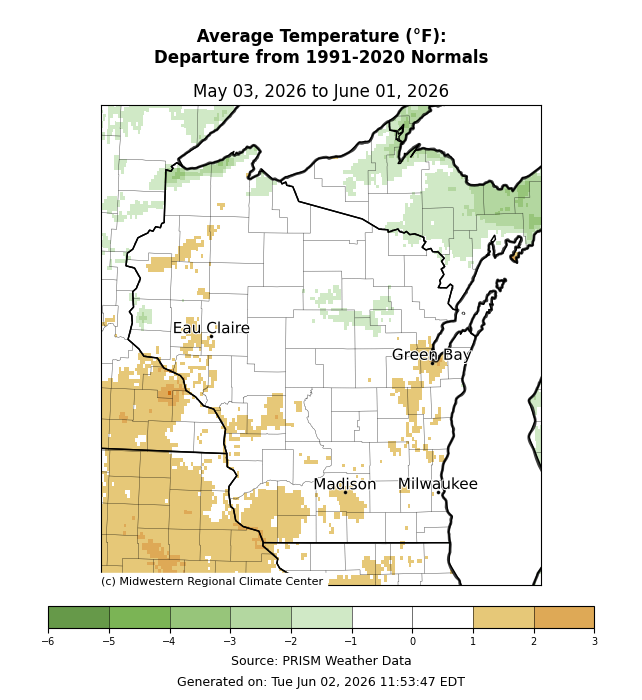
Image Description ↓
Map titled “Average Temperature (°F): Departure from 1991–2020 Normals” with date range “May 03, 2026 to June 01, 2026.” Wisconsin is displayed with county boundaries and labeled cities.
A color scale ranges from −6°F (dark green) through 0°F (white/gray) to +3°F (tan/orange). Most of Wisconsin appears near normal (white to light gray, around −1 to +1°F). Northern Wisconsin and areas near Lake Superior show cooler-than-normal temperatures (green shades, roughly −2 to −5°F). Southwestern Wisconsin and parts of the west show warmer-than-normal departures (tan/orange, about +1 to +3°F).
Central and eastern Wisconsin, including Madison and Milwaukee, are mostly near normal with scattered small patches of slight warming or cooling. No large areas exceed ±3°F departure.
Footer text reads “Source: PRISM Weather Data” and “Generated on: Tue Jun 02, 2026 11:53:47 EDT,” credited to the Midwestern Regional Climate Center.
Growing Degree Days (Base 50°F)
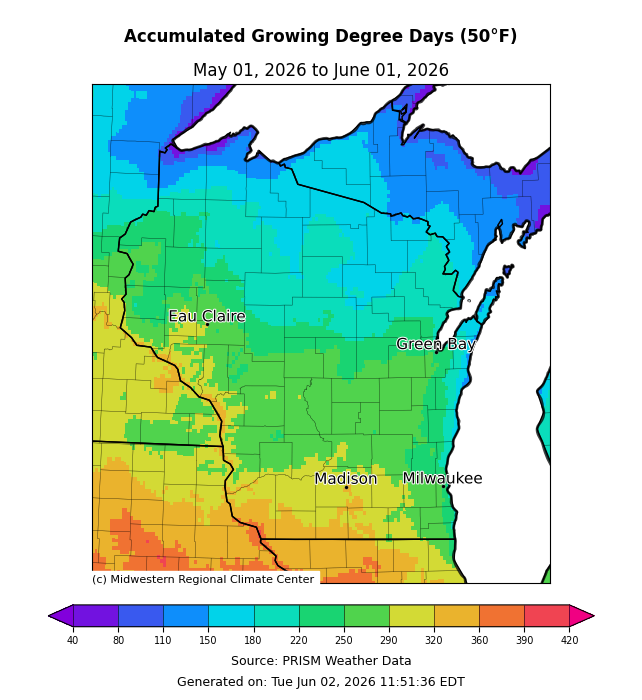
Image Description ↓
Map titled “Accumulated Growing Degree Days (50°F)” with date range “May 01, 2026 to June 01, 2026.” Wisconsin is shown with county boundaries and labeled cities.
A color scale ranges from about 40 GDD (purple/blue) to 420 GDD (orange/red). Northern Wisconsin, especially near Lake Superior, shows the lowest values (blue to teal, roughly 80–200 GDD). Central Wisconsin shows moderate accumulations (green shades, about 200–300 GDD). Southern Wisconsin, including areas near Madison and toward the Illinois border, shows the highest totals (yellow to red, about 300–420 GDD), with the highest concentrations in southwestern counties. Eastern areas near Lake Michigan show moderate values (green to yellow, about 220–320 GDD).
The map includes “Source: PRISM Weather Data” and “Generated on: Tue Jun 02, 2026 11:51:36 EDT,” credited to the Midwestern Regional Climate Center.
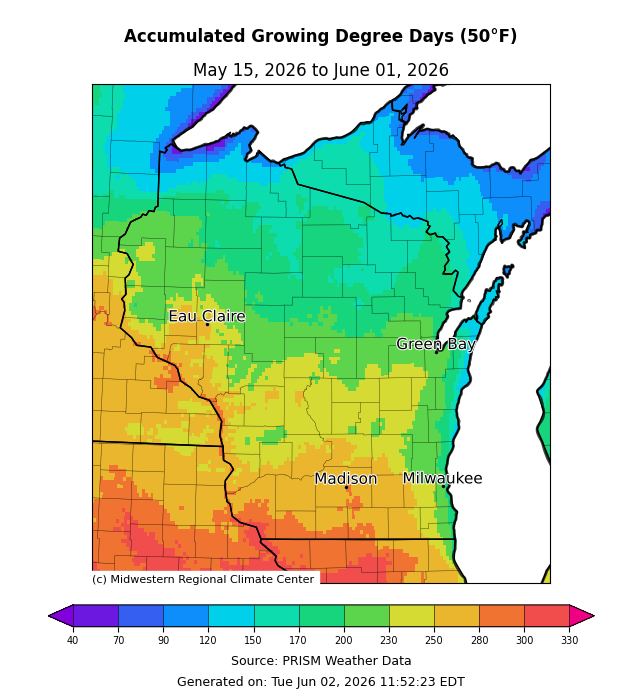
Image Description ↓
Map titled “Accumulated Growing Degree Days (50°F)” with date range “May 15, 2026 to June 01, 2026.” Wisconsin is shown with county boundaries and labeled cities including Eau Claire, Madison, Green Bay, and Milwaukee.
A color scale ranges from about 40 GDD (purple/blue) to 330 GDD (red). Northern Wisconsin, especially near Lake Superior, shows the lowest totals (blue shades), generally about 70–150 GDD. Central Wisconsin transitions to green shades, representing about 150–230 GDD. Southern Wisconsin, including Madison and toward the Illinois border, shows higher accumulations (yellow to orange), about 230–300 GDD. The highest values appear in southwestern Wisconsin (orange to red), reaching roughly 300–330 GDD. Eastern Wisconsin near Lake Michigan shows moderate values (green to yellow), roughly 180–260 GDD.
Footer text reads “Source: PRISM Weather Data” and “Generated on: Tue Jun 02, 2026 11:52:23 EDT,” credited to the Midwestern Regional Climate Center.
- Starting May 1 – Growing degree day accumulation ranges from 360 GDD in the far south and west to 110 GDD in the far north. These values are near to normal.
- Starting May 15 – Growing degree day accumulation ranges from 300 GDD in the far south and west to 90 GDD in the far north. These values are 130-140% of normal.
Crop Progress and Condition
Crop Progress Report for Wisconsin for the Week Ending on May 31st
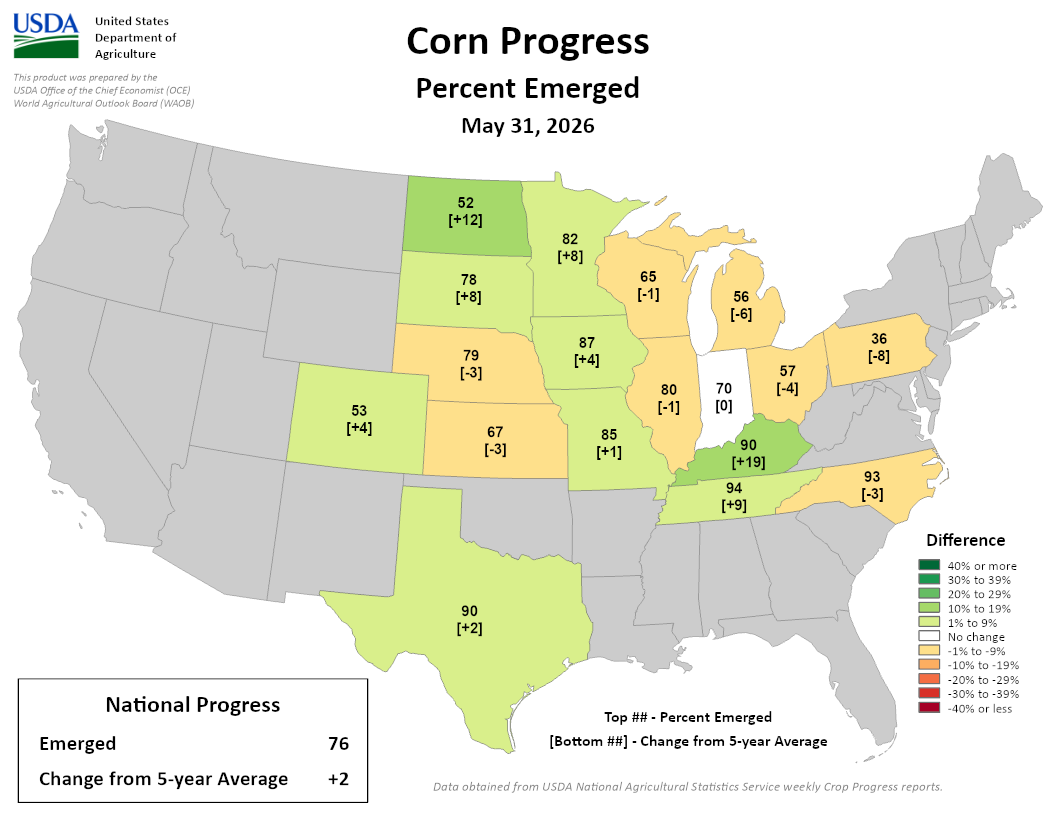
Image Description ↓
Map titled “Corn Progress – Percent Emerged” with date “May 31, 2026,” produced by USDA. The U.S. map highlights major corn states with percentages and bracketed changes from the 5‑year average.
Key state values include:
- Wisconsin: 65% emerged [−1]
- Minnesota: 82% [+8]
- Iowa: 87% [+4]
- Illinois: 80% [−1]
- Indiana: 70% [0]
- Ohio: 57% [−4]
- Michigan: 56% [−6]
- Kentucky: 94% [+9]
- Tennessee: 94% [+9]
- Missouri: 90% [+19]
- Texas: 90% [+2]
- North Dakota: 52% [+12]
- South Dakota: 78% [+8]
- Nebraska: 79% [−3]
- Kansas: 67% [−3]
- Pennsylvania: 36% [−8]
Color shading reflects difference from the 5‑year average, from green (above average) to orange/red (below average). Much of the western Corn Belt (ND, SD, MN, MO, KY, TN) is above average (greens). Parts of the eastern Corn Belt and Great Lakes (WI, MI, OH, PA) show below or near average (tan/orange).
A summary box reads:
“National Progress – Emerged: 76; Change from 5‑year Average: +2.”
Legend shows difference categories from “40% or more” (dark green) to “−40% or less” (dark red). Footer notes USDA NASS data source.
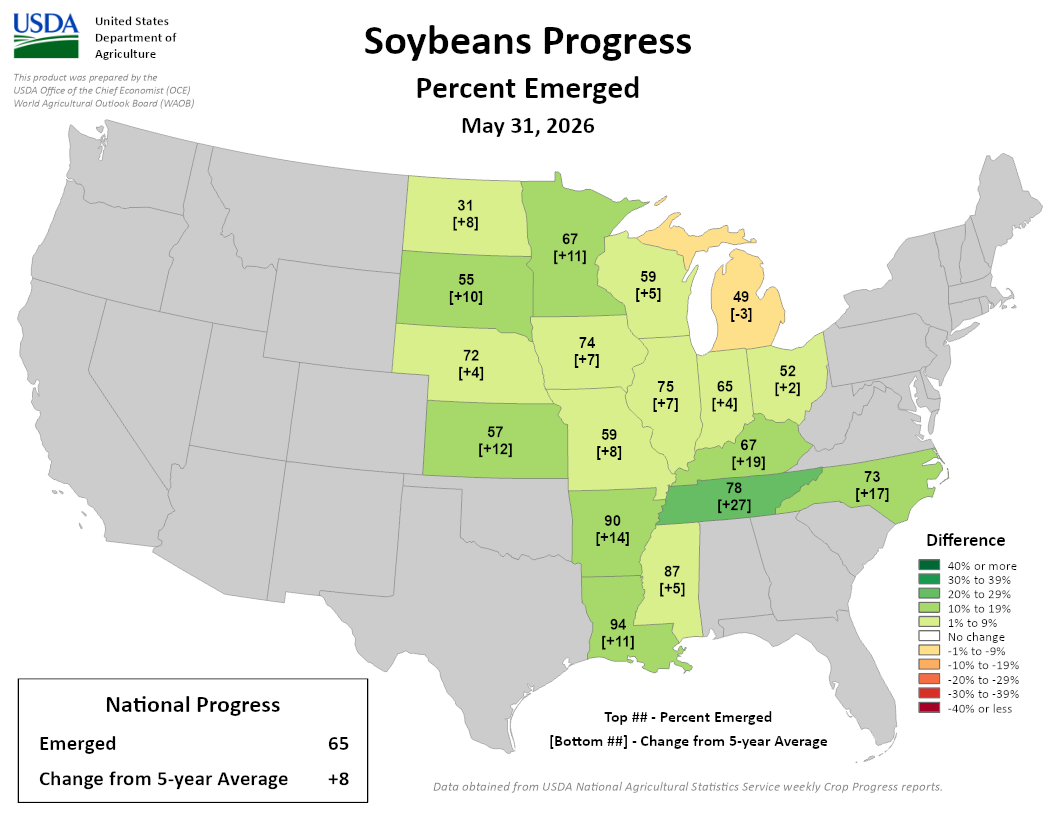
Image Description ↓
Map titled “Soybeans Progress – Percent Emerged” with date “May 31, 2026,” from the USDA. The U.S. map highlights major soybean-producing states with percent emerged values and bracketed differences from the 5‑year average.
Key state values include:
- Wisconsin: 59% emerged [+8]
- Minnesota: 67% [+11]
- Iowa: 74% [+7]
- Illinois: 75% [+7]
- Indiana: 65% [+4]
- Ohio: 52% [+2]
- Michigan: 49% [−3]
- Missouri: 67% [+19]
- Kentucky: 78% [+27]
- Tennessee: 78% [+27]
- Arkansas: 87% [+5]
- Louisiana: 94% [+11]
- North Dakota: 31% [+8]
- South Dakota: 55% [+10]
- Nebraska: 72% [+4]
- Kansas: 57% [+12]
- Texas: 90% [+14]
- North Carolina: 73% [+17]
Color shading indicates difference from the 5‑year average, ranging from green (above average) to orange (below average). Most states are green, indicating above-average emergence. Michigan is slightly below average.
A summary box states: “National Progress – Emerged: 65; Change from 5‑year Average: +8.” A legend on the right shows difference categories from “40% or more” (dark green) to “−40% or less” (dark red). Footer notes USDA NASS data source.
- Wisconsin had 6.6 days suitable for fieldwork statewide, thanks to warm and dry conditions.
- Corn planting is at 93% complete and is 65% emerged.
- Soybean planting is at 89% complete and are 59% emerged.
- Corn condition is 79% good to excellent, and soybeans are at 80% good to excellent.
- Oat planting is 95% complete, with emergence at 74% complete.
- Pasture and range were rated 58% good to excellent, down 1 percentage point from last week.
- Winter wheat is rated 66% good to excellent, up 1 percentage point from last week. Winter wheat is 26% headed.
- The first cutting of alfalfa is 38% complete.
- Read the full USDA report.
Forecasts and Outlooks
7 Day Precipitation Forecast
Image Description ↓
Map shows a U.S. precipitation forecast labeled “168‑Hour Day 1–7 QPF,” valid “12Z Thu Jun 04 2026 thru 12Z Thu Jun 11 2026,” issued 10:28Z Thu Jun 04 2026. Source text includes “Forecast: WPC, DOC/NOAA/NWS/NCEP/WPC.”
A color legend at left ranges from near 0.01 inches (light gray/green) to more than 20 inches (dark red/purple).
Across the map, the heaviest precipitation (orange, red, and purple, roughly 5–15+ inches) is concentrated along the Gulf Coast, especially from southeast Texas to Florida. Moderate precipitation (blue and green, about 1–3 inches) spreads across much of the central and eastern United States, including the Midwest and Great Lakes. The central Plains and parts of the Mississippi Valley show localized higher totals (3–6 inches). Western U.S. areas are mostly light (less than 1 inch), with some moderate precipitation in the Pacific Northwest and northern Rockies.
- When? – Elevated chances for rain through early Saturday (6/6), with additional chances early next week.
- Where? – Totals are forecasted to be higher in the south and southwest counties.
- Check your local forecast for details on totals and timing.
- Average precip (1991-2020) for this week: 1.12”.
8-14 Day Temperature and Precipitation Outlook
Image Description ↓
Map titled “8–14 Day Precipitation Outlook” with “Valid: June 11–17, 2026” and “Issued: June 3, 2026,” from NOAA. The contiguous U.S. map uses green shading for above-normal precipitation, tan for below normal, and gray for near normal, with a probability legend (33–100%).
Most of the central and eastern U.S., including Wisconsin, is shaded light to moderate green, indicating a leaning toward above-normal precipitation (generally 33–50% probability). A broader area of the Southeast and lower Mississippi Valley shows stronger above-normal signals (darker green).
The Pacific Northwest coast (Washington and Oregon) is shaded tan, indicating a below-normal precipitation outlook. Much of the interior West is gray, indicating near-normal precipitation. The Northeast is largely near normal (gray).
Inset maps show Alaska and Hawaii, both mostly shaded green (above normal), with parts of Alaska near normal. The probability legend ranges from “Leaning Above” (33–40%) to “Likely Above” (70–100%) and similar tiers for below normal. NOAA logo appears in the upper right.
Image Description ↓
Map titled “8–14 Day Temperature Outlook” with “Valid: June 11–17, 2026” and “Issued: June 3, 2026,” from NOAA. The contiguous U.S. is shaded using orange tones for above-normal temperatures, blue for below normal, and gray for near normal. A probability legend shows ranges from 33% to 100% likelihood.
Most of the continental U.S., including Wisconsin, is shaded orange, indicating above-normal temperatures, generally in the 40–70% probability range, with some central and western areas showing stronger signals (darker orange, 60–80%). The strongest above-normal area extends across the Southwest and parts of the central U.S.
A small region of near-normal temperatures (gray) appears in parts of the northern Plains. No large below-normal areas are present in the contiguous U.S.
Alaska is mostly shaded blue, indicating below-normal temperatures, with some near-normal areas. Hawaii is shaded orange, indicating above-normal conditions.
The legend labels “Above Normal,” “Near Normal,” and “Below Normal,” with probability bands (33–40%, 40–50%, 50–60%, 60–70%, 70–80%, 80–90%, 90–100%).
- Mid-June: Temperatures will likely be above normal statewide (50-60% odds), with precipitation leaning slightly towards above normal as well (33-40% odds).
- Statewide normals (1991-2020) for June 11-17 are 64.9°F and 1.13”.
30 Day Temperature and Precipitation Outlook
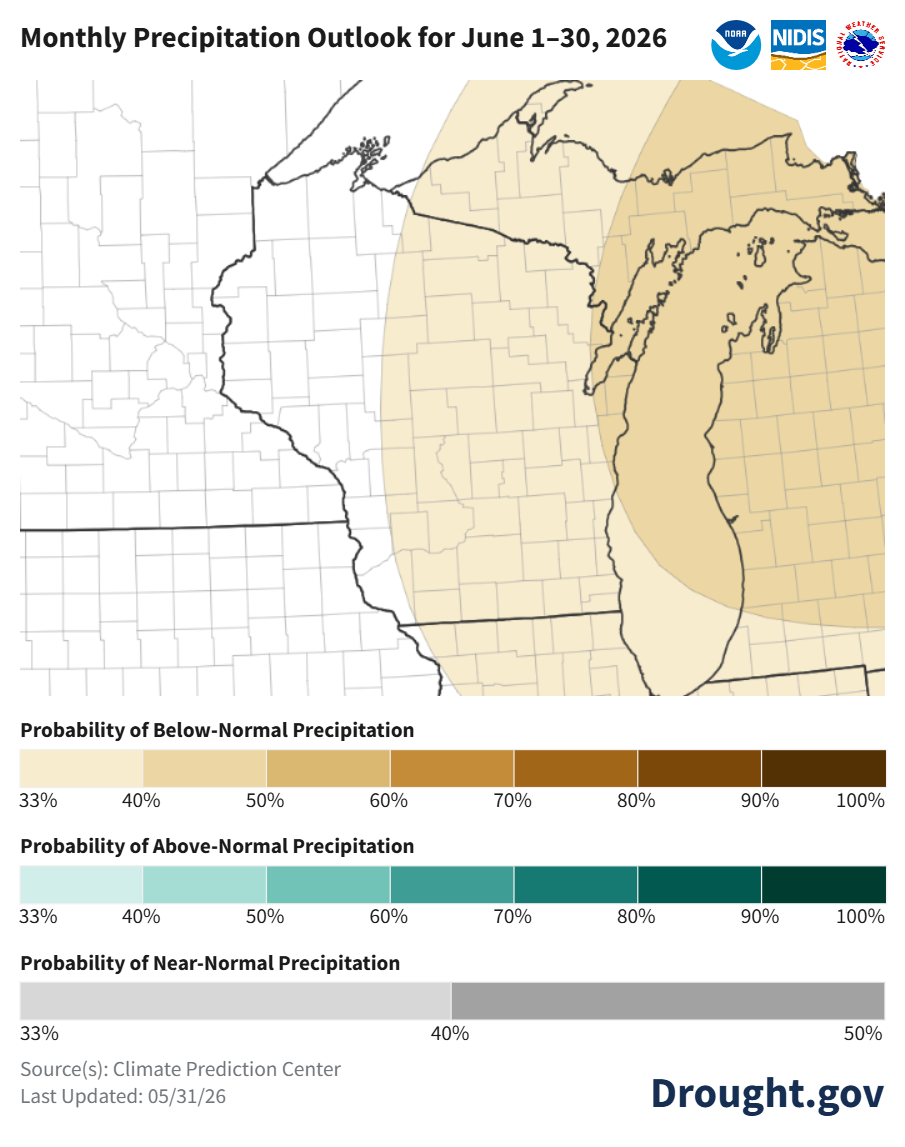
Image Description ↓
Map titled “Monthly Precipitation Outlook for June 1–30, 2026,” with NOAA, NIDIS, and NWS Climate Prediction Center logos. The map focuses on Wisconsin and surrounding Great Lakes region with county outlines.
Color shading indicates probability categories: tan shades represent below-normal precipitation (33–100%), gray represents near normal (33–50%), and green (not present here) would indicate above normal.
Eastern Wisconsin, especially areas near Lake Michigan (including the Green Bay and Milwaukee regions), is shaded light tan, indicating a 33–50% probability of below-normal precipitation. The signal strengthens slightly over far eastern areas (darker tan, near 40–50%). Western Wisconsin is mostly gray, indicating near-normal precipitation probability. The transition between near normal and below normal runs roughly north–south through central Wisconsin.
Legends at the bottom show probability scales for below-normal (33–100%), above-normal (33–100%), and near-normal (33–50%). Footer text reads “Source(s): Climate Prediction Center” and “Last Updated: 05/31/26.”
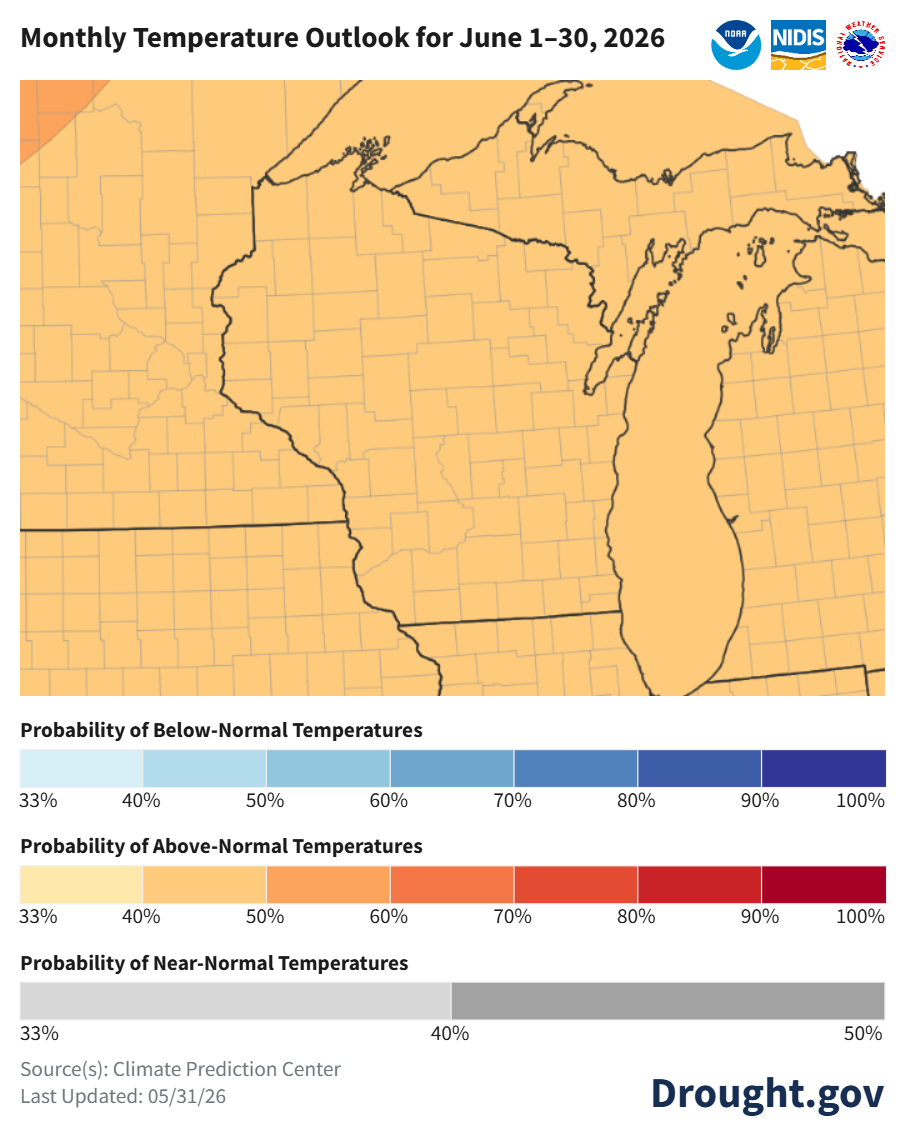
Image Description ↓
Map titled “Monthly Temperature Outlook for June 1–30, 2026” with NOAA, NIDIS, and NWS Climate Prediction Center logos. The map centers on Wisconsin and the Great Lakes, with county boundaries visible.
Shading is almost entirely orange across Wisconsin and surrounding states, indicating above‑normal temperature probabilities. Most of Wisconsin shows light orange (about 33–50% probability of above‑normal temperatures). Slightly darker orange appears toward the southern part of the region, indicating a stronger signal (around 40–60%). No areas in Wisconsin show blue (below normal) or gray (near normal).
Legends below include:
“Probability of Near-Normal Temperatures” (gray, 33–50%)
“Probability of Below-Normal Temperatures” (blue scale, 33–100%)
“Probability of Above-Normal Temperatures” (orange/red scale, 33–100%)
- June: Temperatures are leaning towards being warmer-than-normal (40-50% odds). Precipitation is leaning drier-than-normal across most of Wisconsin (33-40% odds). Further west, precipitation is more uncertain.
- Statewide normals (1991-2020) for June 1-30 are 65.1°F and 4.69”.
90 Day Temperature and Precipitation Outlook
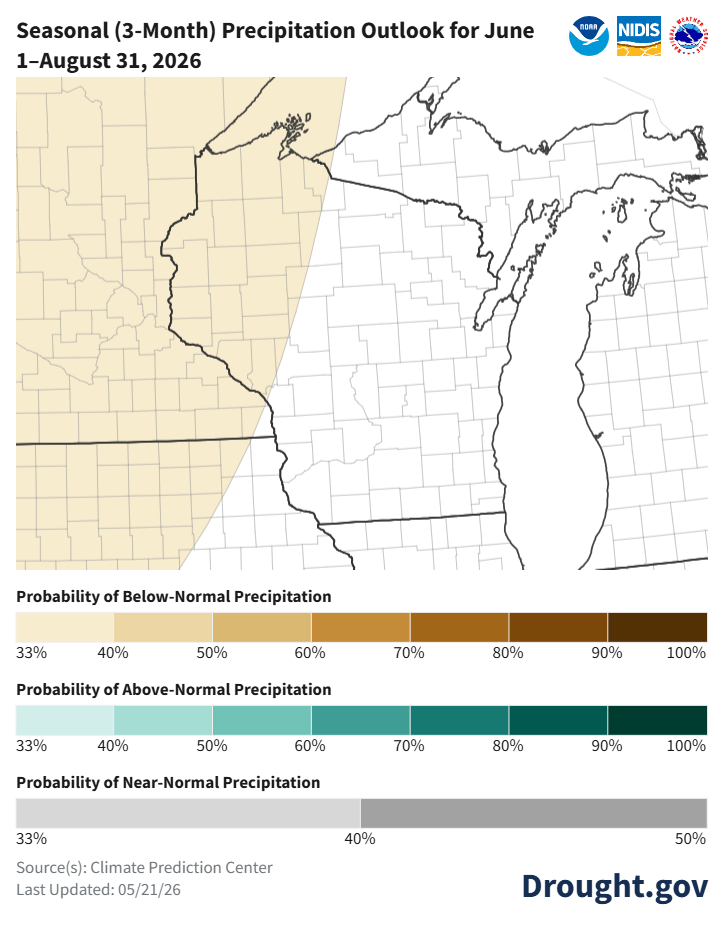
Image Description ↓
NOAA/NIDIS Climate Prediction Center map covering the Great Lakes region. The western portion of the map — encompassing most of Wisconsin west of a diagonal line running roughly northeast to southwest, plus portions of Minnesota, Iowa, and Illinois — is shaded in light tan/beige, indicating a 33–40% probability of below-normal precipitation from June 1 through August 31, 2026. The eastern portion of the map, including Michigan, the Upper Peninsula, and eastern Wisconsin, is unshaded (white), indicating equal chances of above-, near-, or below-normal precipitation. No areas show elevated probability of above-normal precipitation. Three color-scale legends are shown: brown tones for below-normal (33–100%), teal tones for above-normal (33–100%), and gray for near-normal (33–50%). Source: Climate Prediction Center. Last updated 05/21/26.
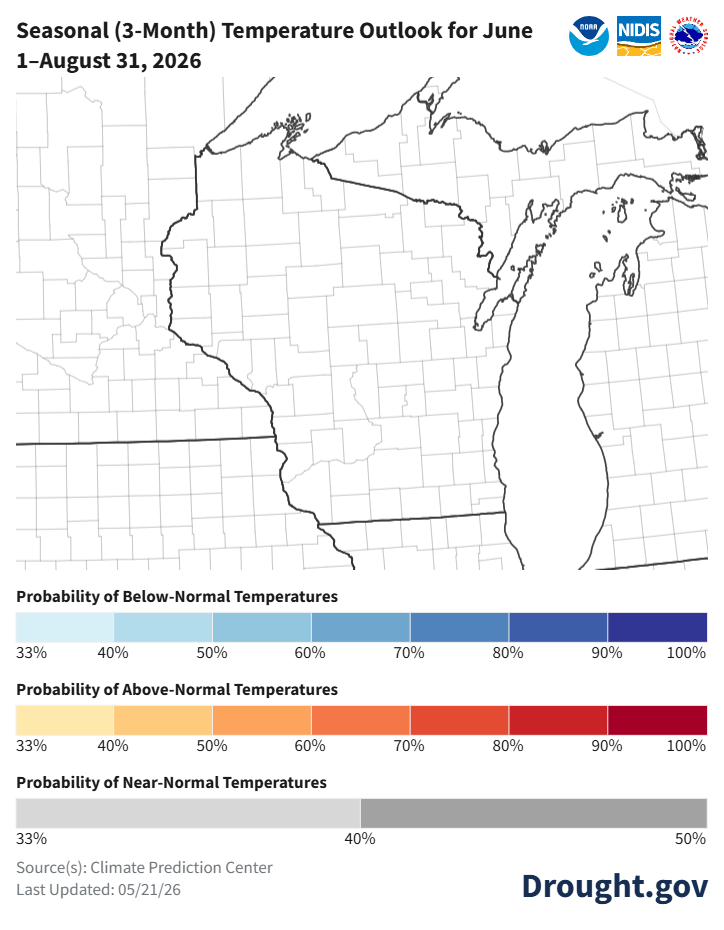
Image Description ↓
A NOAA/NIDIS Climate Prediction Center map showing the 3-month seasonal temperature outlook for the upper Midwest (Wisconsin and surrounding states) for June 1 through August 31, 2026. The map region appears unshaded (white/blank), indicating equal chances or near-normal temperature probabilities — no strong tilt toward above- or below-normal temperatures is indicated for this area. Three color-scale legends appear below the map: below-normal temperatures (light to dark blue, 33%–100%), above-normal temperatures (light peach to dark red, 33%–100%), and near-normal temperatures (light to dark gray, 33%–50%). Source: Climate Prediction Center. Last updated 05/21/26.
- June-August: Temperatures and precipitation are uncertain currently with equal chances for above, near, or below normal conditions. The exception is northwest Wisconsin, which shows a slight lean (33-40% chance) towards below normal precipitation.
- Statewide normals (1991-2020) for June-August are 67.2°F and 12.63”.
User Survey
Are you a regular user of the Ag Weather Outlook for Wisconsin (AgWOW)? Or maybe you are viewing this page for the first time this week? Either way, we want to hear your feedback on this resource! Please take a few minutes and fill out this survey. Your feedback will help us better serve your ag-weather data needs through AgWOW.
If you have any trouble accessing or filling out the survey, please email Josh Bendorf at jbendorf@wisc.edu. Thank you!