
Weather and climate conditions this week in Wisconsin
Here are this week’s take-home points about the weather. As a reminder, AgWOW reports will be published weekly throughout the growing season. Scroll down for the full report.
Additionally, we’re collecting user feedback. Regardless of whether it’s your first time here or if you are a regular user, we’d love to hear from you!
Key Points
Recent Conditions
- It was a cooler-than-normal week across Wisconsin last week. Temperatures were 4-8°F below normal across most of the state.
- Most of Wisconsin received at least 0.5” of rain last week. Totals of 1-2” were common across far southern counties as well as in many northern counties.
Impact
- Most Wisconet research farm stations showed minimal change in 4-inch moisture following a week with 0.5-1” of rain.
- Satellite-based soil moisture estimates indicate minimal change in soil moisture across the state compared to last week’s levels. Most of the state has near-normal moisture in the top 1 meter of soil.
- Drought changed very minimally (<1%) compared to last week. D1 drought is in place near Madison and La Crosse.
- Emergence is nearing completion (>90%) for both corn and soybeans. With adequate soil moisture for most Wisconsin fields, row crops in the state are primarily in good to excellent condition.
Outlook
- Rain chances over the next 7 days are higher in the northwest, north central, and west central counties.
- The outlook for early July indicates that temperatures will likely be above normal (60-70% odds).
- The outlook for July does not offer any strong indications for temperature and precipitation deviations currently.
- Late summer through early fall (July-Sept) may be cooler-than-normal in southern and central counties (33-40% odds), with precipitation leaning towards below normal for most of the state.
Agronomic, Fruit and Vegetable Considerations
Field Conditions
- June is the time for pre-sidedress nitrate soil sampling. See guidelines for PSNT sampling.
- Thunderstorms have brought hail to areas of the state. Read more about hail damage and crop impacts here.
Forage Management
- First crop alfalfa harvest is nearing completion in Northern WI and second crop is starting in Southern WI. Consider using a PEAQ (Predictive Equations for Alfalfa Quality) stick to estimate relative feed value as you decide when to make each cut.
- Scout for potato leafhopper in alfalfa fields.
Pest Management
- Scout fields to note what weed species are emerging or have escaped herbicide application.
- Early planted soybeans are reaching reproductive stages. Revisit POST herbicide labels for timing considerations. Glufosinate must be applied before the R1 stage and Enlist One can be applied through the R1 stage.
- Look for true armyworm larvae in corn (especially around V5), grass pasture, and small grains.
- Western bean cutworm trapping has begun for the season. Check DATCP trap catches.
- Scout emerging corn until V5 for signs of cutworm feeding.
- Japanese beetles are starting to emerge.
- SlugNet is trapping again in 2026! Review weekly trap catches across the state. Observe fields (especially fields with reduced tillage and cover crops) for any signs of slug damage.
- Continue to scout corn and soybean fields for disease. Particularly, tar spot in corn and white mold in soybean to stay ahead of any disease pressure.
- Red crown rot was confirmed in WI last year. Know what to scout for in your soybean fields this year.
Manure Applications
- Reminder of Wisconsin’s NR 151 Runoff Rules with the timing of manure spreading and current runoff levels. Check DATCP Runoff Risk Advisory Forecast.
Small Grains
- Scout small grains for signs of disease. This includes powdery mildew and stripe rust, especially in susceptible varieties. Use the Crop Risk Tool and Fusarium Risk Tool for risk assessment for Fusarium Head Blight. FHB risk has increased with weather. Winter wheat is not of concern at this point; however, spring wheat should be scouted frequently.
- Staging small grain growth is important for fungicide timing as diseases are emerging. Winter wheat in the southern half of the stat is past the window to spray fungicide. Those in the central and northern parts of the state may still have an opportunity, if warranted. Review growth stages here.
Fruit Considerations- General
- Wisconsin fruit growers can reference the bi-weekly Wisconsin Fruit News for the most recent, in-depth updates on fruit production, including disease and insect management.
- Apple and grape growers can reference the NEWA weather station network to monitor for disease infection periods in their area. Check out your nearest weather station: NEWA Weather Station Network (Cornell). Check out your nearest weather station: NEWA Weather Station Network (Cornell).
- Grape growers may reference Dr. Amaya Atucha’s most recent article on petiole sampling in cold hardy grapes.
- Wisconsin fruit growers can reference the Midwest Fruit Pest Management Guide for a list of registered products and recommended best practices. View the MFPMG Online.
Fruit Considerations- Disease
- Apple scab fruit lesions have been observed in Southern WI, likely pushed along by recent rains. Continue scouting scab susceptible varieties. A reminder that protectants will typically wash off after ~1inch of rain.
- Strawberry growers may reference the most recent Wisconsin Fruit News article on Strawberry Disease Concerns Following Heavy Rains During Harvest by Dr. Leslie Holland.
Fruit Considerations- Insects
- Apple growers should continue monitoring degree-day (base 50℉) accumulation for Codling moth. First generation larvae will emerge after ~250 degree-days (base 50℉) have accumulated from the biofix date. Second generation larvae will typically emerge at ~1250 degree-days (base 50℉) from the biofix date.
- Apple growers should keep track of degree-day (base 50℉) accumulation from petal fall to determine the end of plum curculio movement into the orchard. Plum curculio will typically cease movement into the orchard after ~308 degree-days (base 50℉) have accumulated from the petal fall date.
Vegetable Considerations- Disease
- Cucumber downy mildew spores have been detected in 3 eastern and southeastern counties in Michigan. However, no reports of disease outbreaks have been reported in Michigan or Wisconsin.
- Recent weather conditions, wet and cool, are favorable for halo blight in green beans. Monitor leaves for symptoms which first appear as water-soaked lesions on the underside of leaves. As the disease progresses, the lesions become red to brown in color and are surrounded by a yellow-green halo. Symptoms resemble downy mildew however they lack the gray sporulation on the underside of leaves. Pods can also become infected, and symptoms are water-soaked lesions. This disease is typically not widespread however, there is a confirmed report in Iowa. Management information and comparison between bacterial disease in green beans can be found here.
- Monitor brassicas for symptoms of black rot which include yellow blotches that start on leaf margins and spread in a v-shaped pattern into the leaf. Veins will also appear brown or black when held up to a light. One of the best management strategies during the season is avoiding working in fields when foliage is wet.
Vegetable Considerations- Insects
- Squash vine borer risk is high in southern WI and will be increasing in central WI in the next week. Be on the lookout for adults which are day flying moths. Their abdomens are red to orange in color with black spots. Newly emerged females begin looking for hosts to lay eggs shortly after emerging. Floating row cover during peak adult activity can reduce crop risk although it must be removed during flowering. Chemical control options are limited once larvae move into the plant stem. Effective chemical control requires insecticides to be in place before and during egg laying.
- Stalk borer risk is high in central WI. Starting in late May the larvae migrate from grassy weeds along field edges into susceptible crops which include tomatoes, potatoes, sweet corn, and beans. Larvae feed on leaves or stalk tunnels, causing irregular holes in the newly unfolding leaves. Control options are limited this time of year. If eggs have already hatched, removing alternative weed hosts can increase the amount that migrate into your crop. For chemical treatment to be effective, treatment must occur before larvae have moved into the crop stem. Therefore, it is very difficult to use chemical controls as their presence is not often noticed until they are already inside the stem and have caused damage.
- Risk from the second generation of western flower thrips (WFT) is now high in southern WI and will be increasing in central WI over the next week. Early detection is key as control can be very difficult. WFT can spread viruses including tomato spotted wilt virus which can infect tomato, pepper, potato, and eggplant. Symptoms typically start at the top of the plant. Dark brown to black areas form on leaves, stems, and fruit. If plants become infected, rogue them out immediately to reduce the chance of spread. WFT management options include weed management inside and outside of high tunnels, reflective mulch, and insecticides.
- MSU reports on aster leafhoppers indicate that infectivity levels are currently 6% or less with many at 0%. Sign up for text alerts here to get an idea of how infectivity levels are changing throughout the season. Aster leafhoppers spread aster yellows which can cause significant damage to a range of crops including garlic, lettuce, carrots, and parsley. Control of aster yellows depends on control of the aster leafhopper. Management options include floating row covers, planting resistant cultivars, and insecticides.
- Monitor beans and potatoes for signs of potato leafhopper damage which include veins turning yellow and leaf curling during early stages and later appears as the characteristic “hopper burn” that leads to the yellowing or browning of leaf tips. Damage occurs most rapidly under hot and dry conditions. Management information and action thresholds can be found here.
- Continue scouting for Colorado potato beetle. Reports from the Vegetable Crop indicate that “in much of southern Wisconsin, larval populations are well into mid- and later stages of larval development, whereas only early larval stages are present in most fields within central Wisconsin.” Larvicide recommendations can be found here. In northern WI, continue scouting for colonizing adults and egg masses. Control options include perimeter and edge applications.
- Continue to scout for striped cucumber beetles. Adults feed on foliage and fruit and can spread bacterial wilt which can cause severe losses in cucumber and muskmelon. It is important to scout and, when necessary, control beetles early in the season to reduce risk of spreading this disease. Management options include spraying plants with kaolin clay although this will wash off with rain, floating row cover or high tunnel insect exclusion screens, and soil drenches for larvae.
- Scout for cabbage looper, imported cabbageworm and diamondback moth eggs and larvae. Plants are most susceptible to damage as young transplants and from early heading to harvest so the management threshold is when 10% of plants are affected. More information on treatment thresholds and management options can be found here. It is best to rely on larvae counts rather than damage or frass (droppings) to determine the level of infestation. Resistance to insecticides is a risk with these pests. Rotate modes of action, choose a selective insecticide when possible, and spot treat or band applications rather than broadcasting.
- The risk of damage from the second generation of seed corn maggots larvae is high in northern WI, and the third generation is now active in southern WI. Injury is caused exclusively by larvae which feeds on the cotyledons and below ground tissue of seedlings. Management is only effective if done in a preventative manner. Once larval damage is detected, there are no control options. Preventative management options can be found here.
- Cabbage maggot peak egg laying is now occurring in northern WI. Treatment is primarily preventative. When possible, till in cover crops 2 to 3 weeks before planting to reduce attractiveness. If possible, delay planting to avoid peak activity. Plantings after mid-June generally suffer less damage than early plantings. Floating row covers and diatomaceous earth are also good options during peak activity. To monitor activity in your area, use the Vegetable Disease and Insect Forecasting Network.
- DATCP continues to report black cutworm moth trap catches. Black cutworm larvae feed on newly emerged crops and prefer direct seeded crops over transplants. Many crops are susceptible to damage including beets, carrots, cucumber, leafy greens, sweet corn and squash. Management options include weed management as females prefer to lay eggs in weedy areas and avoiding the use of green manure in areas where cutworms tend to be a problem. For chemical control to be effective, early detection is key. If chemical treatment is necessary, begin treating at the first signs of cutting and repeat every 7 days until 1000 degree days are reached.
Dive deeper into each report section by clicking a topic below.
Precipitation Trends
7 Day Precipitation
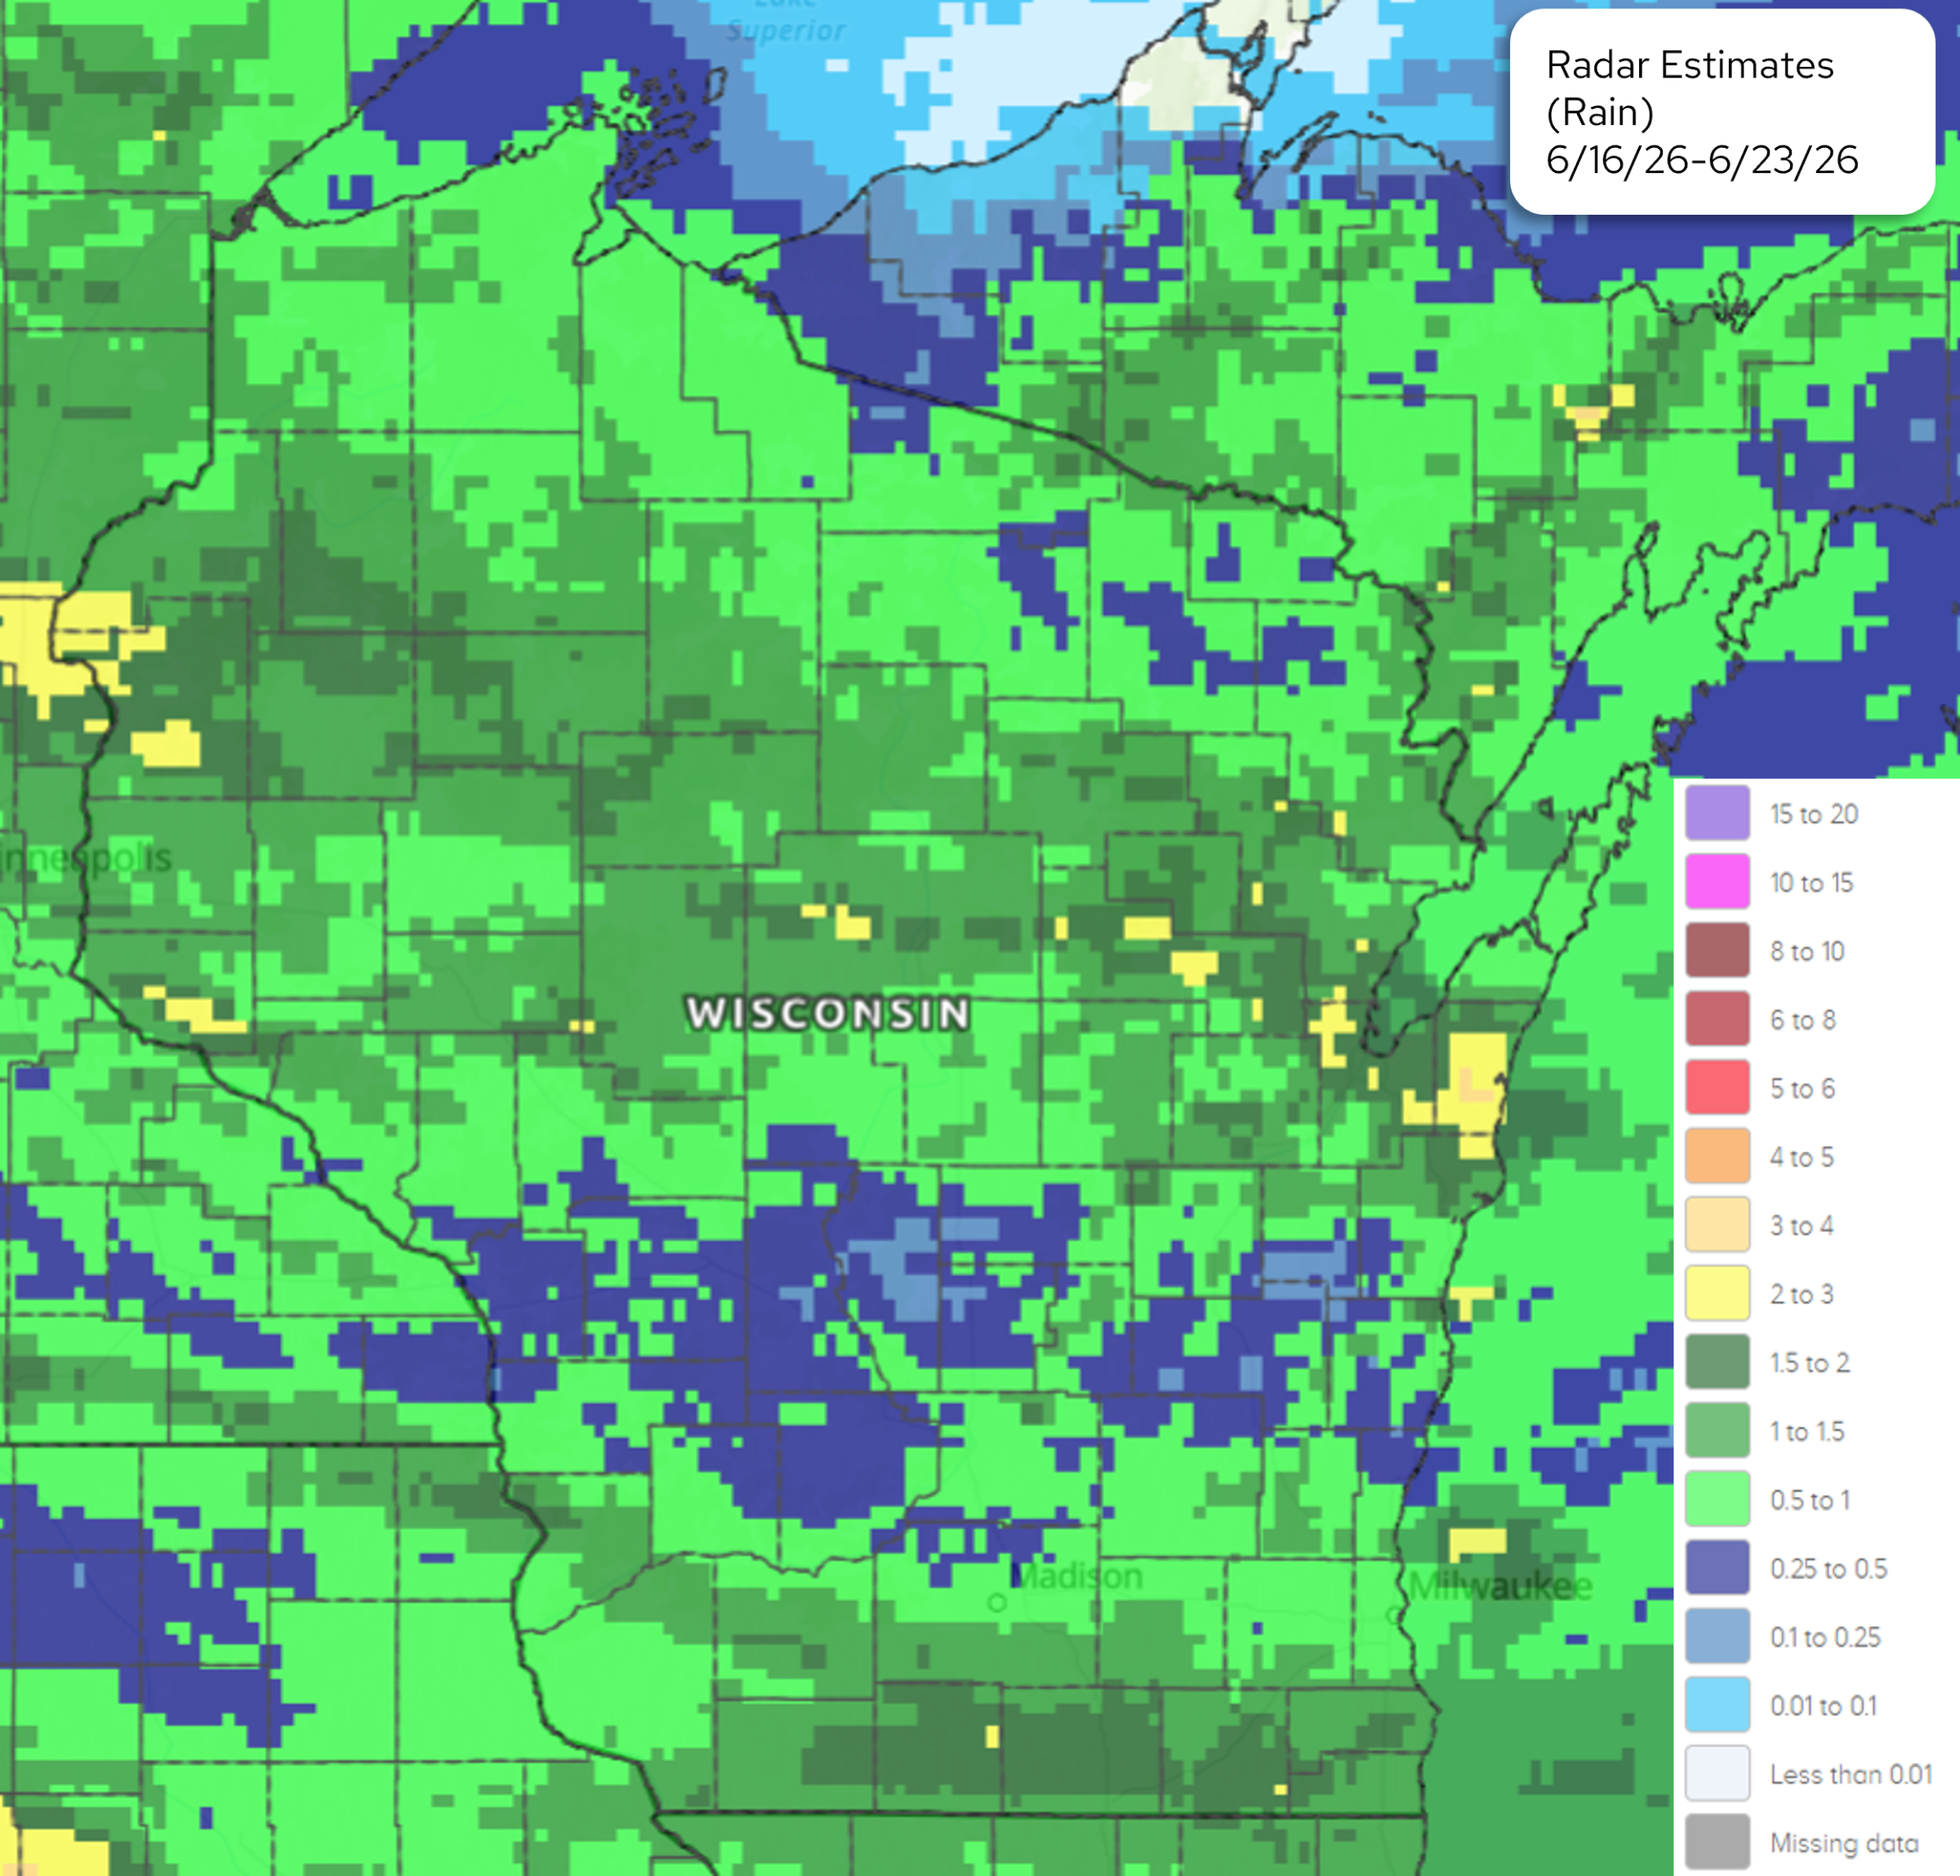
Image Description ↓
A regional map centered on Wisconsin with surrounding parts of Minnesota, Iowa, Illinois, Michigan, and Lake Superior. The title in the upper right reads “Radar Estimates (Rain) 6/16/26–6/23/26.” The state label “WISCONSIN” appears across the center. A color scale legend on the right shows rainfall totals ranging from “Less than 0.01” inches (light gray) up to “15 to 20” inches (purple), with intermediate categories such as 0.01–0.1, 0.1–0.25, 0.25–0.5, 0.5–1, 1–1.5, 1.5–2, 2–3, 3–4, 4–5, 5–6, 6–8, 8–10, and 10–15 inches.
Most of Wisconsin is shaded in light to medium green tones indicating roughly 0.5 to 2 inches of rain. Darker green and some yellow patches (2 to 4 inches) appear in scattered areas, including southeastern Wisconsin near Lake Michigan. Northern areas near Lake Superior show patches of lower totals (blue tones, under 0.5 inches). Surrounding states show similar mixed patterns of light to moderate rainfall.
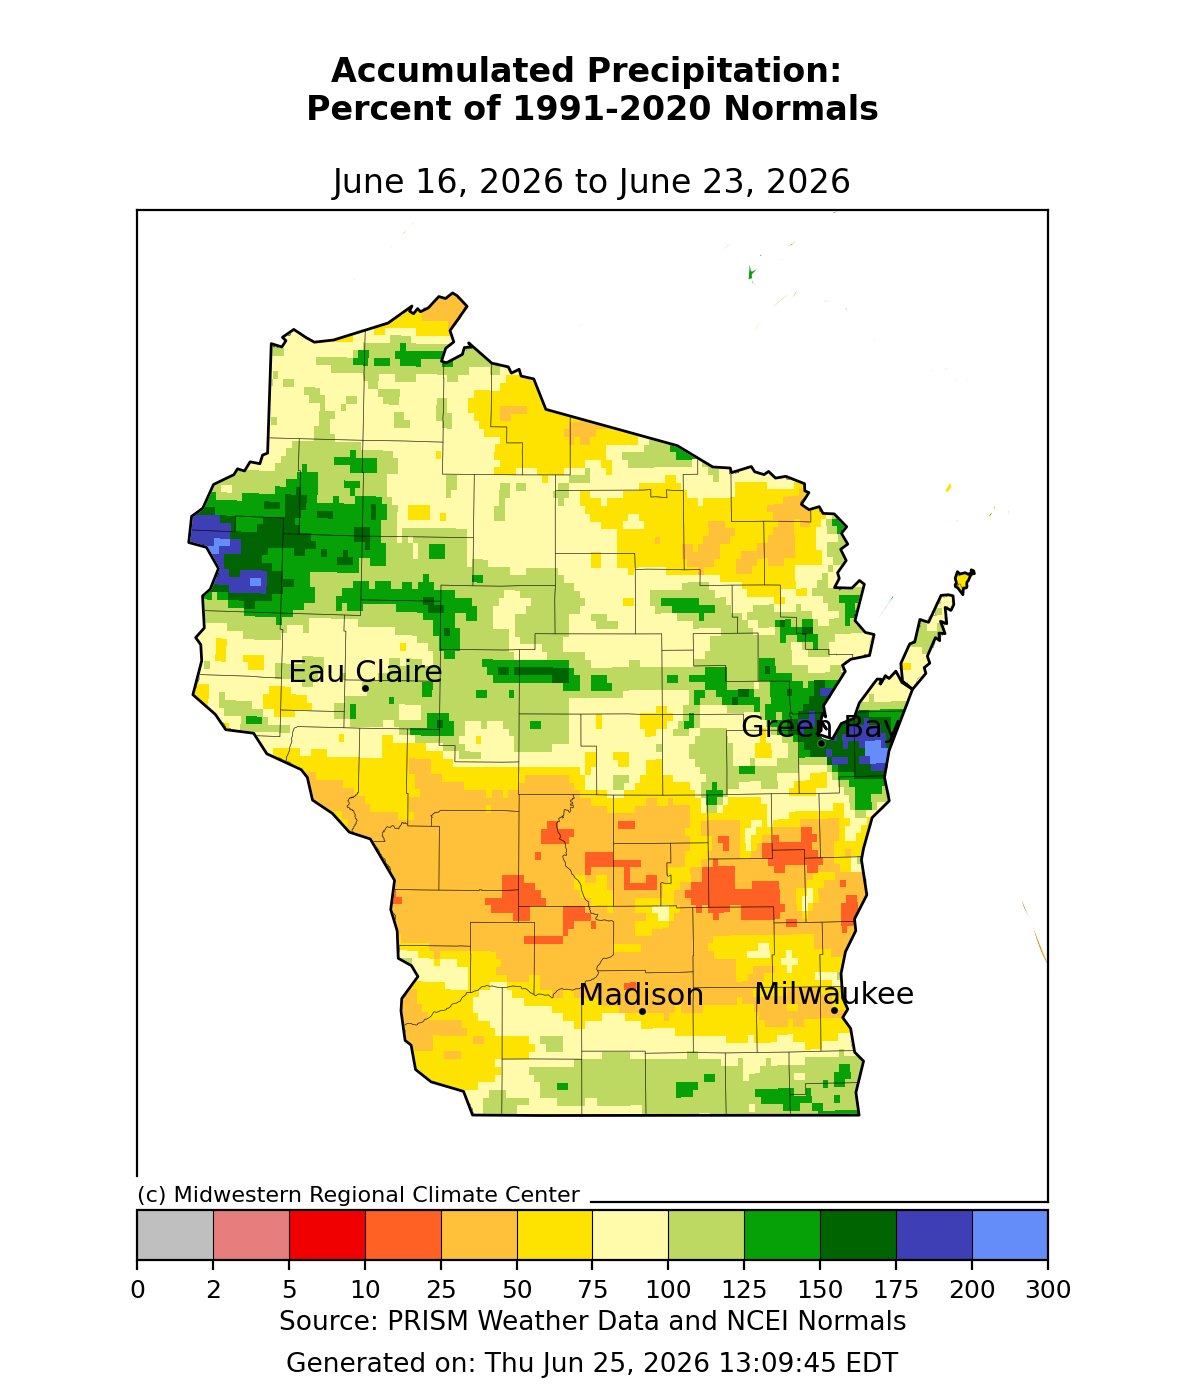
Image Description ↓
A Wisconsin map titled “Accumulated Precipitation: Percent of 1991–2020 Normals” with date range “June 16, 2026 to June 23, 2026.” Cities labeled include Eau Claire, Green Bay, Madison, and Milwaukee. A color legend at the bottom shows percent of normal precipitation from 0 to 300: gray (0), red/orange (2–25), yellow (50–75), light green (100), dark green (125–150), and blue/purple (175–300).
Northern and western Wisconsin include areas of above-normal precipitation (greens to blues, about 125–200%+), especially near the northwest and Green Bay. Central regions are near normal (light green, ~75–125%). Southern and south-central Wisconsin, including around Madison and parts of southeast Wisconsin, show below-normal precipitation (yellow to orange/red, roughly 25–75% or lower).
- Most of Wisconsin received at least 0.5” of rain last week.
- Totals of 1-2” were common across far southern counties as well as in many northern counties (100-150% of normal).
- Highest Wisconet station total from last week: 2.20” (Kewaunee, Kewaunee County). Totals in Kewaunee County were 150-300% of normal.
30 Day Precipitation Total and Departure from Normals
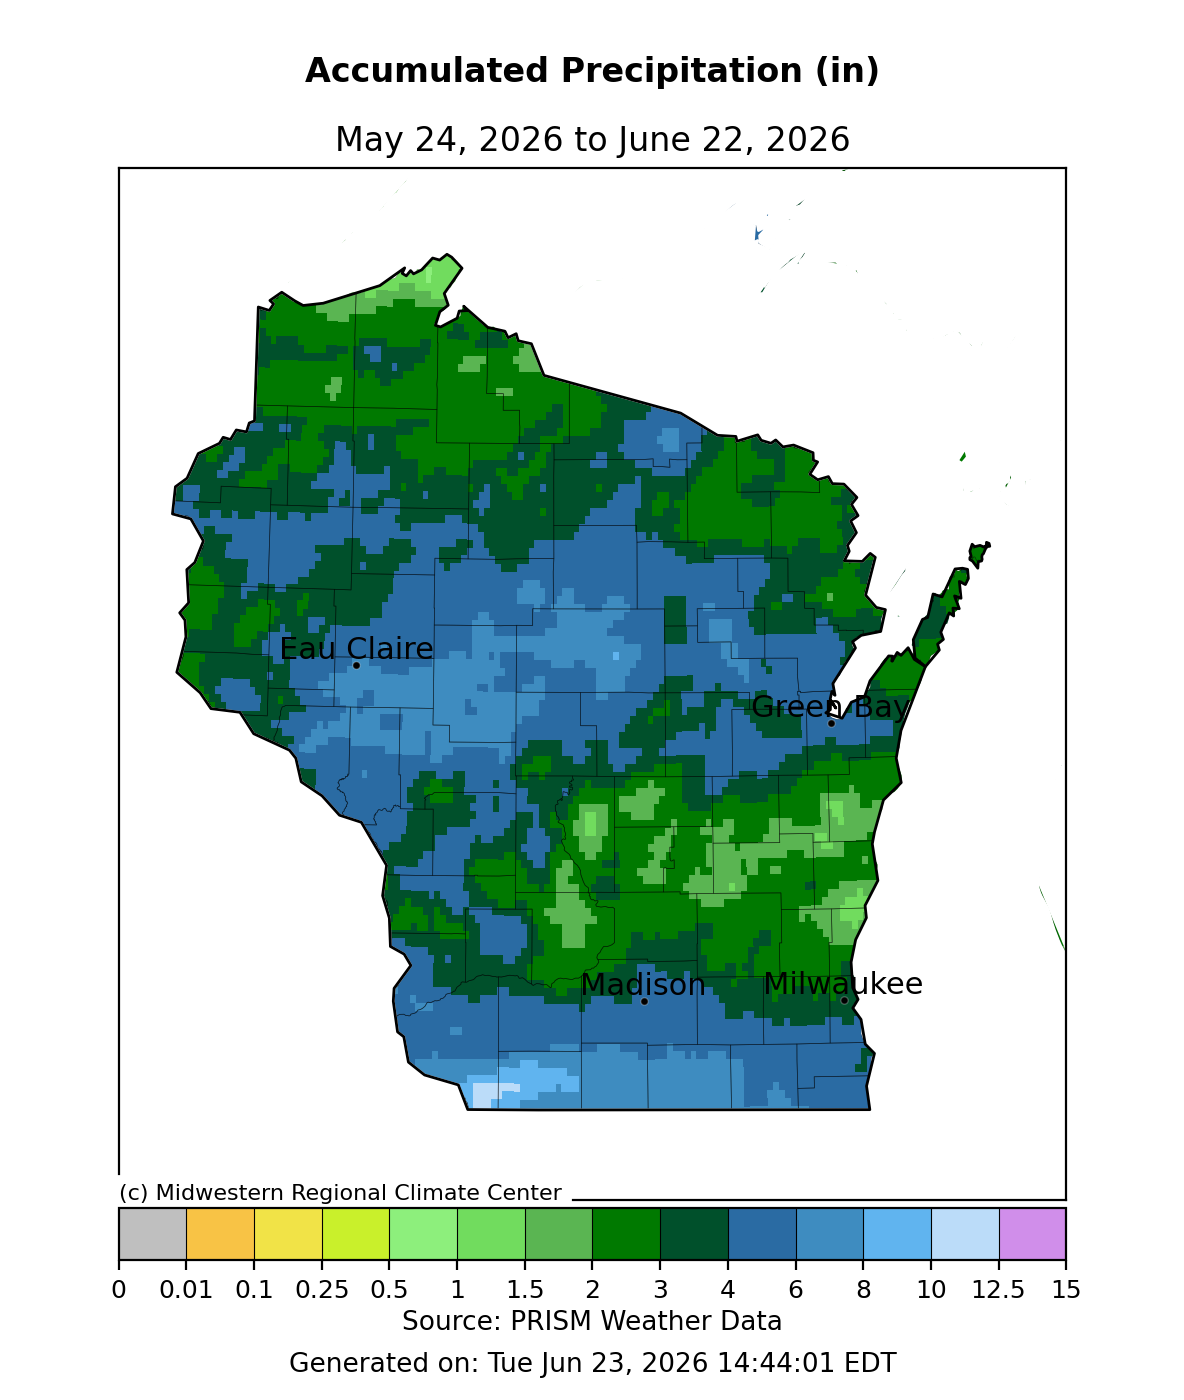
Image Description ↓
A Wisconsin map titled “Accumulated Precipitation (in)” with date range “May 24, 2026 to June 22, 2026.” Cities labeled include Eau Claire, Green Bay, Madison, and Milwaukee. A horizontal legend at the bottom shows totals from 0 to 15 inches, with color progression from gray (0), yellow/green (0.01–2), dark green (2–4), blue shades (4–10), and purple (12.5–15). Source text reads “Source: PRISM Weather Data,” and a timestamp states “Generated on: Tue Jun 23, 2026 14:44:01 EDT.” Most of central and northern Wisconsin are shaded blue, indicating about 4–8+ inches of precipitation. Northernmost areas and parts of the west show green to dark green (2–4 inches). Southern Wisconsin, including around Madison and Milwaukee, is largely blue to lighter blue (around 3–6 inches), with some lighter green areas (2–4 inches). Small localized areas show higher totals approaching darker blue shades (near 8–10 inches), especially in parts of central and north-central Wisconsin.
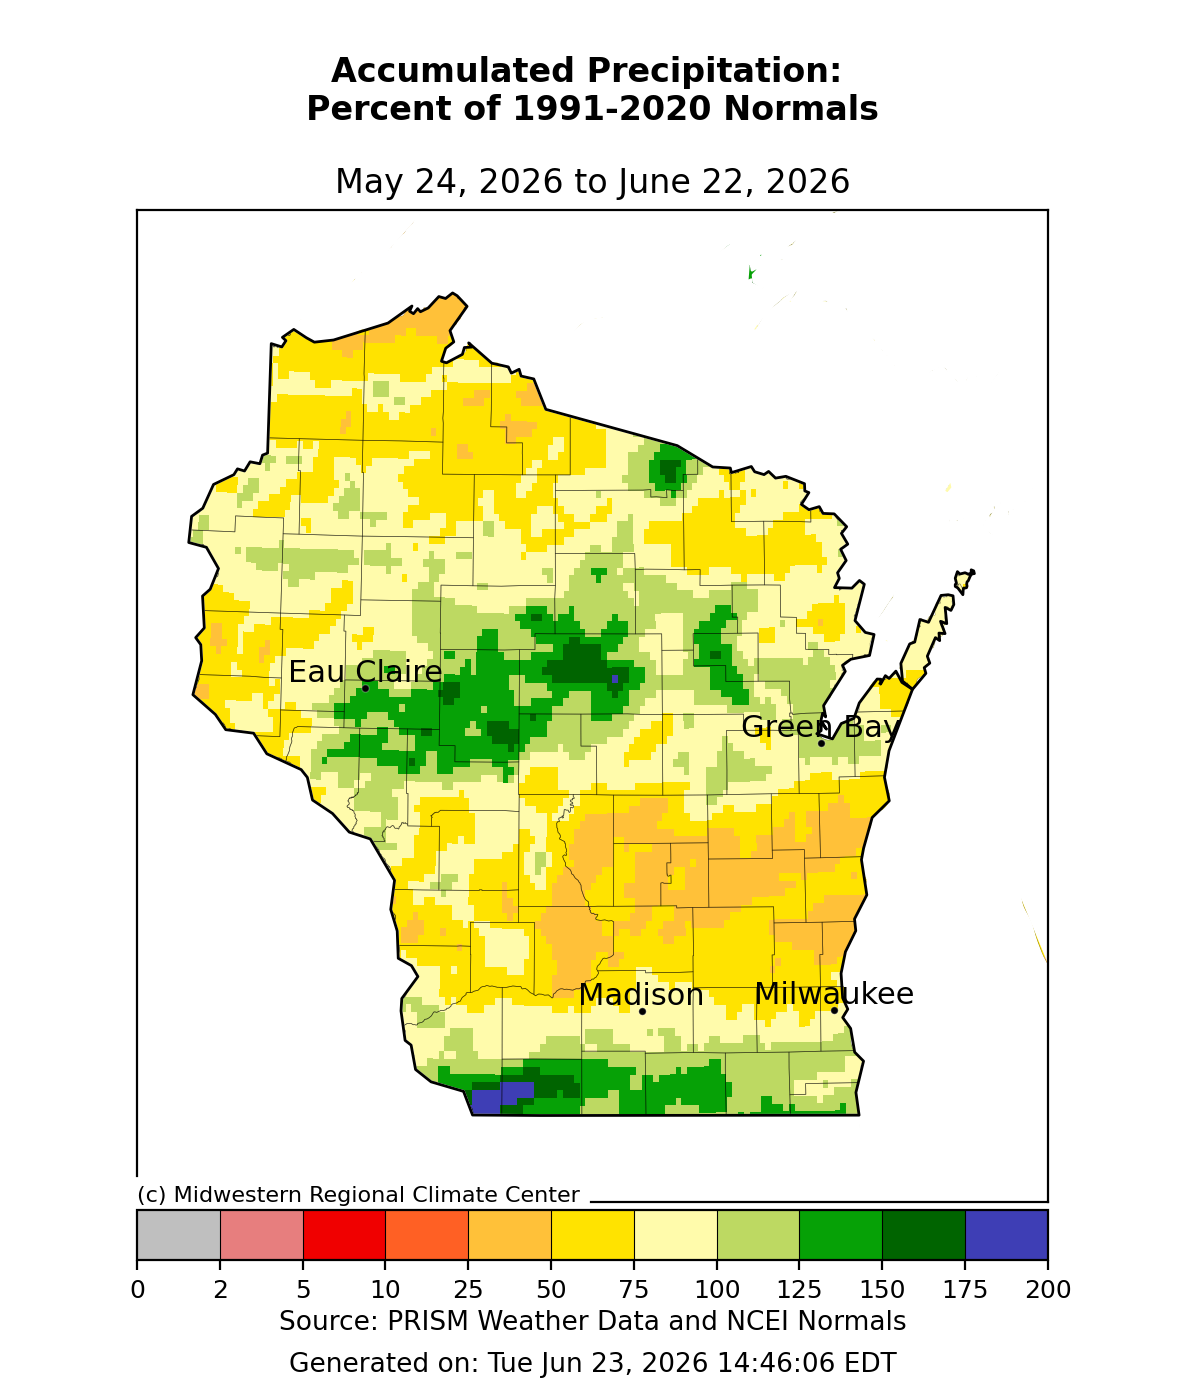
Image Description ↓
A Wisconsin map titled “Accumulated Precipitation: Percent of 1991–2020 Normals” with the date range “May 24, 2026 to June 22, 2026.” Cities labeled include Eau Claire (west-central), Green Bay (northeast), Madison (south-central), and Milwaukee (southeast). A horizontal color legend at the bottom shows percent of normal precipitation from 0 to 200: gray (0), red/orange (2–25), yellow (50–75), light tan (75–100), light green (100–125), dark green (125–150), and blue/purple (175–200). Source text reads “Source: PRISM Weather Data and NCEI Normals,” with a timestamp “Generated on: Tue Jun 23, 2026 14:46:06 EDT.” Central Wisconsin, especially around and west of Eau Claire, shows above-normal precipitation (greens, about 100–150% or higher). Northern areas are mostly near to slightly below normal (tan to yellow, roughly 75–100%). Southern and southeastern Wisconsin, including Madison and Milwaukee, are below normal (yellow to orange, about 50–75% or lower). A small area in far southern Wisconsin shows higher-than-normal totals (dark green/blue patch).
- Totals in southern, northwest, and north-central Wisconsin commonly ranged from 4-8”. These totals were 100-175% of normal, with a bullseye of ≥175% of normal in southern Grant and Lafayette Counties.
- Elsewhere in the state, precipitation totals were commonly 2-4” (25-75% of normal).
90 Day Precipitation Total and Percent of Normals
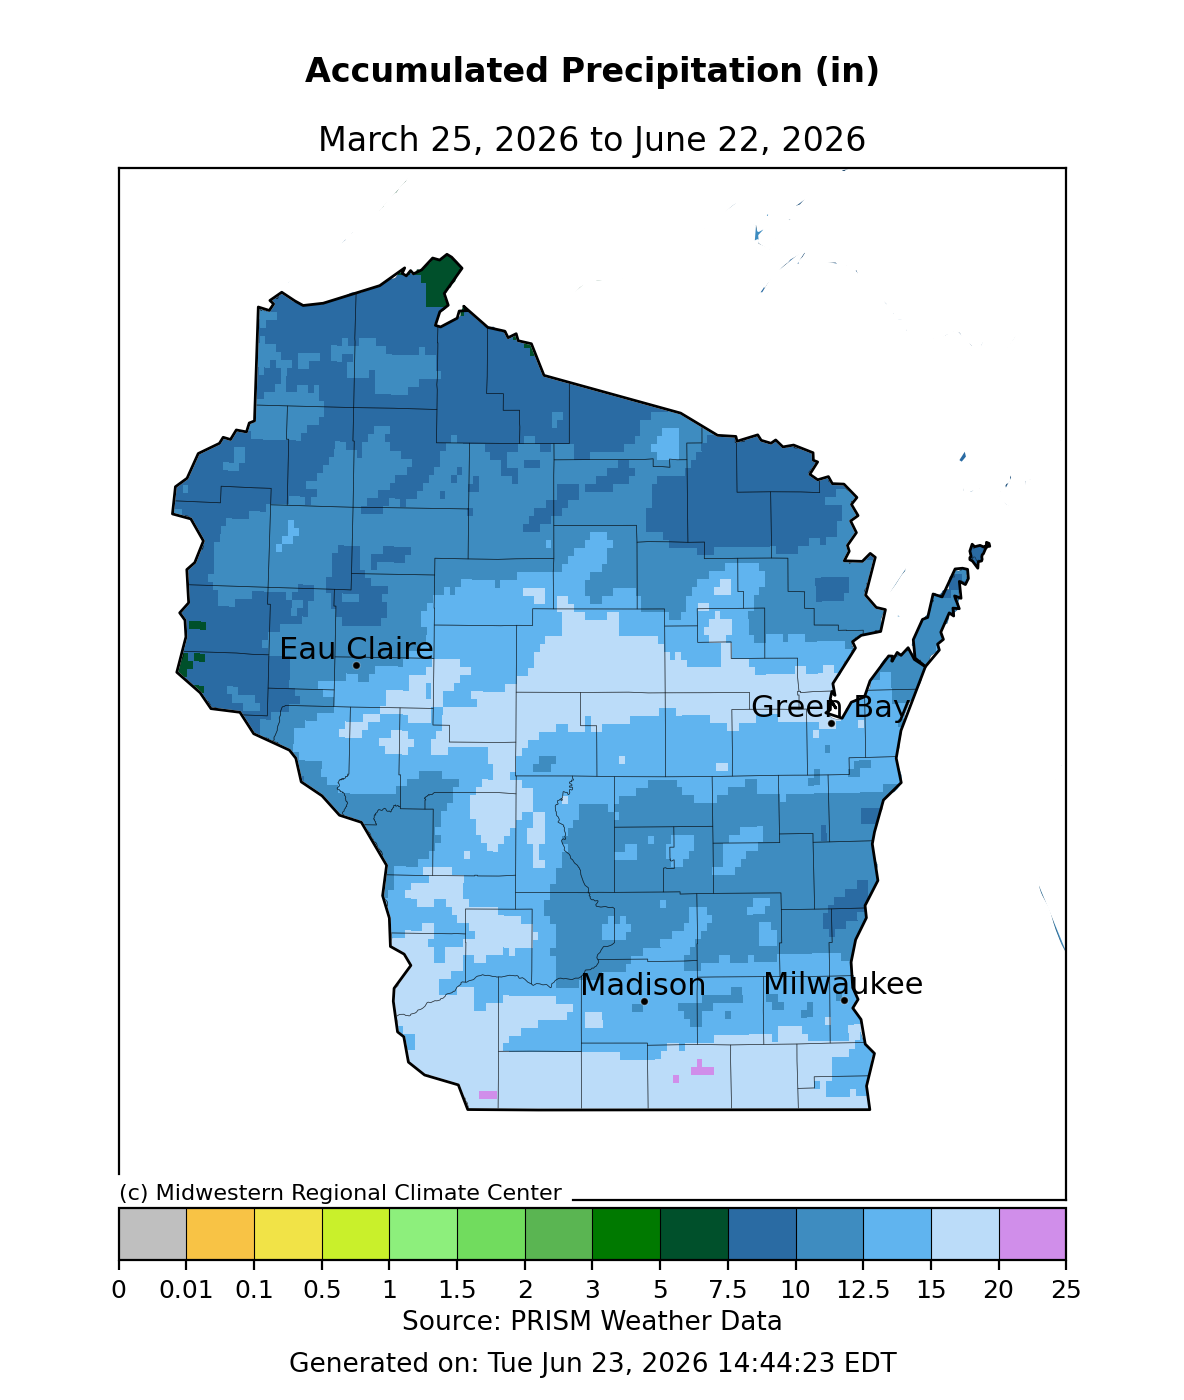
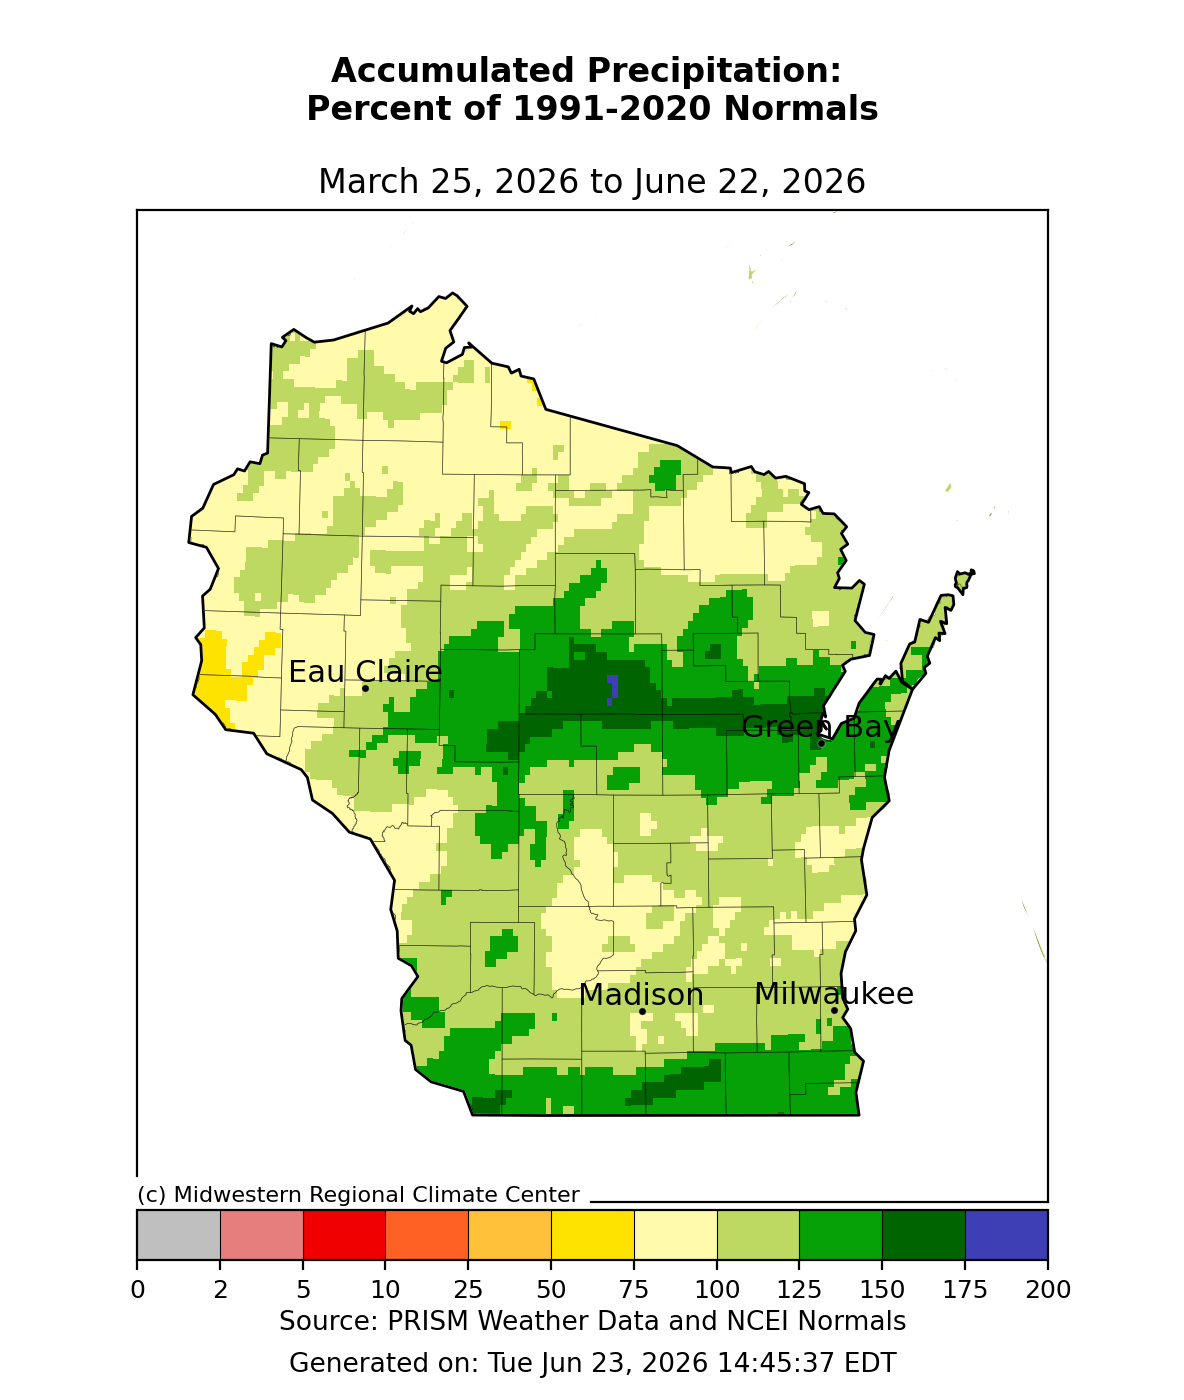
- Totals of 15-20” or more were common across southern, west central, and north central counties. These totals were 125-175% of normal.
- Most of the state received precipitation totals that were at or above normal, with most receiving at least 10” of precipitation (rain plus melted snow).
- Precipitation totals were lowest in the north (5-10”). In the north and northwest, 90-day totals were 50-100% of normal.
2026 Precipitation
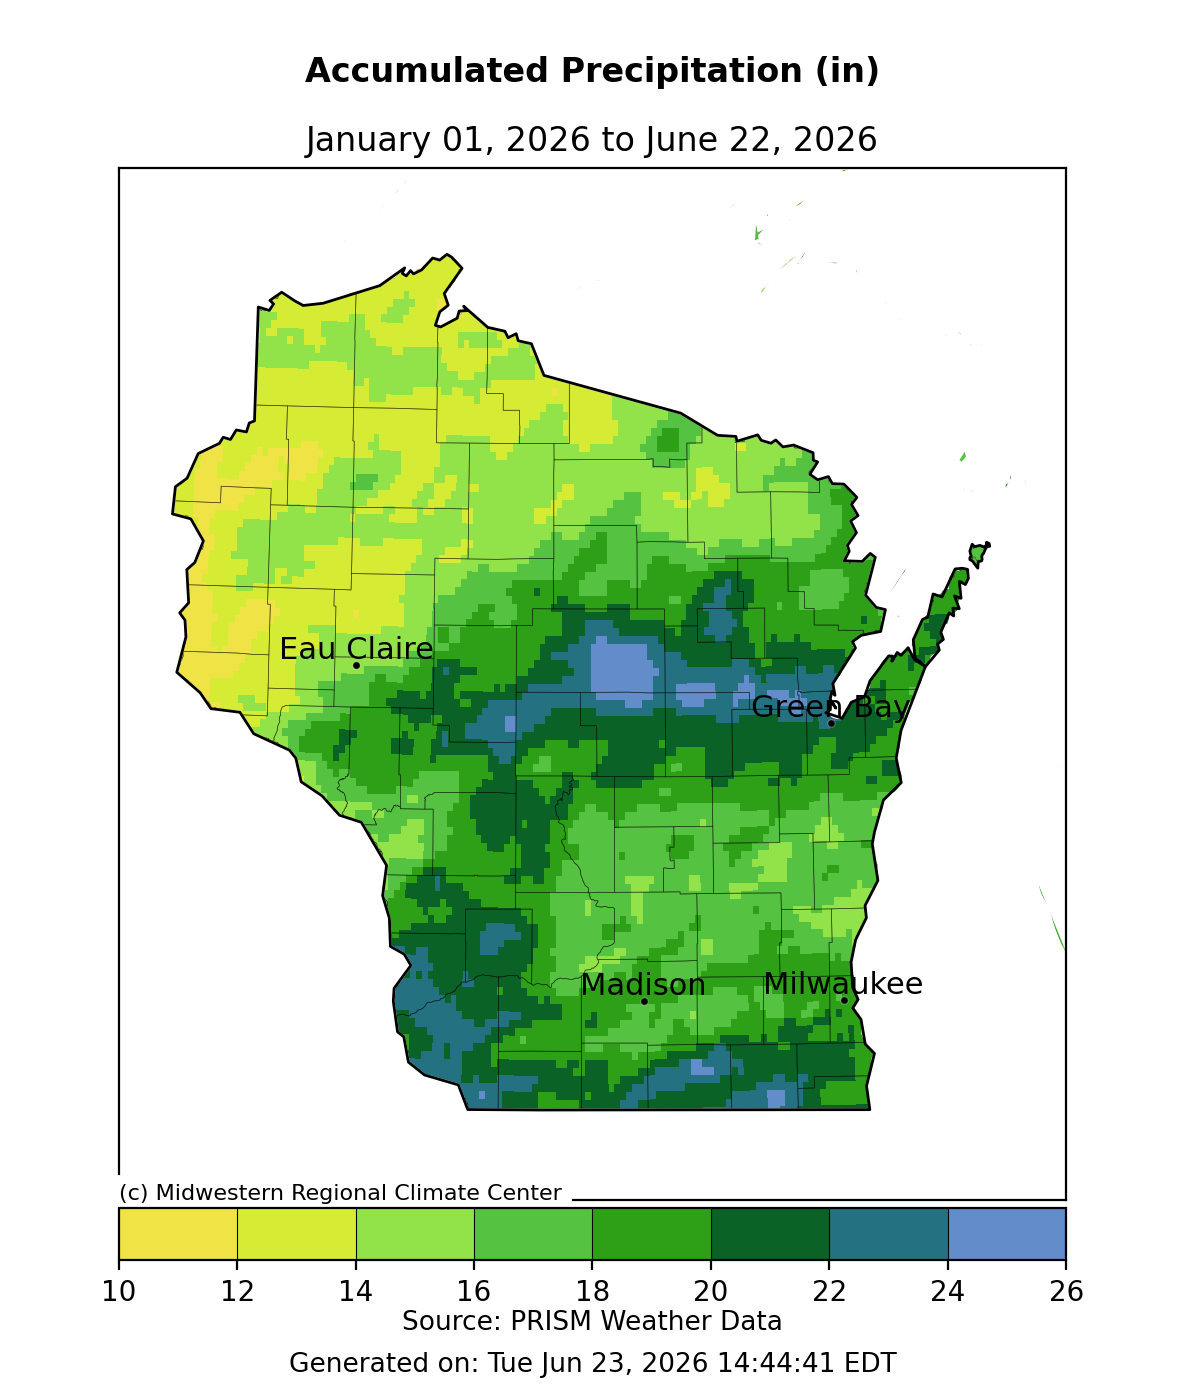
Image Description ↓
PRISM Weather Data choropleth map of Wisconsin showing accumulated precipitation in inches from January 1 to June 22, 2026, produced by the Midwestern Regional Climate Center. A color scale ranges from yellow (10 in) through green to blue-purple (26 in). Northwestern Wisconsin, including the Eau Claire area, shows the lowest totals at roughly 10–14 inches. Precipitation increases moving east and south, with central Wisconsin (between Eau Claire and Green Bay) and the southwestern corner showing the highest totals of 22–26 inches, represented in dark teal and blue-purple. The Green Bay, Madison, and Milwaukee areas fall in the 18–22 inch range. Generated June 23, 2026.
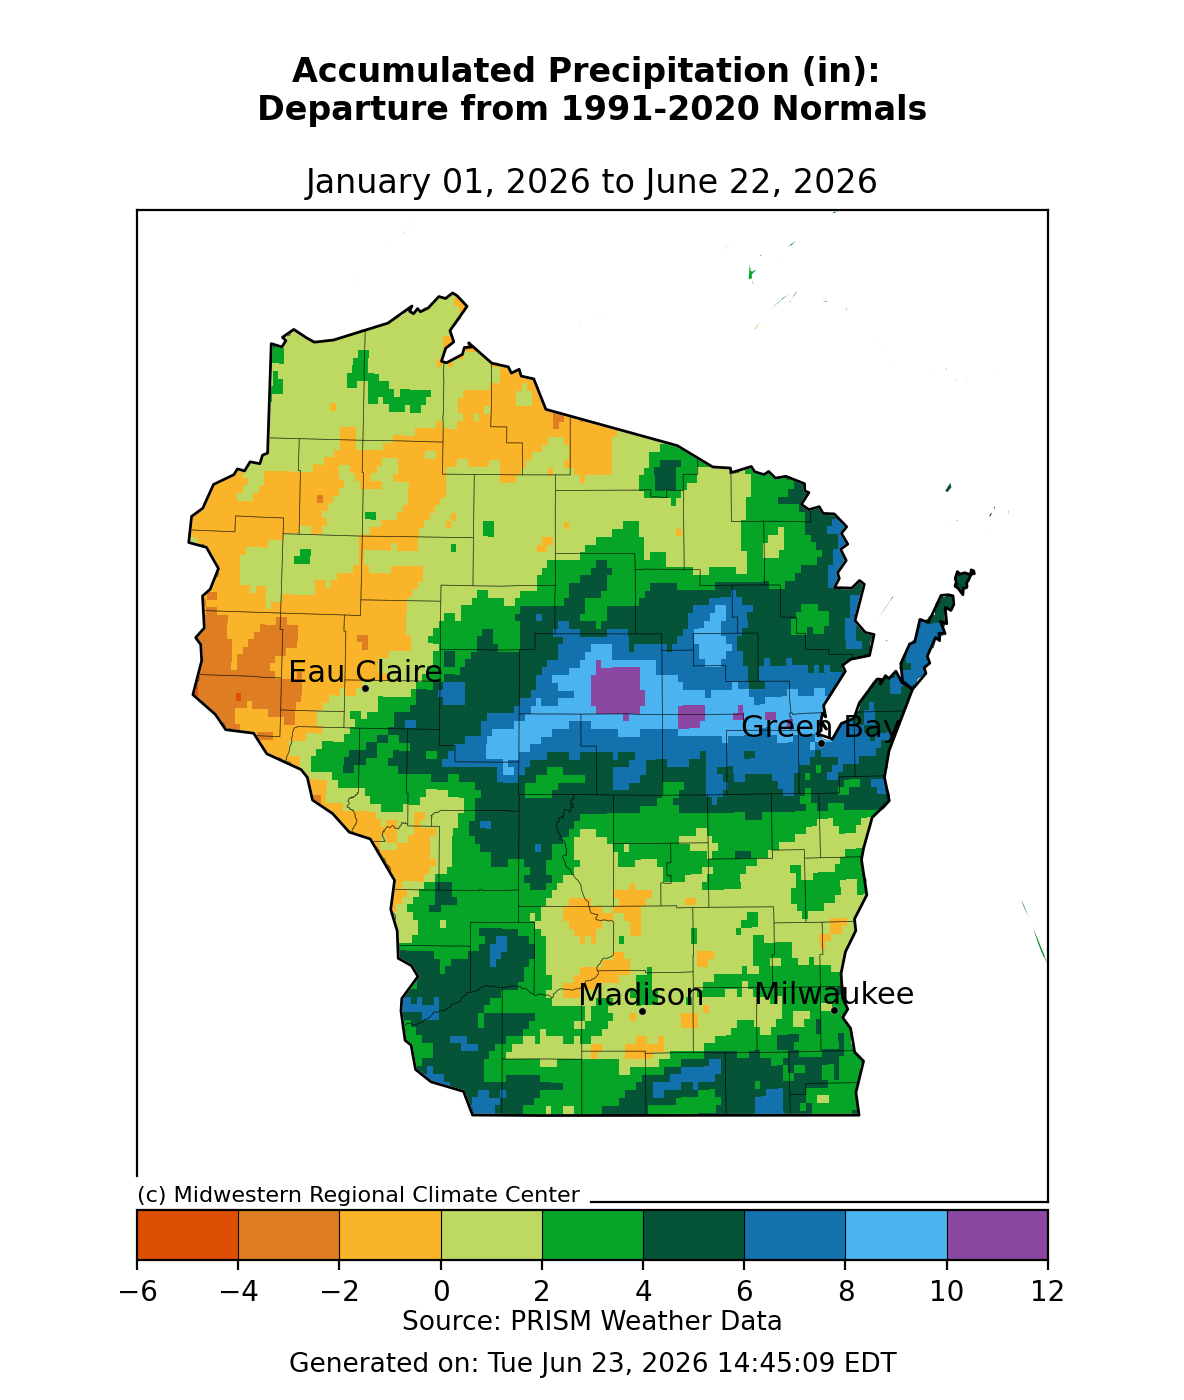
Image Description ↓
Choropleth map of Wisconsin showing accumulated precipitation departure from 1991–2020 normals (January 1 to June 22, 2026), produced by the Midwestern Regional Climate Center using PRISM Weather Data. A color scale ranges from dark orange (−6 inches) through yellow-green (0) to dark blue and purple (+12 inches). Western Wisconsin, particularly areas west of Eau Claire, displays orange and yellow tones indicating a deficit of 2–6 inches below normal. Northern and northeastern Wisconsin show light green to dark green, indicating near-normal to 2–4 inches above normal. A large area spanning central Wisconsin through the Green Bay region is colored blue and purple, indicating surpluses of 8–12+ inches above normal, with the greatest anomalies (purple, 12+ inches) located between Eau Claire and Green Bay. Southern Wisconsin near Madison and Milwaukee shows mixed dark green to blue tones, generally 4–8 inches above normal. Map generated June 23, 2026.
Soil Moisture and Temperature Trends
Soil Moisture Models
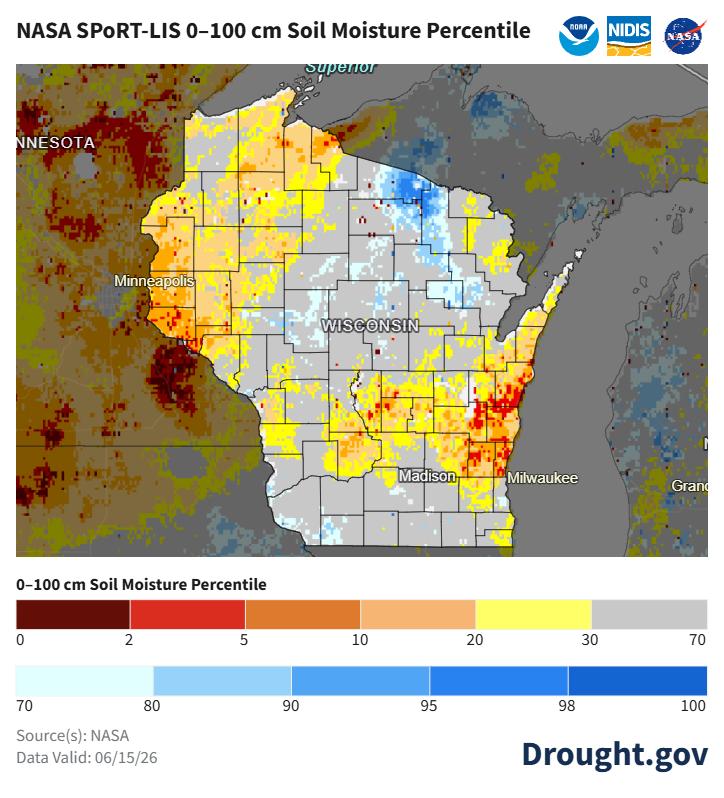
Image Description ↓
A regional map titled “NASA SPoRT-LIS 0–100 cm Soil Moisture Percentile,” showing Wisconsin and surrounding states. Logos for NOAA, NIDIS, and NASA appear in the upper right. Major city labels include Minneapolis (west), Madison (south-central Wisconsin), and Milwaukee (southeast Wisconsin). The state label “WISCONSIN” is centered. “Superior” marks Lake Superior at the top.
A color legend at the bottom labeled “0–100 cm Soil Moisture Percentile” ranges from dark brown (0–2 percentile, very dry), red/orange (5–10), yellow (20), light gray (30–70 near normal), and blues (70–100, wetter than normal).
Southern and southeastern Wisconsin, including areas near Madison and Milwaukee, show yellow to red/orange shades (about 5–30 percentile), indicating below-normal soil moisture. Central Wisconsin is mostly light gray (near normal, ~30–70 percentile). Northern Wisconsin includes patches of light to darker blue (70–95+ percentile), indicating above-normal moisture, especially toward the northeast. Western areas near Minnesota show mixed conditions, including some darker dry patches (brown/red) and localized wetter areas.
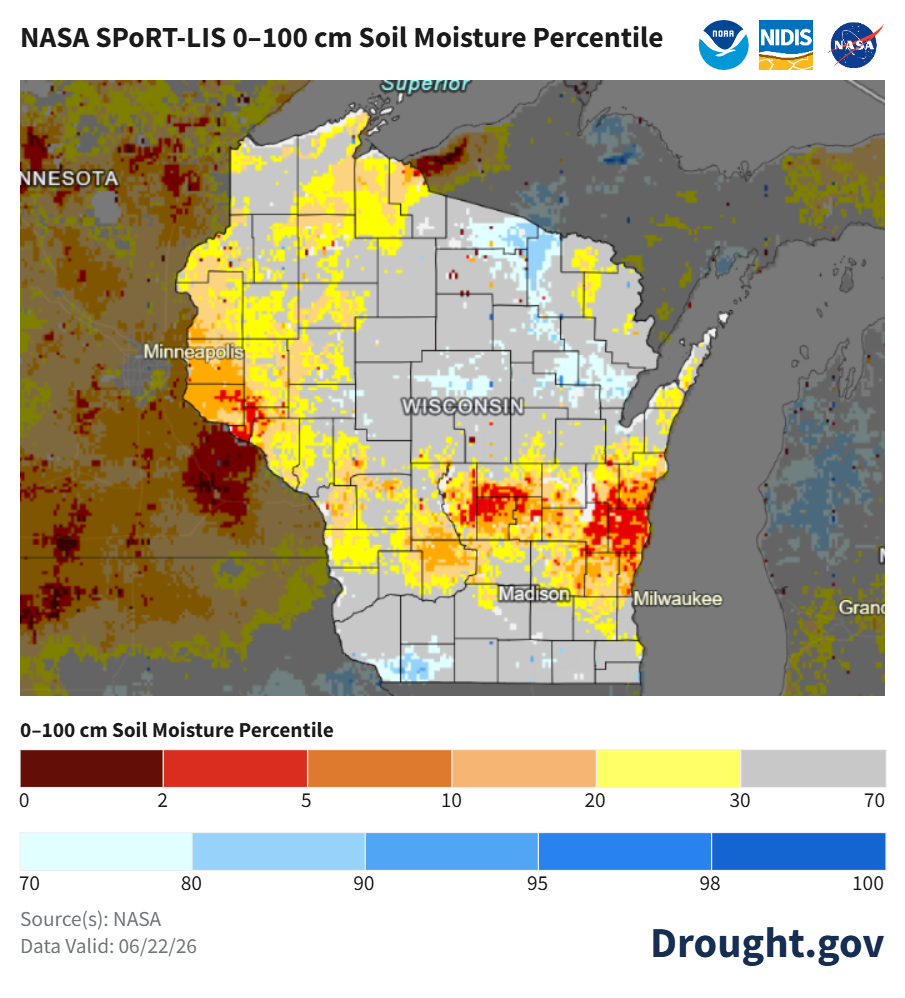
Image Description ↓
A map titled “NASA SPoRT-LIS 0–100 cm Soil Moisture Percentile” showing Wisconsin and nearby states, with NOAA, NIDIS, and NASA logos in the upper right. Labels include “WISCONSIN,” “Minneapolis,” “Madison,” and “Milwaukee.”
The legend at the bottom shows soil moisture percentile from 0 to 100. Dark brown (0–2) and red/orange (2–10) indicate very low soil moisture; yellow (10–30) indicates below normal; light gray (30–70) indicates near normal; and blue shades (70–100) indicate above normal to very wet. Text reads “Source(s): NASA,” “Data Valid: 06/22/26,” and “Drought.gov.”
Southern and south-central Wisconsin, including areas around Madison and extending east toward Milwaukee, show bands of red and orange (roughly 2–10 percentile), indicating very dry conditions. Adjacent areas show yellow (10–30 percentile), indicating below-normal moisture. Central Wisconsin is mostly light gray (near normal, 30–70 percentile). Northern Wisconsin shows more mixed conditions, with light to darker blue patches (70–95+ percentile), indicating above-normal soil moisture, especially in the northeast. Western areas near Minnesota display mixed dry (brown/red) and scattered wetter patches.
- Satellite-based soil moisture estimates indicate minimal change in soil moisture across the state compared to last week’s levels.
- Most of Wisconsin is estimated to have near-normal soil moisture in the top 1 meter.
- Counties in northwest, central, and east-central Wisconsin are still indicated as abnormally dry.
- Notes on how to interpret the maps:
- Red areas = top 5 driest in 100 years.
- Dark red areas = top 2 driest in 100 years.
- Dark blue areas = top 2 wettest in 100 years.
Wisconet Soil Moisture
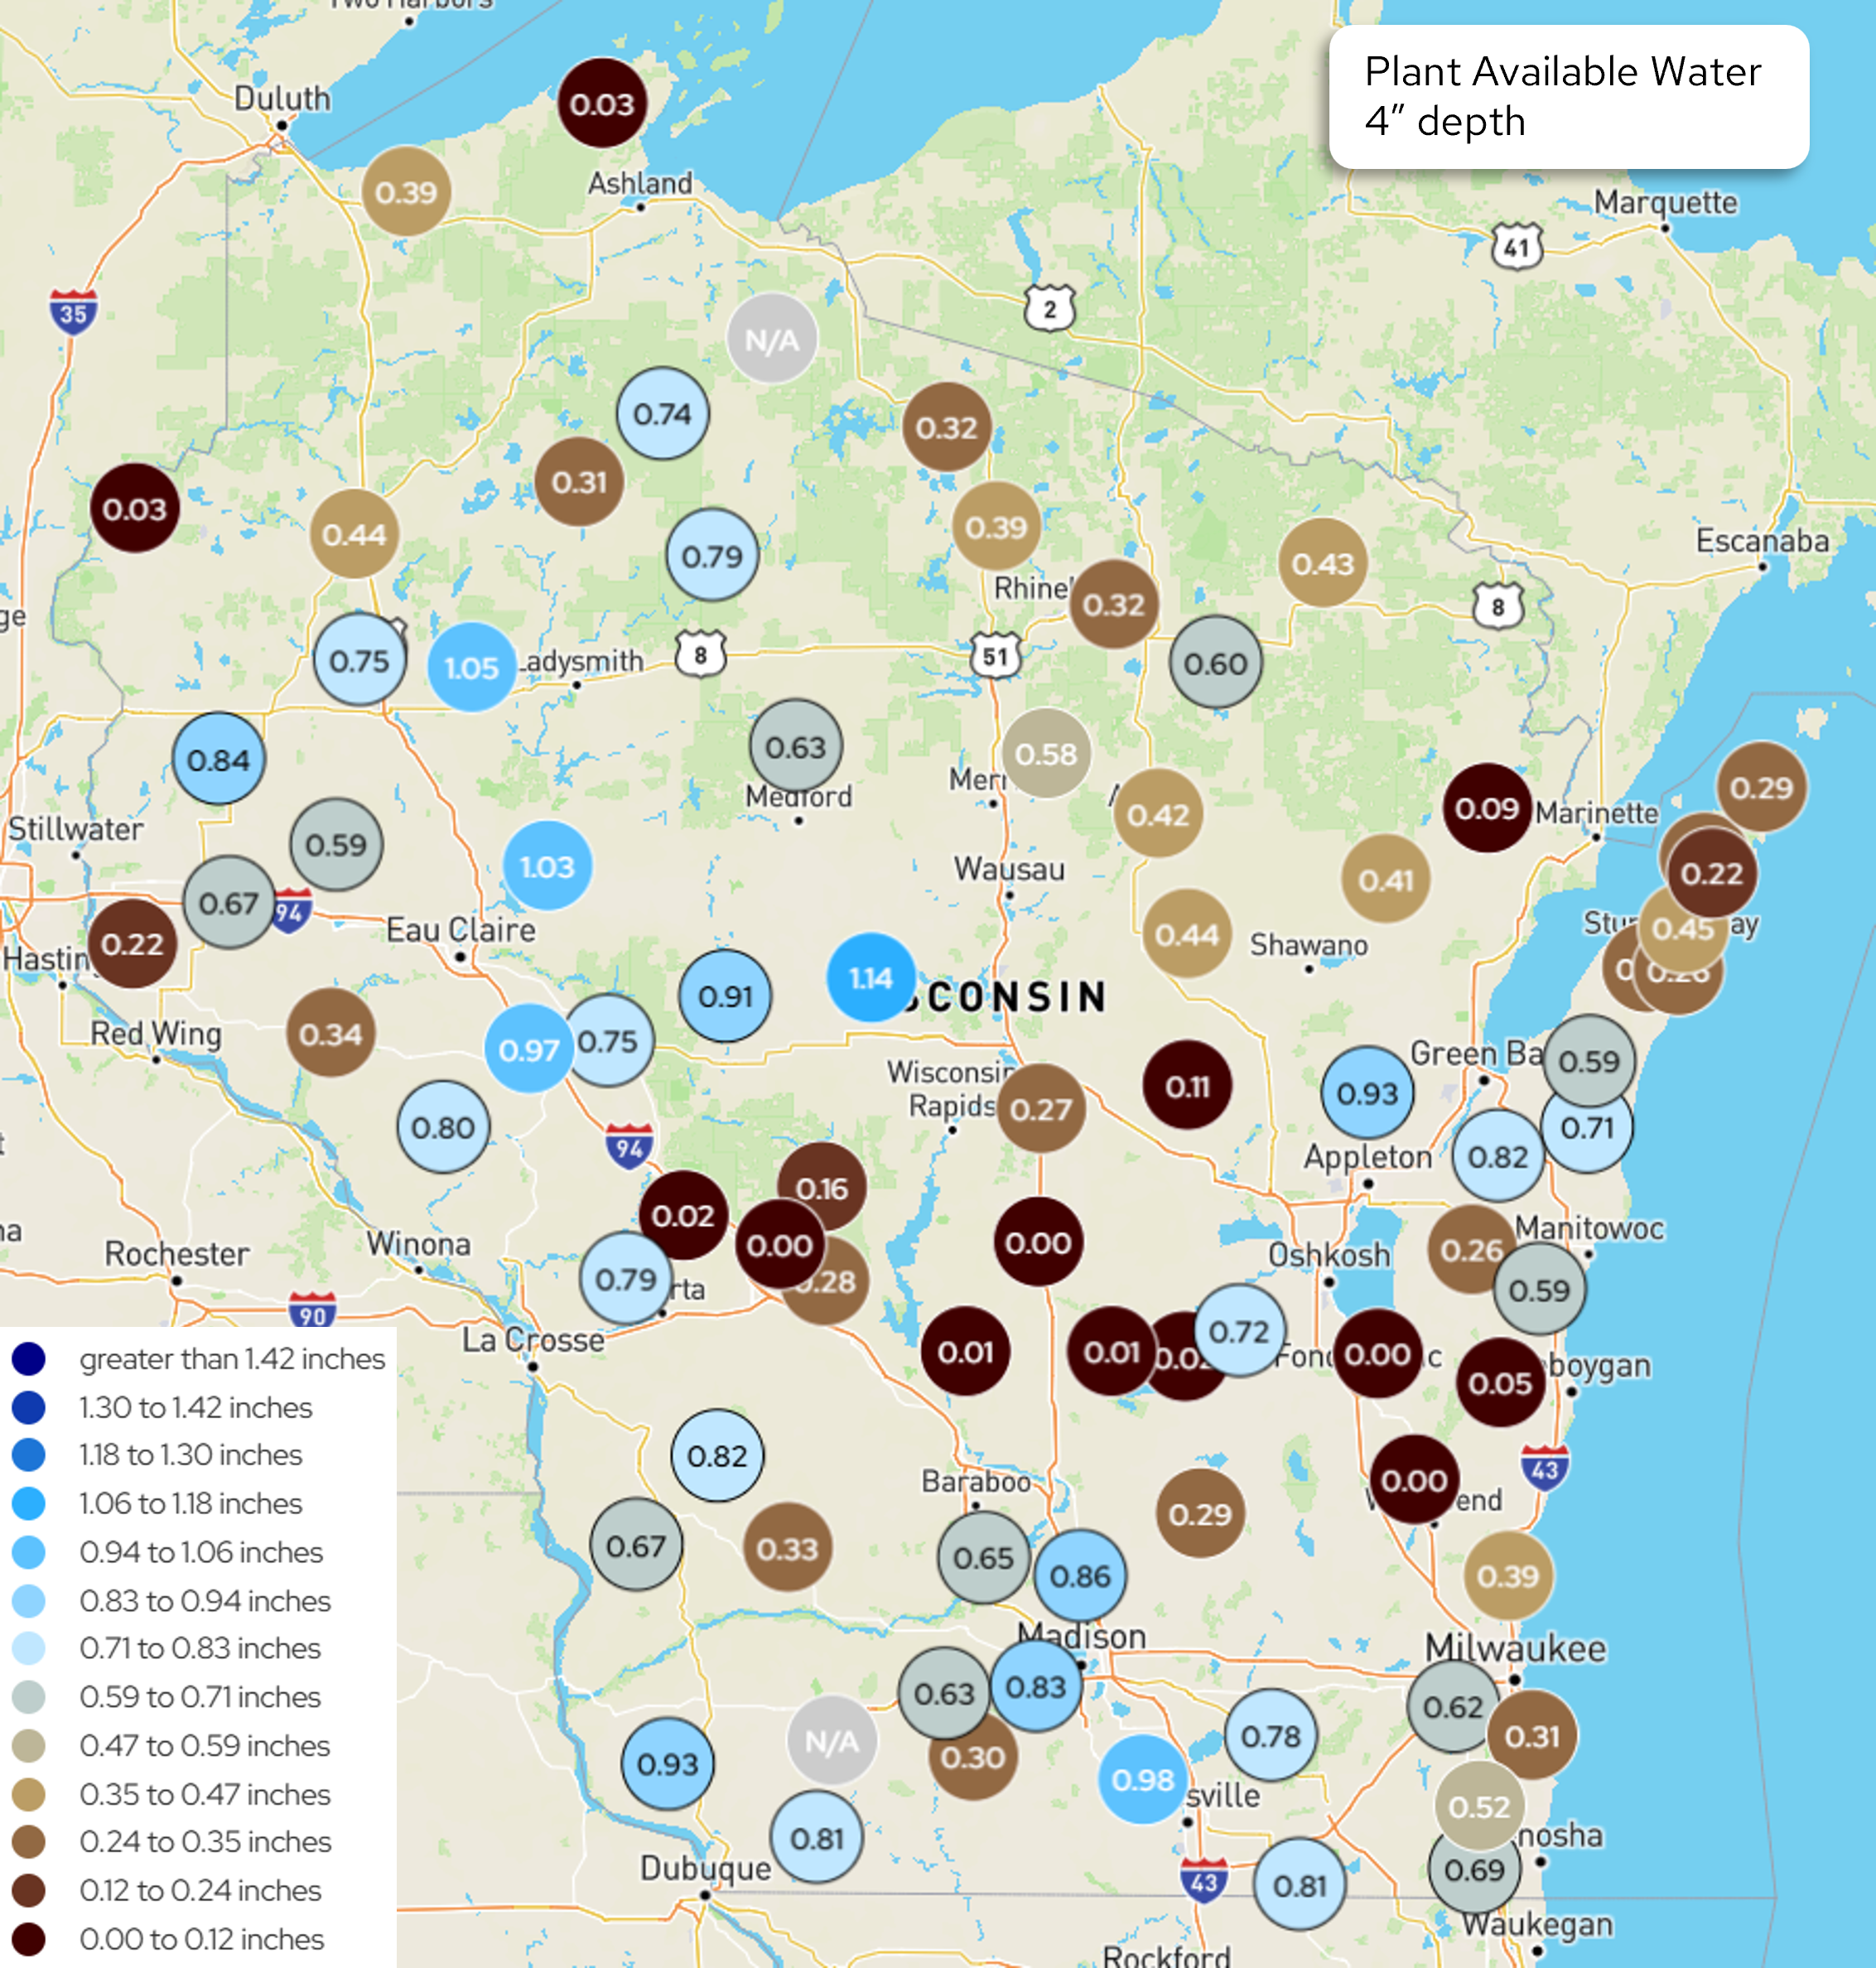
Image Description ↓
A dot map of Wisconsin displaying plant available water (PAW) measurements at a 4-inch soil depth across monitoring stations statewide. Each station is represented by a colored circle with a numerical value in inches. Colors follow a 15-category legend ranging from dark red (0.00–0.12 inches, indicating very low water availability) through browns, tans, grays, and blues to dark navy (greater than 1.42 inches, indicating very high water availability).
Notable values include a high of 1.14 inches in central Wisconsin (near Wisconsin Rapids), and lows of 0.00 inches at multiple stations in south-central and eastern Wisconsin. Northwestern Wisconsin stations generally show moderate-to-high values (0.75–1.05 inches), while southern and southeastern stations show lower values, several at or near 0.00. Two stations are labeled “N/A.” The map includes surrounding state and regional context, with cities such as Eau Claire, Green Bay, Madison, Milwaukee, and La Crosse labeled for geographic reference.
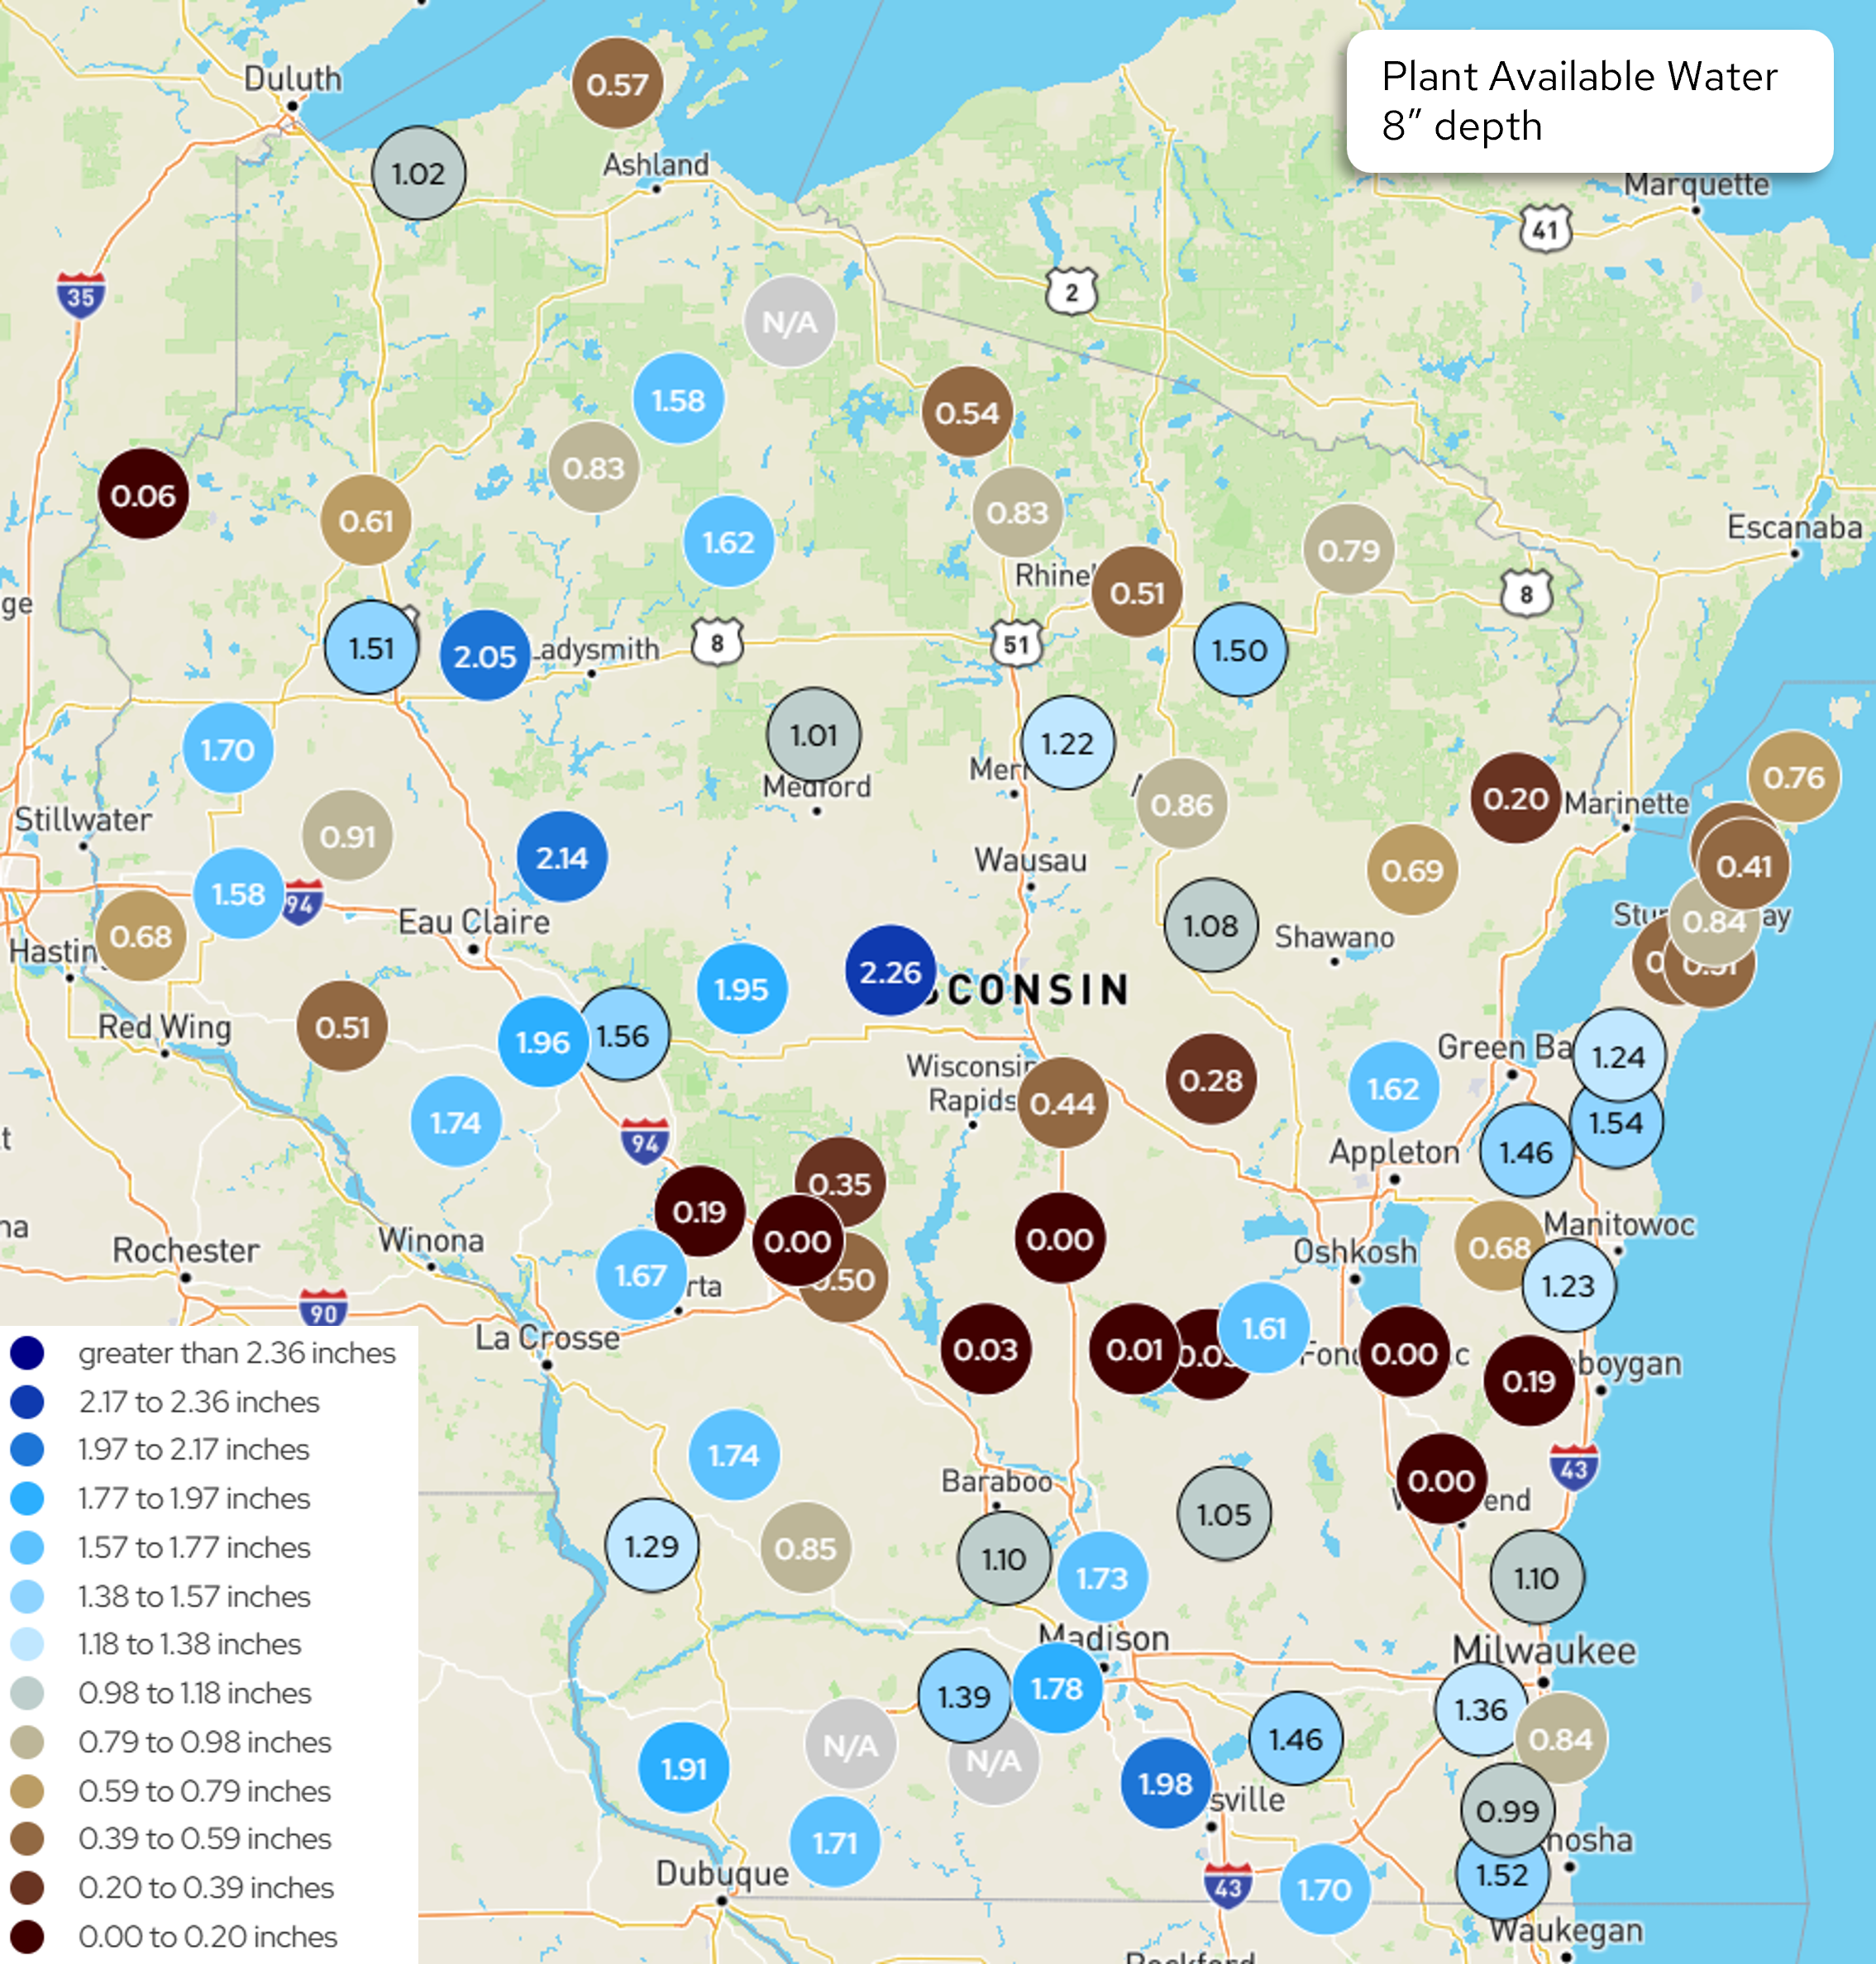
Image Description ↓
A geographic map titled “Plant Available Water 8″ depth” showing monitoring station readings across Wisconsin and portions of neighboring states. Each station is represented by a circle labeled with a numeric value in inches. Circle colors correspond to a 14-category legend ranging from dark red (0.00–0.20 inches) through tan/gray mid-range values to dark navy blue (greater than 2.36 inches).
Notable readings include a high of 2.26 inches in central Wisconsin (near Wisconsin Rapids), and a value of 2.05 near Ladysmith. Several stations in south-central and eastern Wisconsin show 0.00 inches, concentrated near the Fond du Lac and Madison corridors. Two stations are marked N/A (no data available), located in north-central Wisconsin and south of Madison. Western Wisconsin generally shows moderate-to-high values (1.57–2.17 inches), while the eastern lakeshore region shows a mix of low and moderate values. The map covers approximately from Duluth, MN in the northwest to Waukegan, IL in the southeast.
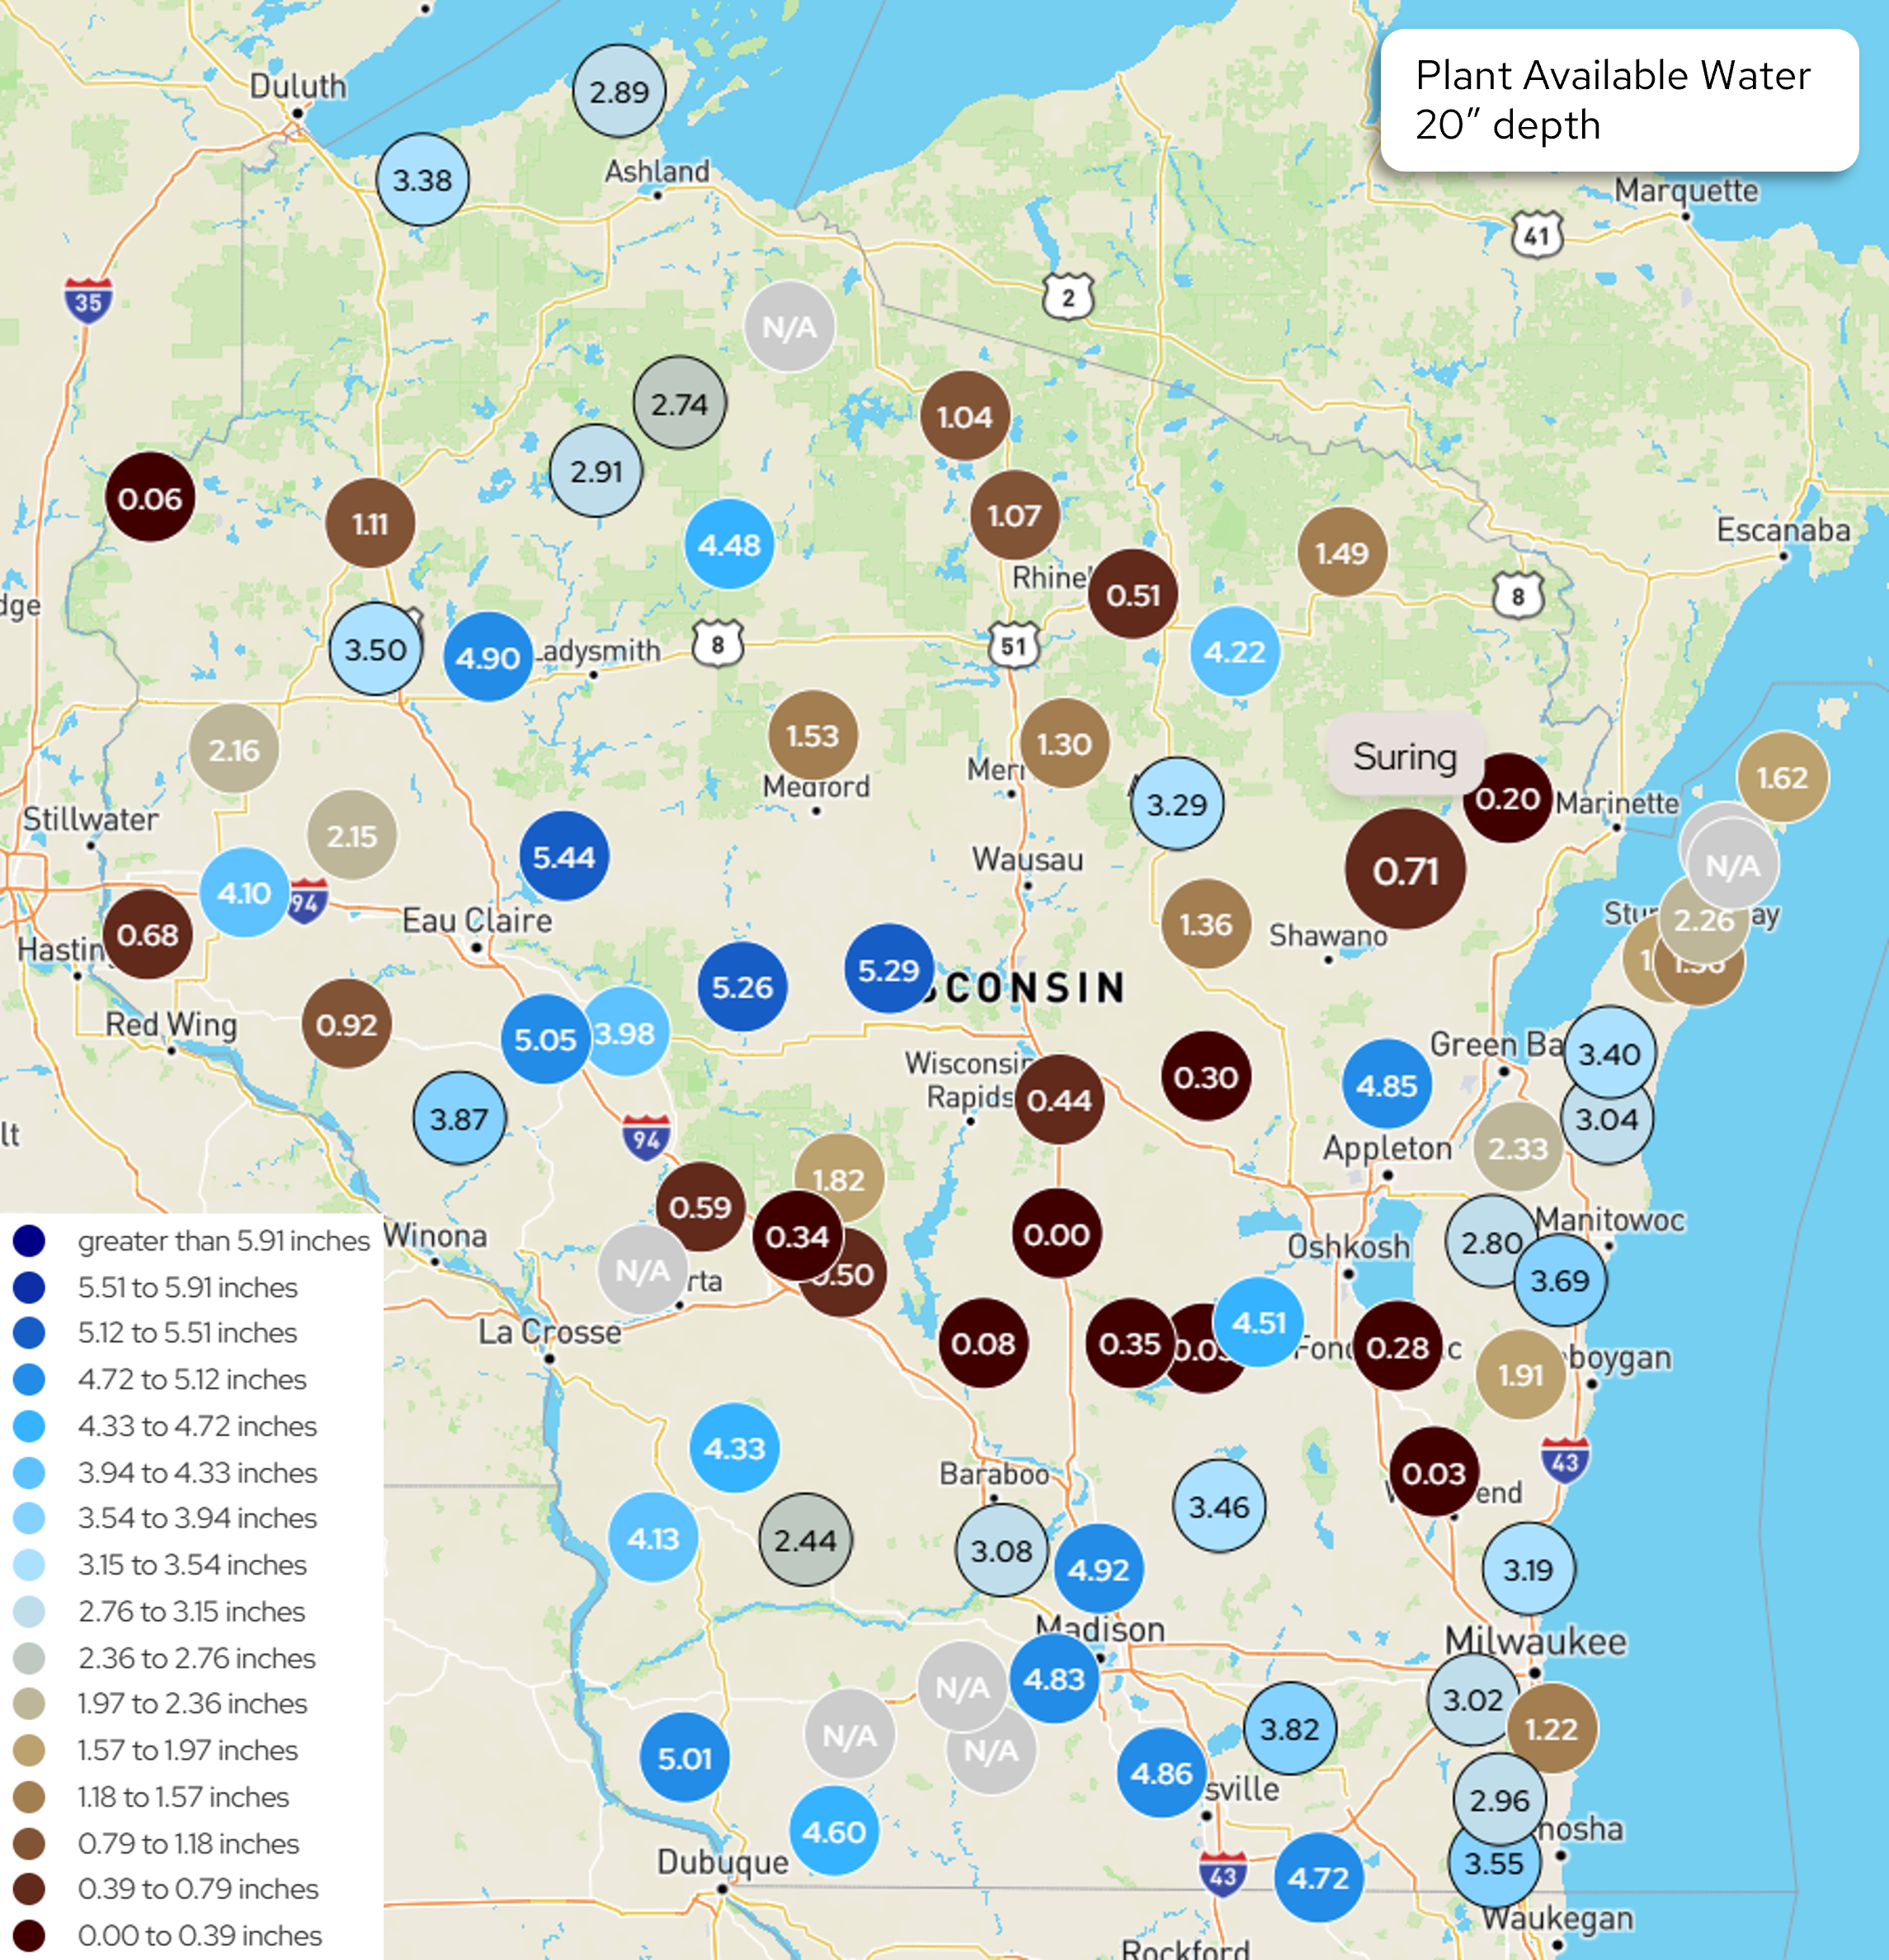
Image Description ↓
A color-coded dot map of Wisconsin and border regions displaying plant available water measurements at 20-inch soil depth. Each dot represents a monitoring site labeled with a numeric value in inches. Colors range from dark red/maroon (0.00–0.39 inches, indicating very low moisture) through browns, tans, and grays to light and dark blue (greater than 5.91 inches, indicating high moisture). A legend in the lower left identifies 17 color categories spanning 0.00 to greater than 5.91 inches.
Notable values include very low readings (dark maroon) of 0.00 near Baraboo, 0.03 near Sheboygan, 0.06 in far western Wisconsin, and 0.08 and 0.35 in the south-central region. High readings (dark blue) include 5.44 near Eau Claire, 5.26 and 5.29 in central Wisconsin, 5.05 near La Crosse, and 5.01 in the southwest. Several sites are marked N/A indicating no data available. The map covers Wisconsin with portions of Minnesota, Iowa, Illinois, Michigan, and Lake Michigan visible.
- Most Wisconet research farm stations showed minimal change in 4-inch moisture following a week with 0.5-1” of rain.
- The maps (above) show the daily average Wisconet plant available water (inches) on June 22nd.
- The table (below) shows total precipitation and changes in plant available water from June 15th (Start) to June 22nd (End).
- What is plant available water? To learn more, read this article from UW Extension Ag Water Quality on plant available water. There is also a webinar from UW Extension on soil water management that you can watch.
- Example: Imagine that you have 4 inches of soil in the bottom of a bucket. In that soil, there are 1.5 inches of plant available water. Therefore, if you removed the soil and left only the water available for plant roots to take up, you would have 1.5 inches of water in the bottom of the bucket.
- The wilting point is when plant available water is at 0 inches, and the plant can no longer access water at that depth in the soil.
| Research Farm | County | Total Precipitation (in.) | 4″ Start | 4″ End | 8″ Start | 8″ End | 20″ Start | 20″ End |
|---|---|---|---|---|---|---|---|---|
| Arlington | Columbia | 0.35 | 0.95 | 0.86 | 1.89 | 1.73 | 5.08 | 4.92 |
| Black River Falls | Jackson | 0.42 | 0.05 | 0.02 | 0.26 | 0.19 | 1.86 | 0.59 |
| Dairy Forage ARS | Sauk | 0.63 | 0.73 | 0.65 | 1.13 | 1.10 | 3.14 | 3.08 |
| Hancock | Waushara | 0.38 | 0.00 | 0.00 | 0.00 | 0.00 | 0.00 | 0.00 |
| Kemp | Oneida | 1.01 | 0.38 | 0.39 | 0.80 | 0.83 | 1.03 | 1.07 |
| Lancaster | Grant | 0.61 | 0.95 | 0.93 | 1.97 | 1.91 | 5.07 | 5.01 |
| Marshfield | Marathon | 1.46 | 1.14 | 1.14 | 2.26 | 2.26 | 5.29 | 5.29 |
| O.J. Noer (Turfgrass) | Dane | 1.16 | 0.86 | 0.83 | 1.80 | 1.78 | 4.86 | 4.83 |
| Peninsular | Door | 0.76 | 0.48 | 0.45 | 0.88 | 0.84 | 2.27 | 2.26 |
| Rhinelander | Oneida | 0.68 | 0.17 | 0.32 | 0.28 | 0.51 | 0.28 | 0.51 |
| Spooner | Washburn | 1.25 | 0.22 | 0.44 | 0.22 | 0.61 | 0.75 | 1.11 |
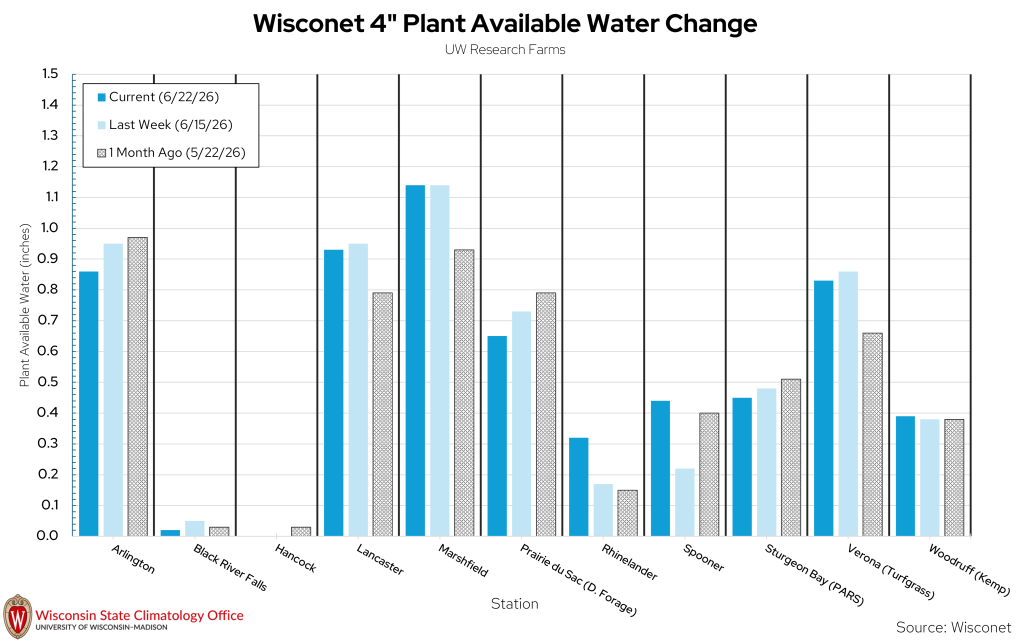
| Research Farm | Current 4″ Soil Moisture | Last Week’s 4″ Soil Moisture | 1 Month Ago 4″ Soil Moisture |
|---|---|---|---|
| Arlington | 0.86 | 0.95 | 0.97 |
| Black River Falls | 0.02 | 0.05 | 0.03 |
| Dairy Forage ARS | 0.65 | 0.73 | 0.79 |
| Hancock | 0.00 | 0.00 | 0.03 |
| Kemp | 0.39 | 0.38 | 0.38 |
| Lancaster | 0.93 | 0.95 | 0.79 |
| Marshfield | 1.14 | 1.14 | 0.93 |
| O.J. Noer (Turfgrass) | 0.83 | 0.86 | 0.66 |
| Peninsular | 0.45 | 0.48 | 0.51 |
| Rhinelander | 0.32 | 0.17 | 0.15 |
| Spooner | 0.44 | 0.22 | 0.40 |
USDA Soil Moisture Reports
*Note that USDA soil moisture maps were not updated this week.
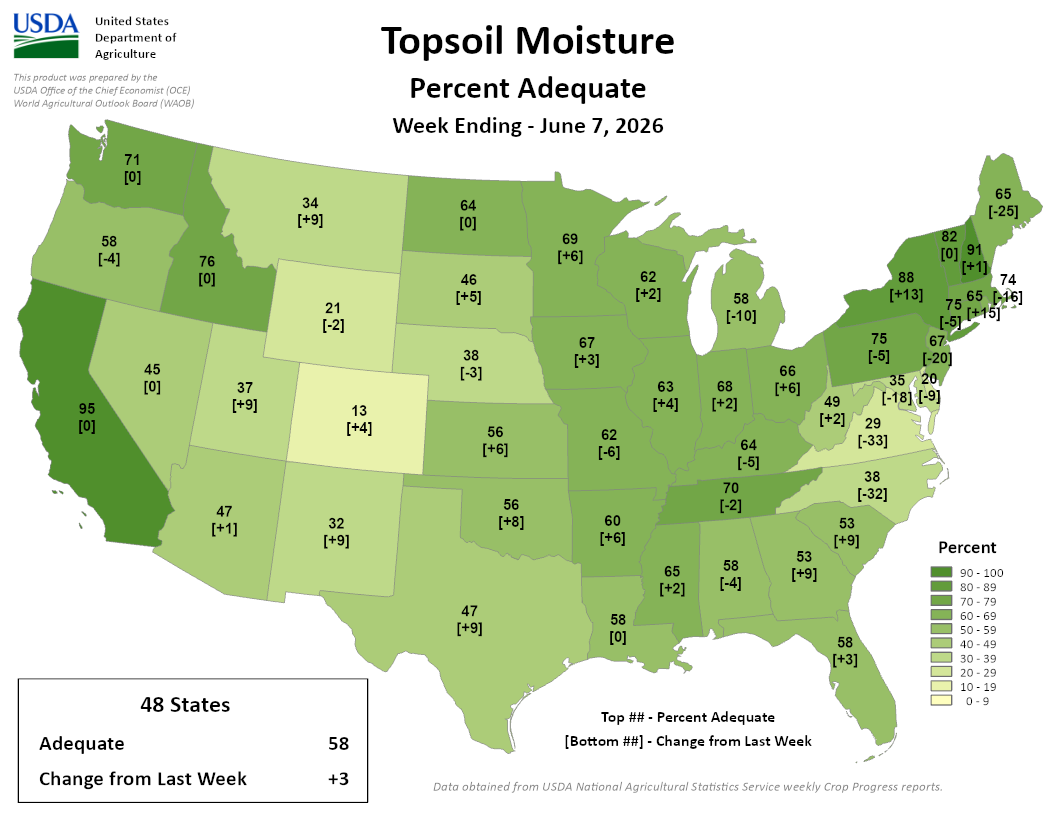
Image Description ↓
Choropleth map of the contiguous US showing topsoil moisture percent adequate by state, with green shading from light (0-9%) to dark (90-100%). State values [change from prior week]: Washington 71 [0], Oregon 58 [-4], Idaho 76 [0], California 95 [0], Nevada 45 [0], Utah 37 [+9], Arizona 47 [+1], Montana 34 [+9], Wyoming 21 [-2], Colorado 13 [+4], New Mexico 32 [+9], North Dakota 64 [0], South Dakota 46 [+5], Nebraska 38 [-3], Kansas 56 [+6], Oklahoma 56 [+8], Texas 47 [+9], Minnesota 69 [+6], Iowa 67 [+3], Missouri 62 [-6], Arkansas 60 [+6], Louisiana 58 [0], Wisconsin 62 [+2], Illinois 63 [+4], Mississippi 65 [+2], Alabama 58 [-4], Georgia 53 [+9], Michigan 58 [-10], Indiana 68 [+2], Kentucky 64 [-5], Tennessee 70 [-2], South Carolina 53 [+9], Florida 58 [+3], Ohio 66 [+6], West Virginia 49 [+2], North Carolina 35 [-18], Virginia 29 [-33], Maryland/Delaware 38 [-32], Pennsylvania 75 [-5], New York 88 [+13], Vermont 82 [0], New Hampshire 91 [+1], Maine 65 [-25], Massachusetts/Connecticut/Rhode Island 67 [-20], New Jersey 20 [-9], 74 [-16] (coastal Northeast region). Source: USDA National Agricultural Statistics Service weekly Crop Progress reports.
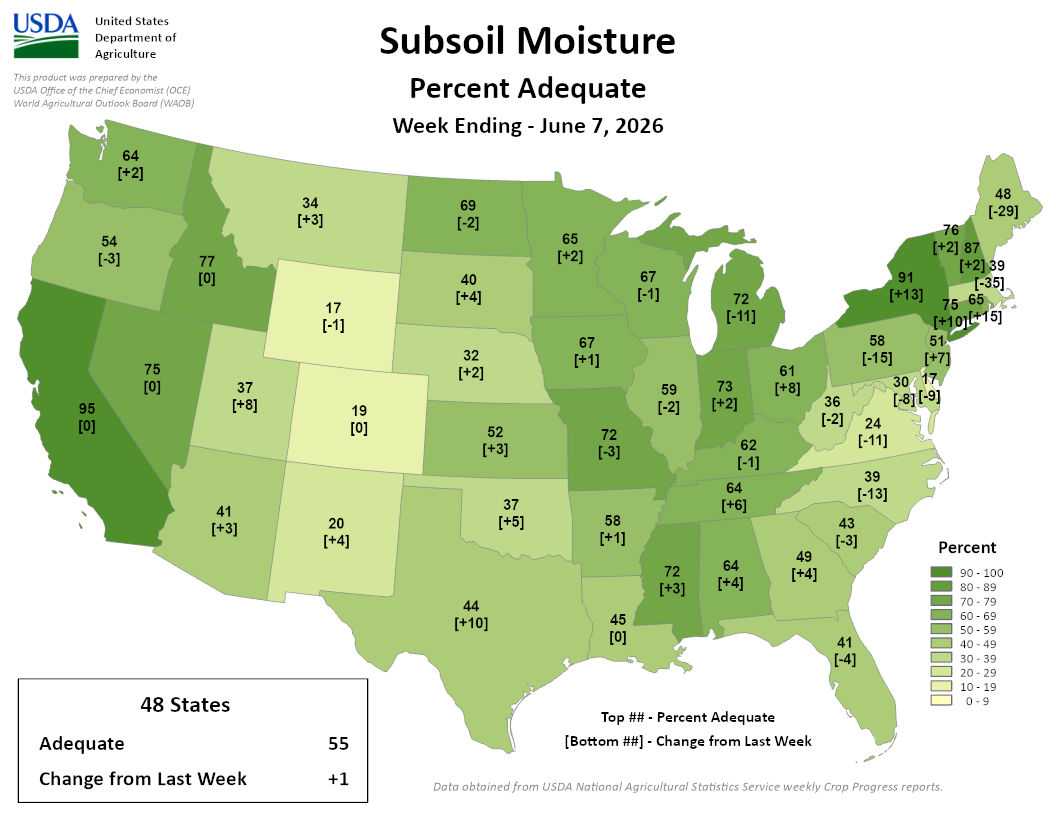
Image Description ↓
Choropleth map of the 48 contiguous states, shaded green by percent adequate subsoil moisture (scale: 0-9 to 90-100, darker = higher). Each state shows its percent value with change from last week in brackets. State values: WA 64 [+2], OR 54 [-3], CA 95 [0], ID 77 [0], NV 75 [0], UT 37 [+8], AZ 41 [+3], MT 34 [+3], WY 17 [-1], CO 19 [0], NM 20 [+4], ND 69 [-2], SD 40 [+4], NE 32 [+2], KS 52 [+3], OK 37 [+5], TX 44 [+10], MN 65 [+2], IA 67 [+1], MO 72 [-3], AR 58 [+1], LA 45 [0], WI 67 [-1], IL 59 [-2], MS 72 [+3], AL 64 [+4], GA 49 [+4], MI 72 [-11], IN 73 [+2], OH 61 [+8], KY 62 [-1], TN 64 [+6], FL 41 [-4], NY 75 [+10], PA 58 [-15], WV 36 [-2], VA 24 [-11], NC 39 [-13], SC 43 [-3], ME 48 [-29], VT 76 [+2], NH 87 [+2], MA 39 [-35], CT 91 [+13], RI 65 [+15], NJ 30 [-8], DE 17 [-9]. Source: USDA NASS weekly Crop Progress reports.
- 79% and 74% of agricultural soils in the state are reported as having adequate topsoil and subsoil moisture, respectively. Both values increased from last week’s report.
- 10% and 16% of agricultural soils in the state are reported as having short to very short topsoil and subsoil moisture, respectively. Both values decreased from last week’s report.
Wisconet Soil Temperature
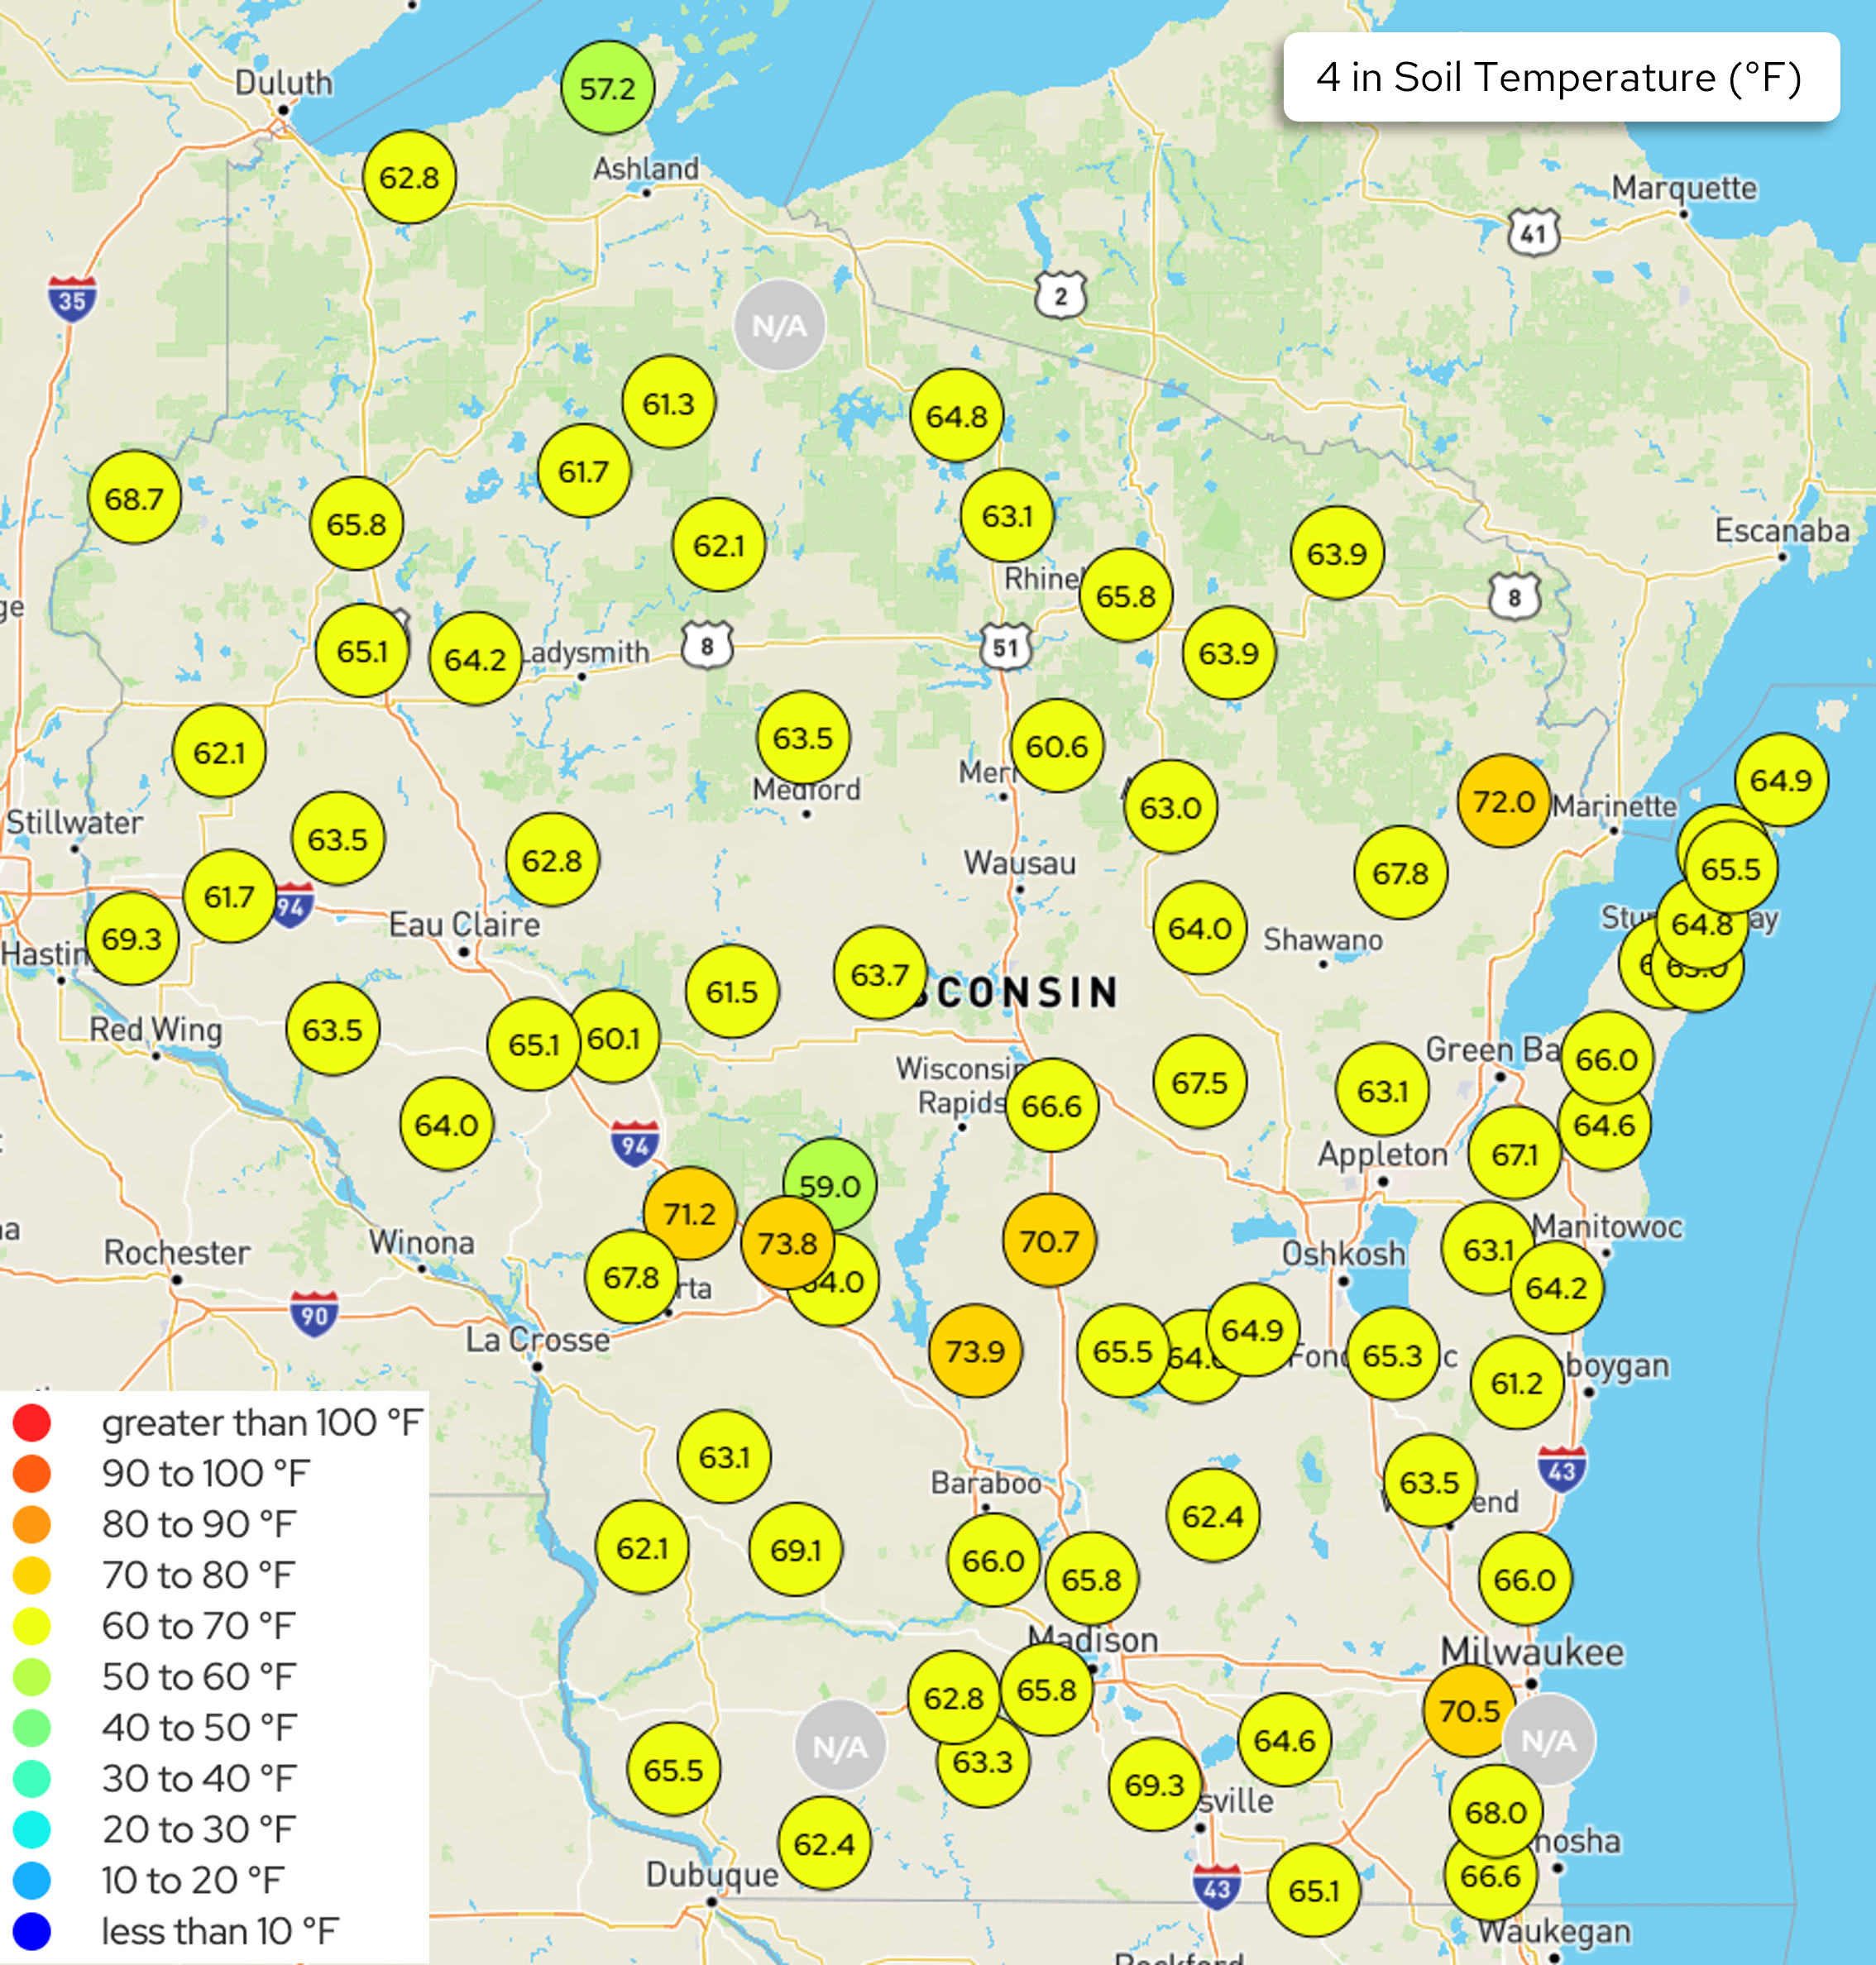
Image Description ↓
A color-coded map of Wisconsin displaying 4-inch depth soil temperatures in degrees Fahrenheit recorded at weather stations across the state. Each station is marked with a colored circle containing a temperature value. The color scale ranges from dark blue (below 10°F) to red (above 100°F), with most stations displaying yellow circles indicating temperatures in the 60–70°F range. Notable readings include 73.8°F and 71.2°F near La Crosse in the west-central region, 73.9°F in south-central Wisconsin, 72.0°F near Marinette in the northeast, and 70.5°F near Milwaukee in the southeast. The coolest reading visible is 57.2°F near Ashland in the north (shown in green, indicating 50–60°F). One station near Rhinelander and one in southern Wisconsin show “N/A” in gray, indicating no data available. The map includes portions of neighboring states and Lake Michigan to the east.
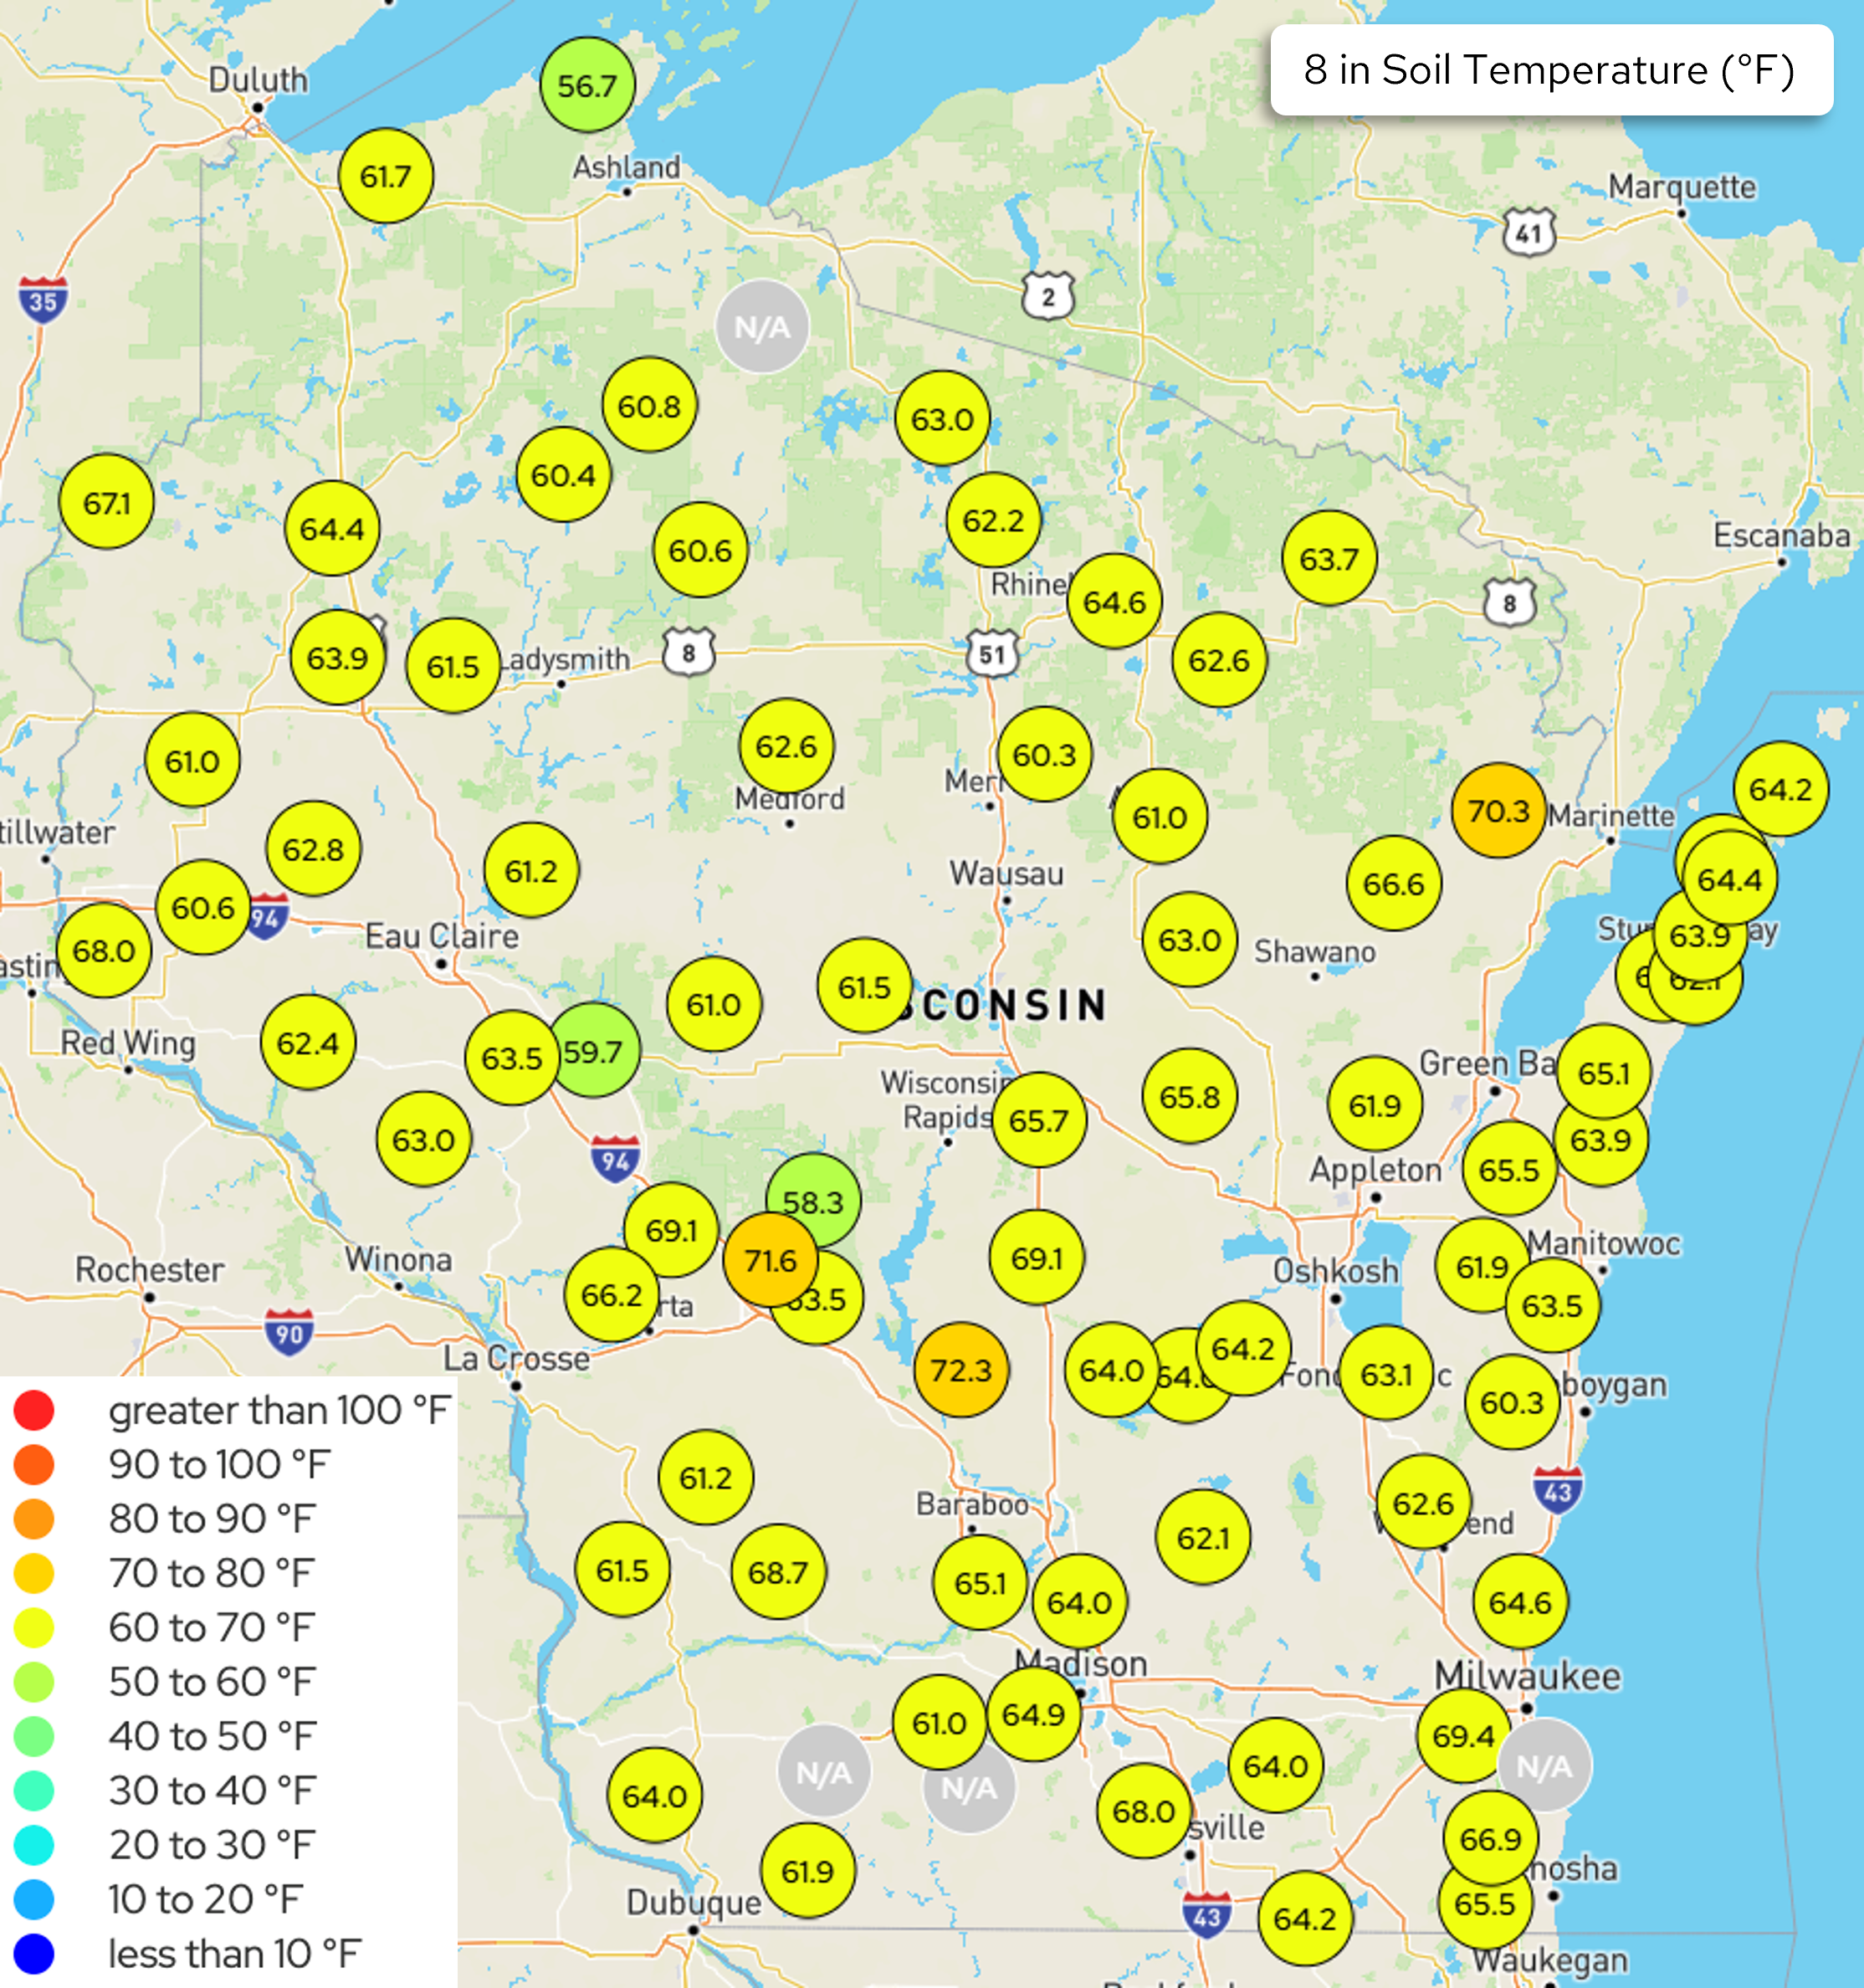
Image Description ↓
A color-coded map of Wisconsin displaying 8-inch soil temperatures in degrees Fahrenheit from a network of monitoring stations. Each station is represented by a circle labeled with its temperature reading, colored according to a legend in the lower left.
The majority of stations display yellow circles, indicating temperatures in the 60–70°F range. Notable exceptions include:
- Orange circle (70–80°F range): 70.3°F near Marinette (northeast); 71.6°F and 72.3°F in south-central Wisconsin near the Wisconsin Dells/Baraboo area
- Green circle (50–60°F range): 56.7°F at Ashland (north); 58.3°F and 59.7°F in west-central Wisconsin
- Several N/A stations (gray circles) scattered across the state, including locations in southern Wisconsin and the Milwaukee area
Temperature legend ranges from “less than 10°F” (dark blue) through increments up to “greater than 100°F” (red). The map covers the full state of Wisconsin with bordering portions of Minnesota, Iowa, Illinois, Michigan, and Lake Michigan visible.
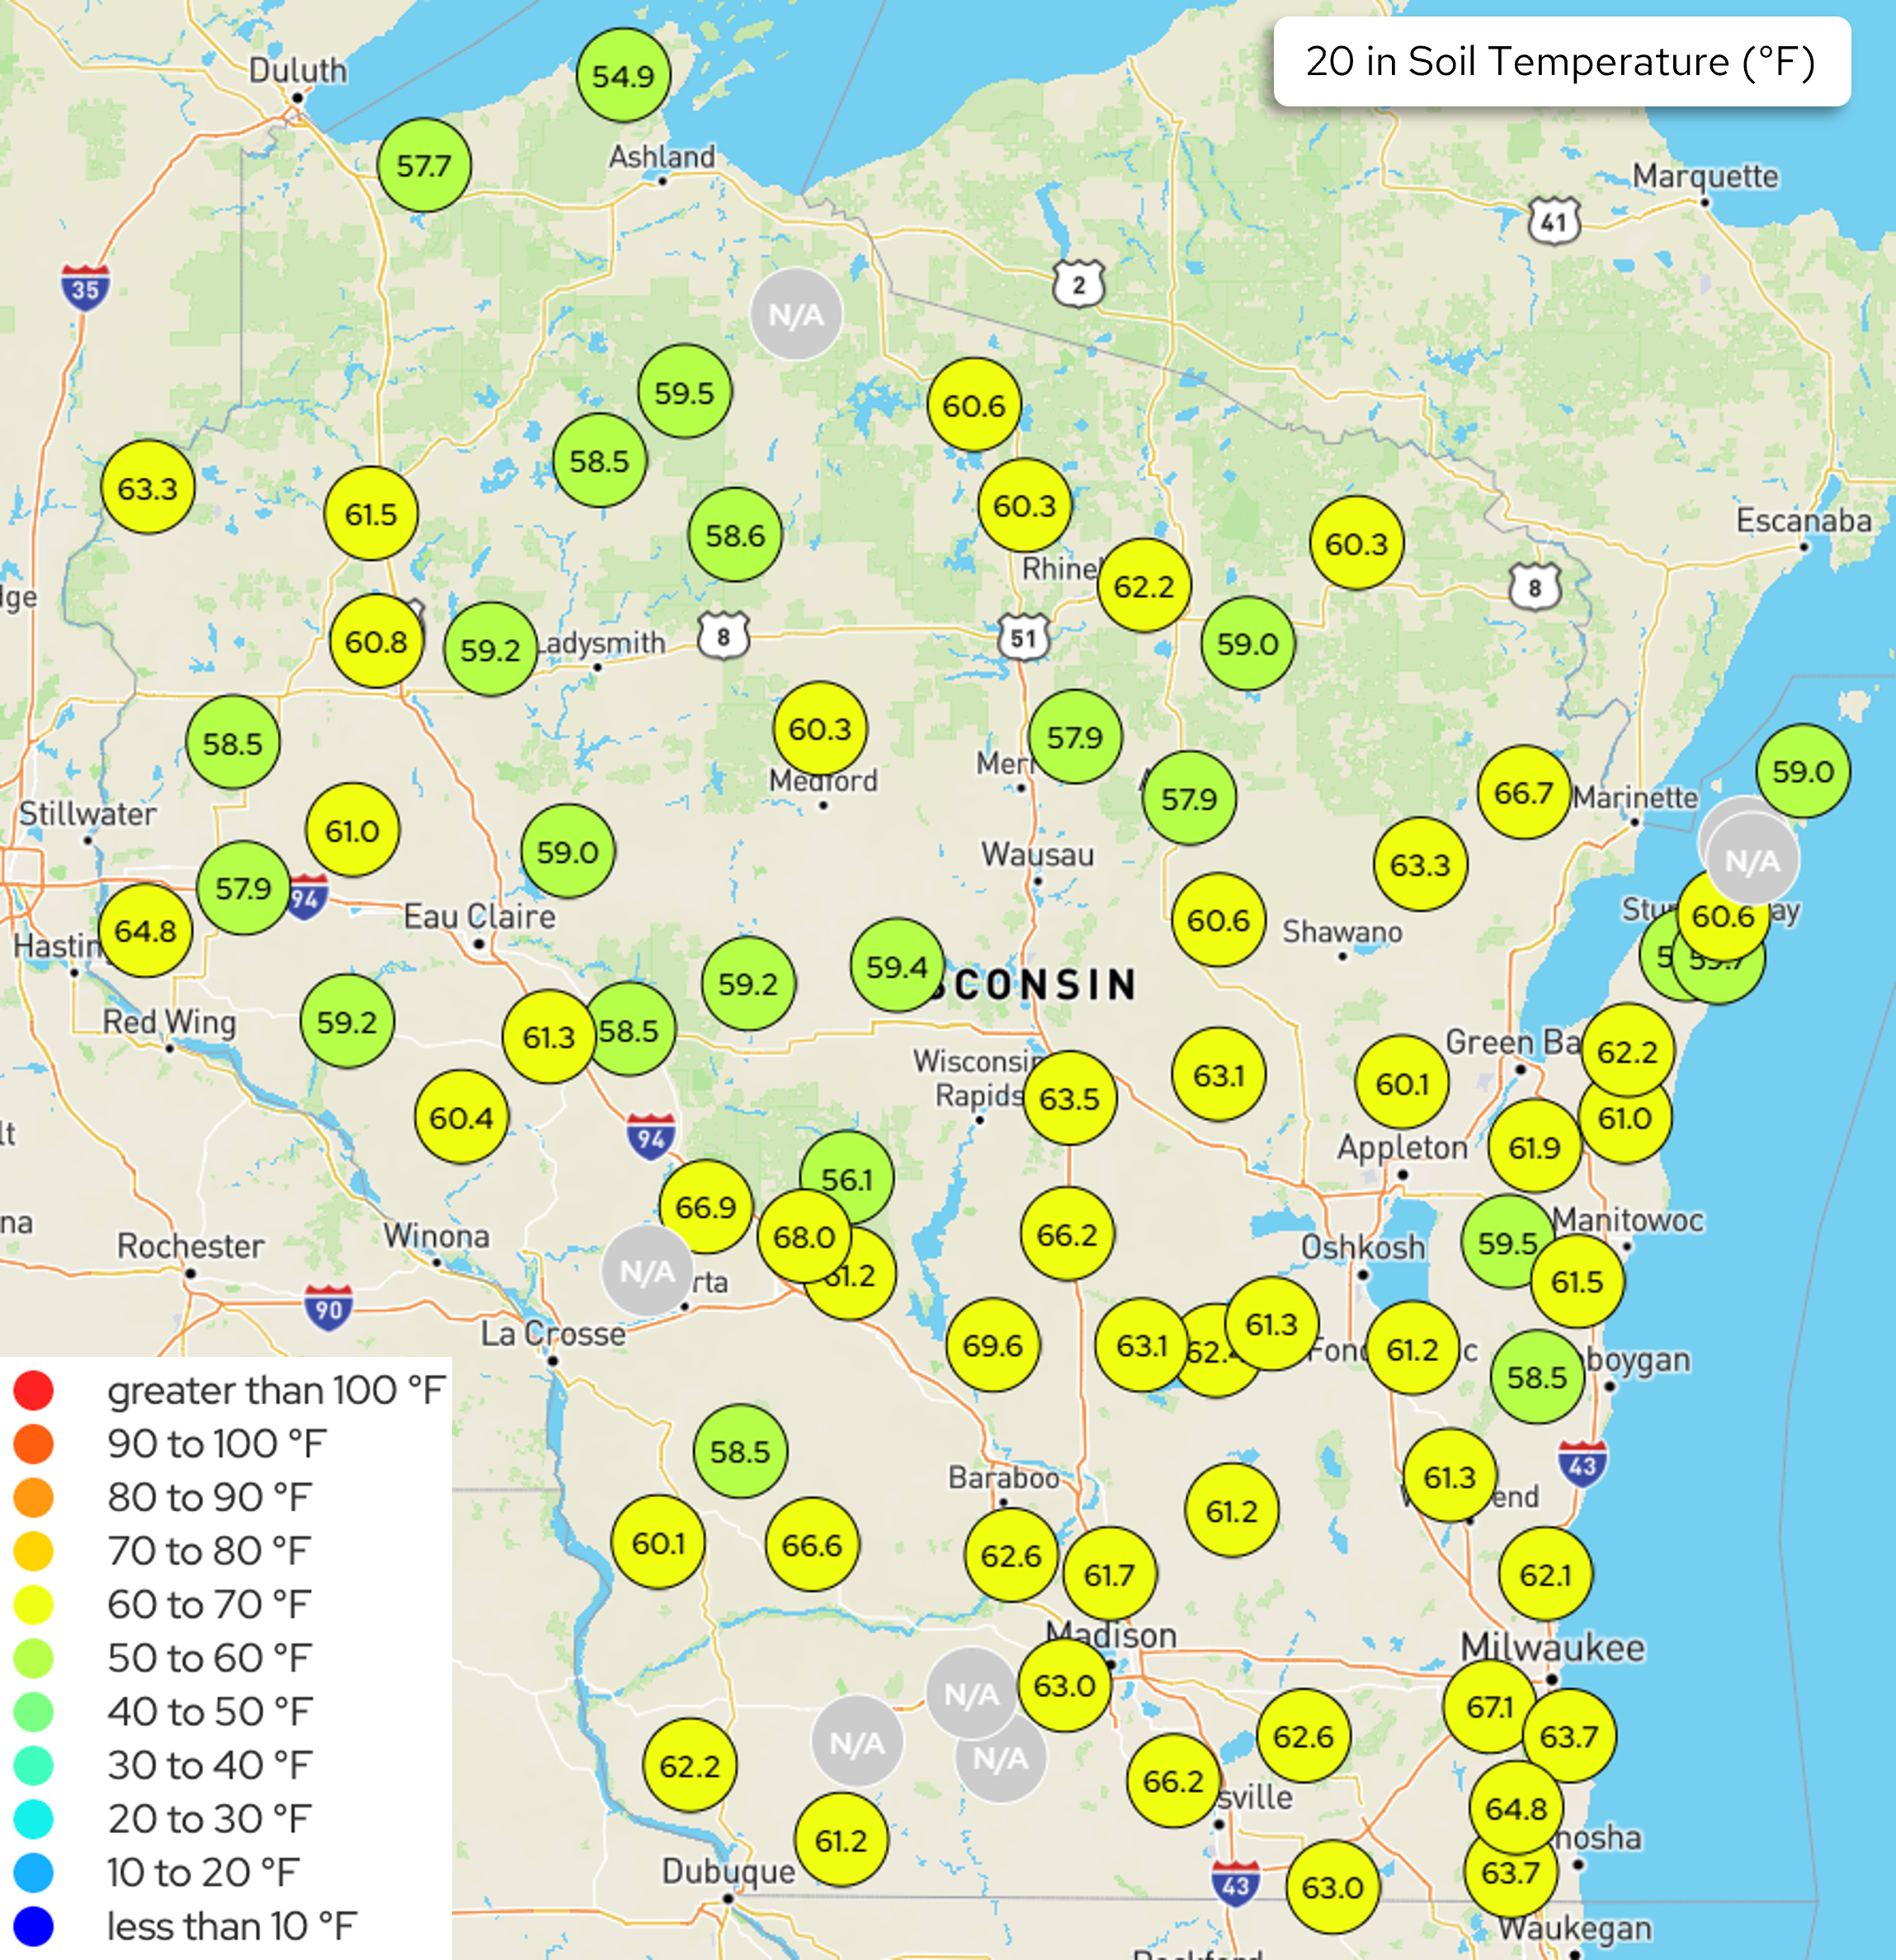
Image Description ↓
A color-coded map of Wisconsin and surrounding border areas showing soil temperature readings at 20-inch depth in degrees Fahrenheit. Each monitoring station is represented by a colored circle with a numeric value.
Color scale (from legend):
- Red: >100°F | Orange: 90–100°F | Dark orange: 80–90°F | Yellow-orange: 70–80°F
- Yellow: 60–70°F (dominant across the map)
- Yellow-green: 50–60°F (common in northern Wisconsin)
- Green: 40–50°F | Teal: 30–40°F | Blue shades: below 30°F | Dark blue: <10°F
Regional patterns:
Several stations marked N/A (gray circles) scattered across the state indicate no data available
Northern Wisconsin (Ashland, Rhinelander area): cooler readings predominantly in the upper 50s°F (54.9–59.5°F), displayed in yellow-green
Central and Southern Wisconsin (Wausau to Madison): mostly 60–69°F in yellow, with several stations reaching the mid-to-upper 60s (66.2–69.6°F)
Southeast Wisconsin (Milwaukee, Kenosha area): readings range 62.1–67.1°F
Highest visible values: 68.0°F and 69.6°F in south-central Wisconsin near La Crosse/Wisconsin Dells corridor
- The maps show daily average Wisconet soil temperature conditions on June 22nd
U.S. Drought Monitor
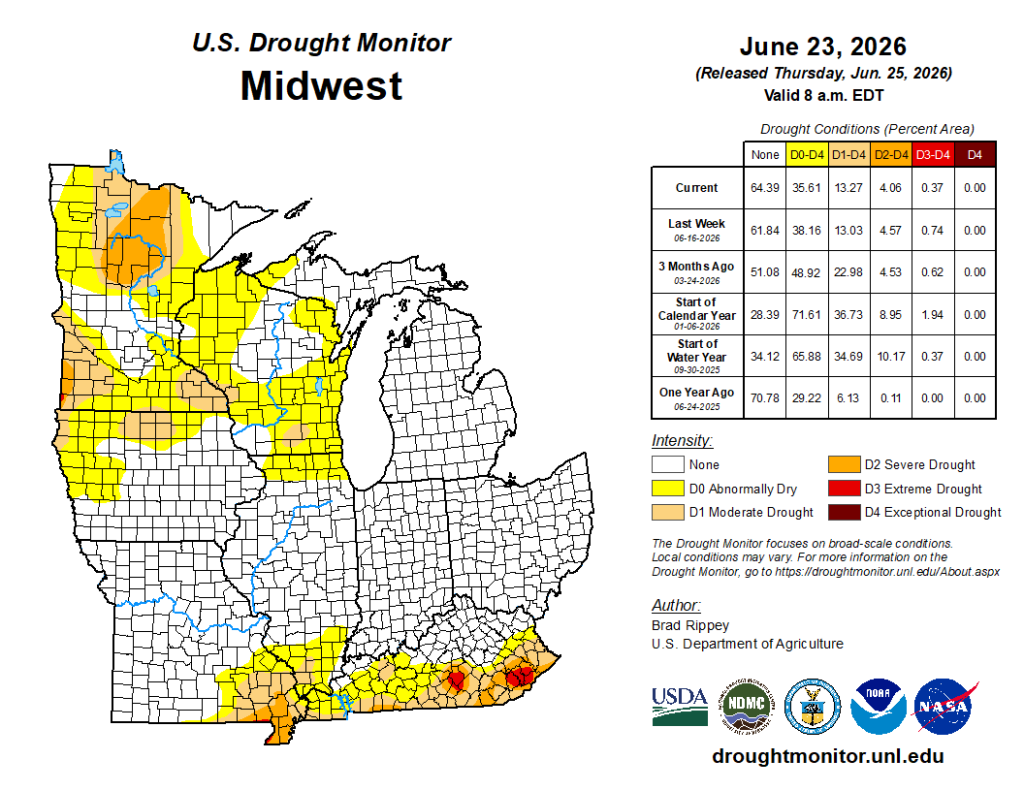
Image Description ↓
A map titled “U.S. Drought Monitor Midwest” dated “June 23, 2026 (Released Thursday, Jun. 25, 2026) Valid 8 a.m. EDT.” The map shows Midwest states with county boundaries. A legend lists drought intensity categories: None (gray), D0 Abnormally Dry (yellow), D1 Moderate Drought (tan), D2 Severe (orange), D3 Extreme (red), and D4 Exceptional (dark red).
Wisconsin is mostly gray (no drought), with areas of yellow (abnormally dry) across the north and parts of central regions. Adjacent states show more drought: Minnesota has bands of yellow and tan (D0–D1), with localized orange areas; Illinois and Indiana show mostly no drought; southern areas including parts of Missouri, Kentucky, and Tennessee show yellow to red/orange (D0–D3), indicating more intense drought.
A table on the right labeled “Drought Conditions (Percent Area)” lists current and historical percentages for categories None, D0–D4. The “Current” row shows approximately: None 64.39%, D0 35.61%, D1 13.27%, D2 4.06%, D3 0.37%, D4 0.00%. Footer includes “droughtmonitor.unl.edu,” logos (USDA, NDMC, NOAA, NASA), and author “Brad Rippey, U.S. Department of Agriculture.”
Compared to last week:
- Very minimal (<1%) change in D1-D4 coverage in the region. Drought remains most prevalent in Minnesota, Kentucky, & Missouri.
- 86.7% of the Midwest region is drought free (~13.3% in D1-D4).
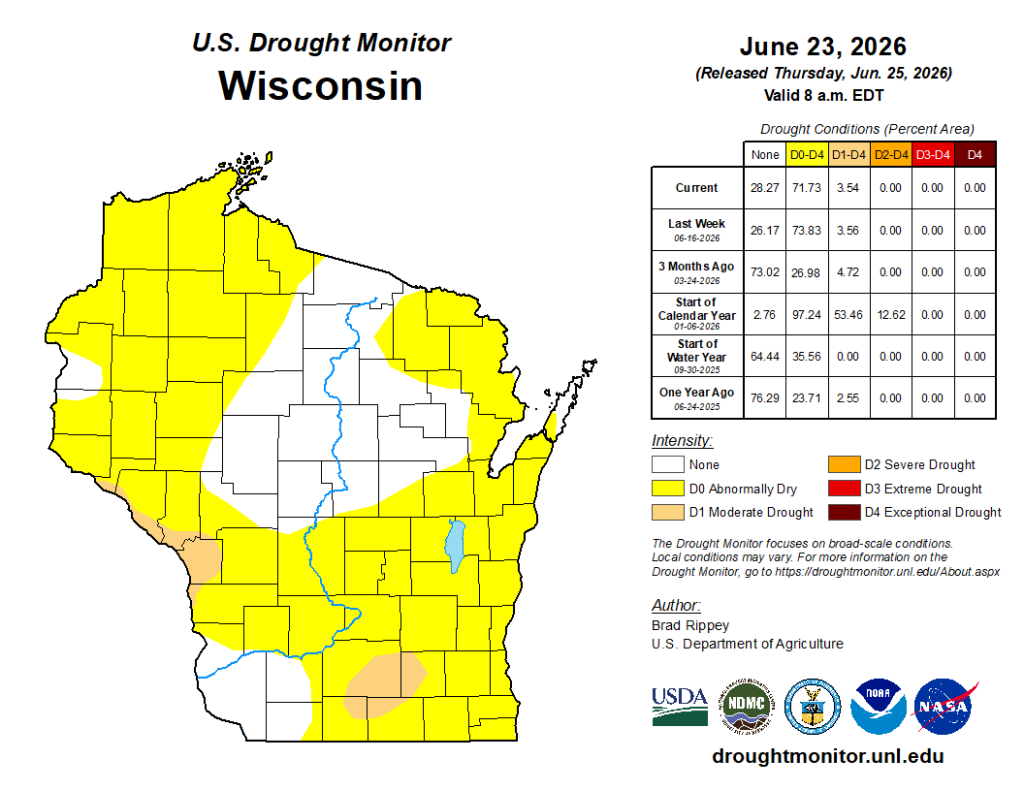
Image Description ↓
A map titled “U.S. Drought Monitor Wisconsin” dated “June 23, 2026 (Released Thursday, Jun. 25, 2026) Valid 8 a.m. EDT.” Wisconsin counties are outlined and color-coded by drought category: gray (None), yellow (D0 Abnormally Dry), tan (D1 Moderate Drought).
Most of Wisconsin is shaded yellow (D0), indicating widespread abnormally dry conditions. Central to north-central counties show a band of gray (no drought). A small tan area (D1 moderate drought) appears in south-central Wisconsin.
A table labeled “Drought Conditions (Percent Area)” shows current values: None 28.27%, D0–D4 71.73%, D1–D4 3.54%, D2–D4 0.00%, D3–D4 0.00%, D4 0.00%. Additional rows show past weeks and months for comparison.
A legend defines intensity categories (None, D0, D1, D2, D3, D4). Footer text includes “droughtmonitor.unl.edu,” logos (USDA, NDMC, NOAA, NASA), and author “Brad Rippey, U.S. Department of Agriculture.”
- Very minimal (<1%) change compared to last week. D1 drought is in place near Madison and La Crosse.
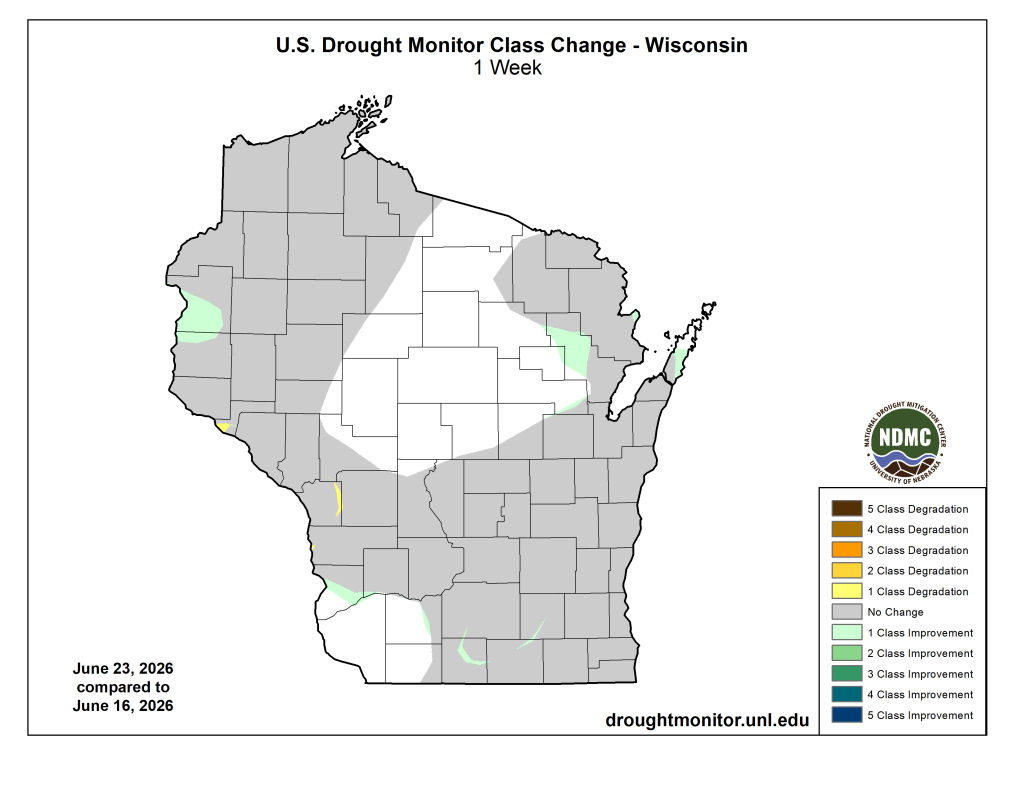
Image Description ↓
A map titled “U.S. Drought Monitor Class Change – Wisconsin, 1 Week.” Text at bottom left reads “June 23, 2026 compared to June 16, 2026.” The map shows Wisconsin counties outlined and shaded by drought category change.
Most of the state is gray, indicating no change in drought classification over the week. Small light green patches (1 class improvement) appear in parts of western, northeastern, and southern Wisconsin. A few small yellow areas (1 class degradation) appear along the southwestern border and near the far south-central region. No areas show larger multi-class improvements or degradations.
A legend on the right lists categories: 5 to 1 class degradation (brown to yellow), no change (gray), and 1 to 5 class improvement (light to dark green/blue). The NDMC (National Drought Mitigation Center) logo appears on the right, and “droughtmonitor.unl.edu” is displayed at the bottom.
U.S. Drought Monitor Time Series
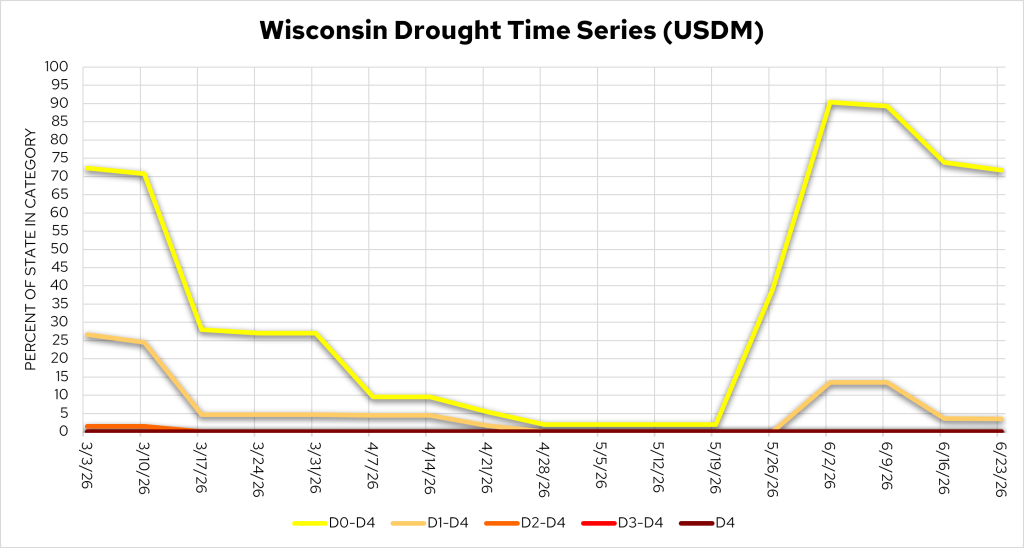
Image Description ↓
A line chart titled “Wisconsin Drought Time Series (USDM).” The y-axis reads “Percent of State in Category” from 0 to 100. The x-axis shows weekly dates from early March 2026 (3/3/26) through June 23, 2026 (6/23/26).
Five color-coded lines represent drought categories:
- Yellow (D0–D4, any dryness)
- Tan (D1–D4, moderate drought or worse)
- Orange (D2–D4)
- Red (D3–D4)
- Dark red (D4)
The yellow D0–D4 line starts near 70% in early March, drops steadily to about 25% mid-March, then to around 10% by early April, and near 0–5% by late April through mid-May. It then rises sharply in late May and June, peaking near 90% around June 2–9, and declines to about 70% by June 23.
The tan D1–D4 line follows a similar pattern at lower values: about 25% in early March, near 5% by mid-March, near 0% through April–May, increasing to around 13–14% in early June, then decreasing to about 3–5% by late June.
The orange (D2–D4), red (D3–D4), and dark red (D4) lines remain at or near 0% throughout the period, indicating minimal severe to exceptional drought.
- D0 coverage = 71.7%; D1 coverage = 3.5%
Temperature Trends
7 Day Temperatures
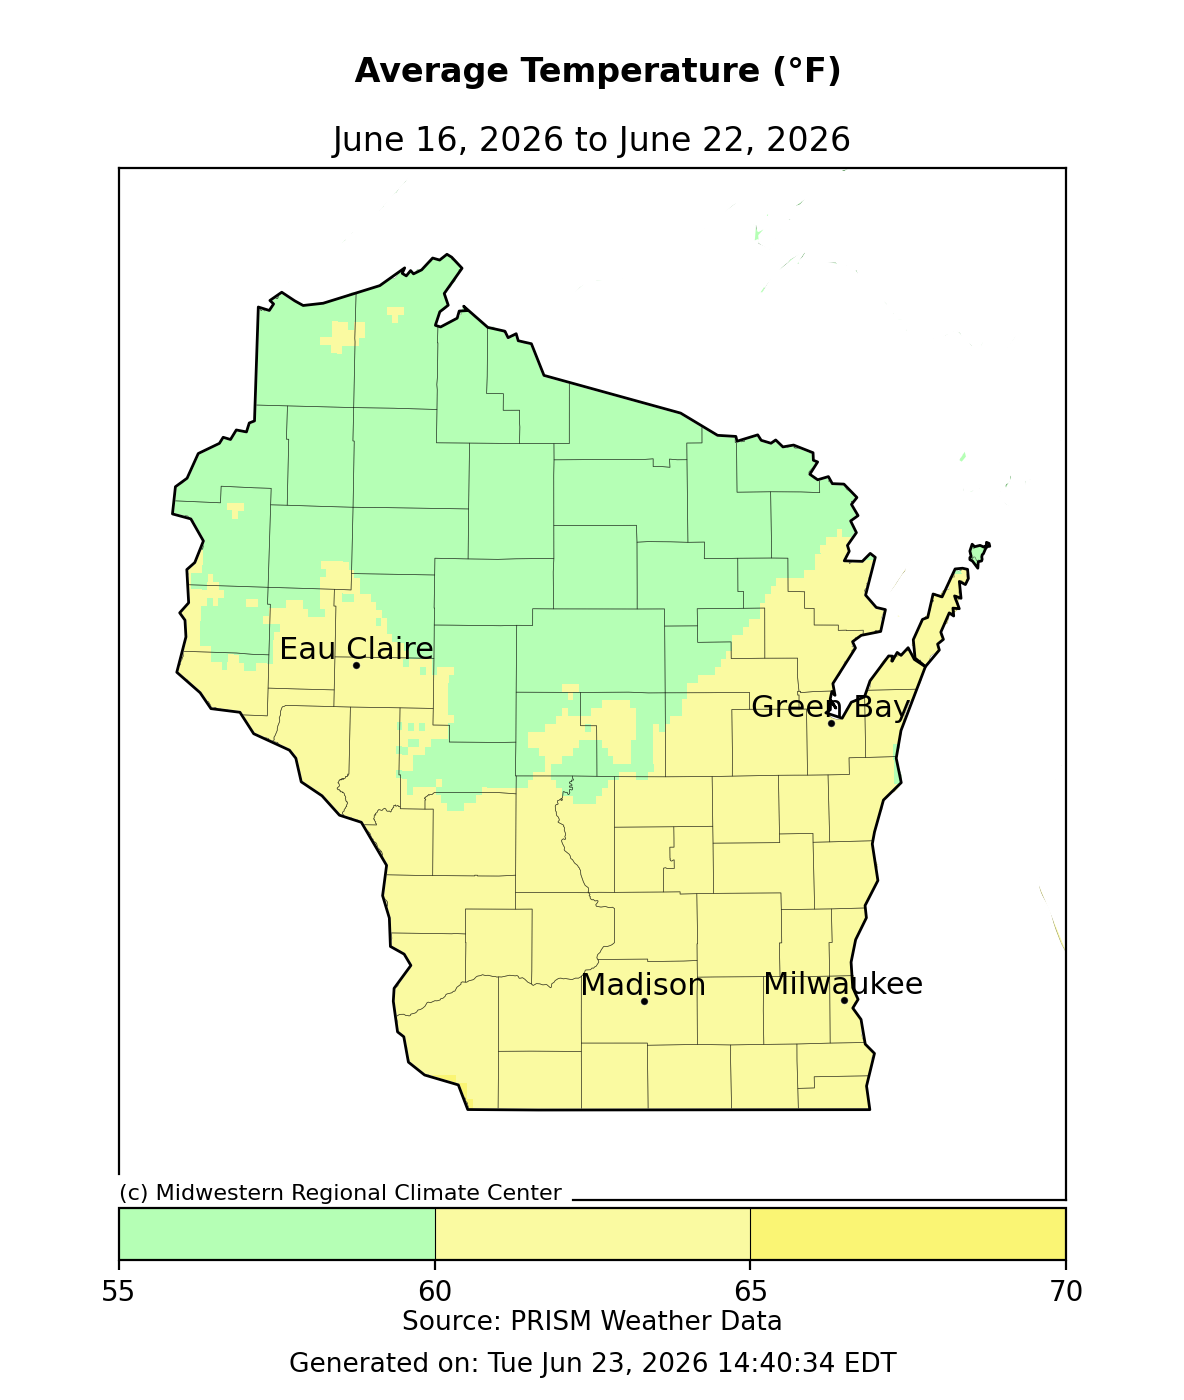
Image Description ↓
Choropleth map of Wisconsin showing average temperatures ranging from 55–70°F. Northern Wisconsin is primarily 55–60°F (mint green). Central Wisconsin shows 60–65°F (light green). Southern Wisconsin, including Madison and Milwaukee, shows 65–70°F (yellow). Eau Claire and Green Bay fall in the 60–65°F range. Source: PRISM Weather Data via Midwestern Regional Climate Center, generated June 23, 2026.
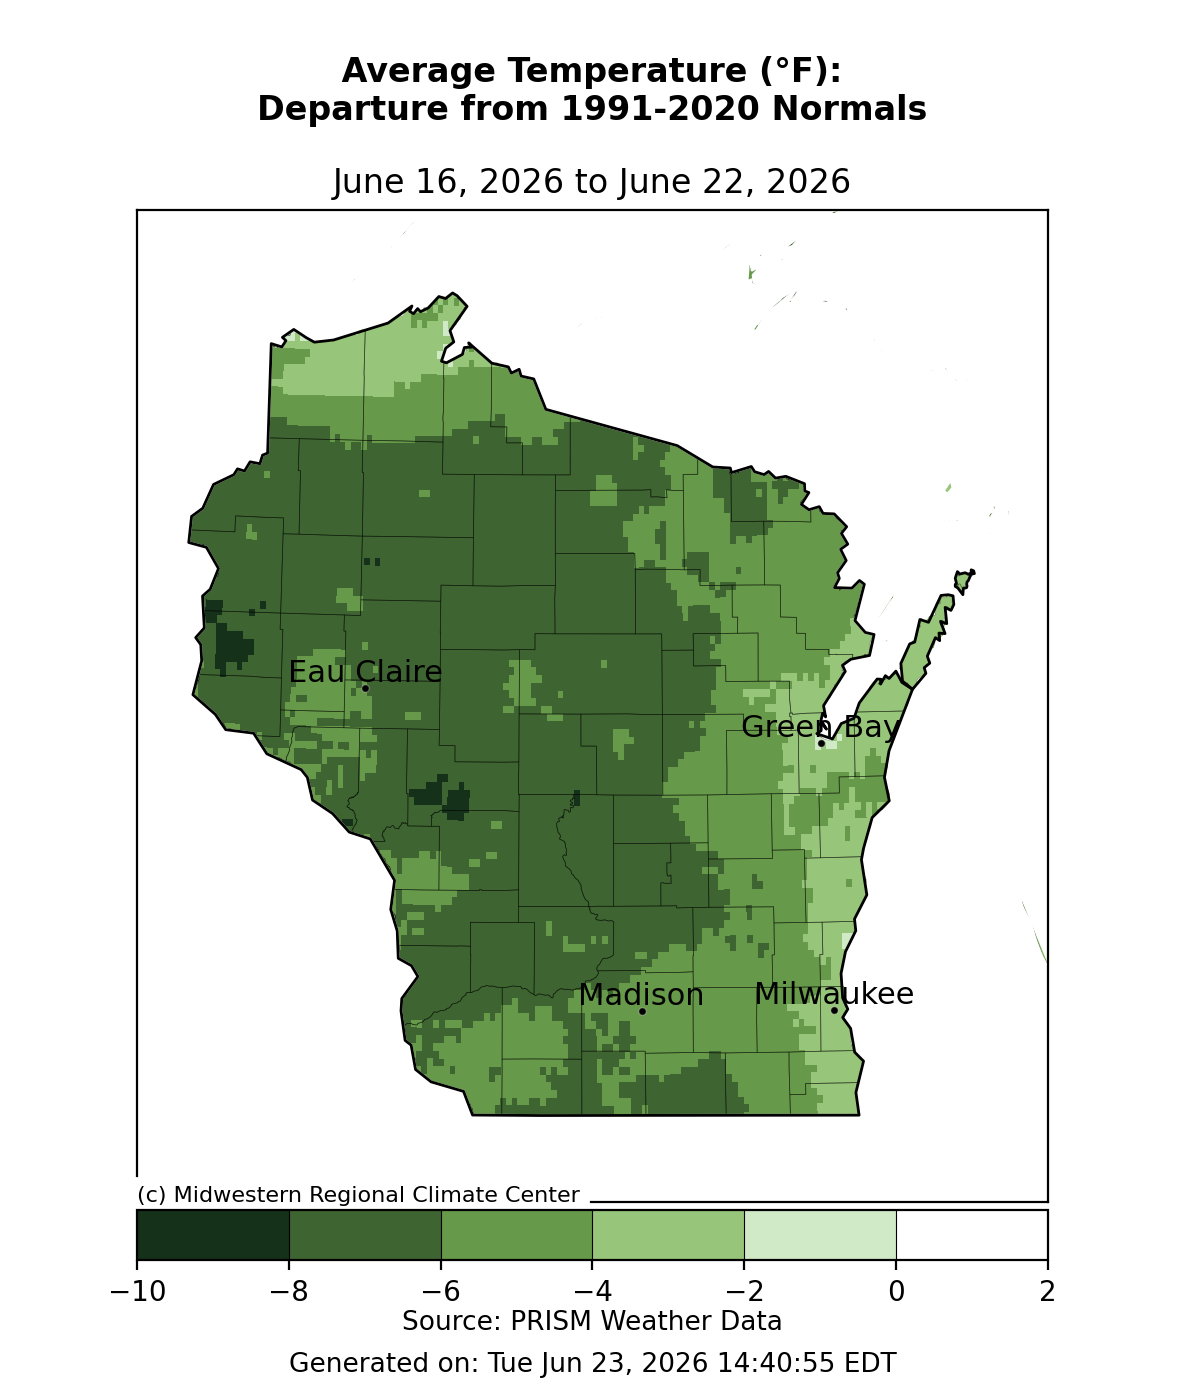
Image Description ↓
Choropleth map of Wisconsin showing average temperature departure from 1991–2020 climate normals for June 16–22, 2026, sourced from PRISM Weather Data and produced by the Midwestern Regional Climate Center. A continuous color scale ranges from dark green (−10°F) to pale green/white (+2°F). The majority of the state falls between −4°F and −8°F below normal. The coldest departures (−8 to −10°F, darkest green) are concentrated in central Wisconsin and parts of the northwest, including areas near Eau Claire. Moderate departures (−4 to −6°F) cover much of the south, including the Madison and Milwaukee areas. The northern tip and some lakeshore areas near Green Bay show the least departure, approaching −2°F or near normal. No areas show above-normal temperatures. City markers are shown for Eau Claire, Green Bay, Madison, and Milwaukee.
- Average temperatures ranged from 60-65°F in the south half of the state; to 55-60°F in the northern half.
- Temperatures were 4-8°F below normal across most of the state, with the western half of the state being the most below normal (6-8°F).
30 Day Temperatures
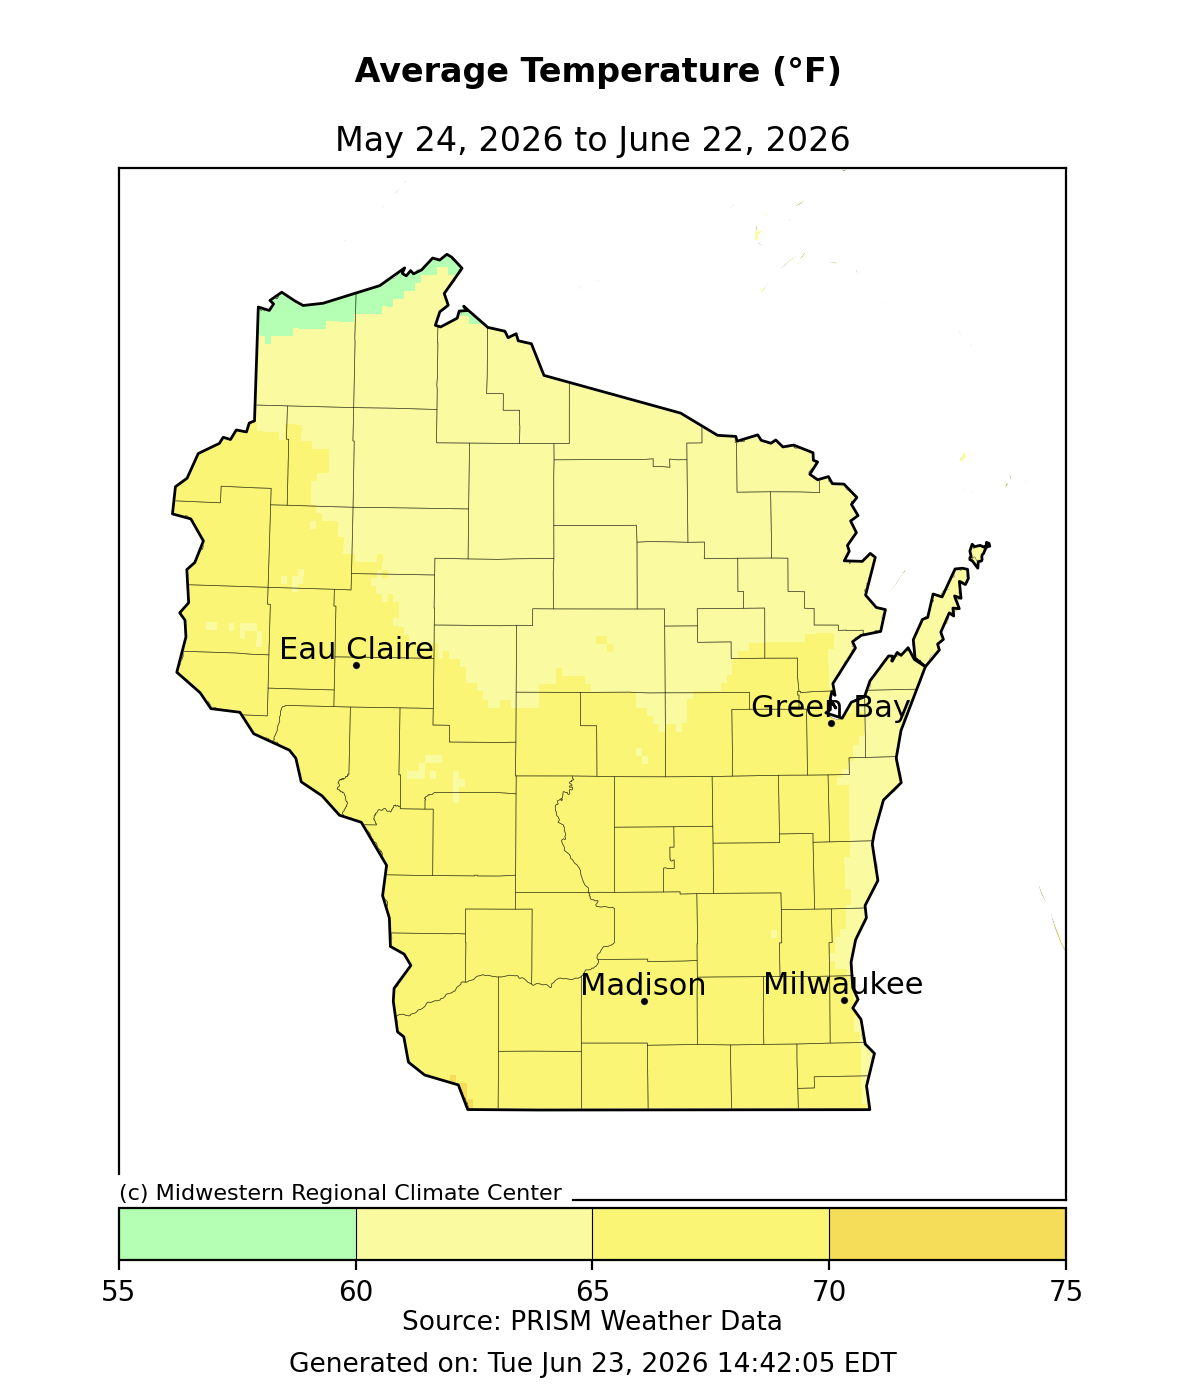
Image Description ↓
Choropleth map of Wisconsin counties showing average temperatures ranging from 55–75°F. Most of the state falls in the 60–65°F range (light yellow). The far northwest corner (Douglas County/Lake Superior shoreline) is cooler at 55–60°F (mint green). Southern counties near Madison and Milwaukee trend slightly warmer, approaching 65–70°F (yellow-gold). No counties reach 70°F or above. Cities labeled: Eau Claire, Green Bay, Madison, Milwaukee. Source: PRISM Weather Data via Midwestern Regional Climate Center, generated June 23, 2026.
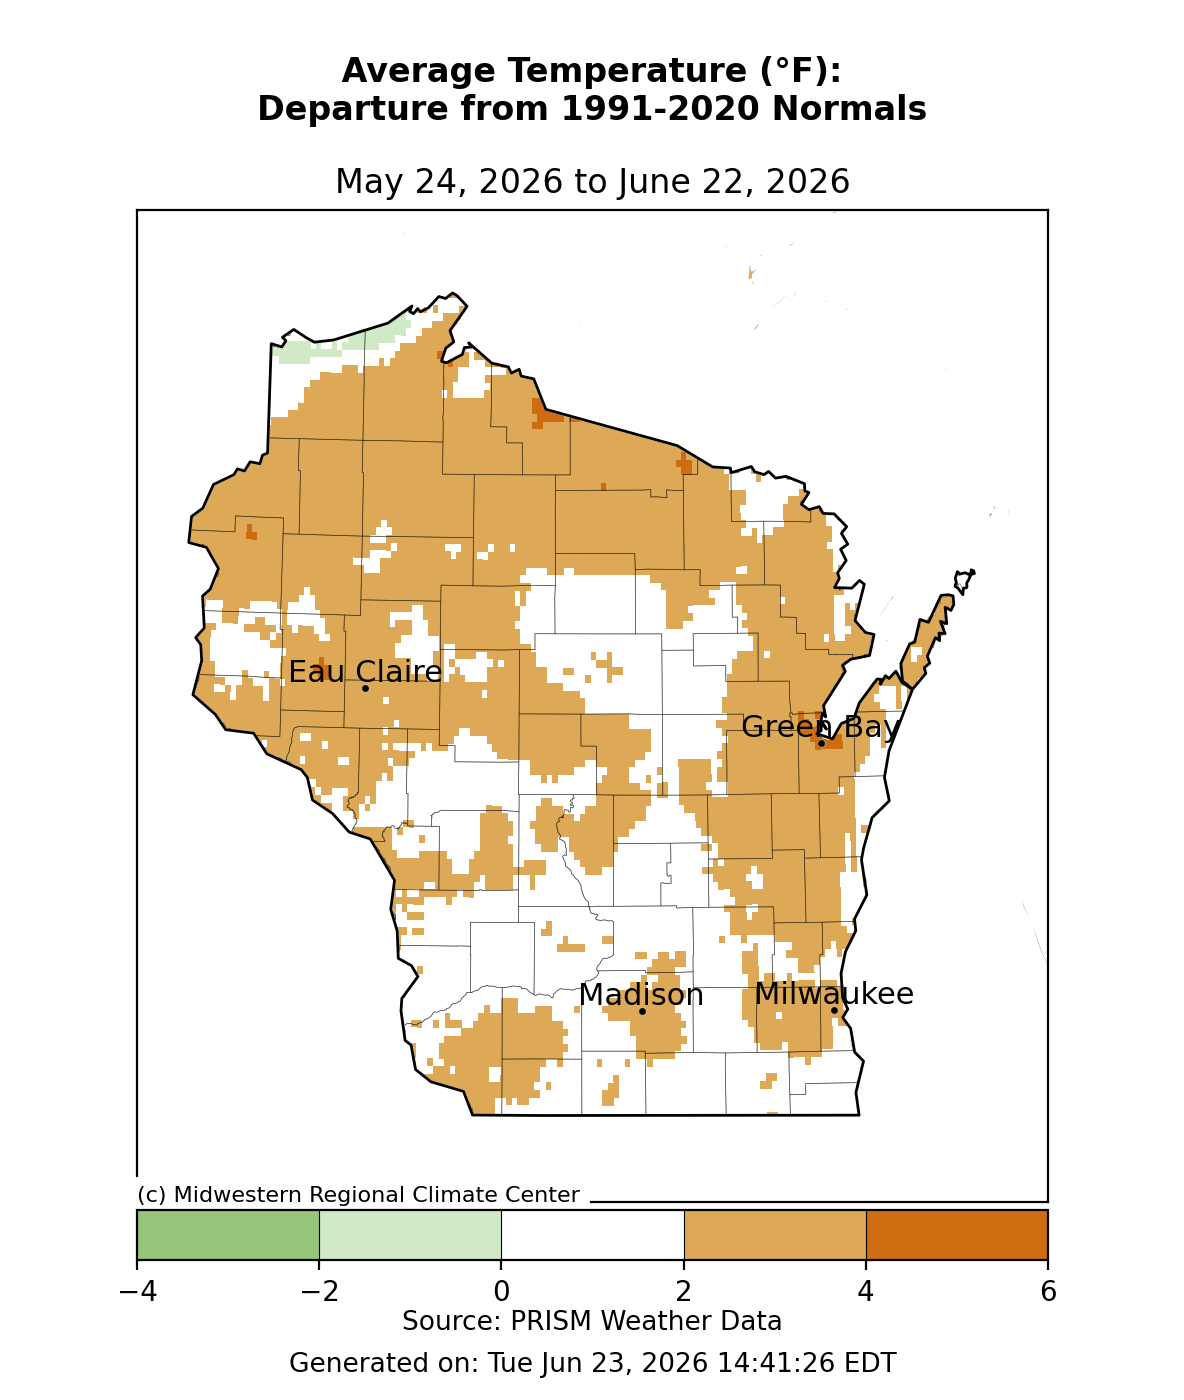
Image Description ↓
Choropleth map of Wisconsin from the Midwestern Regional Climate Center showing average temperature departure from 1991–2020 normals for the 30-day period May 24 to June 22, 2026, using PRISM weather data. Most of the state is covered in tan to dark orange shading indicating departures of +2°F to +6°F above normal. The warmest anomalies (dark orange, +4°F to +6°F) are concentrated in the northwest, northeast, and portions of the south. A large interior region spanning central Wisconsin through the Madison and Milwaukee areas shows white to light tan shading, indicating near-normal temperatures (0°F to +2°F). A small area in the far northwest corner shows light green shading, indicating a slight departure of −1°F to −2°F below normal. City markers are shown for Eau Claire, Green Bay, Madison, and Milwaukee. The color scale ranges from −4°F (dark green) to +6°F (dark orange/brown).
Growing Degree Days (Base 50°F)
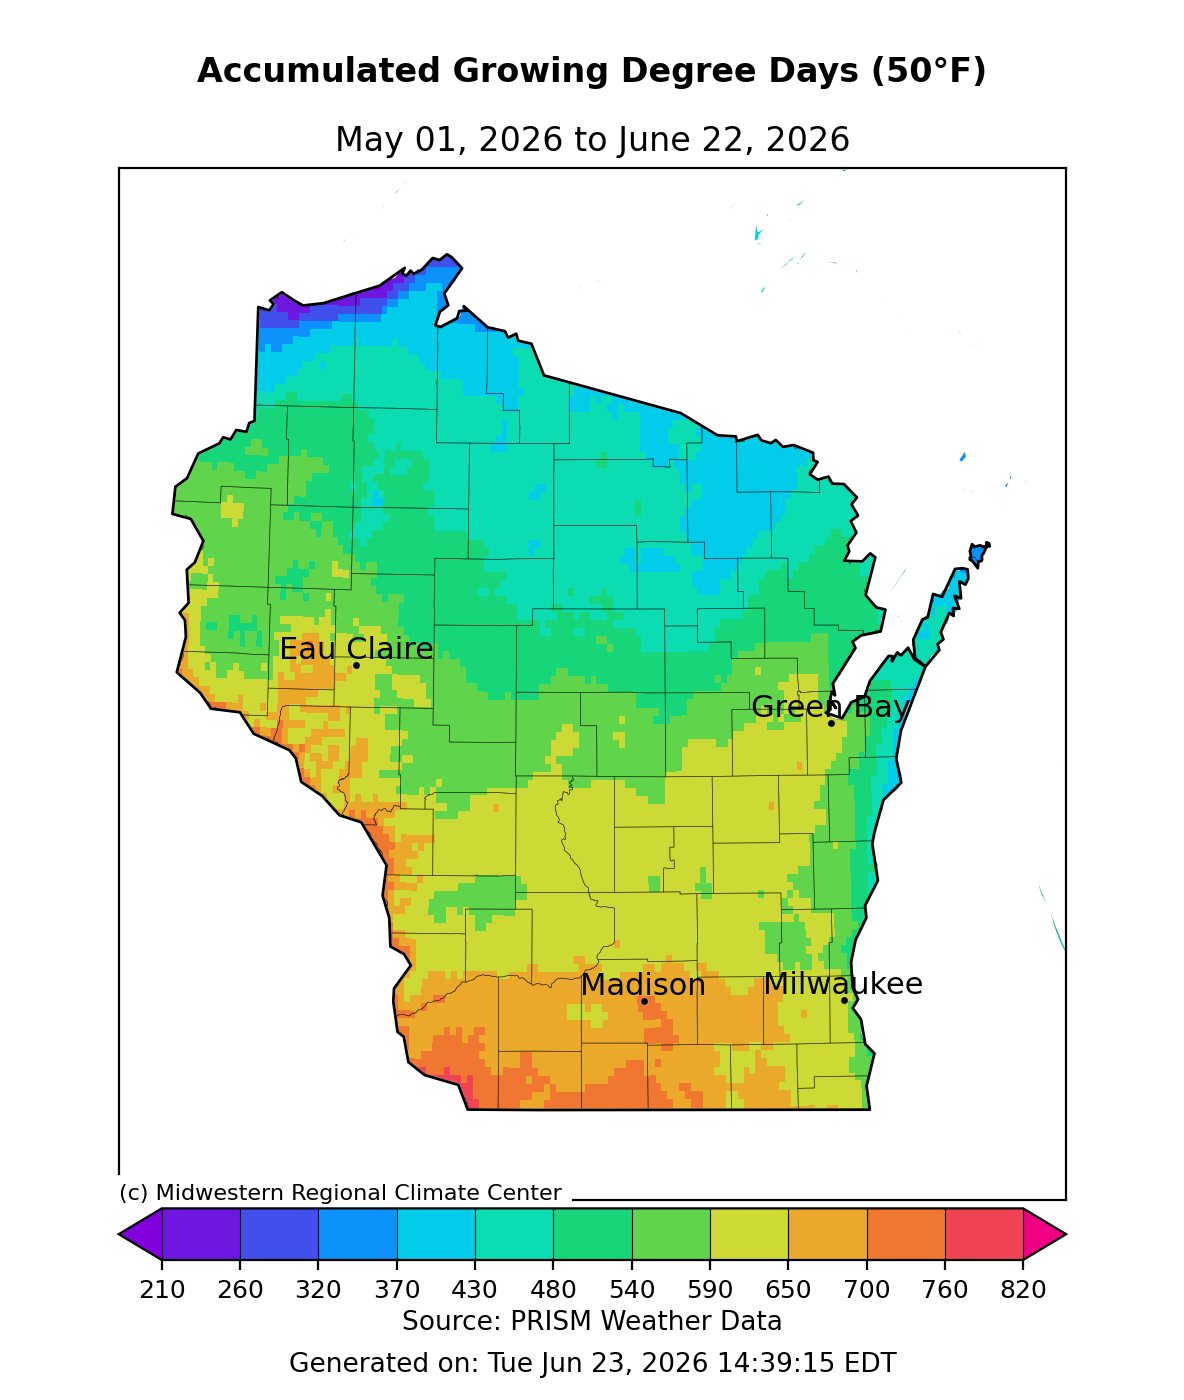
Image Description ↓
Choropleth map of Wisconsin showing accumulated growing degree days (base 50°F) from May 1 to June 22, 2026, using PRISM weather data. A continuous color scale ranges from purple/blue (210 GDD) through green and yellow to orange/pink (820 GDD). Southern Wisconsin — including Madison and Milwaukee — shows the highest accumulations (approximately 700–820 GDD), displayed in orange to red-orange. Central Wisconsin, including areas near Eau Claire, shows mid-range values of roughly 480–590 GDD in yellow-green. Northern Wisconsin shows the lowest accumulations (210–370 GDD) in blue to teal, with the far northwest being coolest. Green Bay falls in a transitional green zone of approximately 430–480 GDD. Source: Midwestern Regional Climate Center. Generated June 23, 2026.
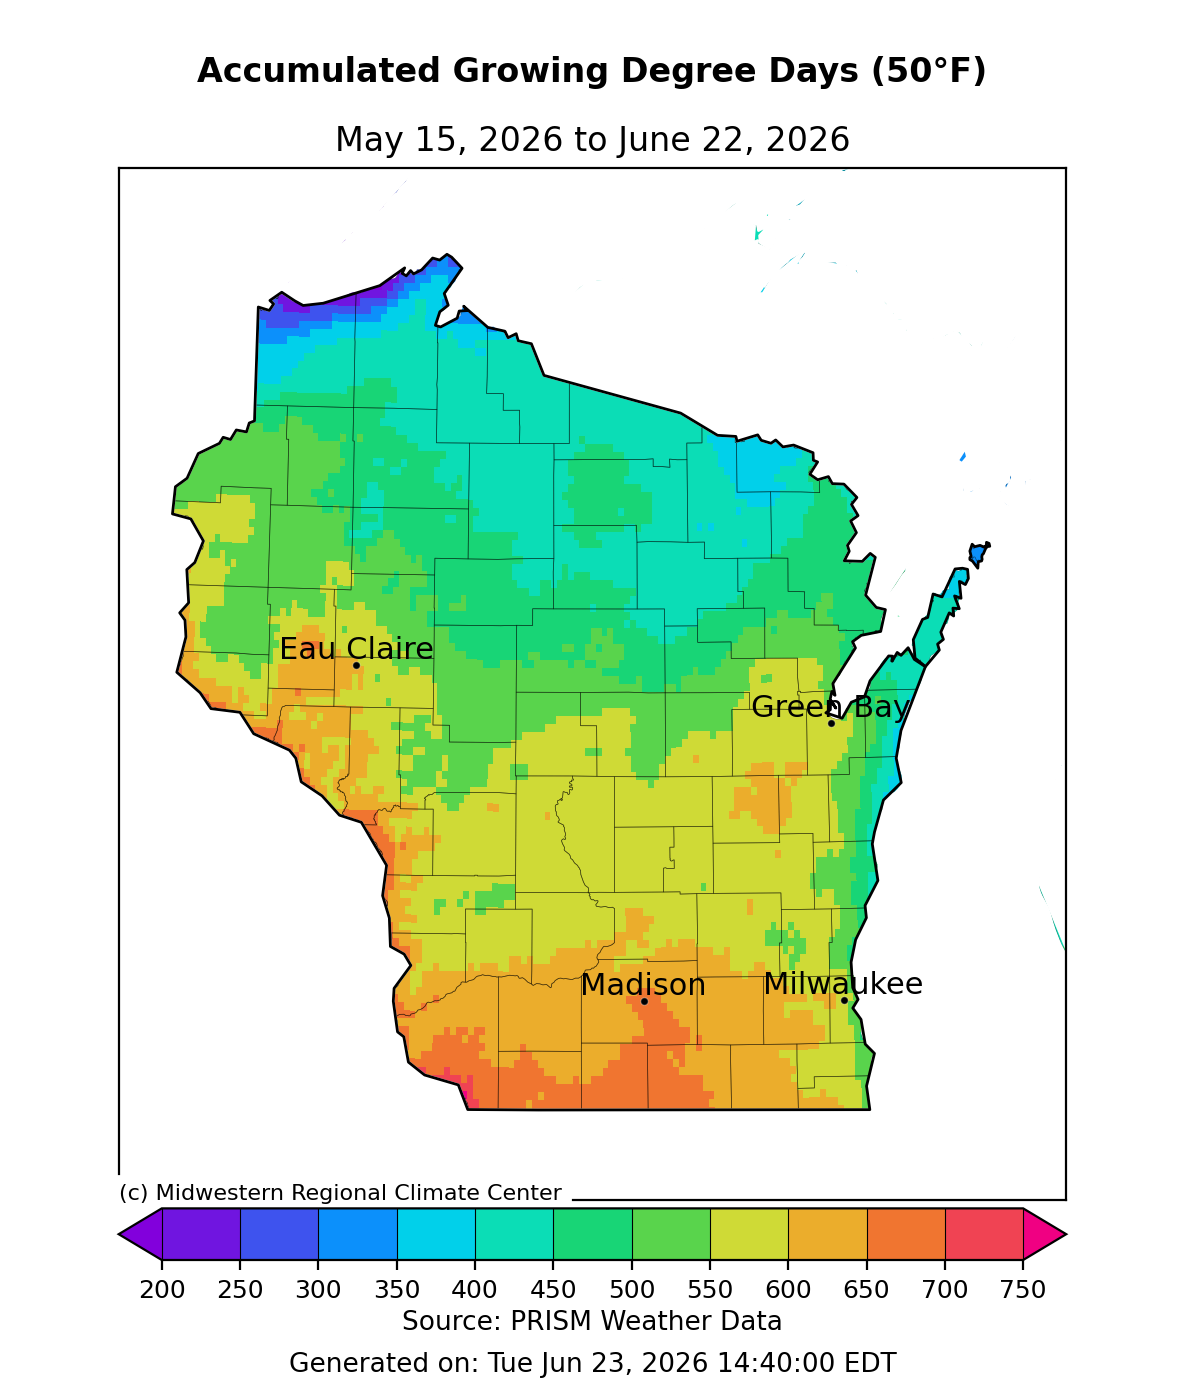
Image Description ↓
Choropleth map of Wisconsin showing accumulated growing degree days (base 50°F) from May 15 to June 22, 2026, using PRISM weather data (generated June 23, 2026). A rainbow color scale ranges from purple/blue (200–300 GDD) in the north to orange/red (650–750 GDD) in the south. Northern Wisconsin, including areas above Eau Claire, shows 200–350 GDD (purple to teal). Central Wisconsin near Eau Claire and Green Bay shows roughly 350–500 GDD (green to yellow-green). Southern Wisconsin around Madison and Milwaukee shows 550–700+ GDD (yellow-orange to orange-red), with the far southwest corner reaching the highest values near 750 GDD. Source: Midwestern Regional Climate Center.
- Starting May 1 – Growing degree day accumulation ranges from 760 GDD in the far south and west to 430 GDD in the far north. These values are 105-110% of normal.
- Starting May 15 – Growing degree day accumulation ranges from 700 GDD in the far south and west to 400 GDD in the far north. These values are 115-120% of normal.
Crop Progress and Condition
Crop Progress Report for Wisconsin for the Week Ending on June 21, 2026
*Note that USDA crop progress maps were not updated this week. However, the percentages in the bullet points below the maps are updated values.
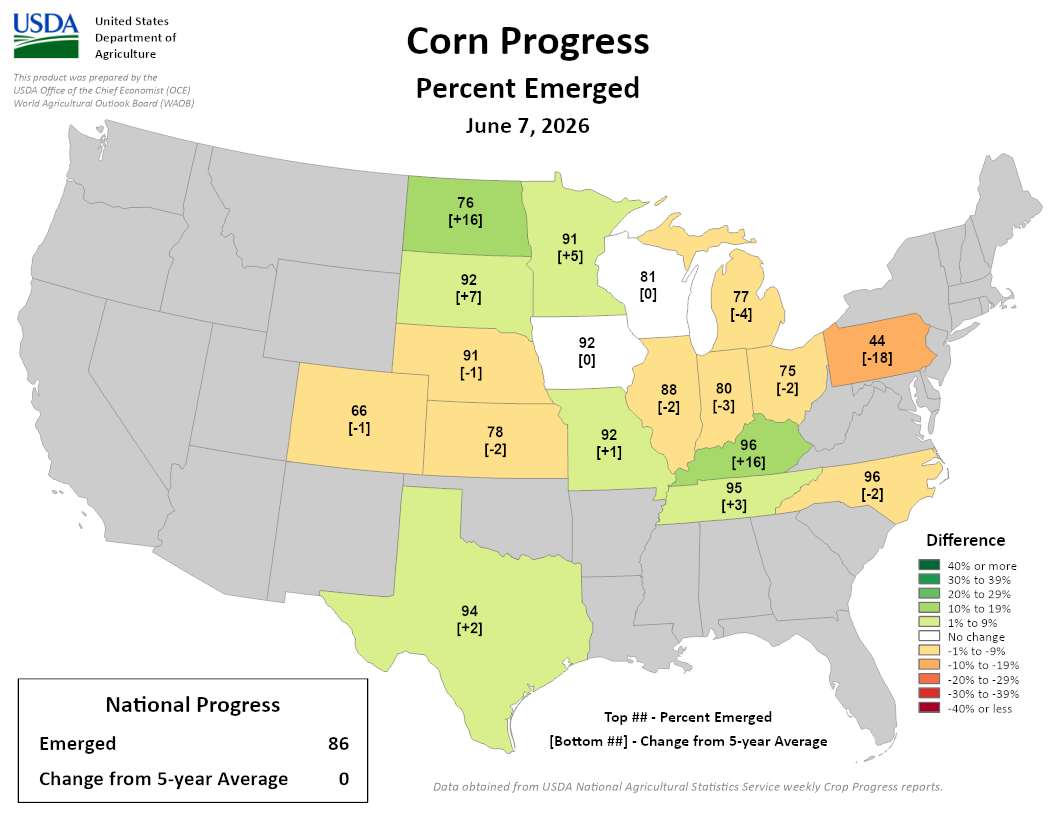
Image Description ↓
Choropleth map of US states showing corn percent emerged with change from 5-year average in brackets. North Dakota 76 [+16], Minnesota 91 [+5], South Dakota 92 [+7], Wisconsin 81 [0], Iowa 92 [0], Nebraska 91 [-1], Colorado 66 [-1], Kansas 78 [-2], Missouri 92 [+1], Illinois 88 [-2], Indiana 80 [-3], Ohio 75 [-2], Pennsylvania 44 [-18], Michigan 77 [-4], Kentucky 96 [+16], Tennessee 95 [+3], North Carolina 96 [-2], Texas 94 [+2]. Color scale ranges from dark green (40%+ above average) through light green, white (no change), to orange/red (below average).
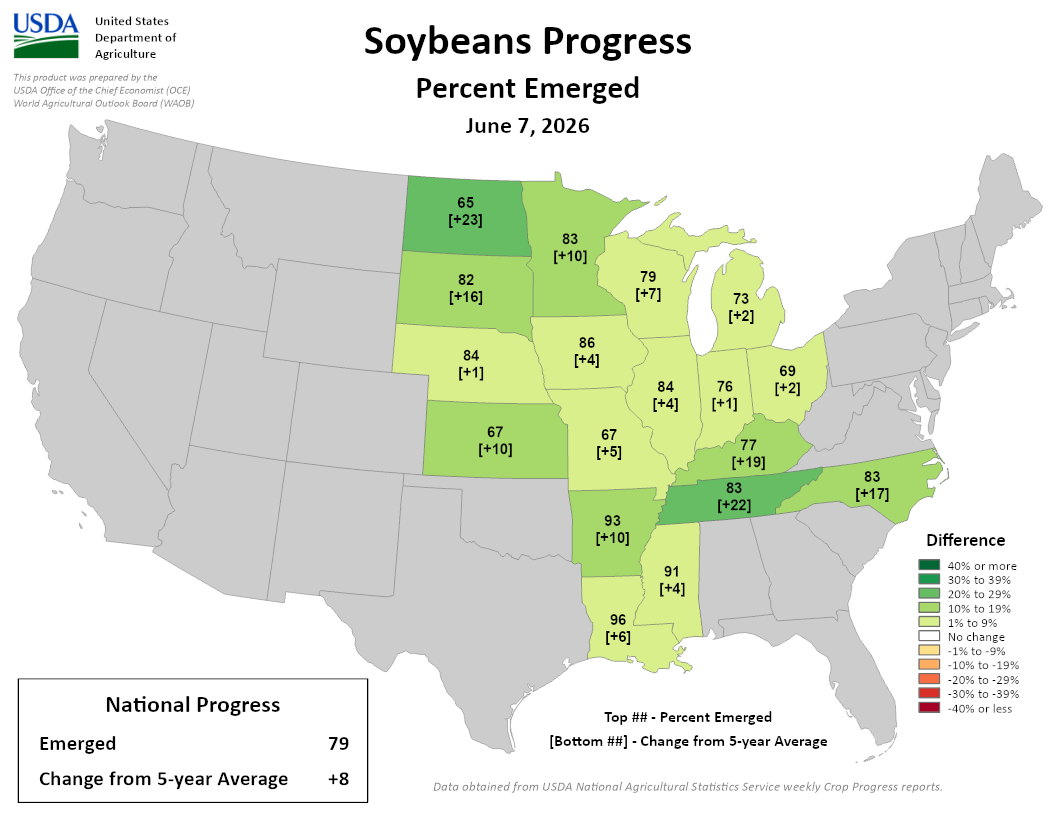
Image Description ↓
Choropleth map of central/eastern US states, shaded by deviation from 5-year average percent emerged (scale: 40%+ to -40% or less, dark green to dark red, white = no change). Each state shows percent emerged followed by change in brackets. North Dakota 65 [+23], Minnesota 83 [+10], South Dakota 82 [+16], Wisconsin 79 [+7], Michigan 73 [+2], Nebraska 84 [+1], Iowa 86 [+4], Illinois 84 [+4], Indiana 76 [+1], Ohio 69 [+2], Kansas 67 [+10], Missouri 67 [+5], Kentucky 77 [+19], North Carolina 83 [+17], Tennessee 83 [+22], Arkansas 93 [+10], Mississippi 91 [+4], Louisiana 96 [+6]. Most states are shaded light green (1-9% above average) except North Dakota (dark green, 20-29% range) and Iowa/Nebraska (very pale, near no change).
- Wisconsin had 4.3 days suitable for fieldwork statewide, which was slightly up from the previous week.
- The corn crop is 97% emerged, 3% above the five-year average.
- Soybeans are 95% emerged, 2% above the five-year average.
- Corn and soybean conditions are 81% and 79% good to excellent, respectively.
- Winter wheat is 92% headed and is rated 79% good to excellent (up 1% from last week).
- Oats are 51% headed, 4% above the five-year average. Oat condition is 82% good to excellent.
- Pasture and range were rated 66% good to excellent, down 1% from last week.
- The first cutting of alfalfa is 93% complete, and the second cutting is 11% complete.
- Read the full USDA report.
Forecasts and Outlooks
7 Day Precipitation Forecast
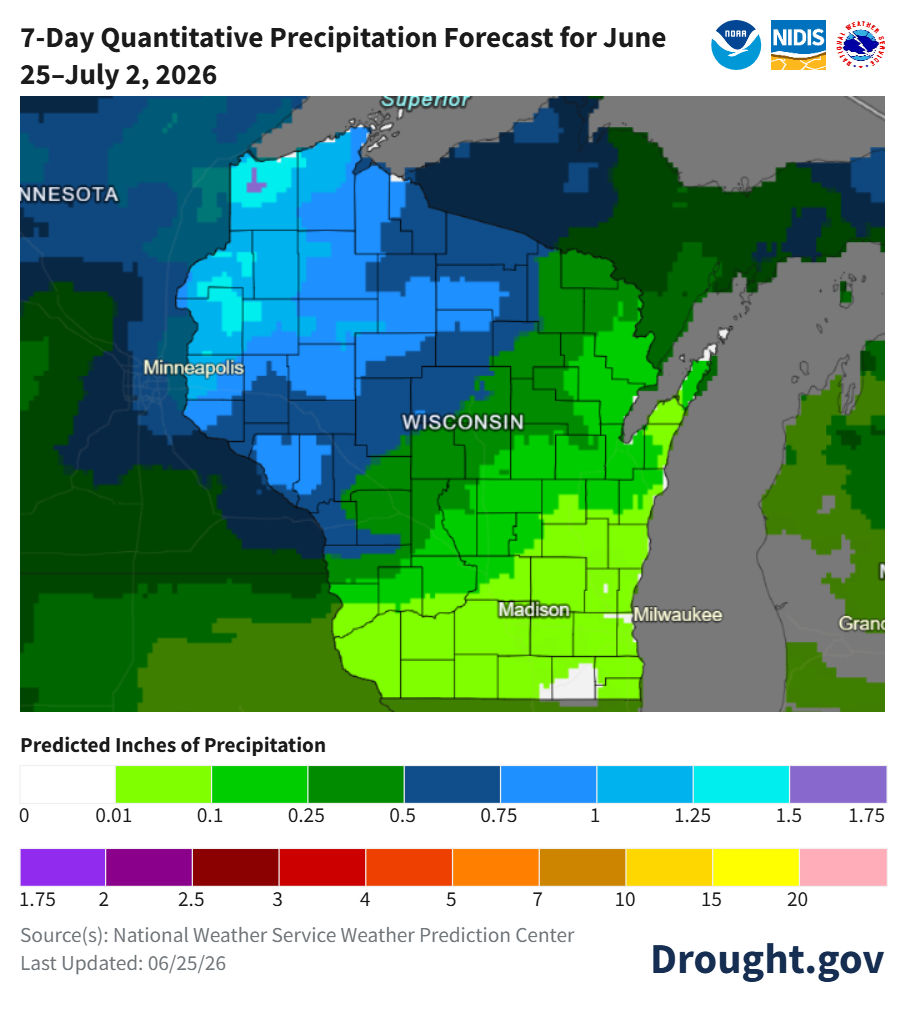
Image Description ↓
A map titled “7-Day Quantitative Precipitation Forecast for June 25–July 2, 2026” showing Wisconsin and nearby states, with NOAA, NIDIS, and National Weather Service logos at top right. Cities labeled include Minneapolis, Madison, and Milwaukee, and the state label “WISCONSIN” appears centrally.
A color legend labeled “Predicted Inches of Precipitation” ranges from 0 inches (white/gray) through greens (0.1–0.5 in), blues (0.5–1+ in), and higher totals shown in teal to purple (1.25–1.75+ in). Additional colors below indicate higher amounts beyond 2 inches (reds, oranges, yellows), though these are mostly not present over Wisconsin in this map.
Northern and northwestern Wisconsin are shaded in blues, indicating forecast totals around 0.5 to 1 inch or slightly more. Central Wisconsin shows a mix of greens and some blues (about 0.25–0.75 inches). Southern and southeastern Wisconsin, including Madison and Milwaukee, are mostly light green shades (around 0.1–0.5 inches), with small lighter areas indicating locally lower totals. Surrounding Minnesota and Lake Superior areas show similar gradients, with higher amounts north and west of Wisconsin.
- When? – Chances for rain are higher on Sunday (6/28), Tuesday (6/30), and Wednesday (7/1).
- Where? – Chances for rain are higher in the northwest, north central, and west central counties.
- Check your local forecast for details on totals and timing.
- Average precip (1991-2020) for this week: 1.05”.
8-14 Day Temperature and Precipitation Outlook
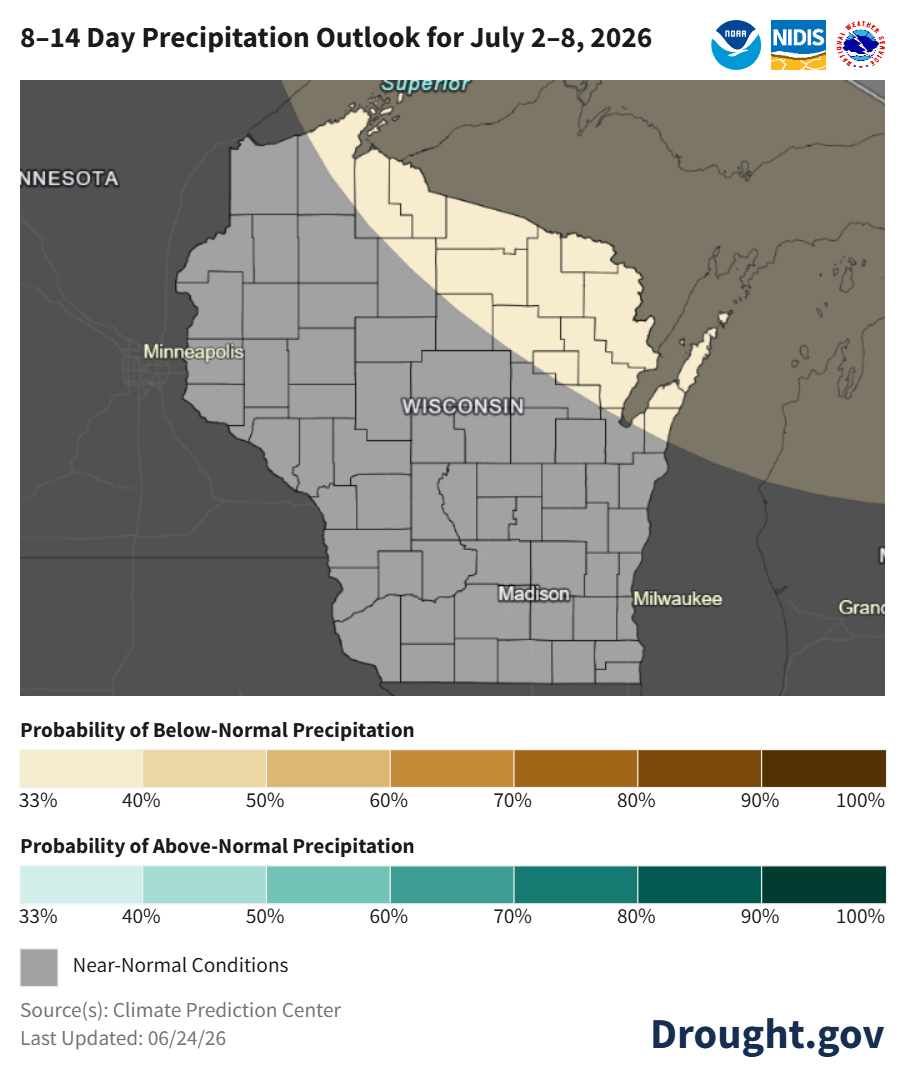
Image Description ↓
A map titled “8–14 Day Precipitation Outlook for July 2–8, 2026” covering Wisconsin and nearby states, with NOAA, NIDIS, and National Weather Service logos at the top right. Cities labeled include Minneapolis, Madison, and Milwaukee, and “WISCONSIN” appears centered.
Most of Wisconsin is shaded gray, indicating “Near-Normal Conditions.” Northern Wisconsin shows a light tan band extending from northwest to northeast, indicating a 33–50% probability of below-normal precipitation. No areas in Wisconsin show above-normal precipitation probabilities (greens or blues).
Two legends appear below the map:
“Probability of Above-Normal Precipitation” from 33% to 100% (light teal to dark green).
A gray box labeled “Near-Normal Conditions” indicates no strong tilt toward above or below normal.
“Probability of Below-Normal Precipitation” from 33% to 100% (light tan to dark brown).
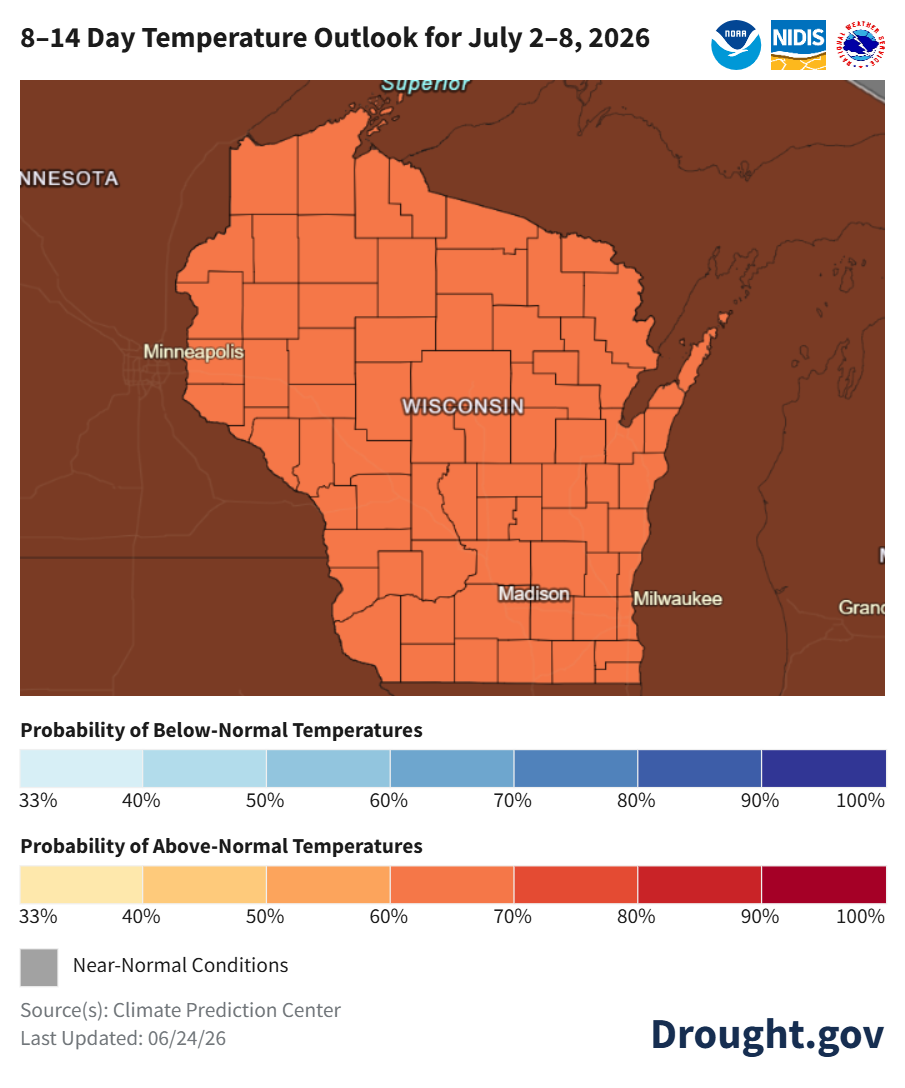
Image Description ↓
A map titled “8–14 Day Temperature Outlook for July 2–8, 2026” showing Wisconsin and surrounding states. NOAA, NIDIS, and National Weather Service logos appear at the top right. Cities labeled include Minneapolis, Madison, and Milwaukee, with “WISCONSIN” centered.
All of Wisconsin is shaded in orange tones, indicating an increased probability of above-normal temperatures. The color corresponds to approximately a 60–70% probability of above-normal temperatures based on the legend. No areas are shaded for below-normal temperatures (blues) or near-normal conditions (gray).
Two legends appear below the map:
“Probability of Above-Normal Temperatures” from 33% to 100% (tan to dark red), with Wisconsin in the orange range (~60–70%).
“Probability of Below-Normal Temperatures” from 33% to 100% (light to dark blue), not represented on the map.
- July: Uncertainty for temperature and precipitation with “equal chances” statewide. However, far northwest counties are showing a slight lean (33-40% odds) towards below normal precipitation.
- Statewide normals (1991-2020) for July 2-8 are 68.9°F and 0.94”.
30 Day Temperature and Precipitation Outlook
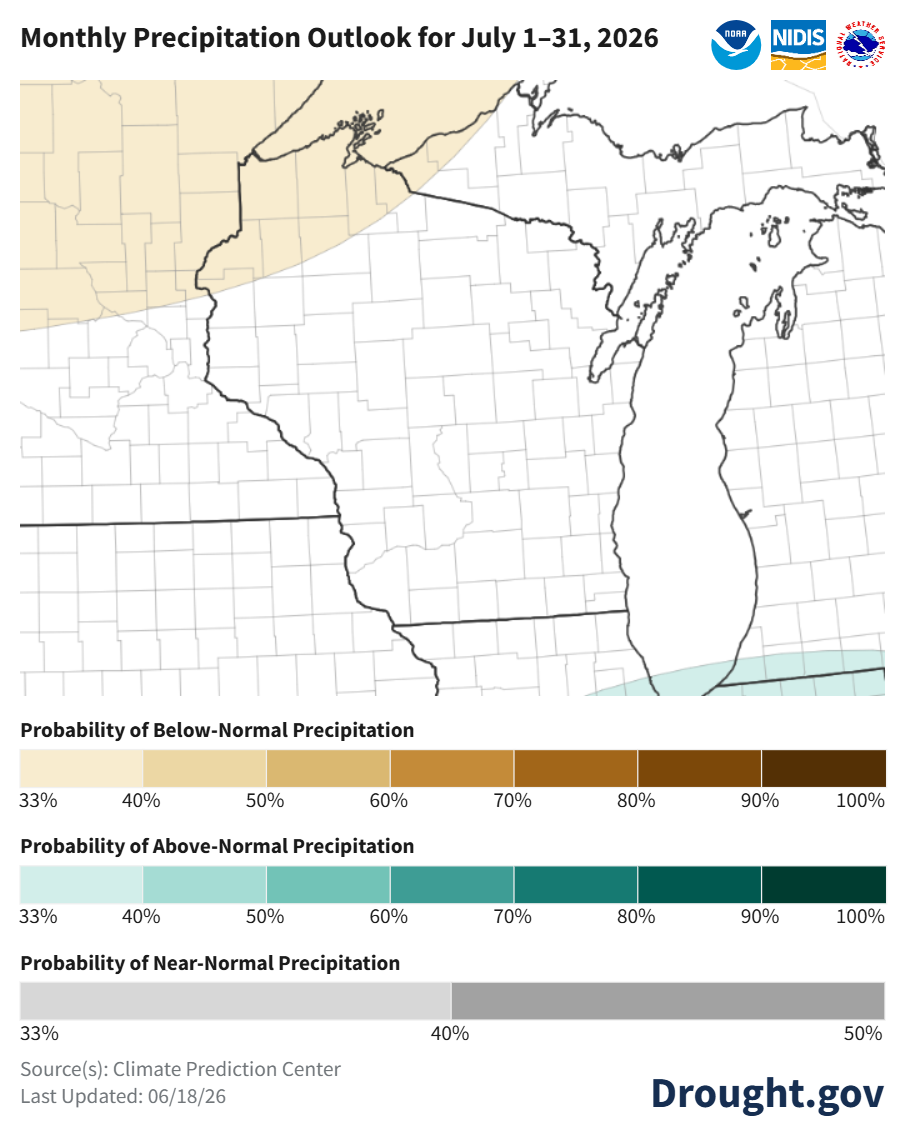
Image Description ↓
A map titled “Monthly Precipitation Outlook for July 1–31, 2026” showing Wisconsin and surrounding Midwest states. NOAA, NIDIS, and National Weather Service logos appear in the upper right. State and county boundaries are visible.
Most of Wisconsin is shaded gray, indicating “near-normal precipitation” for July. The far northern edge of Wisconsin (along Lake Superior and into Minnesota) shows a light tan area representing a 33–40% probability of below-normal precipitation. A small area at the far southern edge of the map shows light teal shading indicating a 33–40% probability of above-normal precipitation.
Legends below the map include:
“Probability of Near-Normal Precipitation” (gray, about 33%–50%).
“Probability of Below-Normal Precipitation” (tan to dark brown, 33%–100%).
“Probability of Above-Normal Precipitation” (light teal to dark green, 33%–100%).
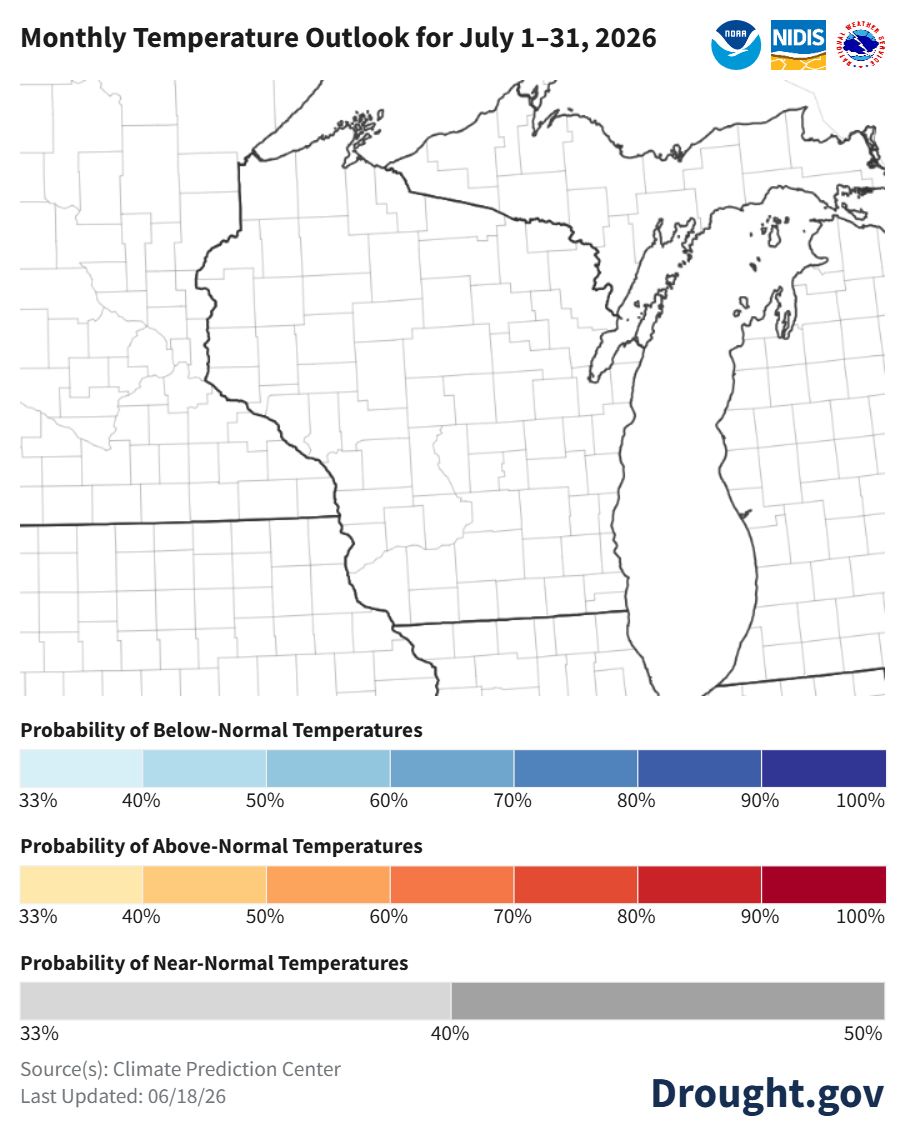
Image Description ↓
A map titled “Monthly Temperature Outlook for July 1–31, 2026” showing Wisconsin and surrounding states. NOAA, NIDIS, and National Weather Service logos appear in the upper right. State and county boundaries are visible, with Wisconsin centered.
The map is almost entirely gray across Wisconsin, indicating “near-normal temperature” conditions for July. There are no shaded areas in blue (below-normal probabilities) or orange/red (above-normal probabilities), meaning no strong tilt toward cooler or warmer-than-average conditions statewide.
Legends below the map show probability ranges:
“Probability of Near-Normal Temperatures” (gray, about 33%–50%), covering Wisconsin.
“Probability of Below-Normal Temperatures” (blue gradient, 33%–100%), not present on the map.
“Probability of Above-Normal Temperatures” (tan to dark red, 33%–100%), not present on the map.
- July: Uncertainty for temperature and precipitation with “equal chances” statewide. However, far northwest counties are showing a slight lean (33-40% odds) towards below normal precipitation.
- Statewide normals (1991-2020) for July 1-30 are 69.2°F and 4.04”.
90 Day Temperature and Precipitation Outlook
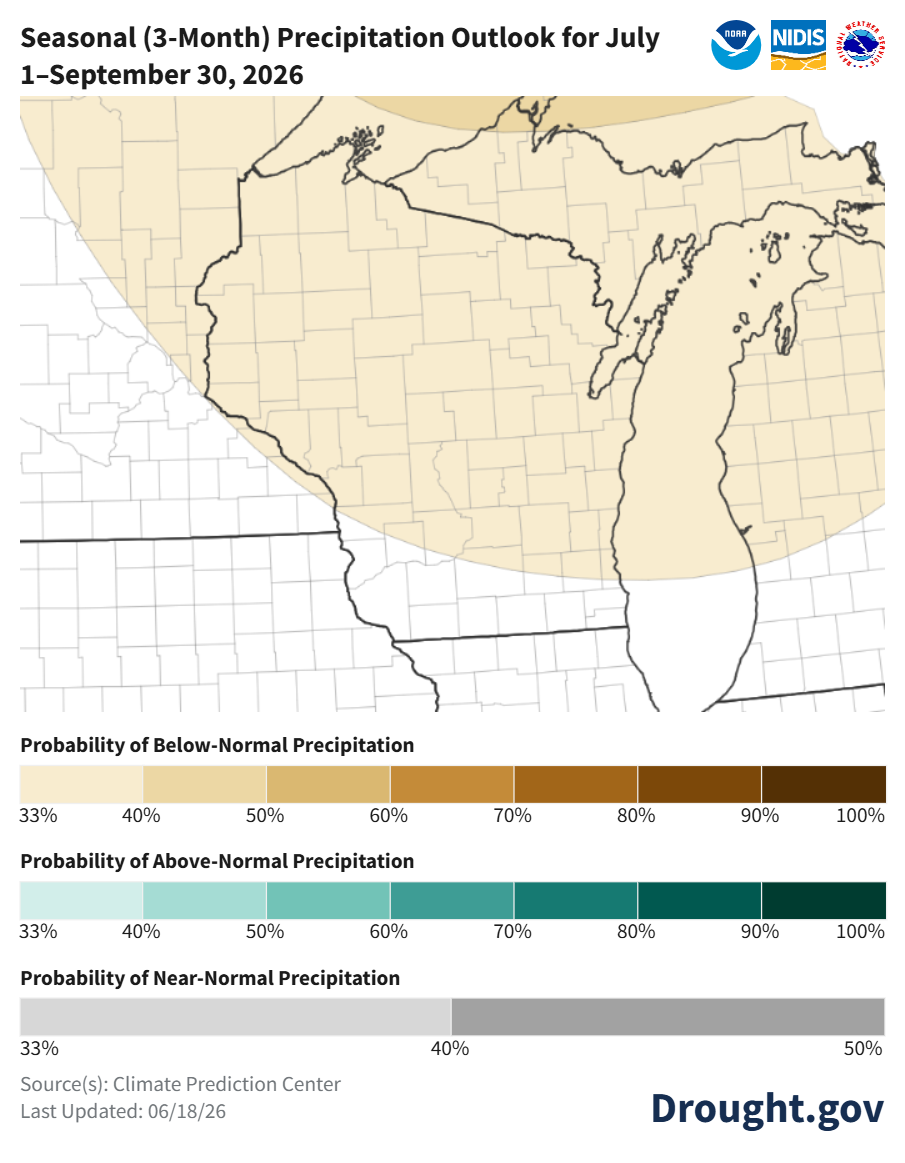
Image Description ↓
A map titled “Seasonal (3-Month) Precipitation Outlook for July 1–September 30, 2026” showing Wisconsin and surrounding Midwest states. NOAA, NIDIS, and National Weather Service logos appear in the upper right. State and county boundaries are visible, with Wisconsin centered.
Most of Wisconsin is shaded light tan, indicating a 33–40% probability of below-normal precipitation across the July–September period. The tan shading extends across northern, central, and eastern Wisconsin. The southern edge of Wisconsin and nearby regions appear gray, indicating near-normal precipitation probabilities (about 33–50%) with no strong tilt toward wetter or drier conditions.
Legends below the map include:
“Probability of Near-Normal Precipitation,” shown in gray (about 33–50%), present mainly in southern areas.
“Probability of Below-Normal Precipitation,” ranging from 33% to 100% (light tan to dark brown), with Wisconsin mainly in the lowest category (33–40%).
“Probability of Above-Normal Precipitation,” ranging from 33% to 100% (light teal to dark green), not represented over Wisconsin.
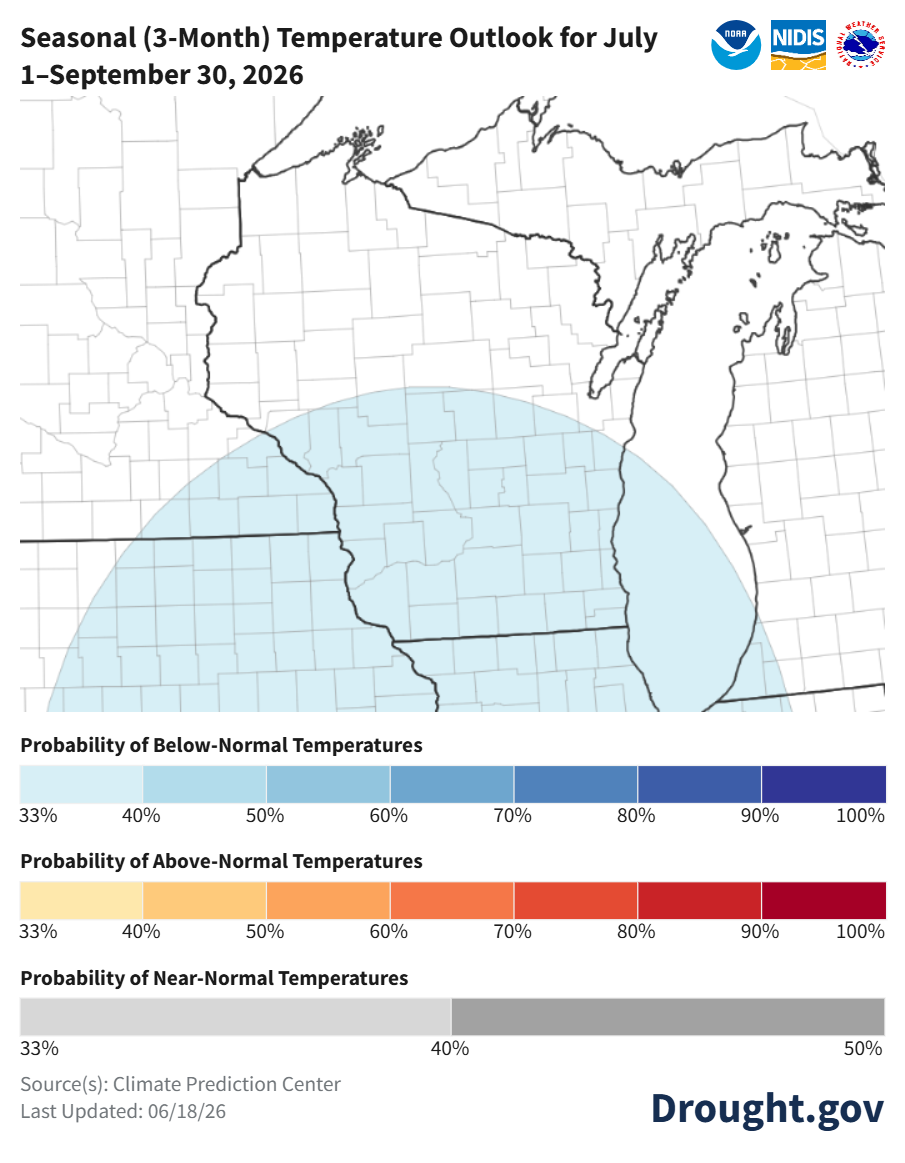
Image Description ↓
A map titled “Seasonal (3-Month) Temperature Outlook for July 1–September 30, 2026” showing Wisconsin and surrounding Midwest states. NOAA, NIDIS, and National Weather Service logos appear in the upper right. State and county boundaries are visible, with Wisconsin centered.
Southern Wisconsin is shaded light blue, indicating a 33–50% probability of below-normal temperatures during the July–September period. This cooler-than-normal signal covers much of the southern half of the state and extends into neighboring states. Northern Wisconsin appears mostly gray, indicating near-normal temperature probabilities (about 33–50%) with no strong tilt toward above- or below-normal conditions.
Legends below the map include:
“Probability of Near-Normal Temperatures” (gray, about 33%–50%), covering northern Wisconsin.
“Probability of Below-Normal Temperatures” (blue gradient, 33%–100%), with southern Wisconsin in the lowest category (33–50%).
“Probability of Above-Normal Temperatures” (tan to red gradient, 33%–100%), not represented over Wisconsin.
- July-Sept: Temperatures in southern and central counties are leaning towards below normal temperatures (33-40% odds), with uncertainty further north. Precipitation is leaning towards below normal for most of the state (33-40% odds), with uncertainty in the far south.
- Statewide normals (1991-2020) for July-Sept are 65.4°F and 11.53”.
User Survey
Are you a regular user of the Ag Weather Outlook for Wisconsin (AgWOW)? Or maybe you are viewing this page for the first time this week? Either way, we want to hear your feedback on this resource! Please take a few minutes and fill out this survey. Your feedback will help us better serve your ag-weather data needs through AgWOW.
If you have any trouble accessing or filling out the survey, please email Josh Bendorf at jbendorf@wisc.edu. Thank you!