

Weather and climate conditions this week in Wisconsin
Here are this week’s take-home points about the weather. As a reminder, AgWOW reports will be published weekly throughout the growing season. Scroll down for the full report.
Additionally, we’re collecting user feedback. Regardless of whether it’s your first time here or if you are a regular user, we’d love to hear from you!

Key Points
Recent Conditions
- Temperatures were seasonal (-/+2°F of normal) in southern and eastern counties last week. Further north and west, temperatures were typically 2-4°F above normal.
- Rainfall totals of 2” or more were common across southern Wisconsin, with locally higher amounts. Northwest counties were the driest, with totals of less than 0.5” common.
Impact
- Some Wisconet stations received 1” or more of rainfall last week and thus saw larger gains in soil moisture.
- Satellite-based soil moisture estimates indicate that conditions improved across the eastern side of the state, with Wisconsin’s worst dryness in north central and northwest counties.
- Drought coverage decreased by over 6% from last week due to improved conditions in the southeast. However, D2 coverage expanded in the far north.
- Soybean bloom and corn silking are both near completion, with slight decreases in crop condition compared to last week. Pasture and range conditions also declined from last week’s report.
Outlook
- Rain chances over the next seven days are highest in the southern counties, with lesser chances to the north.
- The mid August outlook indicates below-normal temperatures in the east and north, with precipitation leaning slightly towards above normal statewide.
- The outlook for August indicates uncertainty about temperatures and precipitation across most of Wisconsin. Southern counties have a slightly higher probability of being warmer than normal.
- The outlook for late summer through mid-fall (Aug.-Oct.) indicates a slight leaning towards below normal precipitation. Below normal precipitation is a bit more likely in the far north.
Agronomic, Fruit, and Vegetable Considerations
Field Conditions
- Much of the state received needed precipitation last week, giving crops a much-needed boost; however, many areas remain short on moisture.
Forage Management
- Third crop hay is being harvested in northern areas of the state. Consider using a PEAQ (Predictive Equations for Alfalfa Quality) stick to estimate relative feed value as you decide when to make each cut.
- Scout for potato leafhopper in alfalfa fields. Watch for hopper burn.
- Read about managing mycotoxins in silage corn mid-season to produce a clean silage crop. Silage season is quickly approaching.
Pest Management
- Scout fields to note what weed species are emerging or have escaped herbicide application.
- Western bean cutworm trapping has begun for the season. Check DATCP trap catches. Scout for egg masses and small larvae on corn. Scout any field that is 90-95% tasseled.
- Scout sweet corn for corn earworm.
- Scout for Japanese beetles.
- Check for silk clipping caused by corn rootworm adults. In general, there is no need to spray adults unless major pollination problems occur.
- Now is the ideal time to scout for soybean aphid by checking the undersides of the newest trifoliates.
- Tar spot has been located in Wisconsin. Have a plan if your crop needs fungicide. Learn more about using Disease Forecasting Tools.
- Southern rust has been located on Wisconsin corn. Learn about scouting for this disease.
- Red crown rot was confirmed in WI last year. Know what to scout for in your soybean fields this year.
- Fall armyworm trapping has begun.
Manure Applications
- Reminder of Wisconsin’s NR 151 Runoff Rules with the timing of manure spreading and current runoff levels. Check DATCP Runoff Risk Advisory Forecast.
Small Grains
- Small grain harvest is underway in Southern WI. Review harvest, storage and nutrient removal topics.
- As you harvest, remember the importance of combine cleaning.
- After small grain harvest is the perfect time to plant cover crops. Review species options.
- If you are planting winter wheat this fall, consider revisiting Small Grains Recommendations and Row Width and Seeding Rates in WI.
Fruit Considerations – General
- Several grape varieties (Frontenac, Marquette) have hit veraison in the last week or so. This may translate to increased bird and disease pressure (sour/bunch rot).
- Sanitation: remove and destroy (chop/compost) fallen fruit ~weekly to prevent any internally developing larvae from reaching maturity, and to limit the spread of disease.
- Apple and grape growers can reference the NEWA weather station network to monitor for disease infection periods in their area. Check out your nearest weather station: NEWA Weather Station Network (Cornell).
- Wisconsin fruit growers can reference the Midwest Fruit Pest Management Guide for a list of registered products and recommended best practices. View the MFPMG Online.
Fruit Considerations – Disease
- Warm and rainy weather conditions are ideal for bitter rot in apple orchards; see the article on bitter rot management from the July 4 WI Fruit newsletter.
- Black rot fruit symptoms continue to be reported in vineyards around WI. Review this 2022 article by Dr. Leslie Holland on Fruit and Cluster Rots for more information on black rot management.
- Sooty blotch and flyspeck has been observed in Southern WI, pushed along by warm, humid conditions. Continue monitoring NEWA models.
Fruit Considerations – Insects
- Apple growers should continue monitoring degree-day (base 50℉) accumulation for Codling moth.
- Japanese beetle pressure has lessened in Southern WI, though emergence may continue through September. Review best monitoring and management practices here: Japanese beetle.
- Apple maggot pressure is variable across the state. Growers should continue to use red sphere traps to monitor populations.
- Grape and berry growers monitoring spotted wing drosophila should continue checking and refreshing traps weekly.
- Check out the WI DATCP Orchard Insect Pest Bulletin for more information on current insect trap captures across the state.
- Overview of grape insect/mite monitoring and management: Grape Insects and Mite Pests, 2024 Field Season (Cornell, 2024).
Vegetable Considerations – Disease
- Cucurbit downy mildew has been confirmed on cucumber in northeastern Indiana. Spores from clade 2 which infect cucumber and melons have been detected in MI although there are no confirmed field infections. Cases have been relatively low overall this year, but be on the lookout for symptoms while scouting for other diseases. Symptoms start as angular, vein bound yellow to pale green spots on the upper leaf surface. As the disease progresses, the lesions turn brown and grow together leading to browning of entire leaves. Under humid conditions a dark purplish-grey fuzz may form on the underside of leaves.
- Angular leaf spot can be confused with downy mildew as lesions are tan and vein bound. As the disease progresses, the lesions become white and papery and fall off the leaves causing irregularly shaped holes. Leaf wetness can lead to bacterial ooze, a milky substance, on the underside of leaves. If you need help with id, please send photos or samples to the Plant Disease Diagnostic Clinic.
- Continue scouting for powdery mildew. Focus on the underside of leaves and leaves that are shaded. Look for the characteristic white talcum-like colonies. Management includes growing resistant varieties, fungicides, and biologically based products. Michigan State University conducted trials last season on recommendations for both fungicides and biologically based products. Results can be found here
- Phytophthora crown and fruit rot can infect cucurbits, solanaceous crops (tomato, eggplant, pepper), and to a lesser extent legumes. It causes irregular brown spots on leaves. On vines, lesions are dark and water soaked and can girdle the stem causing wilt and plant collapse. Fruit most often rots on the underside in contact with the ground. Controls options include mulching with straw to prevent splash, disinfecting tools, destroying infected debris and fungicides. Phytophthora is known for developing resistance so rotate modes of action.
- Potato black leg and aerial stem rot have been increasing in fields across WI over the last week. Symptoms include chlorosis, wilting, and darkened, slimy stems. This disease can be spread during harvest. Delaying harvest until skin is set completely can help prevent bruising and reduce the risk. Other management options include avoiding over irrigation and over fertilization
- Preventative fungicide applications for early blight in potato are recommended for all fields in WI. Preventative measures allow for the most successful management. Guidance on fungicide options can be found here.
- Preventative fungicide applications for late blight of potato are recommended for most potato production areas with the exception of Arlington and northern-most later season plantings. Check disease severity values for your area to help with management decisions.
- Scout table beets for symptoms of Rhizomania including yellowing and wilting of leaves, patchy field decline and hairy roots. This disease was first confirmed in WI in 2025. Disease development is favored by wet soil conditions and moderate temperatures.
- Tomato early blight symptoms first appear on lower leaves and stems as circular brown spots. As lesions expand, they develop the characteristic bulls-eye pattern of concentric rings. The best control measure is prevention. Once symptoms appear, it can be difficult to control. Removing infected plants can help slow the spread. Fungicides must be applied very early, either before disease occurs or at first symptoms, to be effective. More management options
Vegetable Considerations – Insects
- The second generation of adult Colorado potato beetles are now active across most of the state. If control of the 1st generation was successful, the 2nd generation population may be low or slow to appear. If this is the case, new insecticide applications should be delayed until new defoliation reaches 3-5%. In depth management info
- Potato leafhopper populations are increasing in central and northern WI as alfalfa is cut. Both larvae and adults feed on susceptible crops (beans, eggplant, potatoes, strawberries). The first signs are leaf veins turning pale and leaf curling. As feeding continues, leaves will have the characteristic hopper burn or browning of leaf tips. Management options
- Cabbage looper risk is high in central, and western WI. Scout for single white eggs and larvae on the underside of lower leaves. Loopers can burrow several layers into cabbage heads so look for frass (droppings to indicate their presence). Diamondback moth and imported cabbageworm larvae will also be present. Behavioral differences can help distinguish between them. Diamondback larvae thrash around when disturbed while cabbageworms remain still. Loopers move with the middle section of their body arched in the air.
- Western bean cutworm activity is now decreasing in southern and central WI. Continue scouting for egg masses in the north. Scout twenty consecutive plants in 5 different areas across the field. Look for egg masses on the upper surfaces of new leaves and unfurled leaves above and below the ear zone. Management options
- Corn earworm, also known as tomato fruit worm, is starting to arrive in WI. Check the DATCP trap network for counts in your area. Larvae range in color from olive-brown to maroon to black with yellow heads. Id can be tricky as larvae can look similar. This article from Purdue can help with ID. Management options
Dive deeper into each report section by clicking a topic below.
Precipitation Trends
7 Day Precipitation
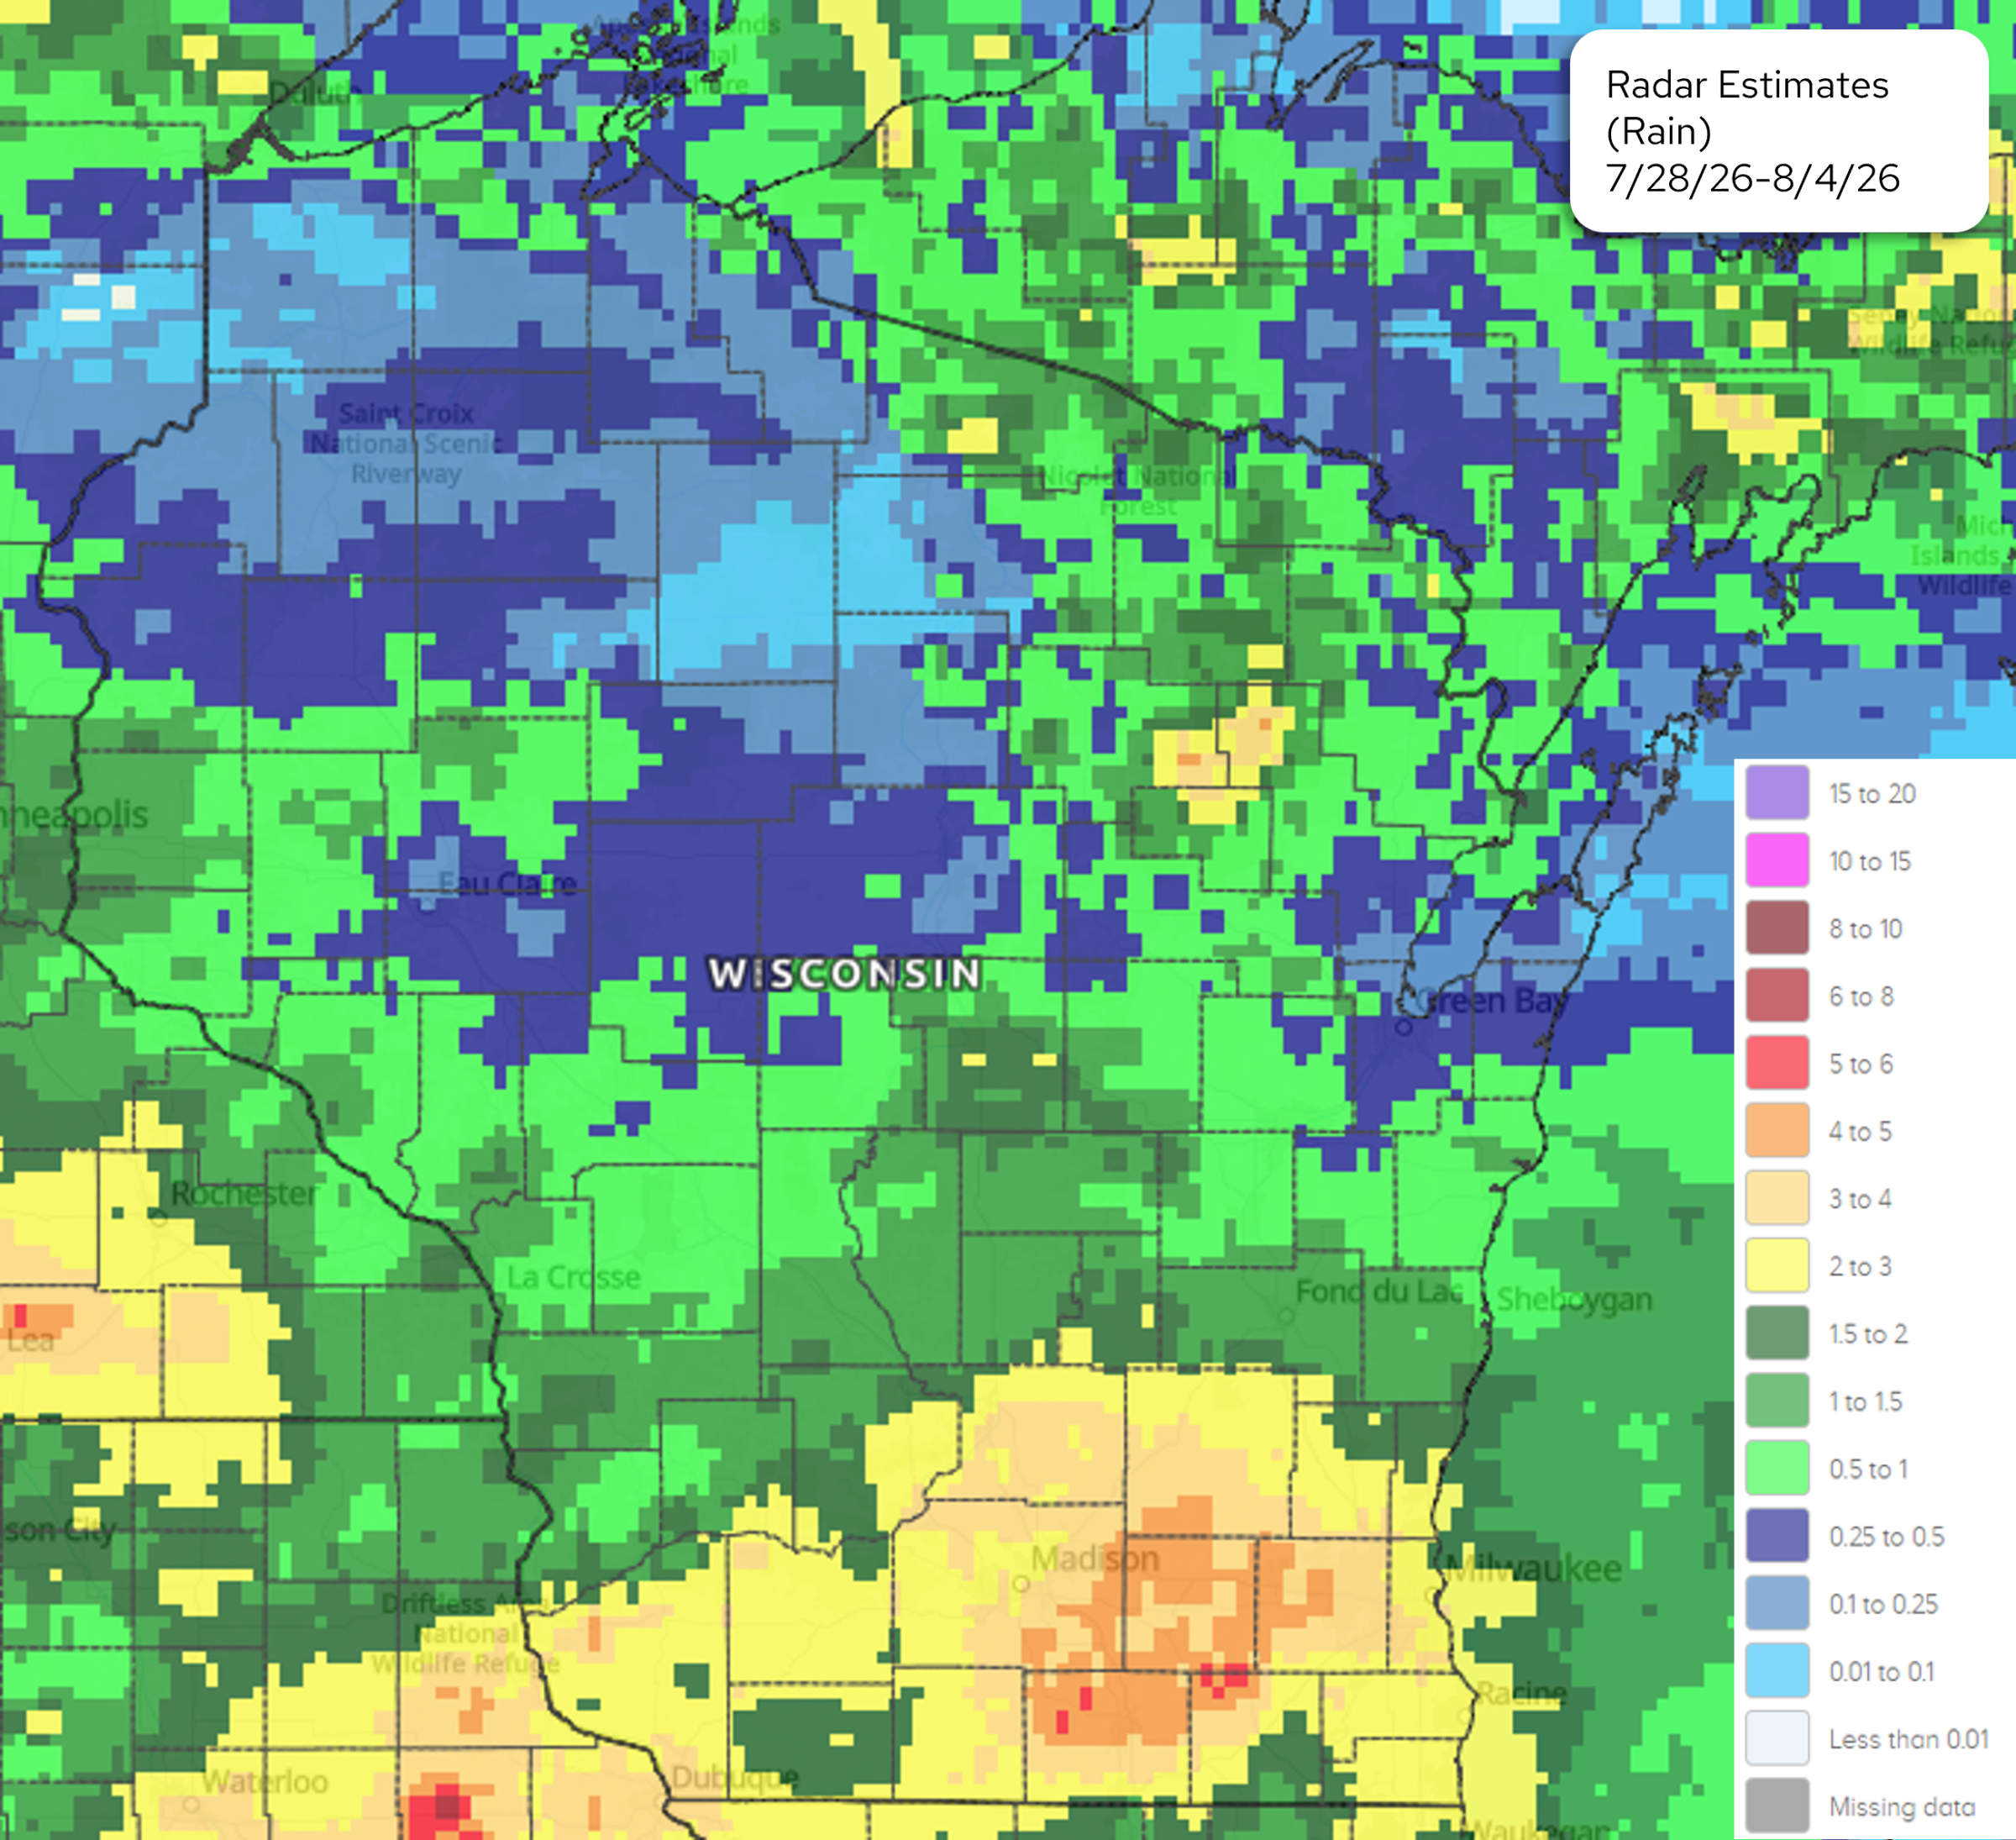
Image Description ↓
A color-coded precipitation map covering Minnesota, Wisconsin, and parts of neighboring states, titled “Radar Estimates (Rain) 7/28/26–8/4/26.” A legend in the lower right shows a scale from “Less than 0.01” inches (light gray) up to “15 to 20” inches (purple), with intermediate bands in blue, green, yellow, orange, and red shades. Most of Wisconsin and southern Minnesota fall in the 0.5–2 inch range (light to medium green), with a broad band of 0.25–0.5 inches (dark blue/purple) across west-central Wisconsin and southeast Minnesota. The highest totals appear in a cluster of orange and red pixels (3–6 inches) centered directly over Madison, WI, with smaller isolated red pockets (5–6 inches) near Waterloo, WI and in southern Minnesota near Albert Lea. A patch of light blue (0.01–0.1 inches, minimal rainfall) appears northwest of Eau Claire, WI. Cities labeled on the map include Duluth, Minneapolis, Eau Claire, La Crosse, Rochester, Madison, Green Bay, Fond du Lac, Sheboygan, Milwaukee, Racine, and Dubuque. County and state boundaries are outlined in black.
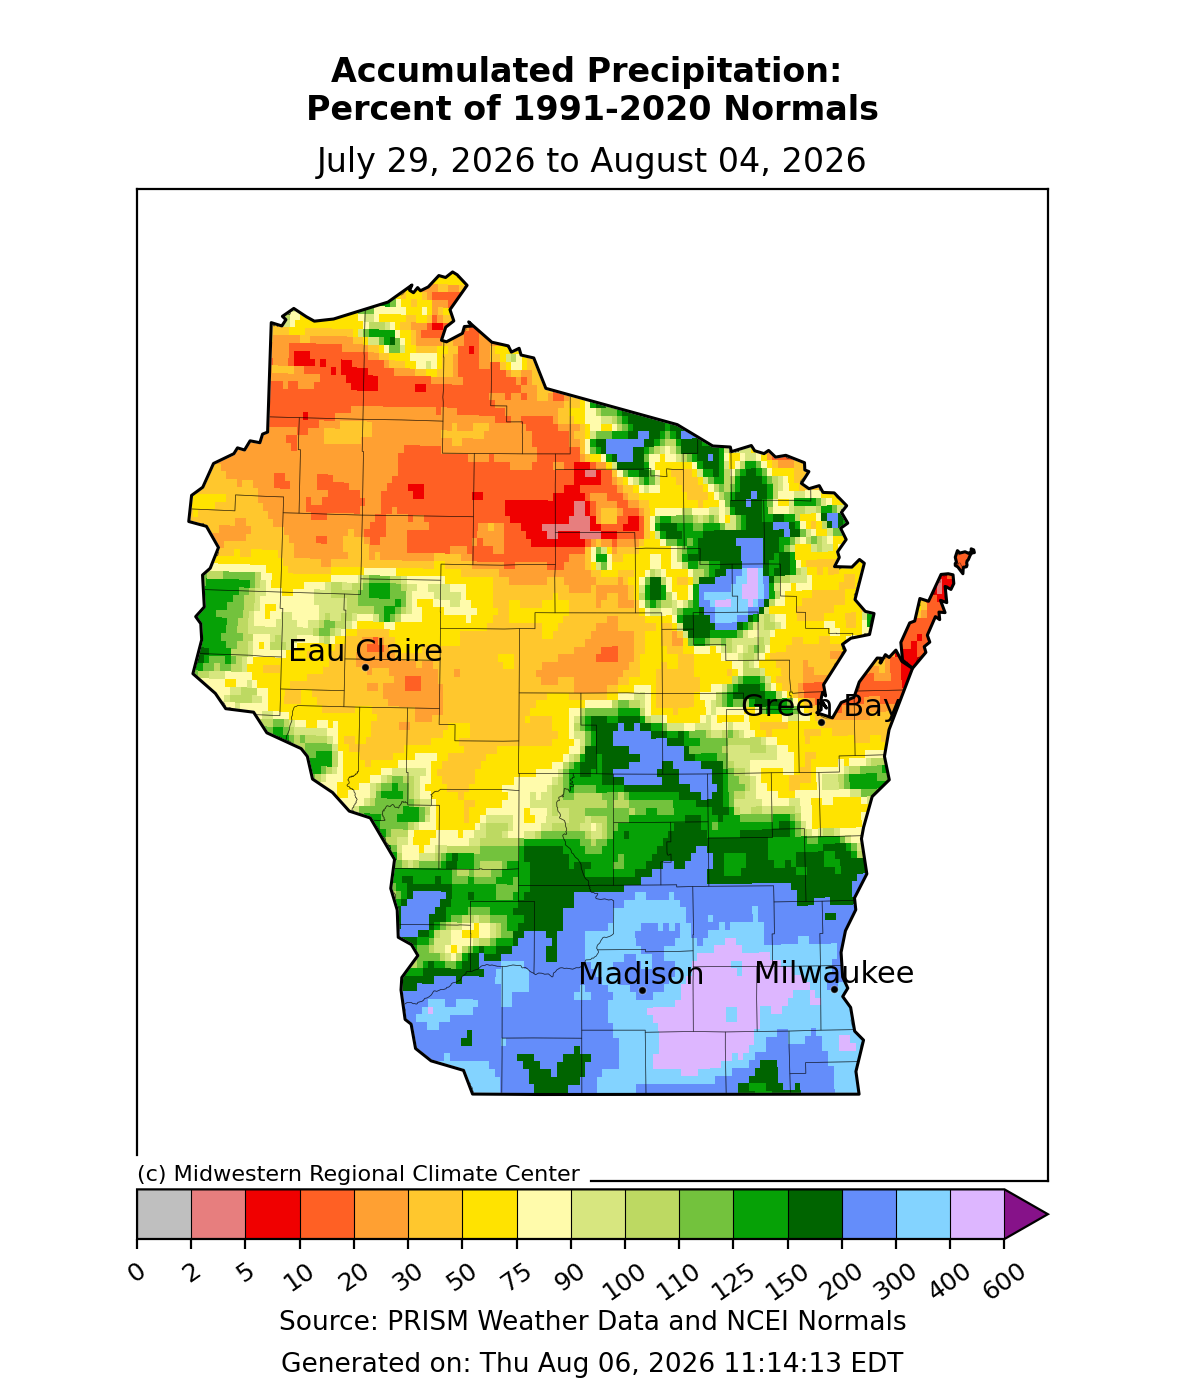
Image Description ↓
Title: Accumulated Precipitation: Percent of 1991-2020 Normals (July 29, 2026 to August 04, 2026).
Map area: The map of Wisconsin displays values ranging from below 10 percent to over 600 percent of normal rainfall. Northern and central regions (including Eau Claire) are dominated by orange and red shading, indicating 10 to 50 percent of normal precipitation. The southern region, including Madison and Milwaukee, is covered in shades of blue and purple, indicating 200 to over 600 percent of normal precipitation.
Source: Midwestern Regional Climate Center using PRISM Weather Data and NCEI Normals. Generated Thu Aug 06, 2026.
- Rainfall totals of 2” or more were common across southern Wisconsin, with localized regions of 4” or more east of Madison.
- Most of the southern half of the state received at least 1” of rain. Northeast Wisconsin also got in on some higher rainfall totals (1-3”).
- Northwest counties were the driest, with totals of less than 0.5” common.
- Highest Wisconet station total from last week: 5.32” (Porter, Rock County). Totals in Rock County were as high as X% of normal.
30 Day Precipitation Total and Departure from Normals
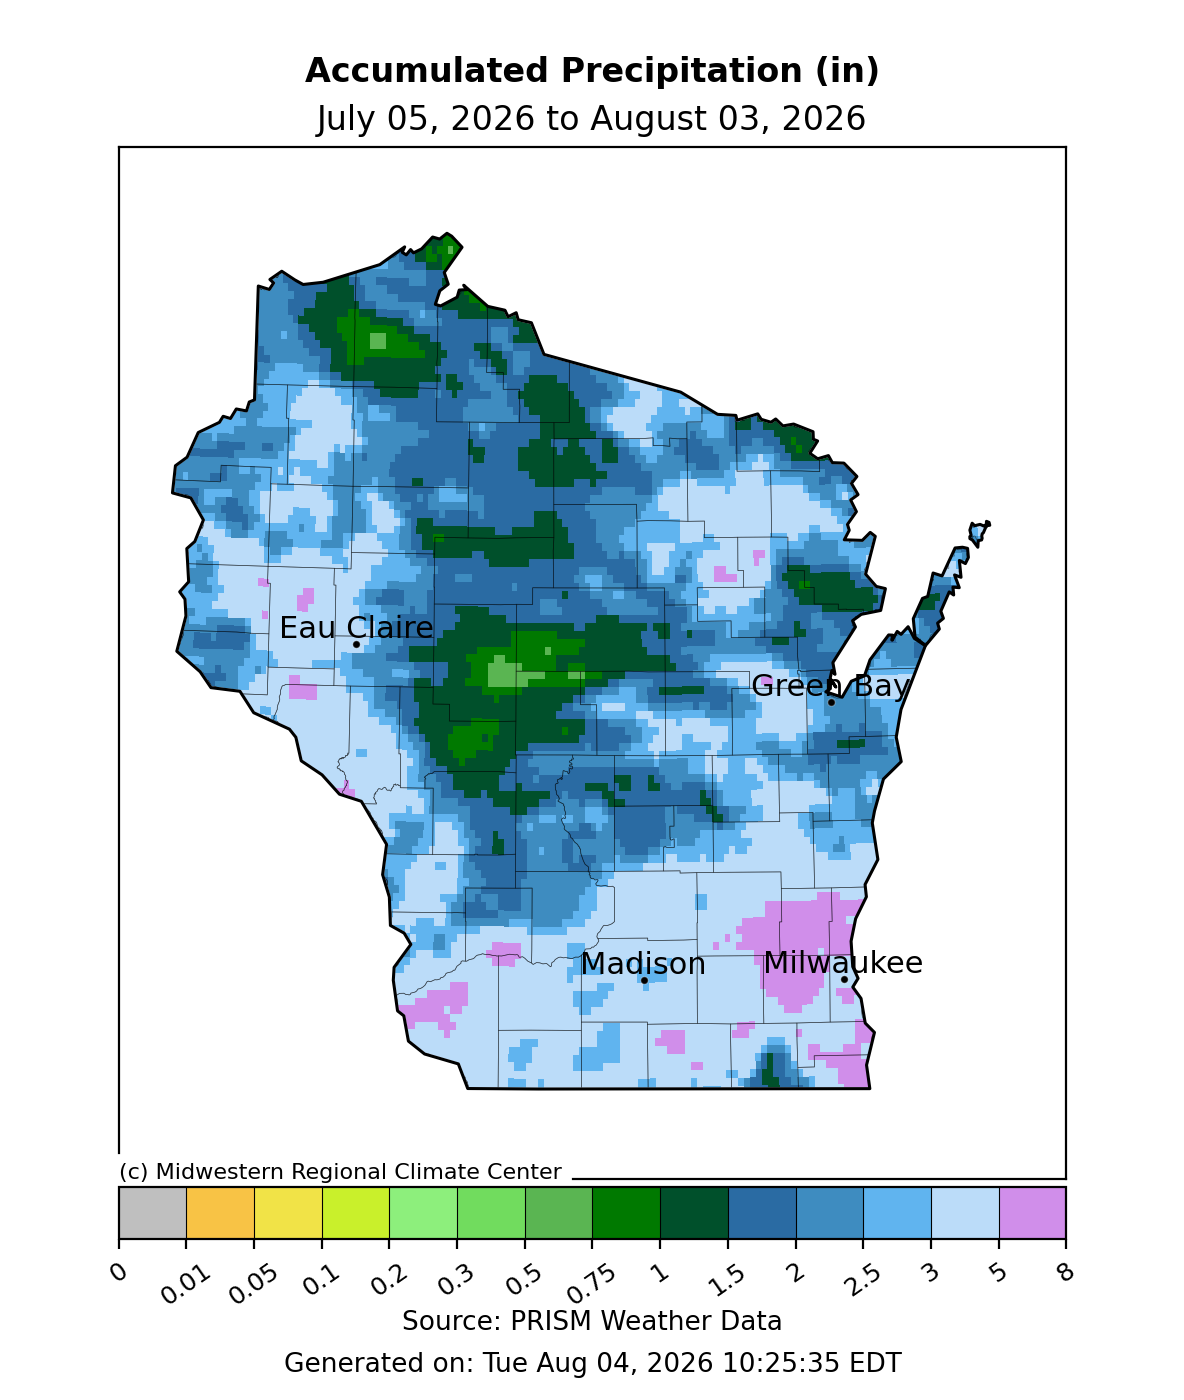
Image Description ↓
Choropleth map titled “Accumulated Precipitation (in), July 05, 2026 to August 03, 2026,” source PRISM Weather Data, credited to the Midwestern Regional Climate Center, generated Aug 04, 2026. Wisconsin is shaded using a 13-class color scale (gray, orange, yellow, three shades of green, dark green, two shades of blue, light blue, and pink/magenta) representing ranges from 0 to 8+ inches. Most of the state shows light to medium blue tones, indicating roughly 1.5–3 inches of rainfall. A band of dark green (2–3 inch and higher categories) runs through north-central Wisconsin and central Wisconsin near Eau Claire, indicating locally heavier totals. Scattered pink/magenta patches indicating the highest category (5–8 inches) appear near Milwaukee and in small pockets elsewhere. Cities labeled with markers include Eau Claire, Green Bay, Madison, and Milwaukee.
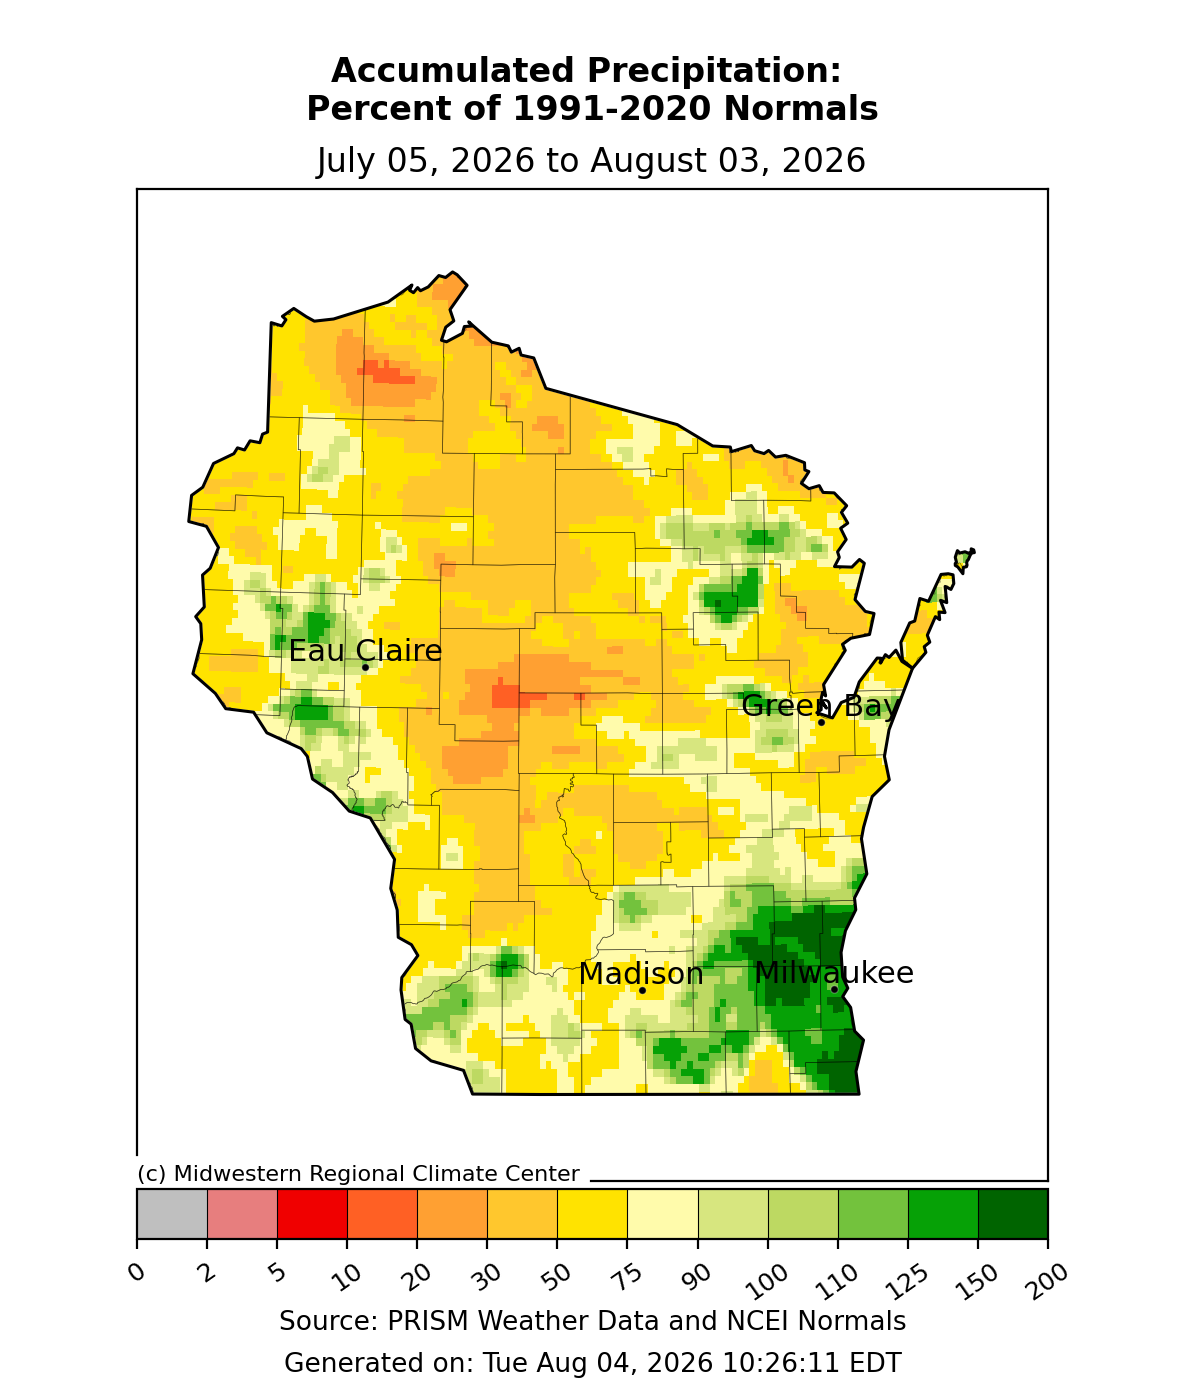
Image Description ↓
Map titled “Accumulated Precipitation: Percent of 1991-2020 Normals, July 05, 2026 to August 03, 2026,” from the Midwestern Regional Climate Center. Color scale ranges from gray (0%) and red (5-10%, driest) through orange and yellow (30-90%) to shades of green (100-200%, wettest). Most of central and northern Wisconsin shows yellow-orange tones, indicating roughly 50-90% of normal precipitation, with a small red pocket (under 10%) near the center of the state and another north of Eau Claire. Southeastern Wisconsin, particularly around Milwaukee, shows dark green shading indicating 150-200% of normal precipitation. Scattered green patches also appear near Green Bay and south of Madison. Cities labeled include Eau Claire, Green Bay, Madison, and Milwaukee. Source: PRISM Weather Data and NCEI Normals. Generated Tue Aug 4, 2026, 10:26:11 EDT.
- The past 30 days have been drier than normal across most of Wisconsin, with rainfall totals that were 75% of normal or less.
- Southeast Wisconsin made up some ground last week, as the region has now had a wetter-than-normal past 30 days.
- Totals ranged from 5-8” in parts of southern Wisconsin (110-200% of normal) to less than 2” across north central counties (20-50% of normal).
90 Day Precipitation Total and Percent of Normals
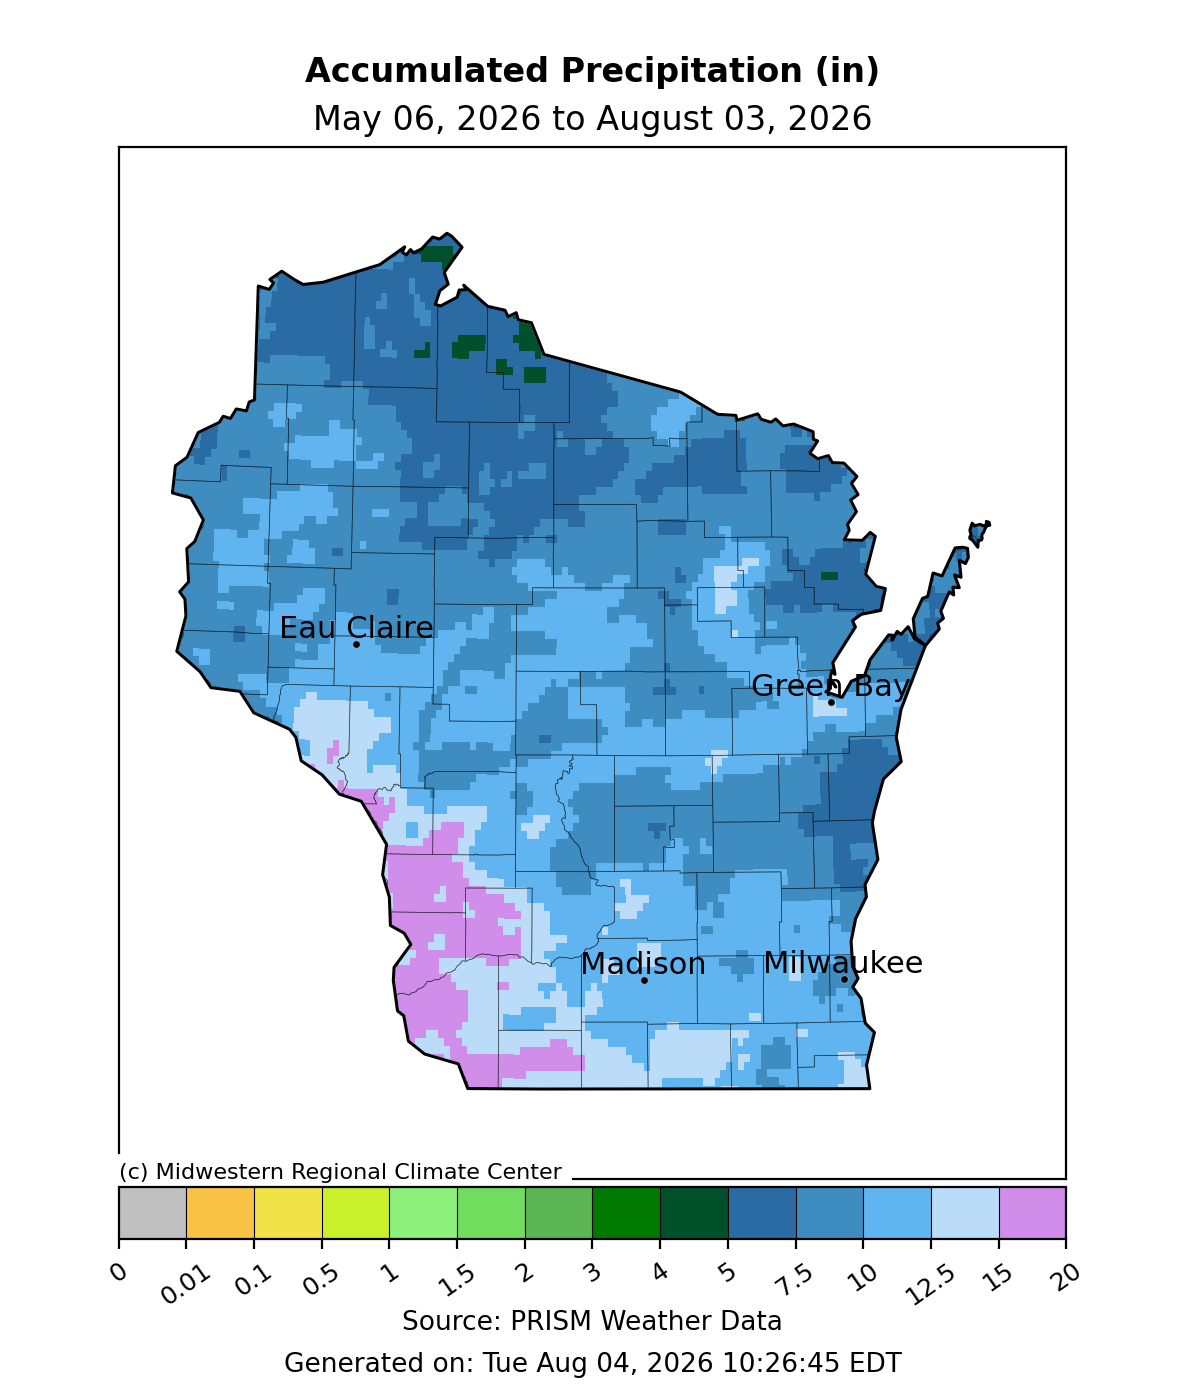
Image Description ↓
Choropleth map titled “Accumulated Precipitation (in), May 06, 2026 to August 03, 2026,” source PRISM Weather Data, generated Tue Aug 04, 2026 10:26:45 EDT, credit Midwestern Regional Climate Center. Most of Wisconsin shows 5–12.5 inches (blue shades). Southwestern Wisconsin, near the Mississippi River border, shows notably lower totals of 0.5–3 inches (pink/light-pink shading). Small dark green patches (3–5 inches, though visually appearing as isolated high spots relative to surroundings) appear in the far north-central counties. Cities labeled: Eau Claire, Green Bay, Madison, and Milwaukee. A color scale bar at bottom spans 0 to 20 inches across ten color bins.
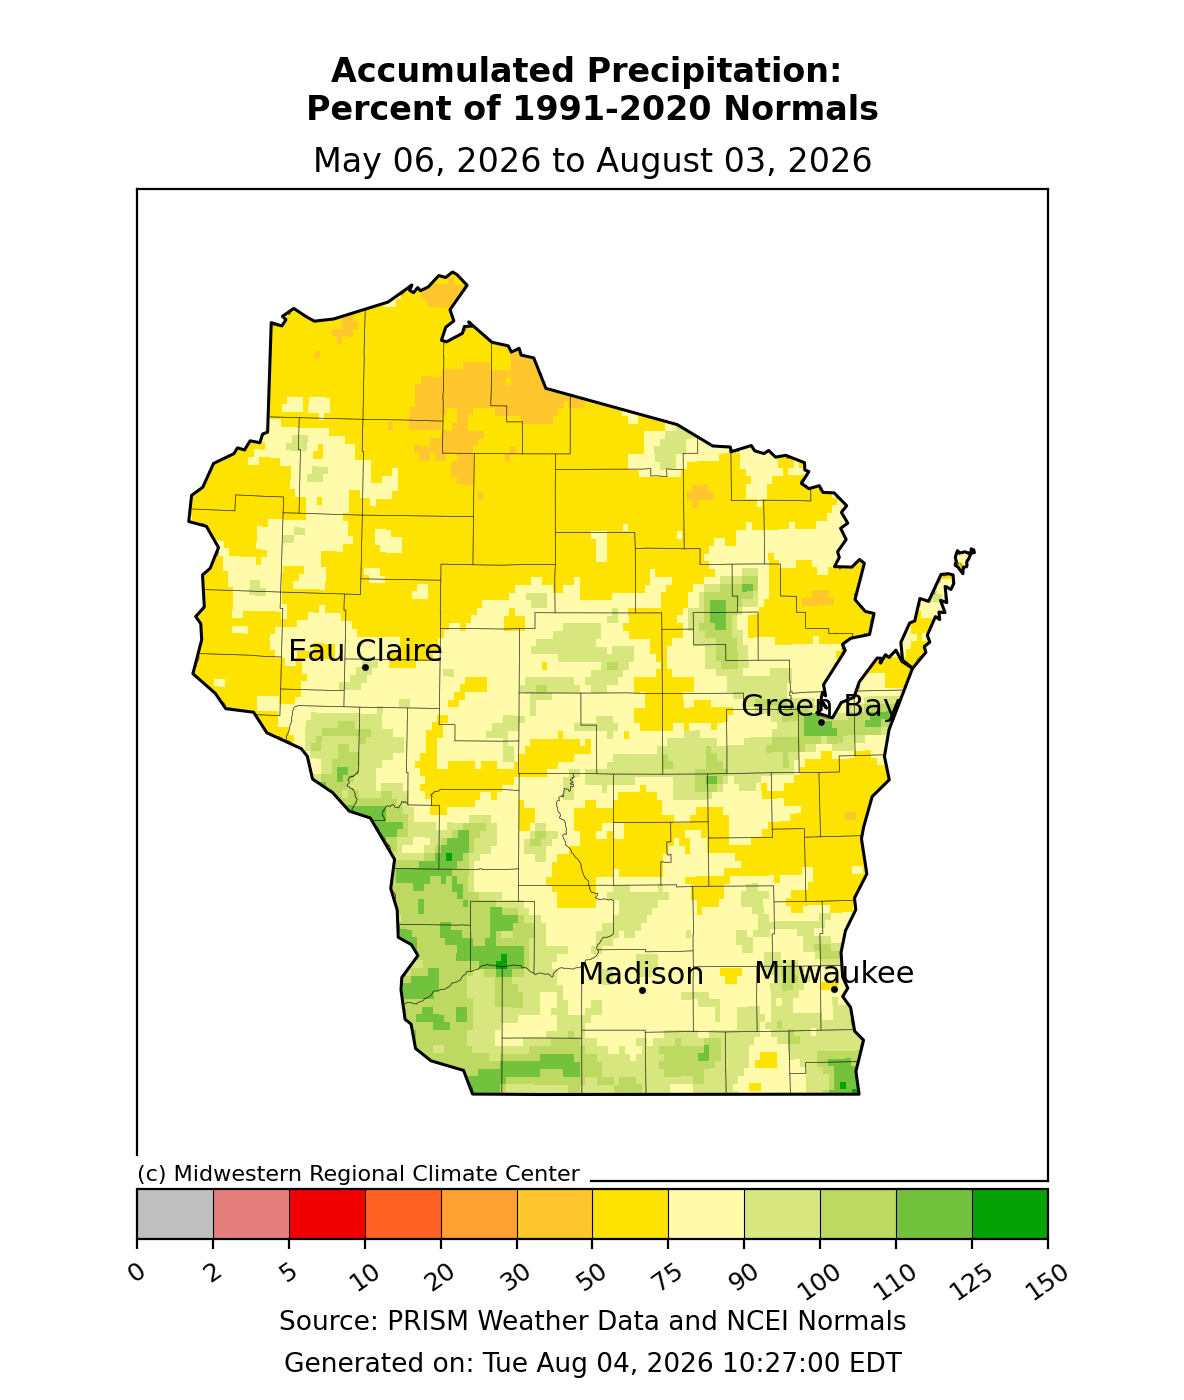
Choropleth map titled “Accumulated Precipitation: Percent of 1991-2020 Normals,” dated May 06, 2026 to August 03, 2026, sourced from PRISM Weather Data and NCEI Normals via the Midwestern Regional Climate Center, generated Aug 4, 2026. Northern and central Wisconsin show mostly yellow to gold shading (75-100% of normal), with pockets of darker orange (30-50%) near the north-central region. Southern and southwestern Wisconsin trend toward pale yellow and light green (90-125%), with scattered darker green areas (125-150%) in the southwest and near Green Bay. Cities labeled: Eau Claire, Green Bay, Madison, and Milwaukee. A color-scale legend at the bottom ranges from gray (0%) and red (2-10%) through orange and yellow (20-90%) to pale yellow (100%) and shades of green (110-150%).
- Totals were highest in the southwest and west-central counties (12.5-20”). These totals were near to normal.
- Most of the state received precipitation totals that were 90% of normal or less, with most receiving at least 7.5” of precipitation.
- Precipitation totals were lowest in the northern counties (4-7.5”). Here, the 90-day totals were around 50% of normal.
2026 Precipitation
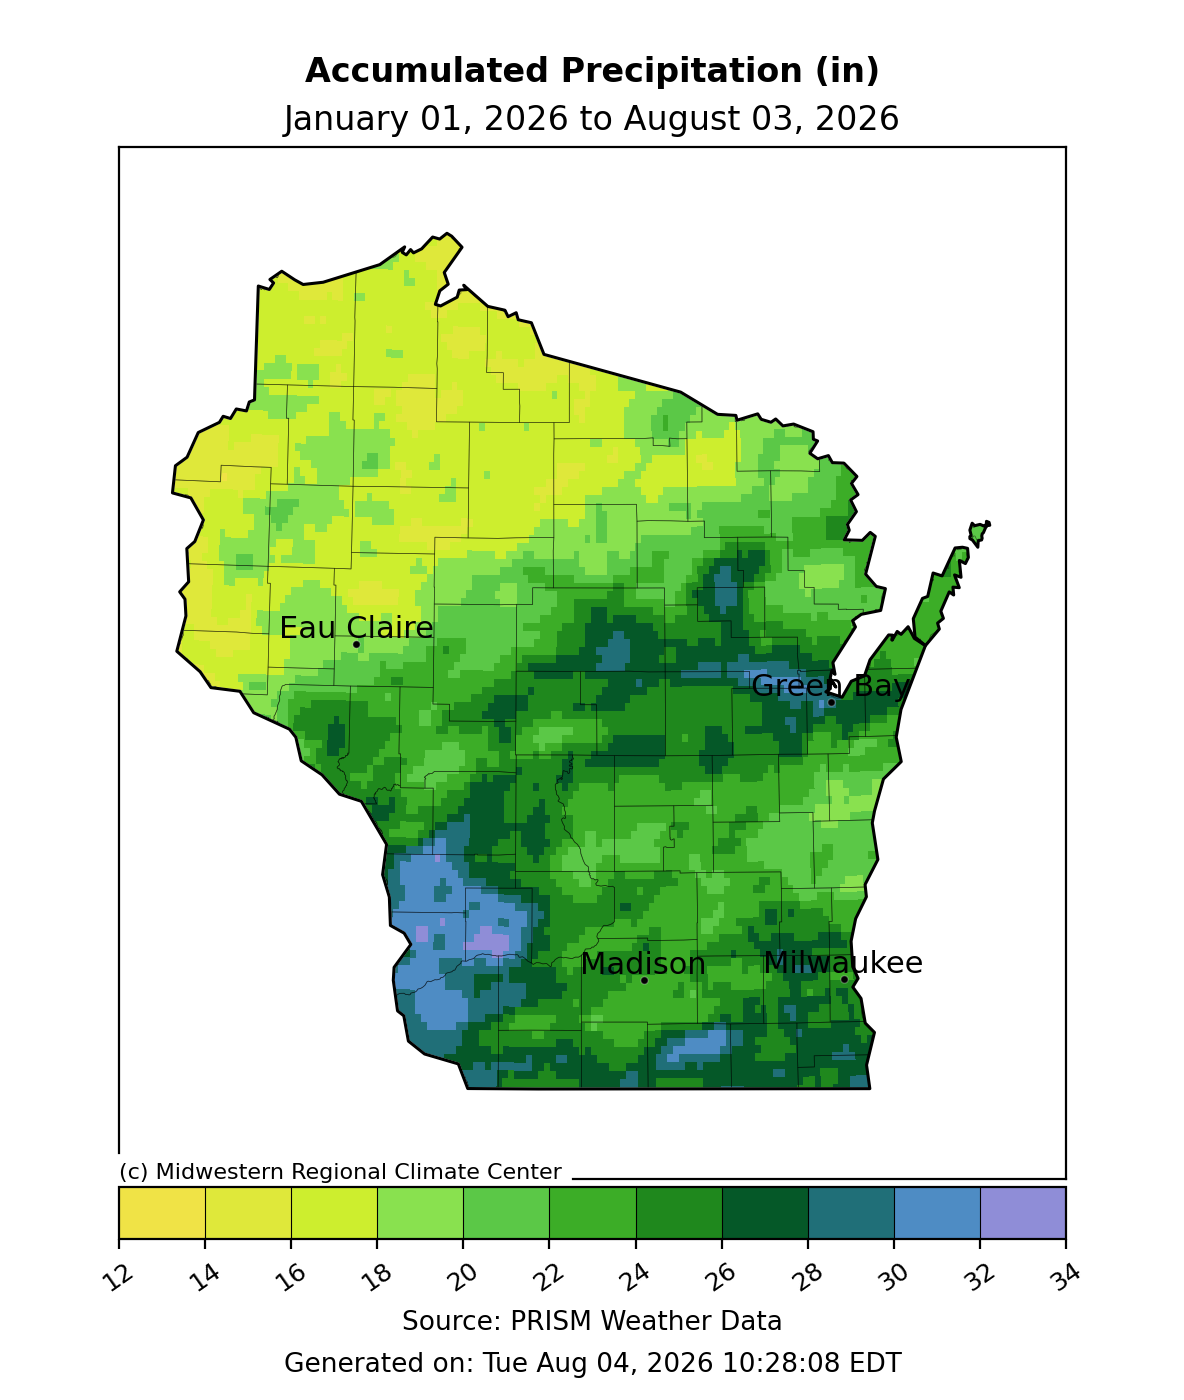
Image Description ↓
Choropleth map titled “Accumulated Precipitation (in), January 01, 2026 to August 03, 2026,” sourced from PRISM Weather Data via the Midwestern Regional Climate Center, generated Aug 4, 2026. Northern Wisconsin shows lowest totals (12–18 in, yellow shading). Central and eastern Wisconsin, including areas near Green Bay, show moderate totals (18–26 in, light to dark green). Southwestern Wisconsin, particularly around and southwest of Madison, shows the highest totals (28–34+ in, blue to purple shading), indicating significantly wetter conditions in that region. City markers are labeled for Eau Claire, Green Bay, Madison, and Milwaukee. A horizontal color scale bar at the bottom maps shading to precipitation values from 12 to 34 inches.
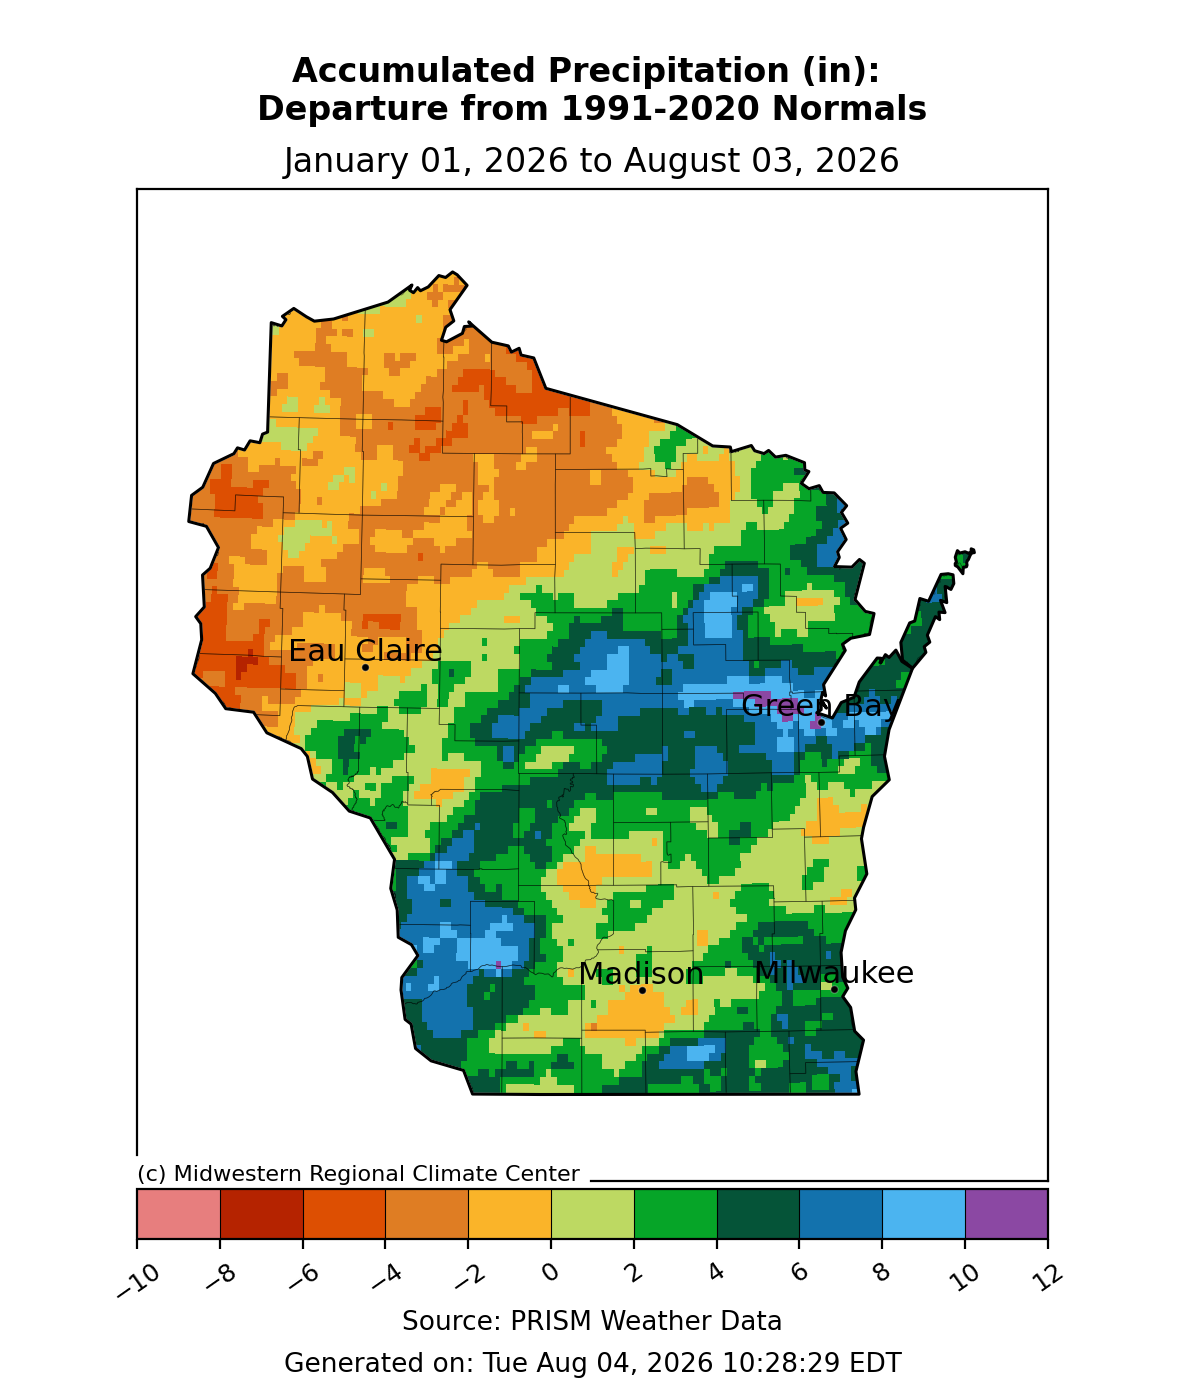
Image Description ↓
Choropleth map titled “Accumulated Precipitation (in): Departure from 1991-2020 Normals, January 01, 2026 to August 03, 2026,” sourced from PRISM Weather Data via the Midwestern Regional Climate Center, generated Tue Aug 4, 2026, 10:28:29 EDT. Northern and northwestern Wisconsin show a broad area of below-normal precipitation, shaded orange to red (roughly -2 to -8 inches), most pronounced near Eau Claire and the far northwest. Central Wisconsin is near normal (light green/yellow). Southwestern Wisconsin and a band stretching from central Wisconsin through the Green Bay area show above-normal precipitation, shaded green to blue (roughly 4 to 10+ inches), with small pockets exceeding 10-12 inches (purple) near Green Bay and in south-central counties. Madison shows near-normal to slightly above-normal precipitation, while Milwaukee and southeastern Wisconsin show moderately above-normal precipitation (green). A color scale legend at the bottom ranges from -10 to 12 inches, with red indicating deficits and blue/purple indicating surpluses.
Soil Moisture and Temperature Trends
Soil Moisture Models
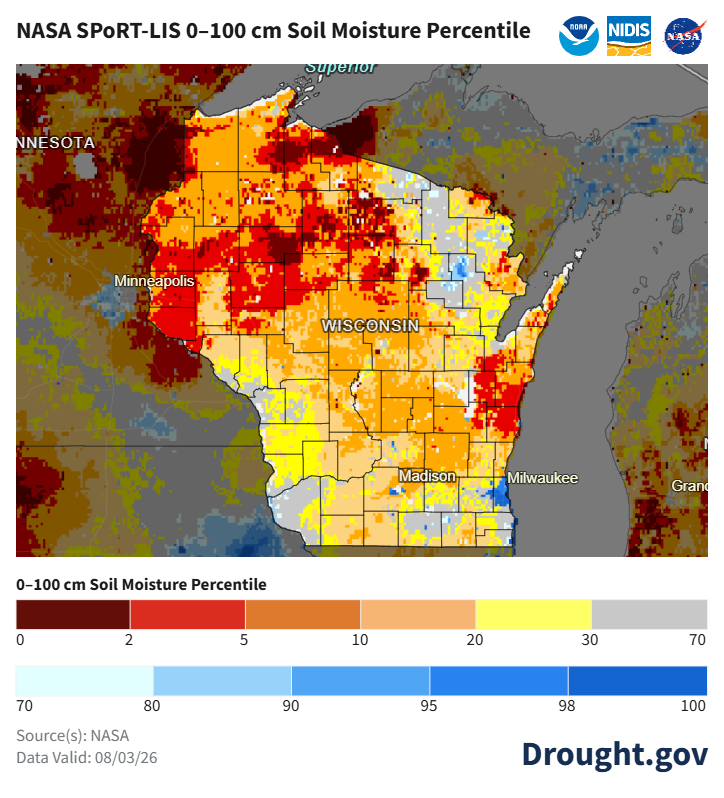
Image Description ↓
Map titled “NASA SPoRT-LIS 0–100 cm Soil Moisture Percentile,” data valid 08/03/26, sourced from NASA via Drought.gov. Shows Wisconsin, eastern Minnesota, and parts of Michigan and Illinois, colored by soil moisture percentile using a scale from dark red/maroon (0–2, driest) through red, orange, tan, yellow (2–30) to gray (30–70), with blue tones for wetter areas (70–100).
Most of Wisconsin falls in the 5–30 percentile range (orange, tan, yellow), indicating widespread dry conditions. Heavy concentrations of dark red and maroon (0–5 percentile, extremely dry) appear across northwestern Wisconsin near Minnesota, the north-central region, and a patch in the east near the Lake Michigan shoreline. Small pockets of gray (30–70 percentile, near-normal) appear near Green Bay and Milwaukee. Isolated blue patches indicating wetter-than-normal conditions (70%+) appear near Lake Superior, around Madison, and along parts of Lake Michigan. Cities labeled include Minneapolis, Madison, and Milwaukee.
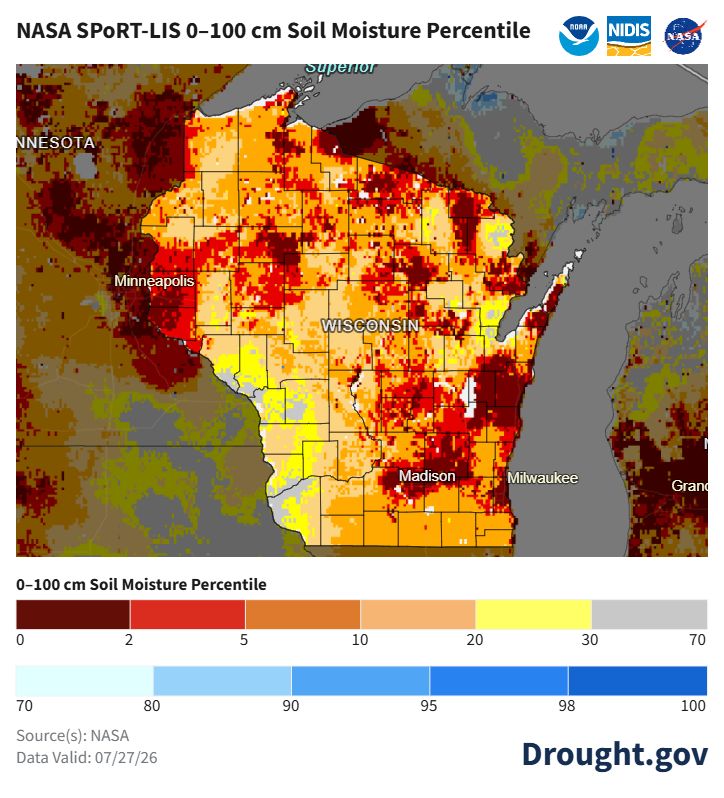
Image Description ↓
Map titled “NASA SPoRT-LIS 0–100 cm Soil Moisture Percentile,” data valid 07/27/26, sourced from NASA via Drought.gov. Covers Minnesota, Wisconsin, and surrounding areas including Minneapolis, Madison, and Milwaukee. County boundaries are outlined within Wisconsin. Most of Wisconsin and southern Minnesota show soil moisture percentiles in the 0–20 range (dark red to light orange to yellow), indicating widespread dry conditions. Scattered pockets of dark red (0–2 percentile) appear in northwestern Wisconsin, central Wisconsin near Madison, and parts of Minnesota, indicating extreme dryness. Some small blue-shaded patches (70–100 percentile, wetter than normal) appear near Lake Superior and scattered locations. A legend at the bottom shows two color scales: a red-to-yellow scale for percentiles 0–70 (driest to near normal) and a blue scale for percentiles 70–100 (wetter than normal).
- Satellite-based soil moisture estimates indicate that conditions in the top 1 meter improved across the eastern side of the state following last week’s rain.
- The worst dryness, according to these estimates, is in north central and northwest counties, as well as in some locations near to Sheboygan/Manitowoc.
- Notes on how to interpret the maps:
- Red areas = top 5 driest in 100 years.
- Dark red areas = top 2 driest in 100 years.
- Dark blue areas = top 2 wettest in 100 years.
Wisconet Soil Moisture
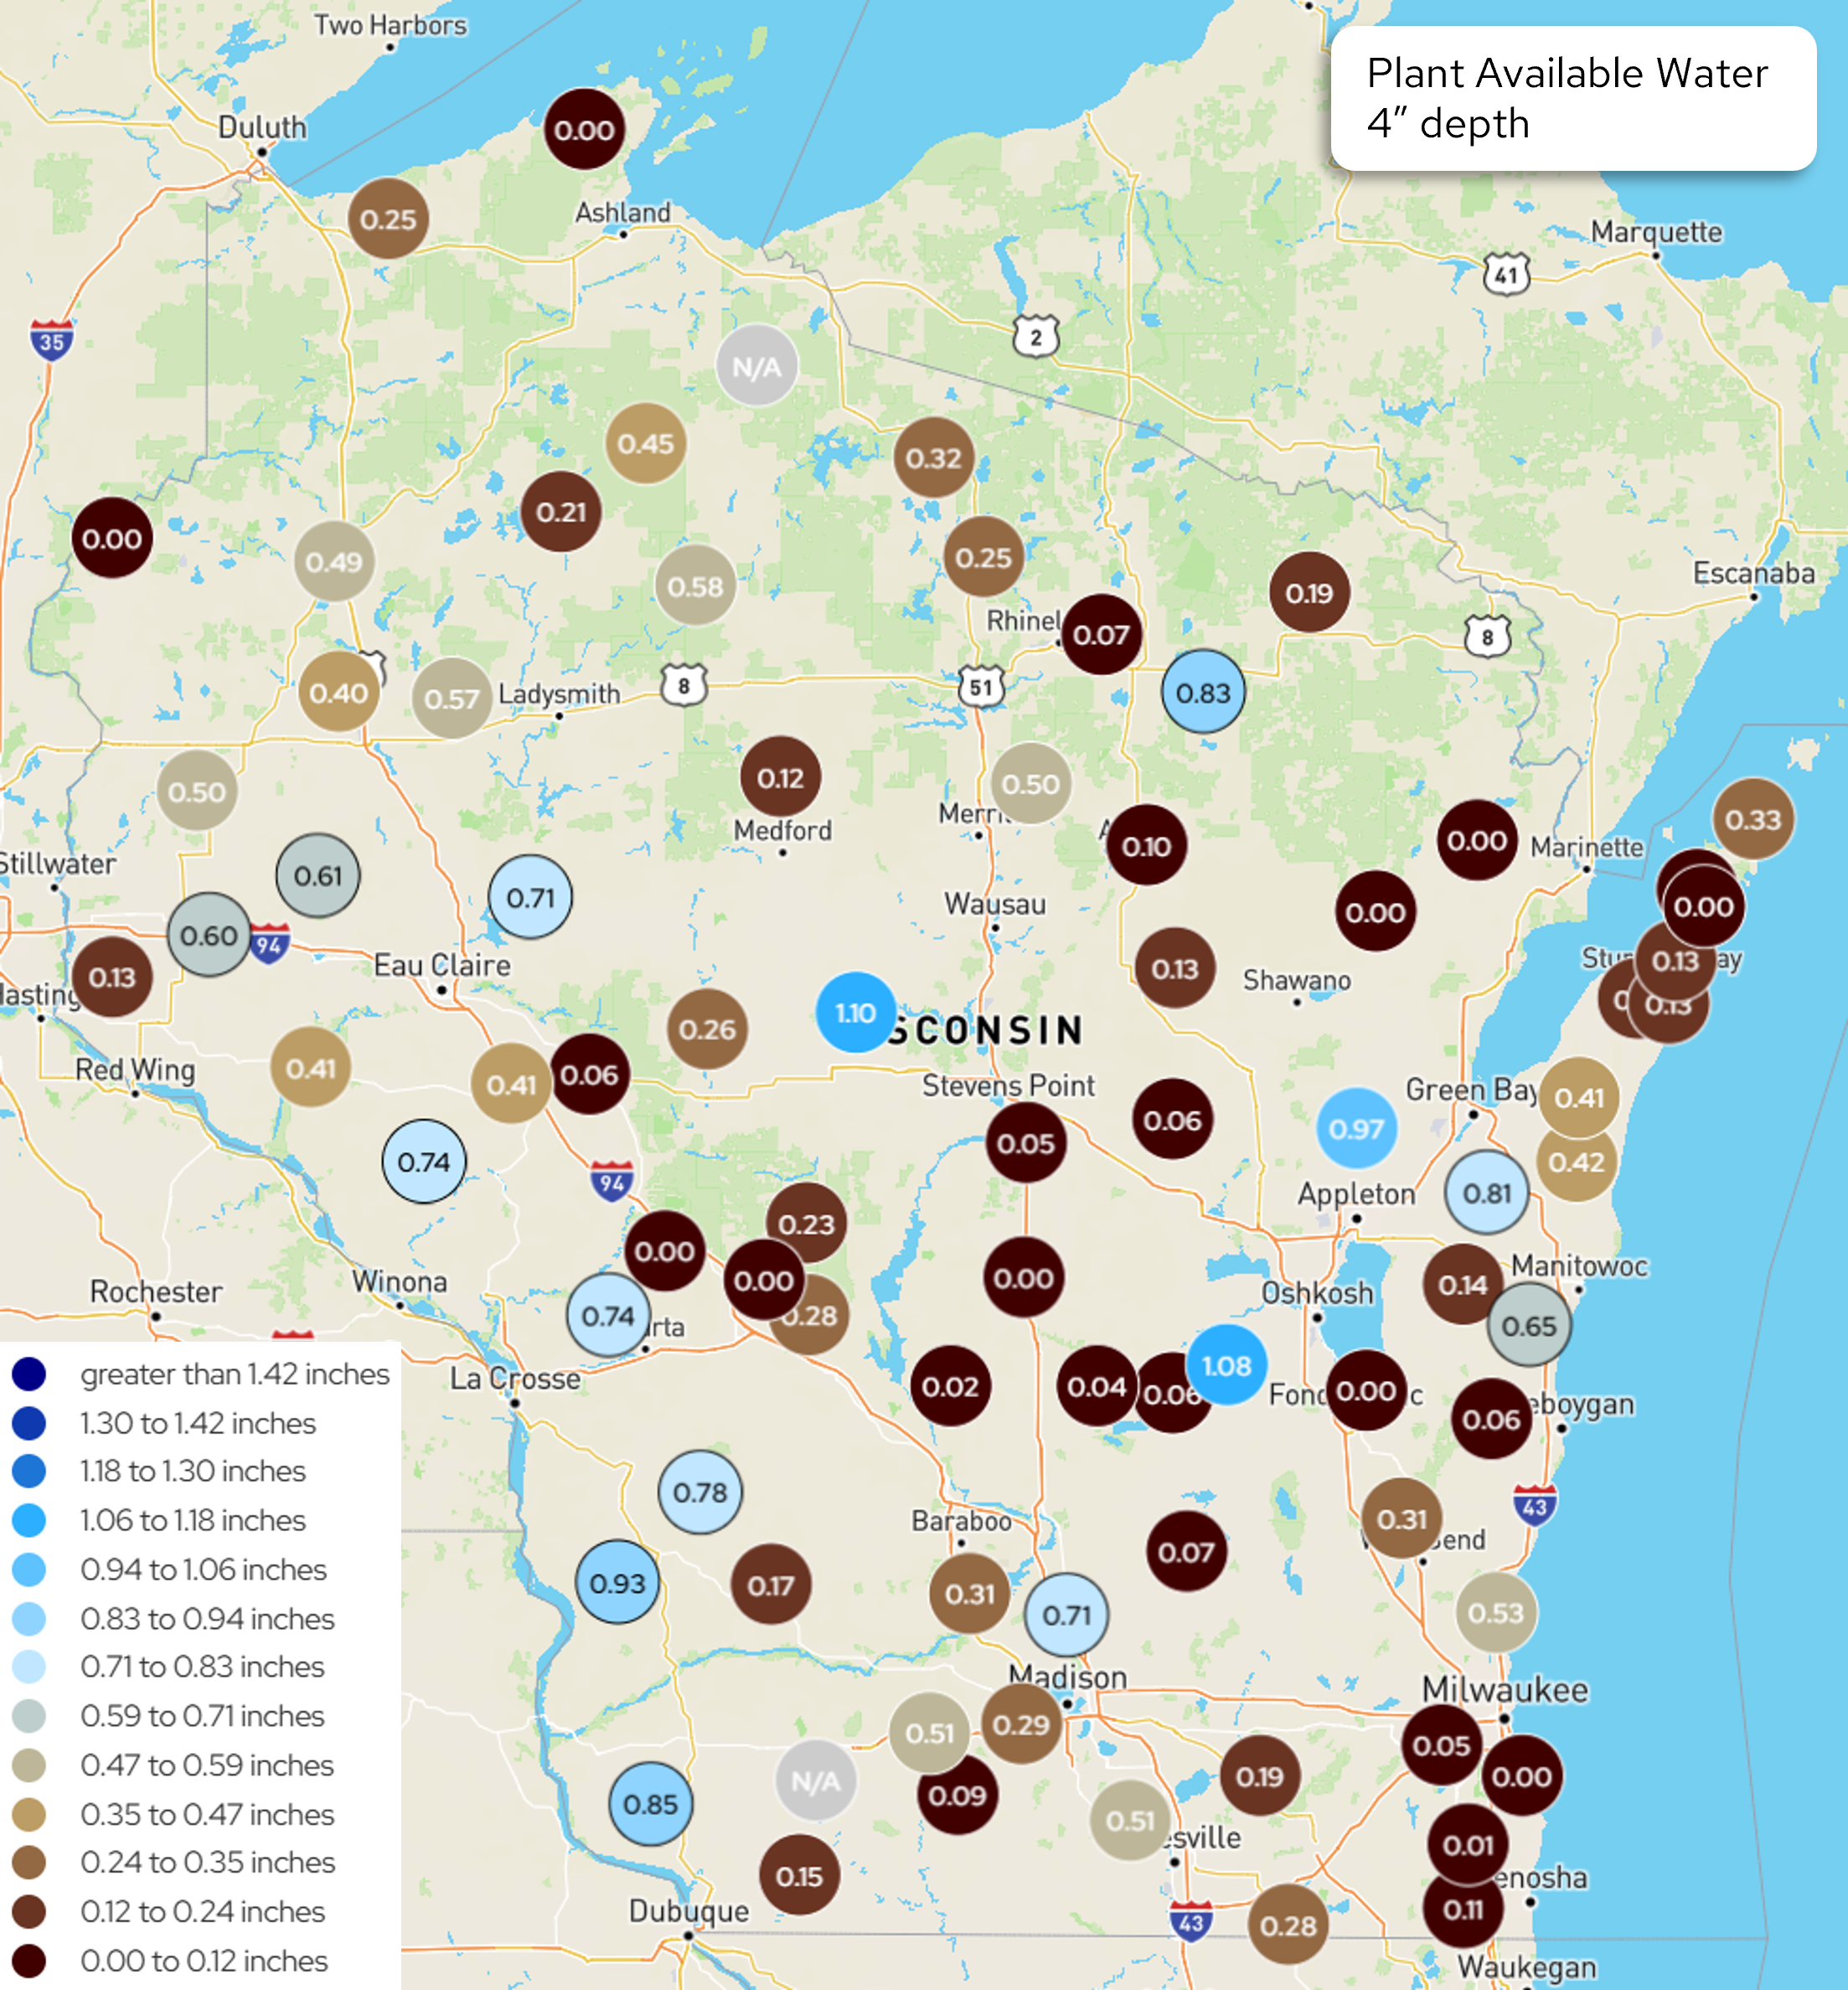
Image Description ↓
Map of Wisconsin and surrounding area showing plant available water (4″ depth) as color-coded, numbered circles at monitoring station locations across the state. Values range from 0.00 to 1.10 inches. Darkest red circles (0.00–0.12 in) are the most common, appearing widely across northern, central, and eastern Wisconsin, including several stations reading 0.00. Brown and tan circles (0.12–0.59 in) appear in the northwest, west-central, and southern regions. Light blue circles (0.71–1.10 in) are concentrated in west-central Wisconsin near Eau Claire and in parts of central and eastern Wisconsin near Appleton and Fond du Lac, with the highest value, 1.10, located near central Wisconsin. Two stations, in north-central Wisconsin and southern Wisconsin near Janesville, are marked “N/A.” A legend in the lower left lists 12 color categories ranging from “0.00 to 0.12 inches” (dark red) to “greater than 1.42 inches” (dark blue), though no stations on the map reach the higher categories.
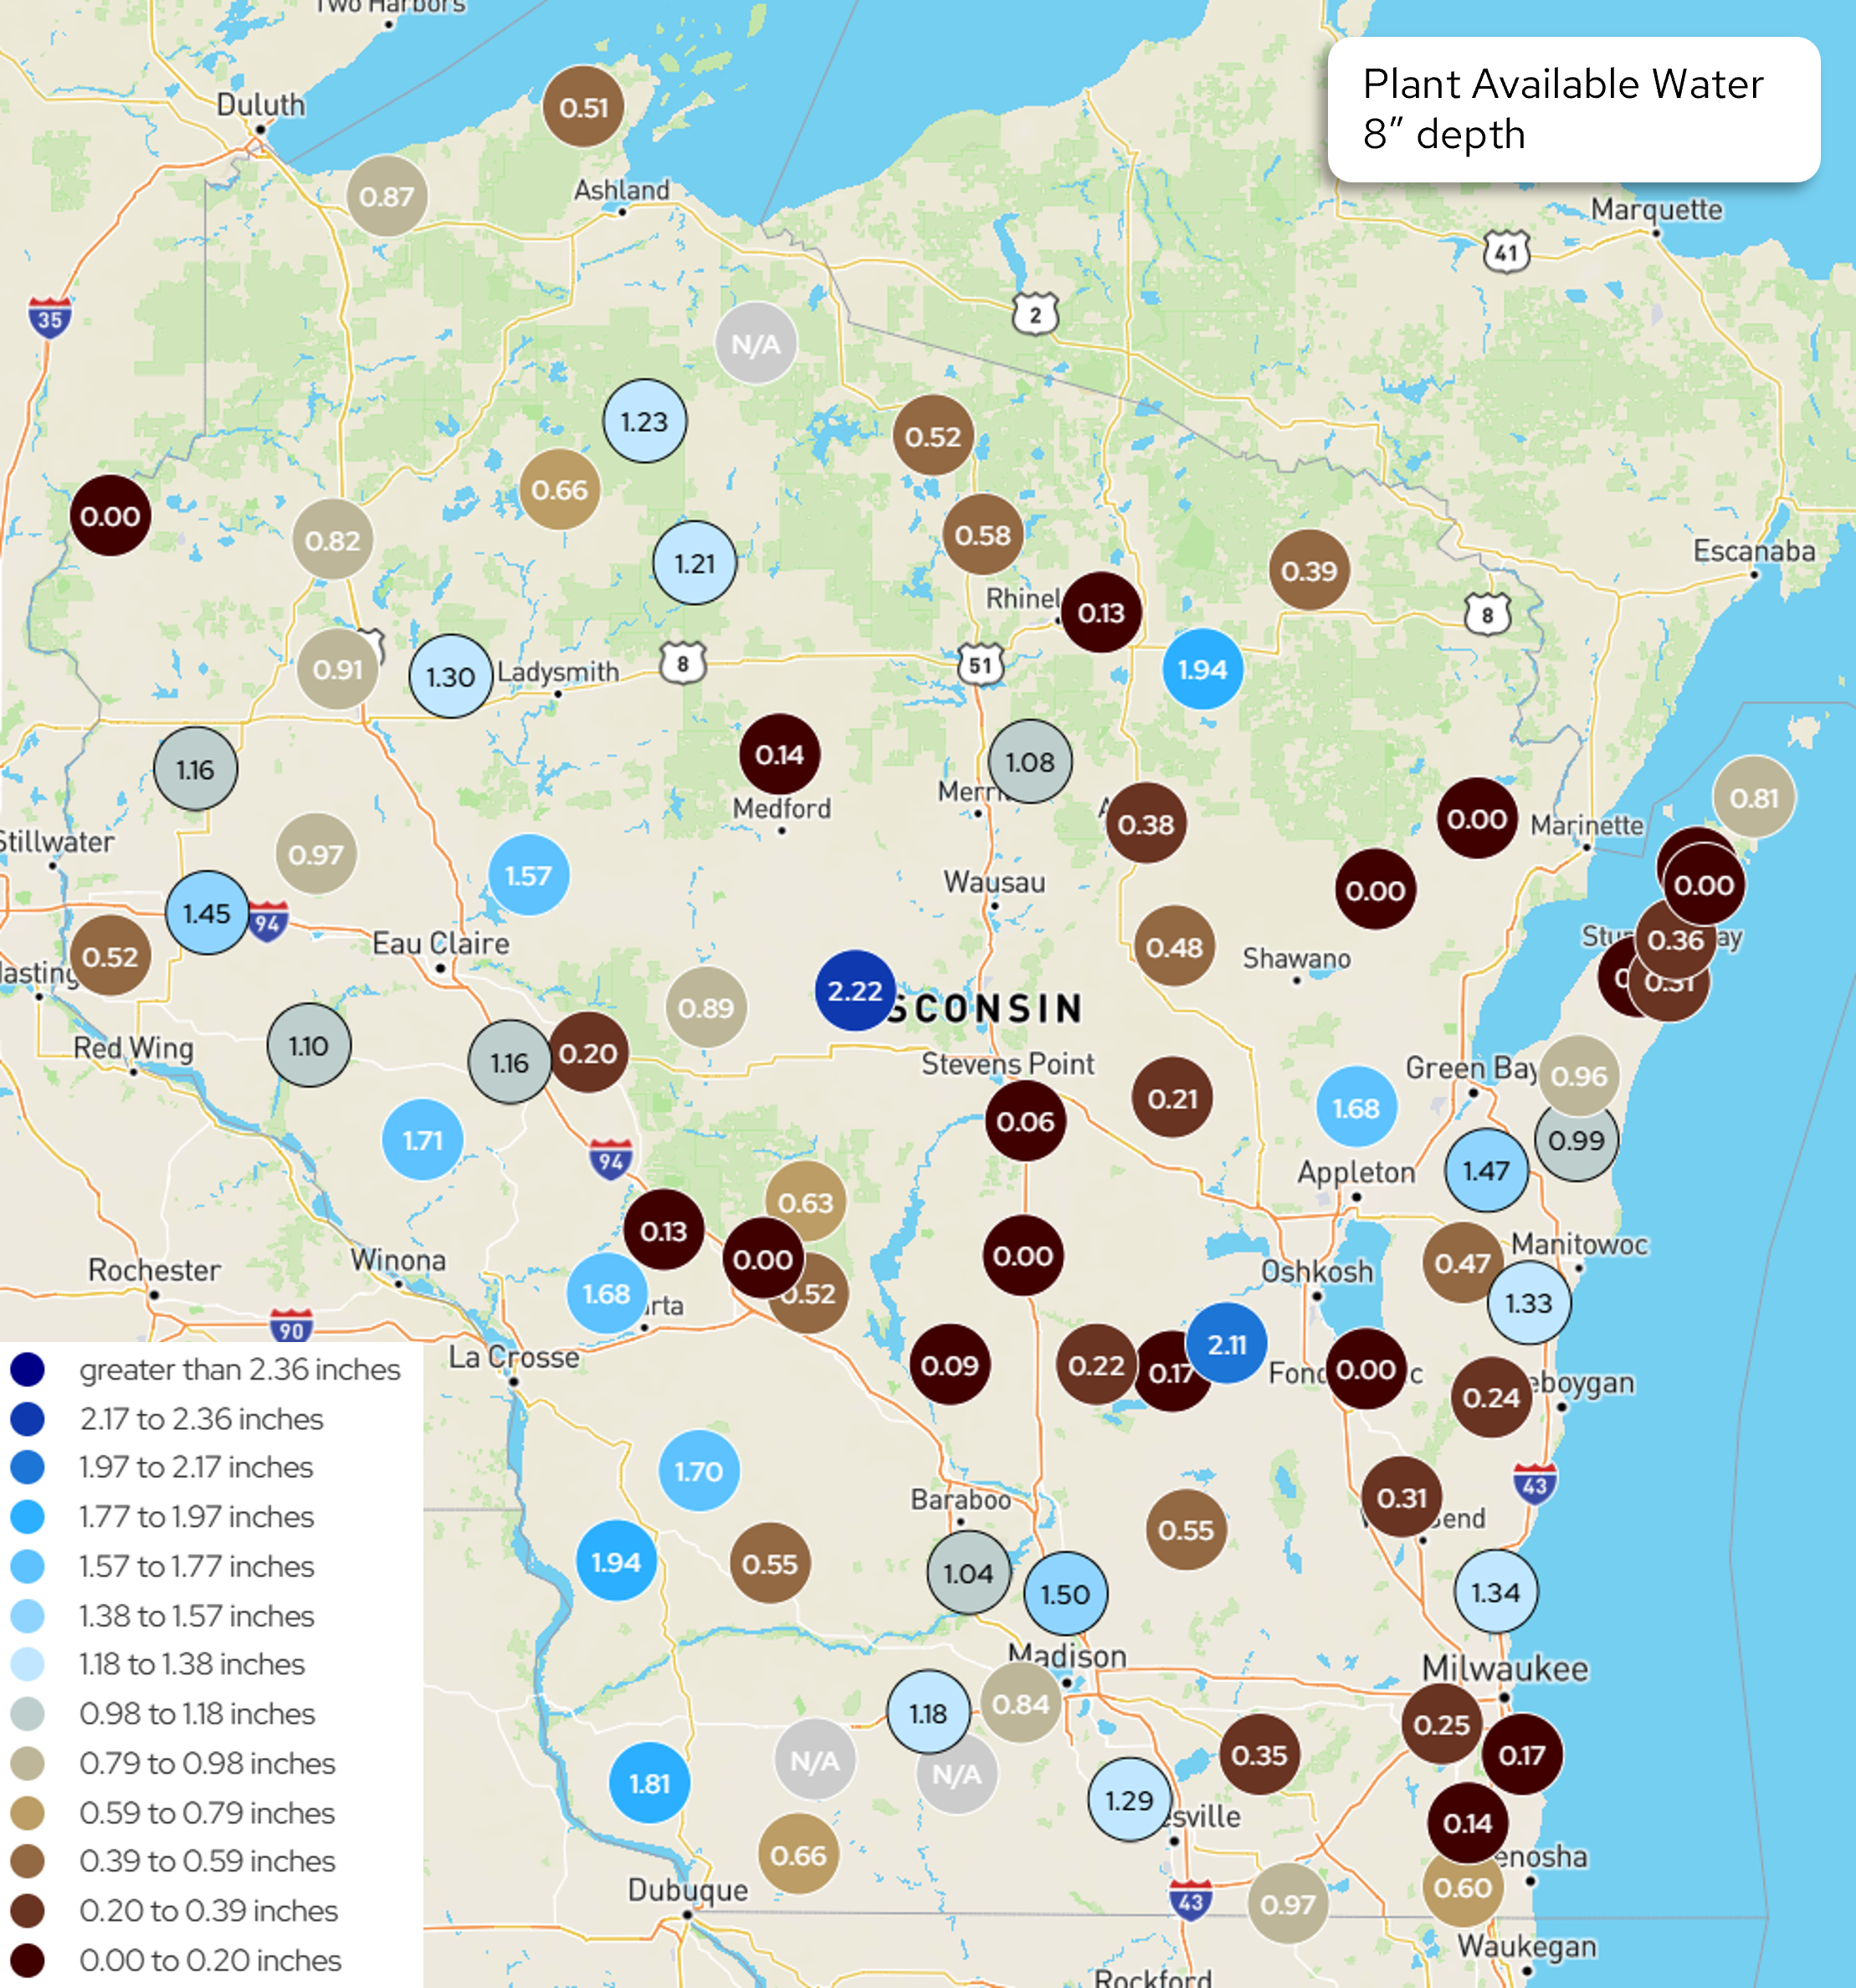
Image Description ↓
Map of Wisconsin and surrounding areas (Minnesota, Iowa, Illinois, Michigan) titled “Plant Available Water, 8″ depth.” Circular markers at roughly 70 monitoring sites display numeric values from 0.00 to 2.22 inches, each color-coded per an 11-category legend ranging from dark red (0.00–0.20 inches) through tan/gray mid-range values to dark blue (greater than 2.36 inches). Two sites are labeled N/A (gray). Values cluster low (dark red, under 0.20 inches) across much of central and eastern Wisconsin, including areas near Wausau, Stevens Point, and along the Lake Michigan shoreline. Higher values (blue, 1.4–2.22 inches) appear near Eau Claire, La Crosse, and a peak of 2.22 inches near central Wisconsin. Reference cities shown include Duluth, Ashland, Rhinelander, Wausau, Green Bay, Appleton, Oshkosh, Madison, and Milwaukee, with major highways (I-35, I-94, I-90, I-43, US-2, US-41, US-51, US-8) labeled for orientation.
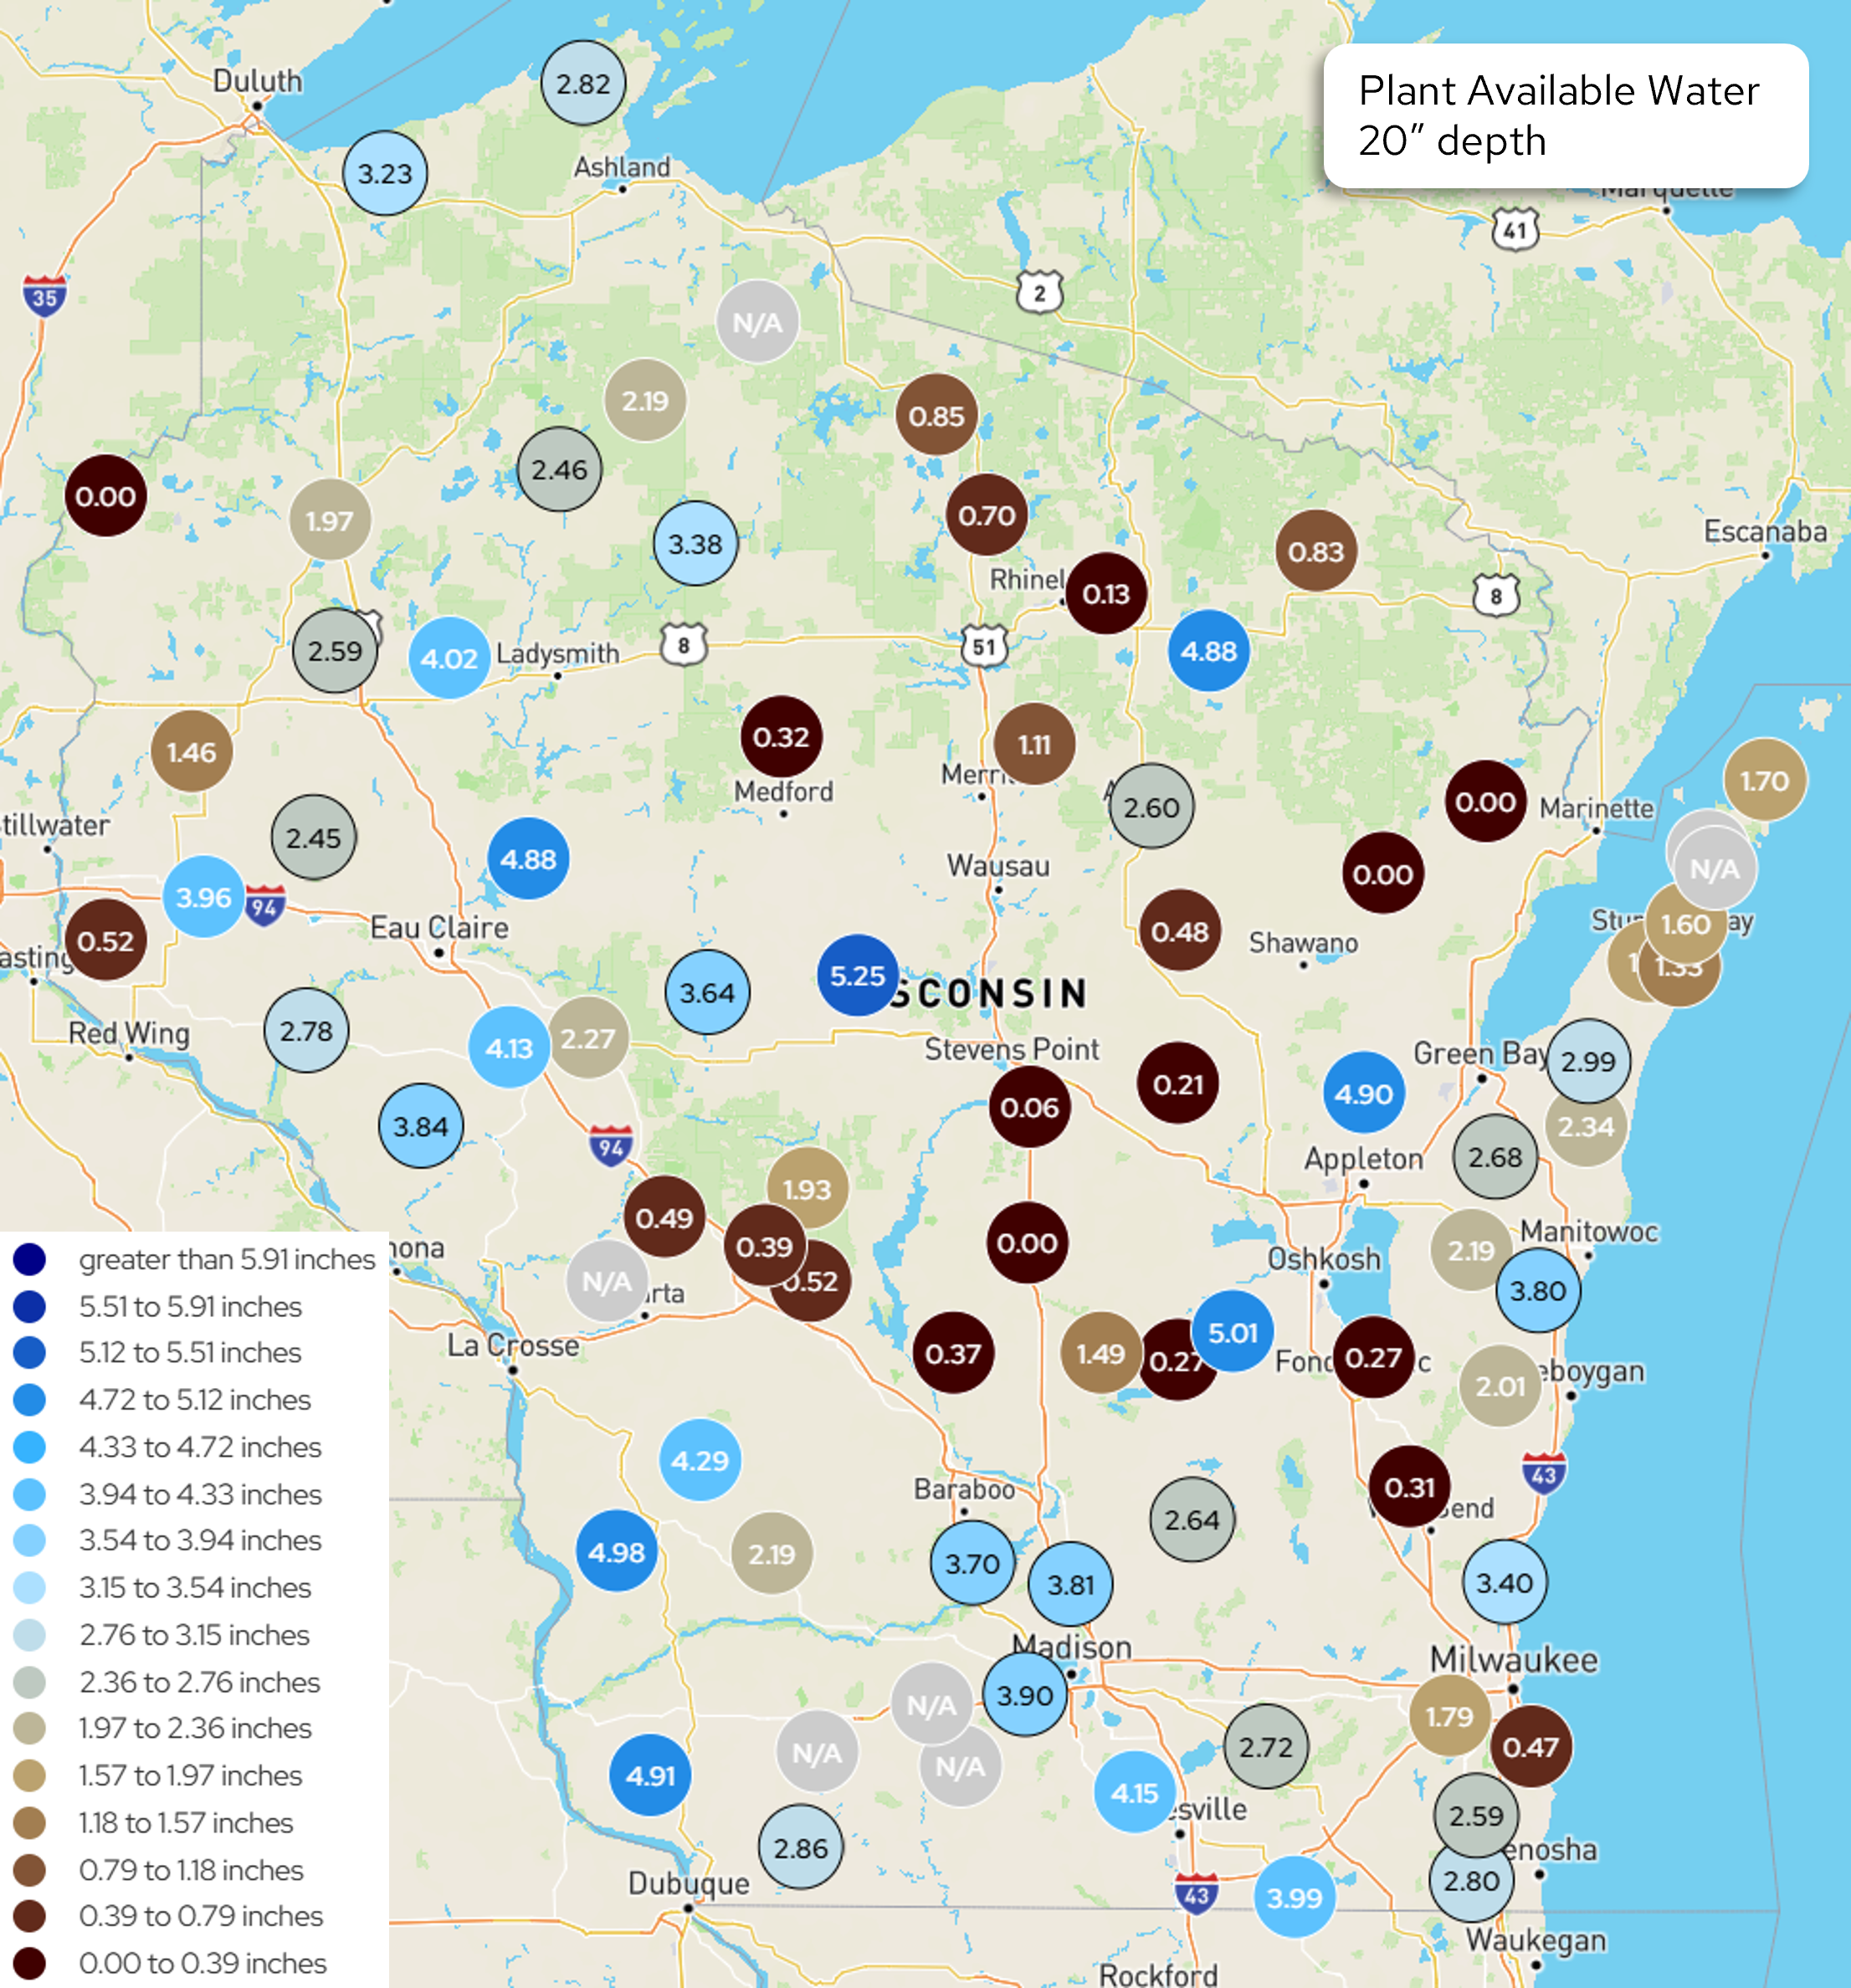
Image Description ↓
Choropleth-style point map of Wisconsin titled “Plant Available Water 20″ depth,” with circular markers at weather/soil monitoring stations across the state, each labeled with a numeric value in inches and color-coded per a 13-category legend ranging from dark red (0.00 to 0.39 inches) through tan/gray midtones (around 1.97 to 2.76 inches) to shades of blue (3.15 inches and above, with the darkest blue reserved for greater than 5.91 inches, though no stations reach that top tier). Some markers are labeled “N/A” in gray for missing data.
Values vary widely by region: western and central Wisconsin near Eau Claire, Stevens Point, and the Wausau area show a mix of high blue values (4.02–5.25) and very low dark-red values (0.06–0.85) in close proximity, indicating high local variability. Northern Wisconsin near Rhinelander and Marinette shows scattered low readings (0.00–0.83) alongside a few moderate blue readings (4.88–4.90). Southern Wisconsin around Madison, Janesville, and the Fox Valley (Appleton, Oshkosh, Fond du Lac) shows generally higher, more moderate blue and gray-tan values (2.59–4.15), with some low outliers (0.27–0.47) near Fond du Lac and Kenosha. The Green Bay and Door County area shows mostly tan and gray mid-range values (1.60–2.99) with several N/A markers. State highways and interstates (35, 94, 43, 41, 51, 8, 2) and major cities (Duluth, Ashland, Eau Claire, La Crosse, Madison, Green Bay, Appleton, Milwaukee) are shown for geographic reference.
- For Wisconet stations included in the chart and table, some locations received 1” or more of rainfall and thus saw larger gains in soil moisture.
- Stations that received a half inch or less saw decreased soil moisture from last week’s report.
- Stations included in the chart and table that are currently in D1 drought are Arlington (Columbia), River Falls (Pierce), Brillion (Calumet), and Porter (Rock).
- The maps (above) show the daily average Wisconet plant available water (inches) on August 3rd.
- The table (below) shows total precipitation and changes in plant available water from July 27th (Start) to August 3rd (End).
- What is plant available water? To learn more, read this article from UW Extension Ag Water Quality on plant available water. There is also a webinar from UW Extension on soil water management that you can watch.
- Example: Imagine that you have 4 inches of soil in the bottom of a bucket. In that soil, there are 1.5 inches of plant available water. Therefore, if you removed the soil and left only the water available for plant roots to take up, you would have 1.5 inches of water in the bottom of the bucket.
- The wilting point is when plant available water is at 0 inches, and the plant can no longer access water at that depth in the soil.
| Wisconet Station | County | Total Precipitation (in.) | 4″ Start | 4″ End | 8″ Start | 8″ End | 20″ Start | 20″ End |
|---|---|---|---|---|---|---|---|---|
| Arlington | Columbia | N/A | 0.11 | 0.83 | 0.52 | 1.61 | 2.84 | 3.93 |
| Brillion | Calumet | 0.52 | 0.05 | 0.27 | 0.24 | 0.52 | 1.65 | 2.00 |
| Hancock | Waushara | 0.97 | 0.00 | 0.03 | 0.00 | 0.13 | 0.00 | 0.12 |
| Lancaster | Grant | 1.99 | 0.60 | 1.00 | 1.33 | 2.06 | 4.43 | 5.16 |
| Marshfield | Marathon | 0.21 | 0.38 | 0.22 | 1.49 | 1.22 | 4.52 | 4.25 |
| Osseo | Trempealeau | 0.30 | 0.56 | 0.40 | 1.24 | 1.00 | 4.04 | 3.75 |
| Porter | Rock | 5.21 | 0.31 | 1.00 | 0.78 | 2.00 | 3.31 | 4.88 |
| Rice Lake | Barron | 0.12 | 0.11 | 0.00 | 0.43 | 0.13 | 1.88 | 1.45 |
| River Falls | Pierce | 1.08 | 0.00 | 0.22 | 0.00 | 0.24 | 0.00 | 0.24 |
| Suring | Oconto | 0.50 | 0.00 | 0.26 | 0.00 | 0.41 | 0.00 | 0.41 |
| Walworth | Walworth | 1.87 | 0.03 | 0.98 | 0.43 | 1.90 | 3.45 | 4.92 |
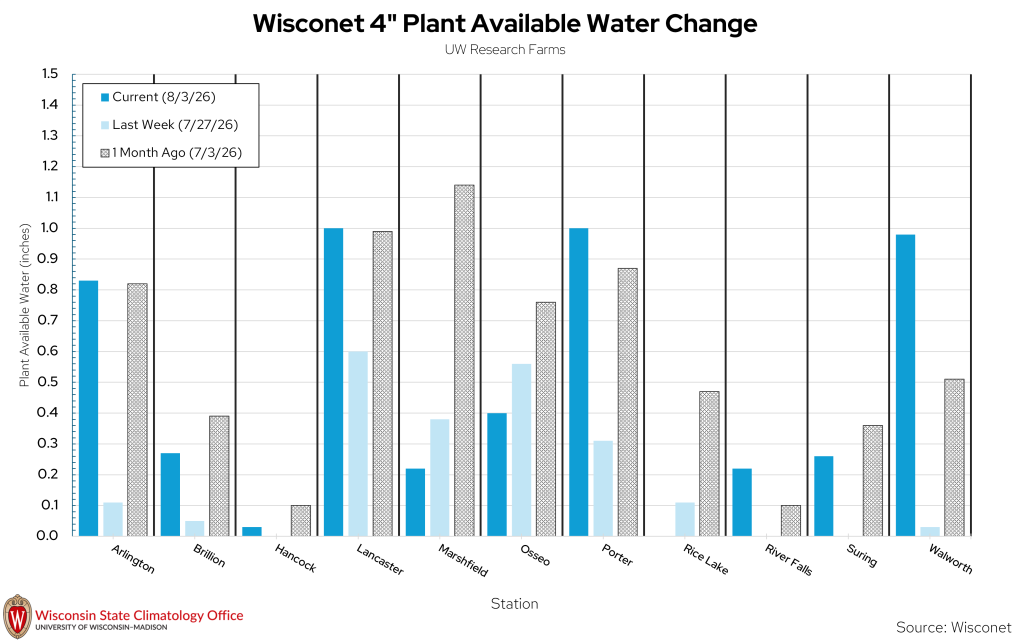
| Wisconet Station | Current 4″ Soil Moisture | Last Week’s 4″ Soil Moisture | 1 Month Ago 4″ Soil Moisture |
|---|---|---|---|
| Arlington | 0.83 | 0.11 | 0.82 |
| Brillion | 0.24 | 0.05 | 0.39 |
| Hancock | 0.03 | 0.00 | 0.10 |
| Lancaster | 1.00 | 0.60 | 0.99 |
| Marshfield | 0.22 | 0.38 | 1.14 |
| Osseo | 0.40 | 0.56 | 0.76 |
| Porter | 1.00 | 0.31 | 0.87 |
| Rice Lake | 0.00 | 0.11 | 0.47 |
| River Falls | 0.22 | 0.00 | 0.10 |
| Suring | 0.26 | 0.00 | 0.36 |
| Walworth | 0.98 | 0.03 | 0.51 |
USDA Soil Moisture Reports
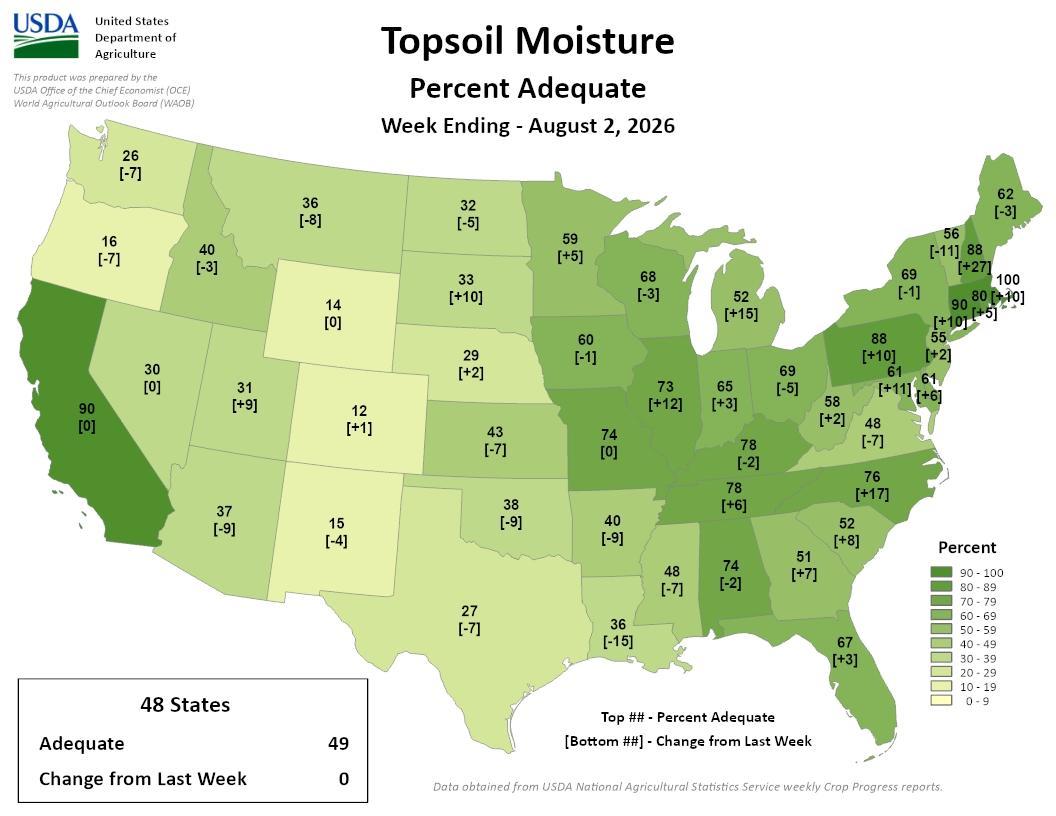
Image Description ↓
Choropleth map of the contiguous United States titled “Topsoil Moisture, Percent Adequate, Week Ending August 2, 2026,” prepared by USDA’s Office of the Chief Economist, World Agricultural Outlook Board. Each state is shaded by percent adequate (scale: 0–9 to 90–100, darker green = higher) and labeled with its percent adequate value and change from the prior week in brackets. Selected values: California 90 [0], Oregon 16 [-7], Washington 26 [-7], Idaho 40 [-3], Nevada 30 [0], Utah 31 [+9], Arizona 37 [-9], New Mexico 15 [-4], Colorado 12 [+1], Wyoming 14 [0], Montana 36 [-8], North Dakota 32 [-5], South Dakota 33 [+10], Nebraska 29 [+2], Kansas 43 [-7], Oklahoma 38 [-9], Texas 27 [-7], Minnesota 59 [+5], Iowa 60 [-1], Missouri 73 [+12], Arkansas 74 [0], Louisiana 40 [-9], Wisconsin 68 [-3], Illinois 74 [-2], Mississippi 48 [-7], Alabama 74 [-2], Michigan 52 [+15], Indiana 65 [+3], Kentucky 78 [-2], Tennessee 78 [+6], Georgia 51 [+7], Florida 67 [+3], Ohio 69 [-5], West Virginia 58 [+2], Virginia 88 [+10], North Carolina 76 [+17], South Carolina 52 [+8], Pennsylvania 61 [+11], New York 69 [-1], New Jersey 61 [+6], Maryland/Delaware area 55 [+2] and 48 [-7], Vermont 56 [-11], New Hampshire 88 [+27], Massachusetts 100, Connecticut/Rhode Island 90 [+10] and 80 [-5], Maine 62 [-3]. A summary box states: 48 states, Adequate 49%, Change from Last Week 0. Data source: USDA National Agricultural Statistics Service weekly Crop Progress reports.
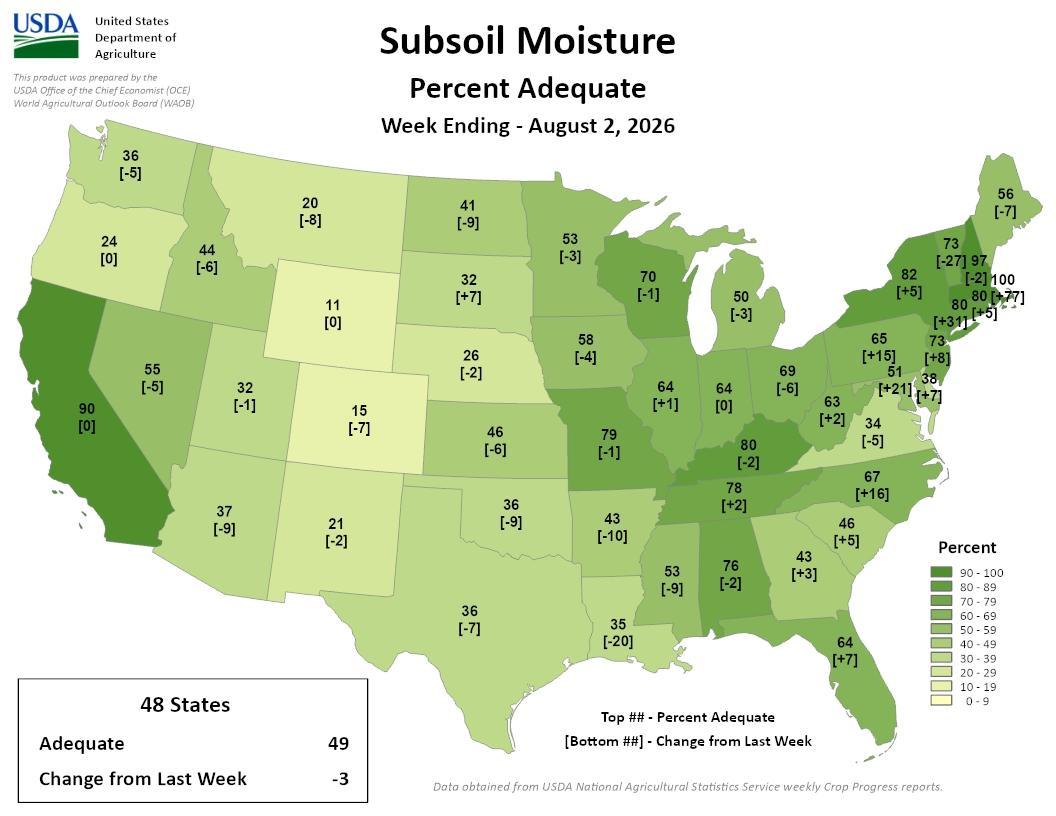
Image Description ↓
Choropleth map of the 48 contiguous US states shading subsoil moisture adequacy from dark green (90-100% adequate) to pale yellow (0-9% adequate), based on USDA National Agricultural Statistics Service weekly Crop Progress reports. Each state shows its percent adequate value and change from the prior week in brackets. Selected values: California 90 [0], Washington 36 [-5], Oregon 24 [0], Idaho 44 [-6], Montana 20 [-8], Wyoming 11 [0], North Dakota 41 [-9], South Dakota 32 [+7], Nebraska 26 [-2], Minnesota 53 [-3], Iowa 70 [-1], Wisconsin 58 [-4], Michigan 50 [-3], New York 82 [+5], Vermont 97 [-2], New Hampshire 100 [+77], Maine 56 [-7], Massachusetts 80 [+31], Connecticut 80 [-5], Pennsylvania 65 [+15], New Jersey 73 [+8], Delaware 51 [+21], Maryland 38 [+7], Ohio 69 [-6], Indiana 64 [+1], Illinois 64 [0], West Virginia 63 [+2], Virginia 34 [-5], North Carolina 67 [+16], South Carolina 46 [+5], Kentucky 80 [-2], Tennessee 78 [+2], Missouri 79 [-1], Arkansas 43 [-10], Mississippi 53 [-9], Alabama 76 [-2], Georgia 43 [+3], Florida 64 [+7], Kansas 36 [-9], Oklahoma 36 [-7], Texas 35 [-20], New Mexico 21 [-2], Colorado 15 [-7], Utah 32 [-1], Nevada 37 [-9], Arizona (not labeled). Overall, 49% of the 48 states report adequate subsoil moisture, a decrease of 3 percentage points from the previous week.
- 68% and 70% of agricultural soils in the state are reported as having adequate topsoil and subsoil moisture. The values decreased from last week’s report.
- 30% and 27% of agricultural soils in the state are reported as having short to very short topsoil and subsoil moisture, respectively. These values increased from last week’s report.
Wisconet Soil Temperature
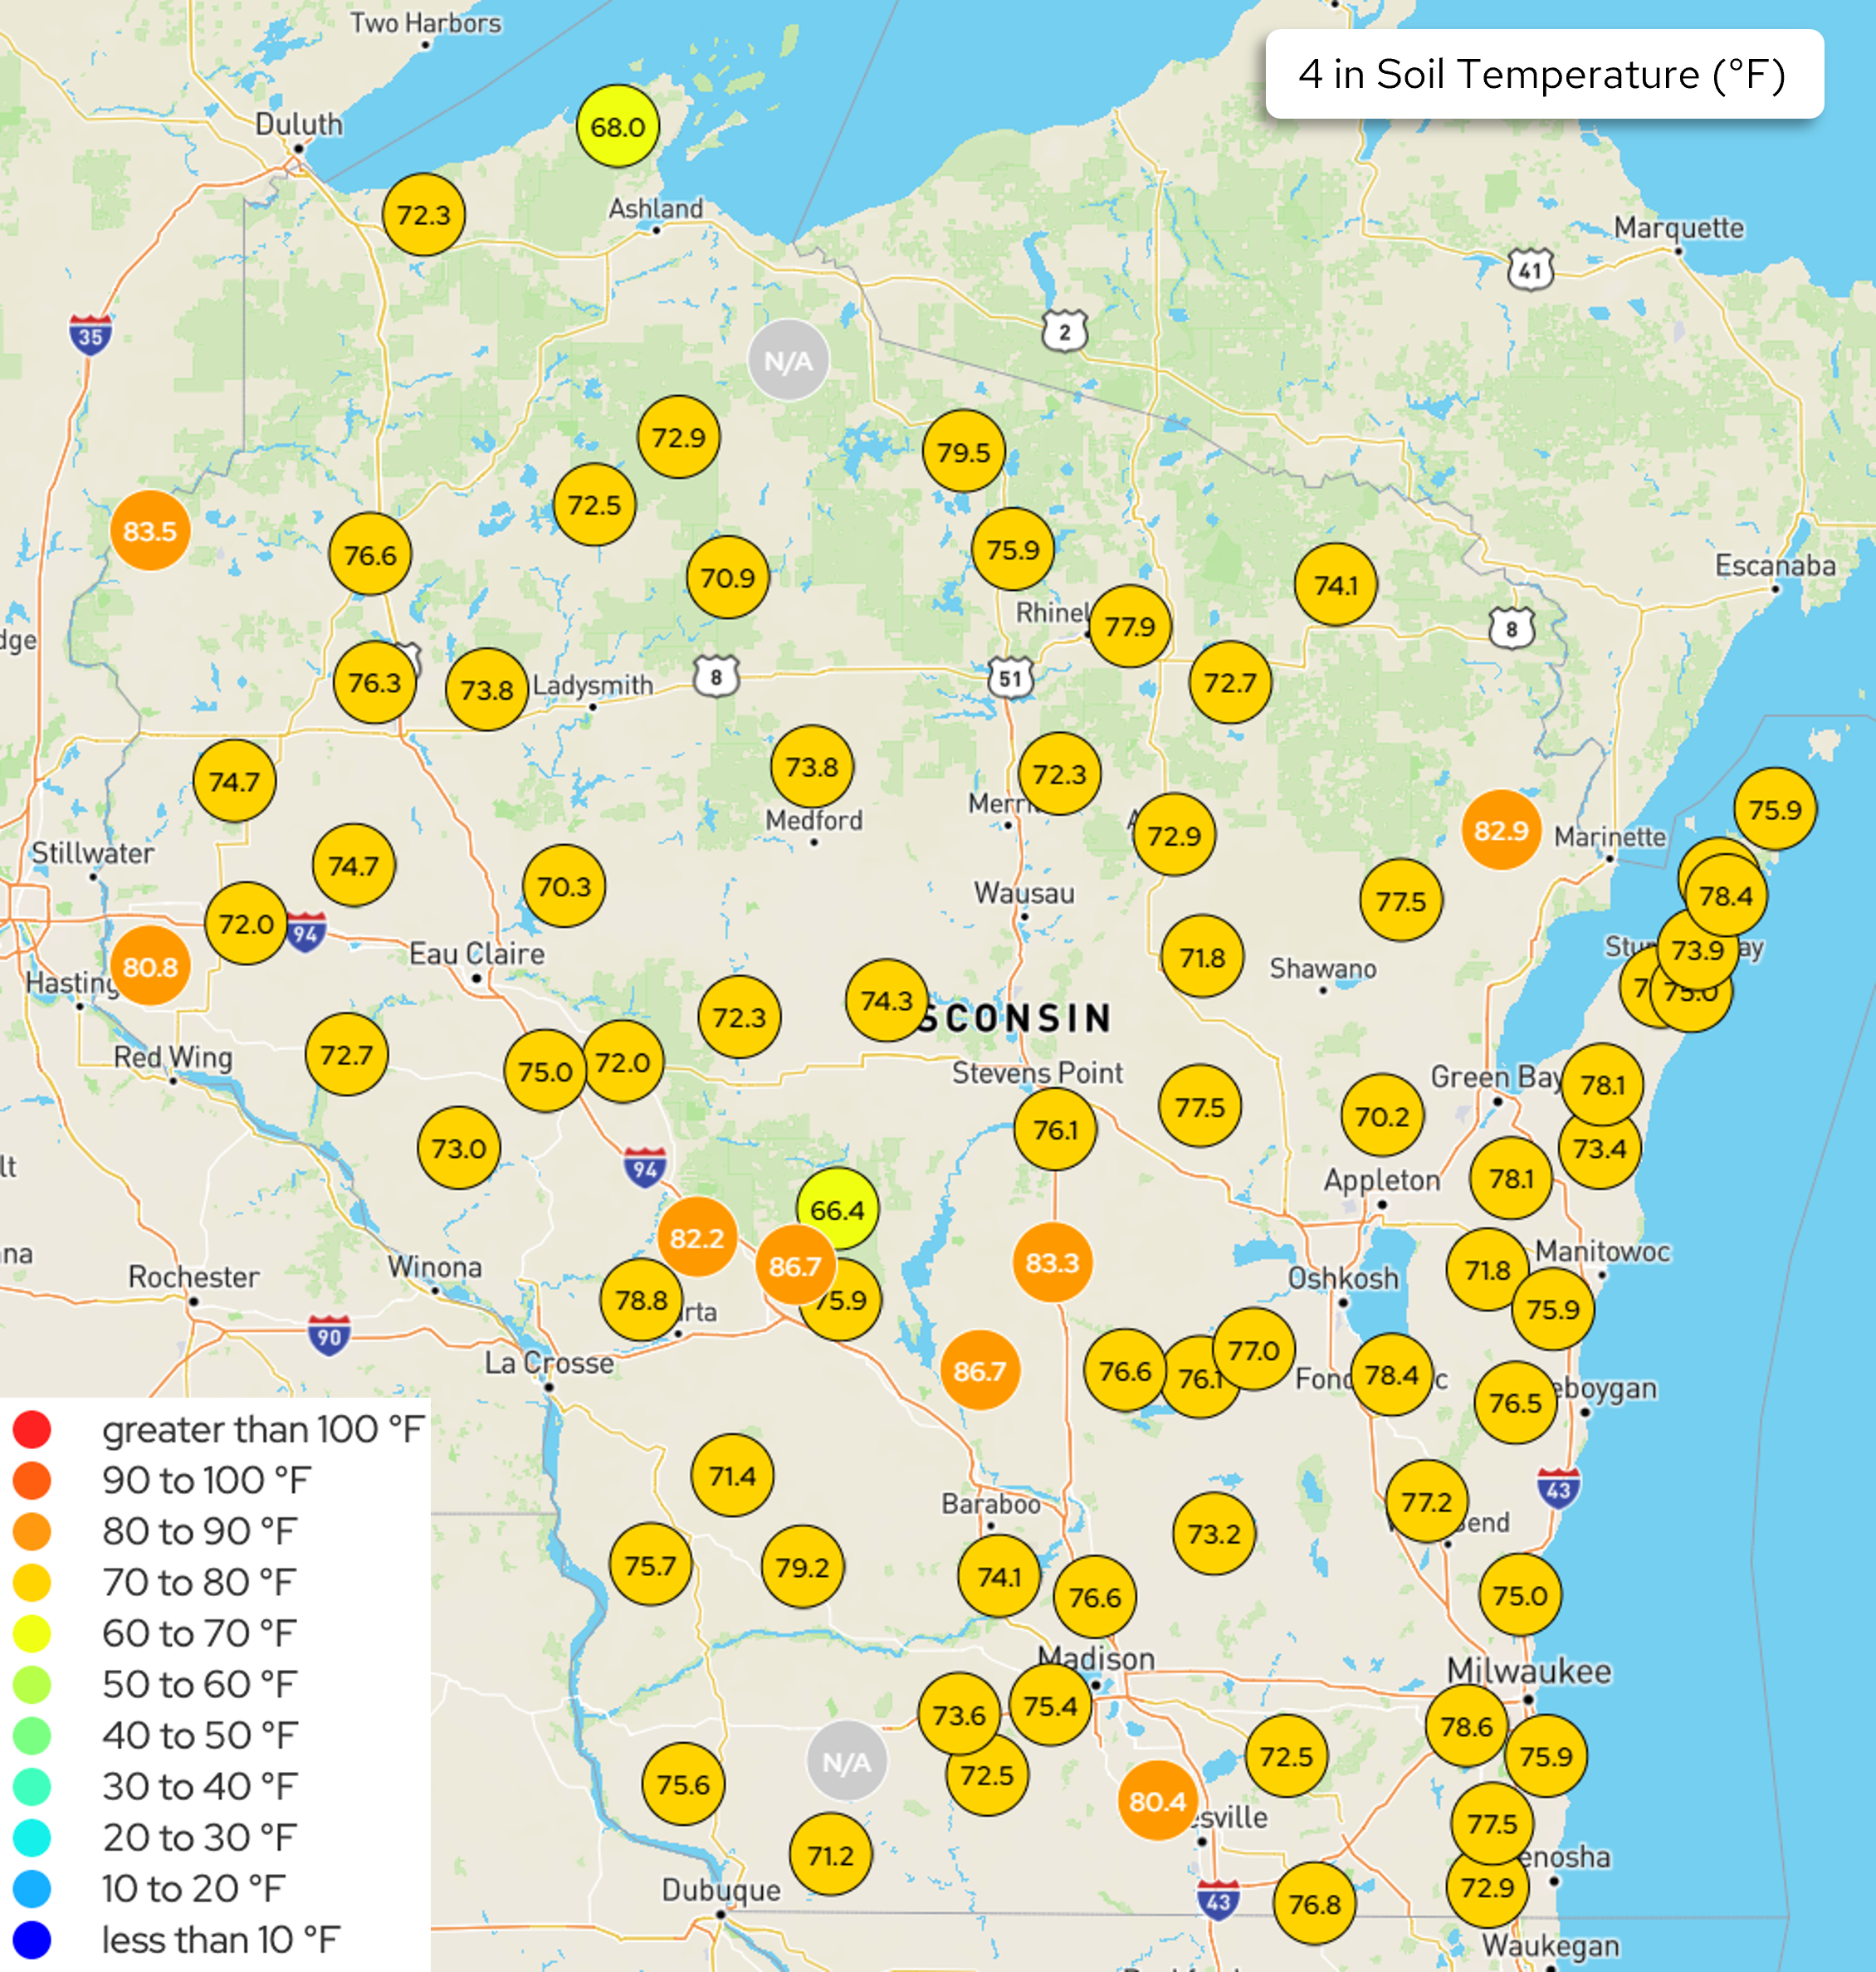
Image Description ↓
Map titled “4 in Soil Temperature (°F)” displaying numbered, color-coded circles at weather station locations across Wisconsin and nearby areas of Minnesota, Iowa, Illinois, and Michigan’s Upper Peninsula. A legend in the lower left ranks temperatures from “less than 10°F” (blue) to “greater than 100°F” (red) in 10-degree increments.
Most stations show readings in the 70s°F (yellow), clustered in central and eastern Wisconsin, including areas near Wausau, Stevens Point, Green Bay, and Milwaukee. Several stations in western and southern Wisconsin show readings in the 80s°F (orange), including 83.5, 86.7, 86.7, 82.2, 83.3, 82.9, 80.8, and 80.4, concentrated near the Mississippi River valley and south-central region. Two stations north of Duluth and near Wisconsin Rapids show cooler readings in the 60s°F (yellow-green): 68.0 and 66.4. Two stations, one north of Medford and one south of Baraboo, are marked “N/A” in gray. No readings fall below 60°F or above 90°F on this map.
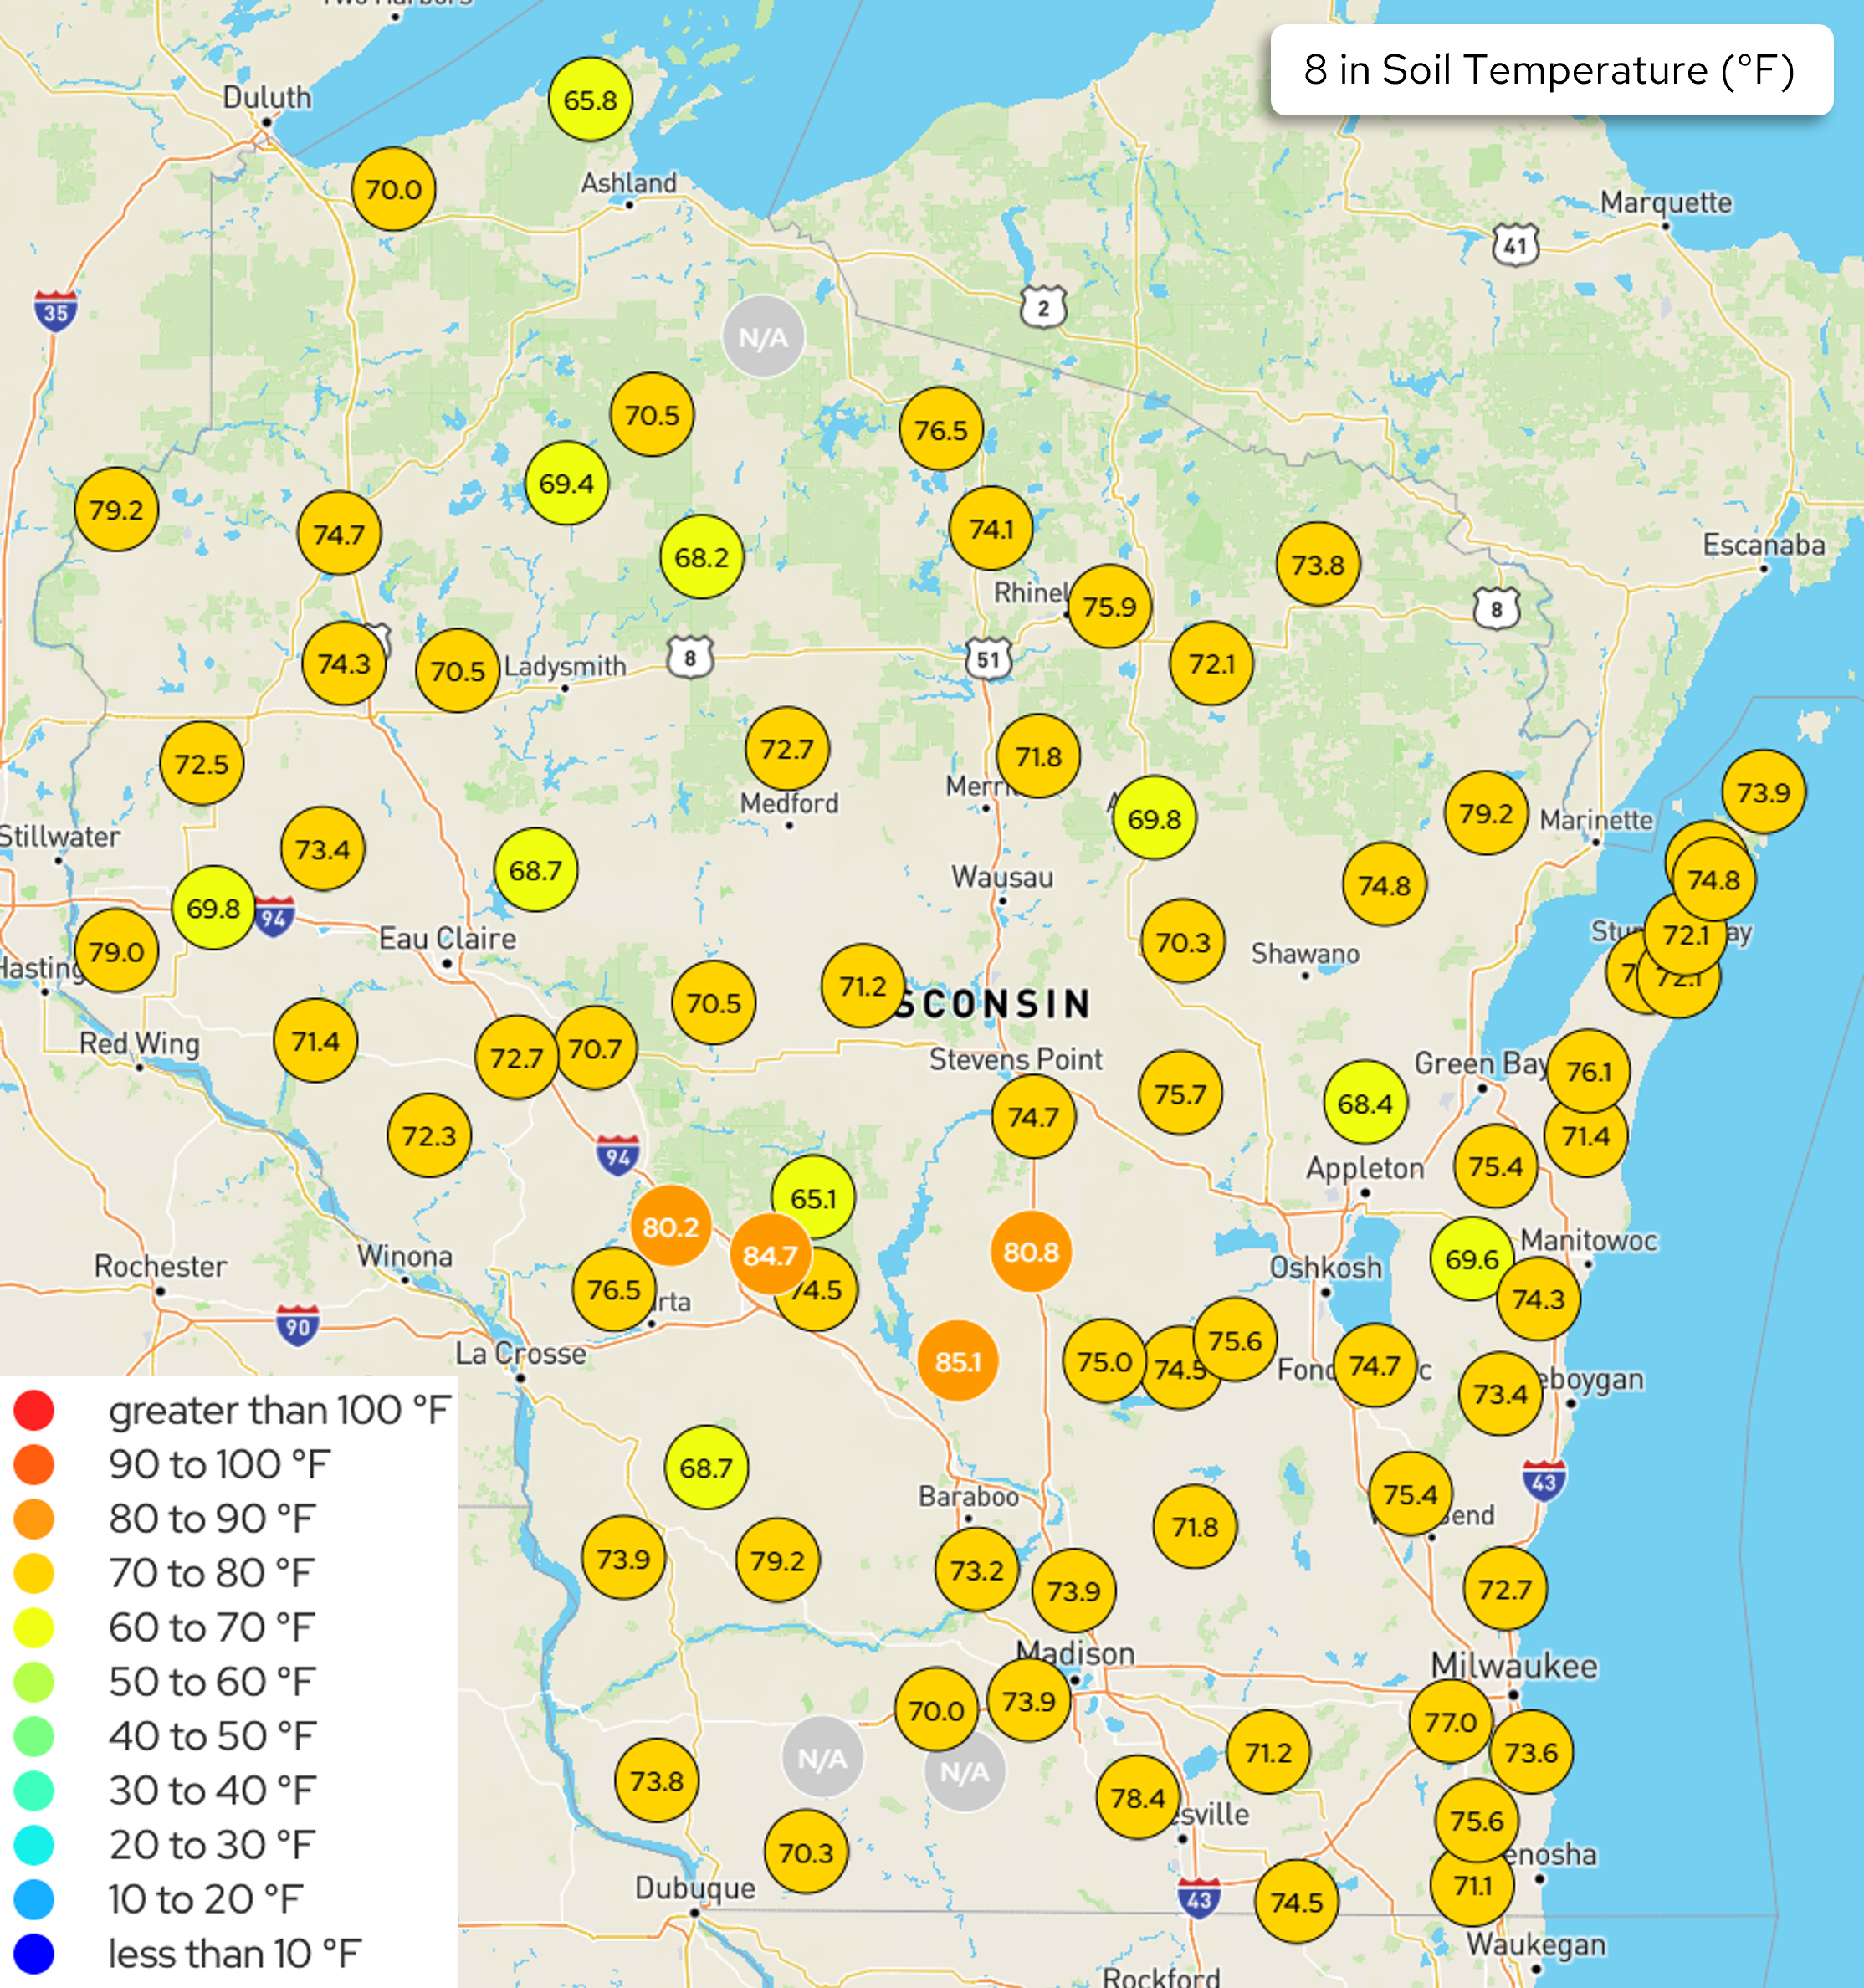
Image Description ↓
Map titled “8 in Soil Temperature (°F)” displaying numbered station markers across Wisconsin and nearby border areas. Most values range 68–80°F (yellow-gold markers, per the “70 to 80°F” and “60 to 70°F” legend categories), with a cluster of higher readings near La Crosse/Tomah in orange (80.2, 84.7, 80.8, 85.1, in the “80 to 90°F” range). A few stations near Rusk County and south-central Wisconsin are marked “N/A” (gray). Legend at bottom left ranges from “greater than 100°F” (red) down to “less than 10°F” (blue), though only the 60–90°F ranges appear on this map. Values are scattered near cities including Duluth, Ashland, Rhinelander, Wausau, Stevens Point, Green Bay, Appleton, Madison, and Milwaukee.
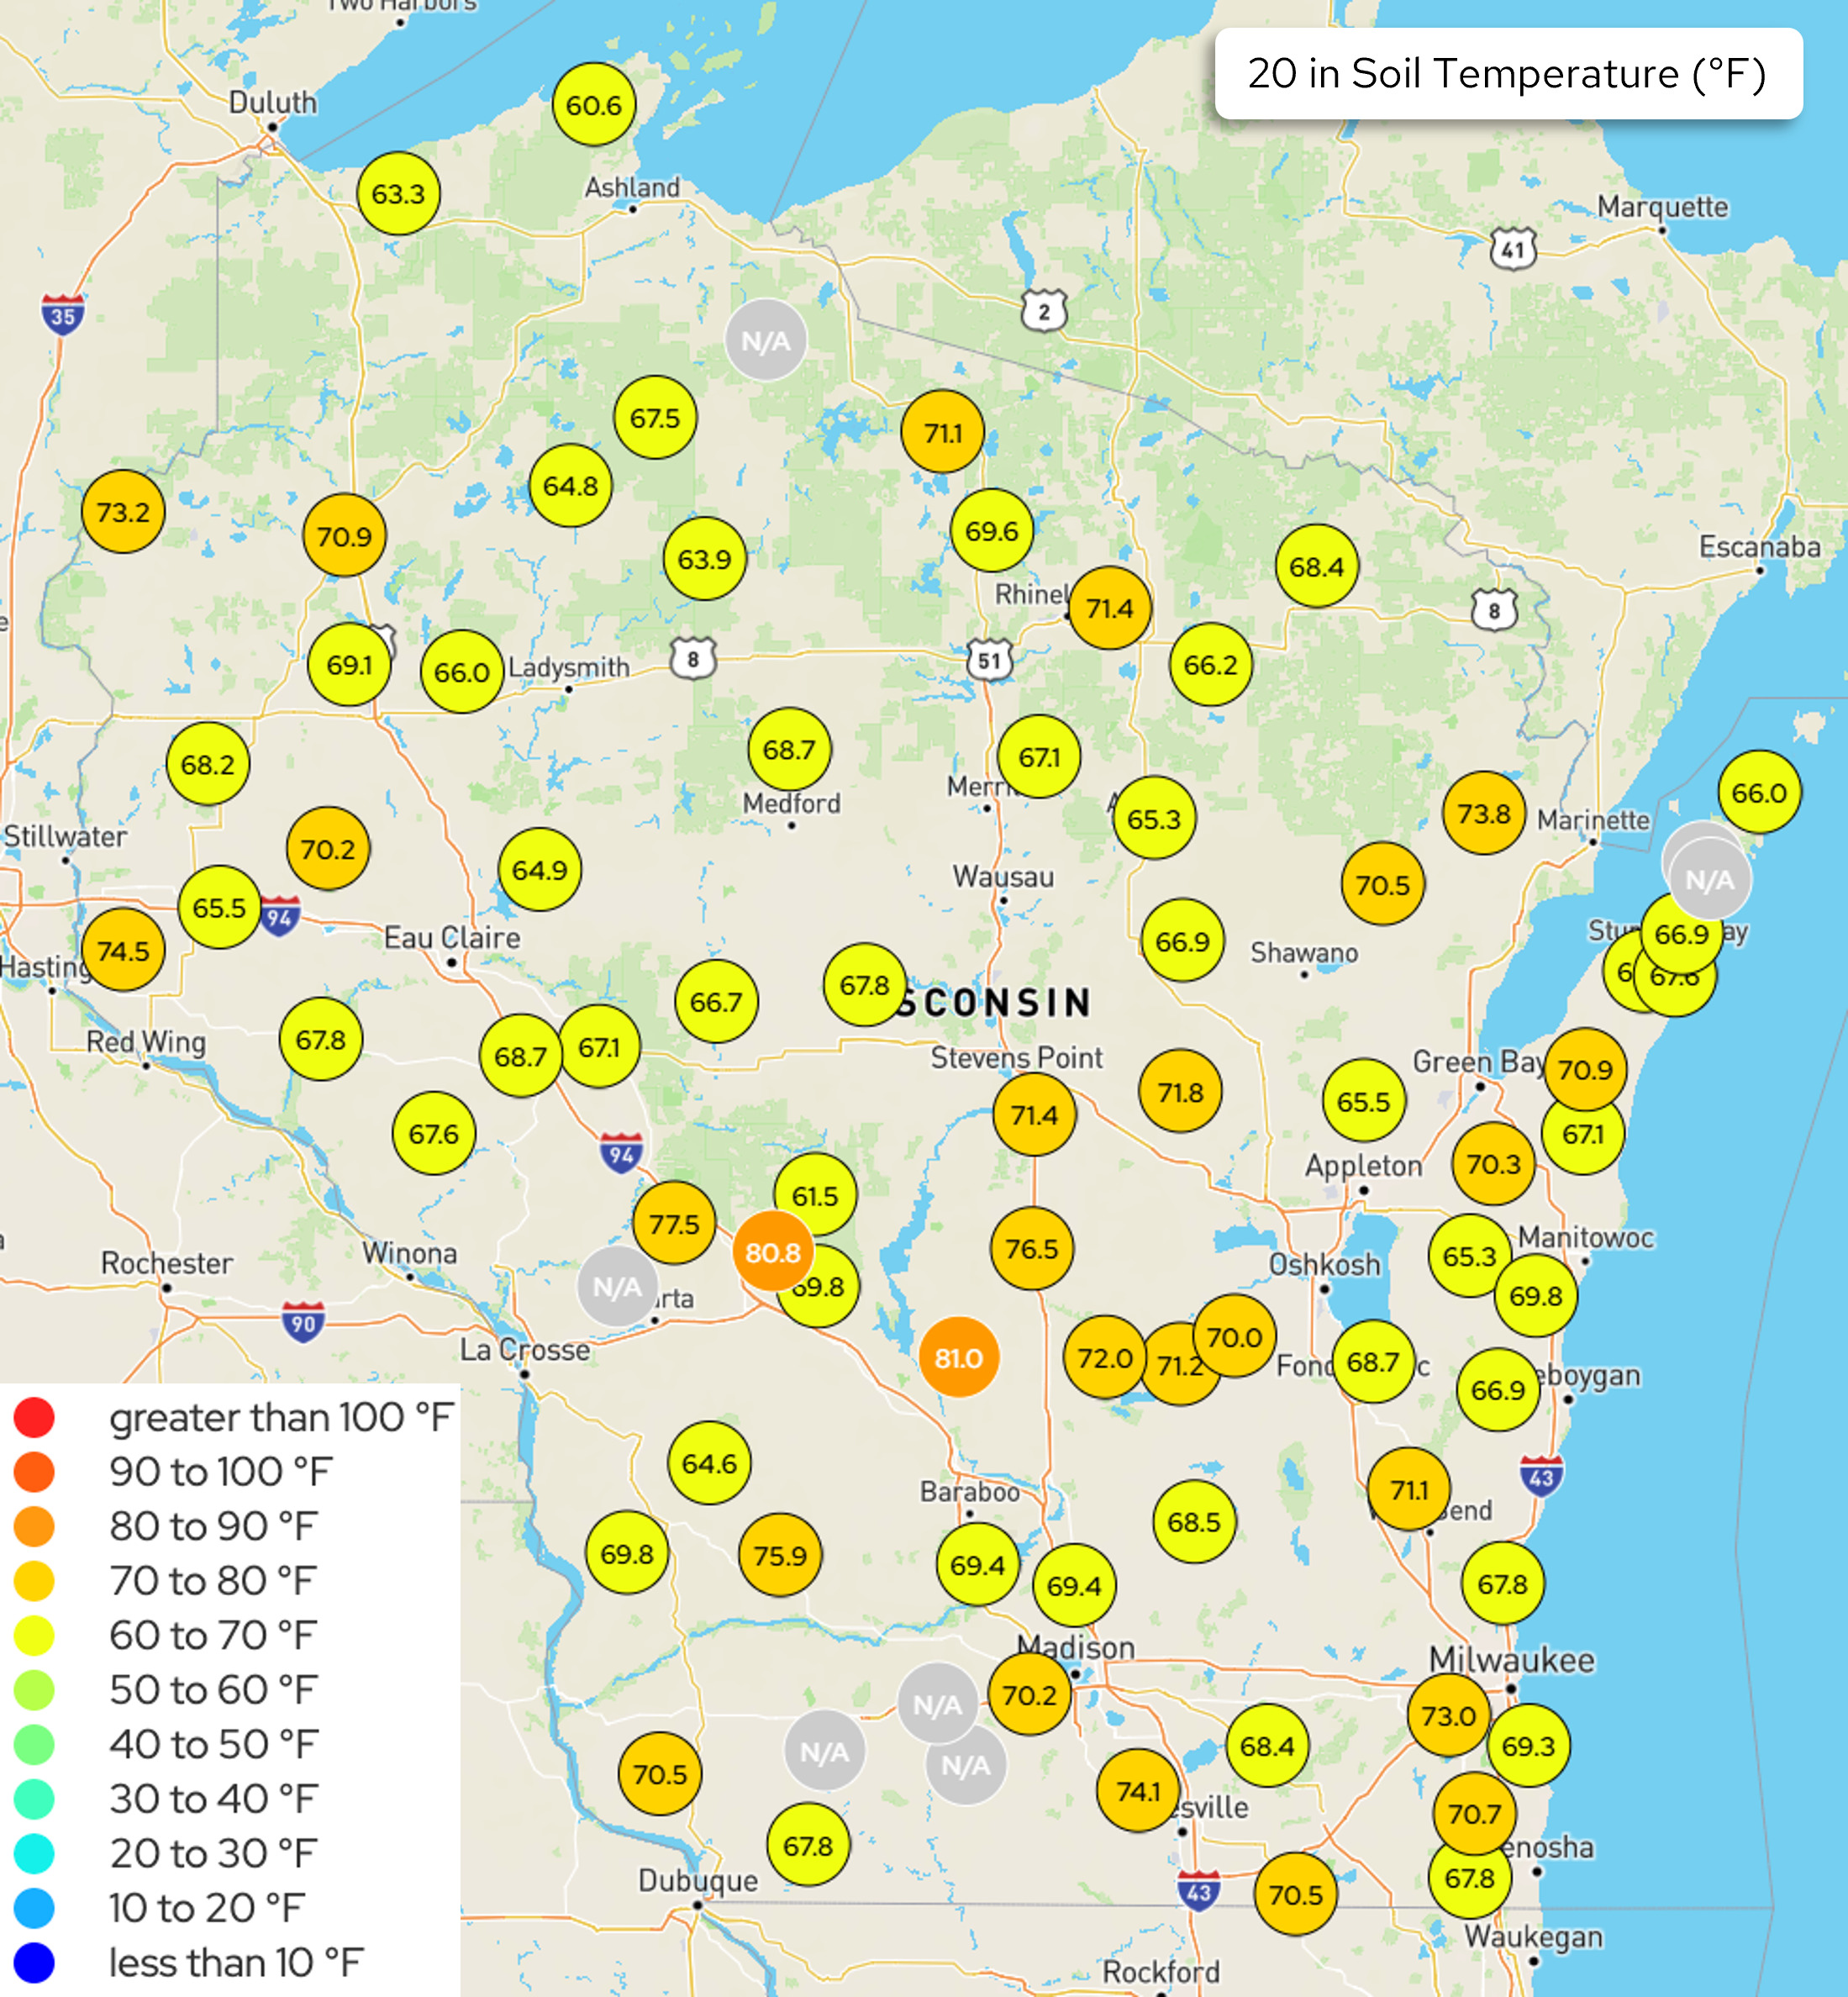
Image Description ↓
Map titled “20 in Soil Temperature (°F)” displays circular data markers across Wisconsin and nearby border areas, color-coded by a legend ranging from “less than 10°F” (blue) to “greater than 100°F” (red). Most stations across northern and central Wisconsin show yellow markers (60-70°F), with readings such as 60.6, 63.3, 64.8, 67.5, and 68.7. South-central Wisconsin near stations by Madison and the Wisconsin Dells area shows several orange markers (80-90°F), including 80.8 and 81.0, along with gold markers (70-80°F) like 77.5, 76.5, and 75.9. Southeastern Wisconsin near Milwaukee and Kenosha shows a mix of yellow and gold markers in the high 60s to low 70s, with a few gold markers reaching 73.0 and 74.1. A handful of stations, mostly near Eau Claire, Baraboo, and the Door County peninsula, display gray “N/A” markers indicating no data. No markers appear in the red, teal, or blue temperature ranges.
- The maps show daily average Wisconet soil temperature conditions on August 3rd.
U.S. Drought Monitor
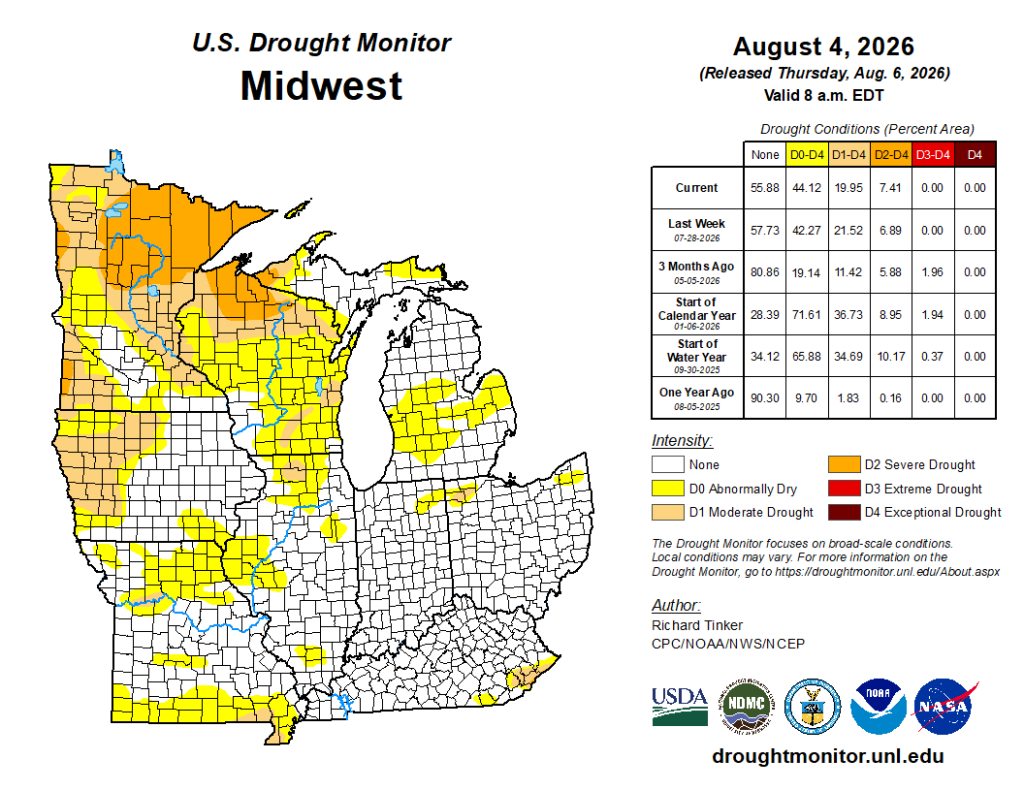
Image Description ↓
Map titled U.S. Drought Monitor: Midwest (August 4, 2026, Valid 8 a.m. EDT). The northern portion of the Midwest—including northern Minnesota, northern Wisconsin, and parts of Upper Michigan—is covered in yellow (D0 Abnormally Dry), tan (D1 Moderate Drought), and orange (D2 Severe Drought). The southern half of the region (including Iowa, Illinois, Indiana, Missouri, Ohio, and Kentucky) is largely free of drought, with scattered yellow patches of abnormal dryness in southern Illinois and Missouri.
Data Summary Table (Drought Conditions – Percent Area):
- Current (08-04-2026): None: 55.88%, D0–D4: 44.12%, D1–D4: 19.95%, D2–D4: 7.41%, D3–D4: 0.00%, D4: 0.00%
- Last Week (07-28-2026): None: 57.73%, D0–D4: 42.27%, D1–D4: 21.52%, D2–D4: 6.89%, D3–D4: 0.00%, D4: 0.00%
- 3 Months Ago (05-05-2026): None: 80.86%, D0–D4: 19.14%, D1–D4: 11.42%, D2–D4: 5.88%, D3–D4: 1.96%, D4: 0.00%
- Start of Calendar Year (01-06-2026): None: 28.39%, D0–D4: 71.61%, D1–D4: 36.73%, D2–D4: 8.95%, D3–D4: 1.94%, D4: 0.00%
- Start of Water Year (09-30-2025): None: 34.12%, D0–D4: 65.88%, D1–D4: 34.69%, D2–D4: 10.17%, D3–D4: 0.37%, D4: 0.00%
- One Year Ago (08-05-2025): None: 90.30%, D0–D4: 9.70%, D1–D4: 1.83%, D2–D4: 0.16%, D3–D4: 0.00%, D4: 0.00%
Author: Richard Tinker, CPC/NOAA/NWS/NCEP.
Partners: USDA, NDMC, NOAA, NASA.
Compared to last week:
- Midwest: Drought coverage changed slightly from last week’s report, with D1-D4 coverage decreasing by 1-2%. Areas of improvement included southern MN, southeast WI, and northern IL.
- 80.0% of the Midwest region is drought free (~20.0% in D1-D4).
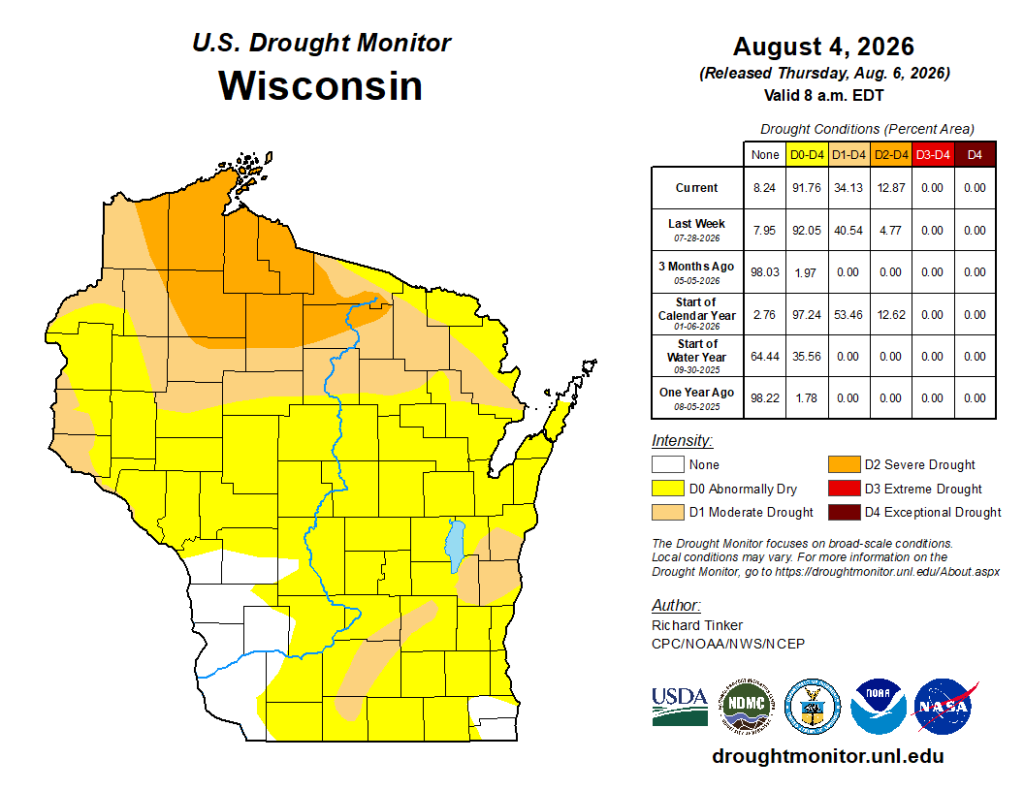
Image Description ↓
Title: U.S. Drought Monitor Class Change – Wisconsin (1 Week: August 4, 2026 compared to July 28, 2026).
Map area: Most of Wisconsin is shaded grey, indicating no change in drought class. Northern Wisconsin shows a curved band of yellow, representing a 1-class degradation. Southeastern and south-central Wisconsin show patches of light green, indicating a 1-class improvement in drought status over the 1-week period.
Source: National Drought Mitigation Center / droughtmonitor.unl.edu.
- Wisconsin: D1-D4 coverage decreased by over 6% from last week due to improved conditions in the southeast. However, D2 coverage expanded in the far north.
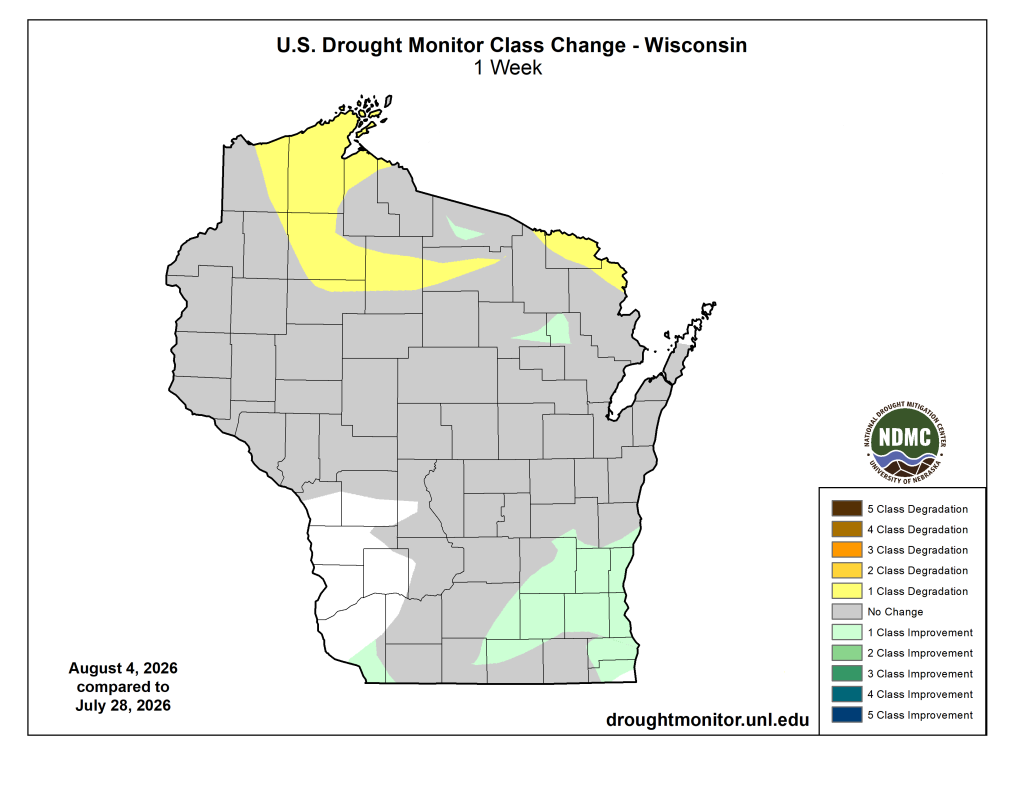
Image Description ↓
Title: U.S. Drought Monitor: Wisconsin (August 4, 2026, Valid 8 a.m. EDT).
Map area: Central and southern Wisconsin are predominantly shaded in yellow (D0 Abnormally Dry). Northern Wisconsin features a belt of tan (D1 Moderate Drought) and orange (D2 Severe Drought) stretching across northern counties. A small area in extreme south-central Wisconsin and northwestern corner shows no drought (white).
Data Summary Table (Drought Conditions – Percent Area):
- Current (08-04-2026): None: 8.24%, D0–D4: 91.76%, D1–D4: 34.13%, D2–D4: 12.87%, D3–D4: 0.00%, D4: 0.00%
- Last Week (07-28-2026): None: 7.95%, D0–D4: 92.05%, D1–D4: 40.54%, D2–D4: 4.77%, D3–D4: 0.00%, D4: 0.00%
- 3 Months Ago (05-05-2026): None: 98.03%, D0–D4: 1.97%, D1–D4: 0.00%, D2–D4: 0.00%, D3–D4: 0.00%, D4: 0.00%
- Start of Calendar Year (01-06-2026): None: 2.76%, D0–D4: 97.24%, D1–D4: 53.46%, D2–D4: 12.62%, D3–D4: 0.00%, D4: 0.00%
- Start of Water Year (09-30-2025): None: 64.44%, D0–D4: 35.56%, D1–D4: 0.00%, D2–D4: 0.00%, D3–D4: 0.00%, D4: 0.00%
- One Year Ago (08-05-2025): None: 98.22%, D0–D4: 1.78%, D1–D4: 0.00%, D2–D4: 0.00%, D3–D4: 0.00%, D4: 0.00%
Author: Richard Tinker, CPC/NOAA/NWS/NCEP.
Partners: USDA, NDMC, NOAA, NASA.
- There was 1 class degradation in parts of the north. SE WI saw 1 class improvement.
U.S. Drought Monitor Time Series
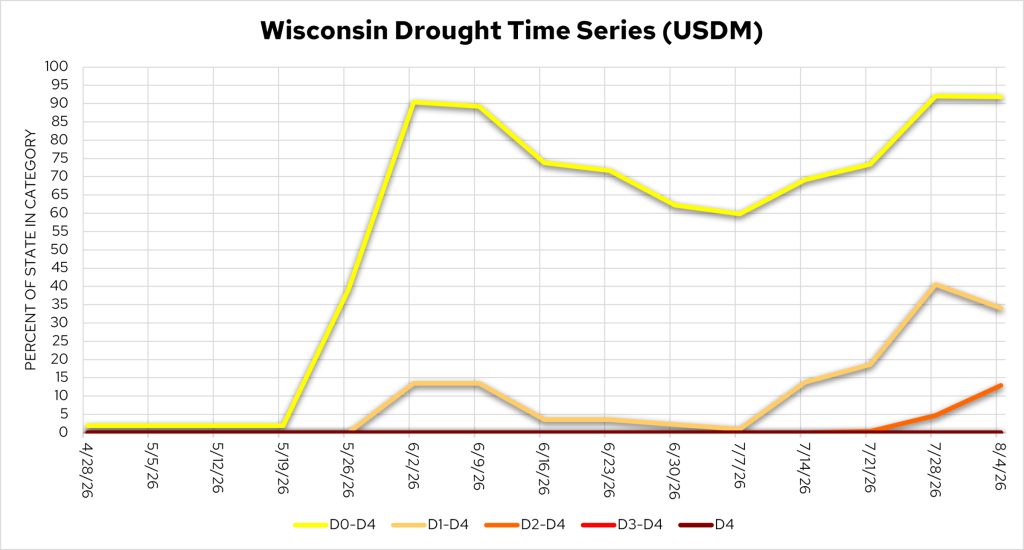
Image Description ↓
Title: Wisconsin Drought Time Series (USDM) (4/28/26 to 8/4/26).
Chart Details: X-axis: Weekly dates from 4/28/26 to 8/4/26. Y-axis: Percent of State in Category (0 to 100%).
Trends:
- D0–D4 (Abnormally Dry to Exceptional Drought, yellow line): Started near 2% in late April/May, surged rapidly to ~90% on 6/2/26, dipped slightly to ~60% in early July, then climbed back to ~92% by late July through 8/4/26.
- D1–D4 (Moderate Drought, light orange line): Stayed at 0% until late May, rose to ~13% in early June, dropped to ~2% in early July, then surged to ~40% on 7/28/26 before dropping slightly to ~34% on 8/4/26.
- D2–D4 (Severe Drought, dark orange line): Remained at 0% through mid-July, then increased to ~5% on 7/28/26 and ~13% on 8/4/26.
- D3–D4 and D4 (Extreme and Exceptional Drought): Remained at 0% throughout the entire period.
- D0 coverage = 92.1%; D1 coverage = 40.5%; D2 coverage = 4.8%
Temperature Trends
7 Day Temperatures
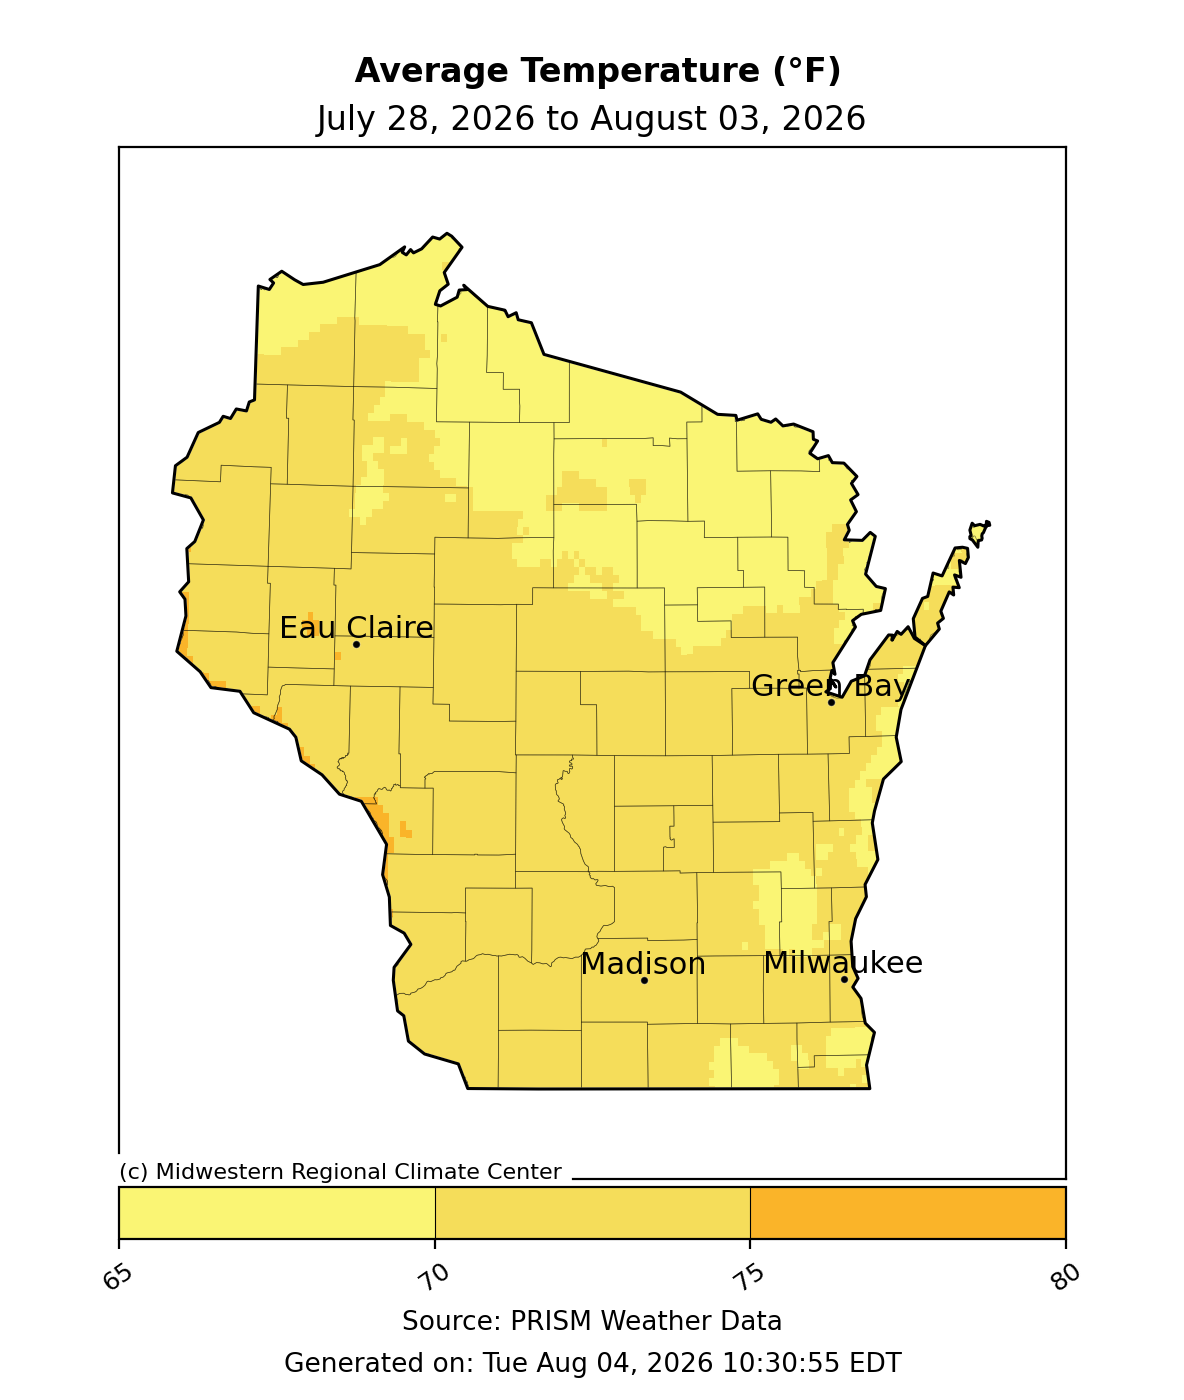
Image Description ↓
Choropleth map titled “Average Temperature (°F), July 28, 2026 to August 03, 2026,” sourced from PRISM Weather Data via the Midwestern Regional Climate Center, generated Aug 4, 2026. Wisconsin is shaded in a yellow-to-orange gradient scale from 65°F to 80°F. Most of the state, including the northern and central regions, falls in the 65–70°F (pale yellow) range. Southern and southwestern Wisconsin, along with areas near Lake Michigan and Green Bay, show slightly warmer readings around 70–75°F (deeper yellow/gold). Small isolated pockets in the southwest near the Mississippi River show the warmest temperatures, approaching 75–80°F (orange). Four cities are labeled with markers: Eau Claire (west-central), Green Bay (northeast, on the bay), Madison (south-central), and Milwaukee (southeast, on Lake Michigan). No location shows temperatures below 65°F or above 80°F.
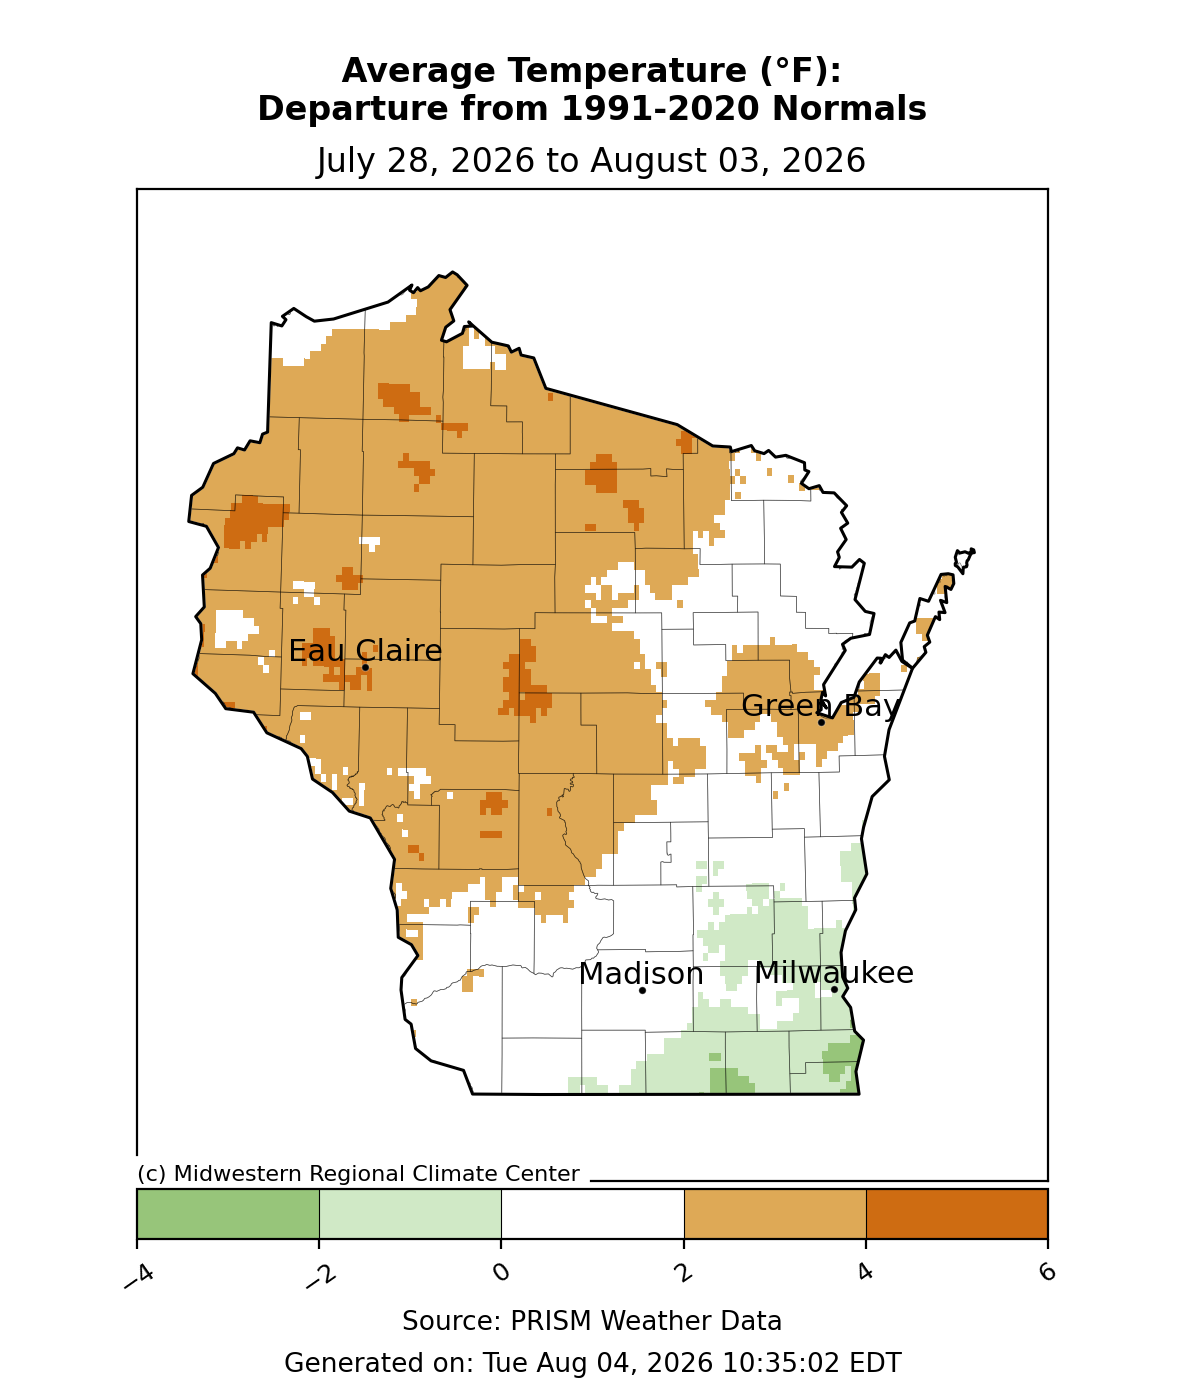
Image Description ↓
Choropleth map titled “Average Temperature (°F): Departure from 1991-2020 Normals, July 28, 2026 to August 03, 2026,” sourced from MRCC/PRISM Weather Data. A 5-category color scale ranges from dark green (-4°F) through light green (-2°F), white (0°F), light orange (2°F), to dark orange (6°F). The northern, central, and western two-thirds of Wisconsin show orange shading, indicating temperatures 2–6°F above normal, with darker orange pockets (4–6°F above normal) near Eau Claire and inland from Green Bay. The southern and southeastern portion of the state, including areas south of Madison and around Milwaukee, shows white to light green shading, indicating temperatures near normal to about 2°F below normal. City markers are labeled for Eau Claire, Green Bay, Madison, and Milwaukee. Footer text reads “Source: PRISM Weather Data” and “Generated on: Tue Aug 04, 2026 10:35:02 EDT.”
- Average temperatures were 70-75°F across most of Wisconsin. Further north and east, temperatures were in the mid-to-upper 60s.
- Temperatures were within -/+2°F of normal in southern and eastern counties.
- Further north and west, temperatures were typically 2-4°F above normal.
30 Day Temperatures
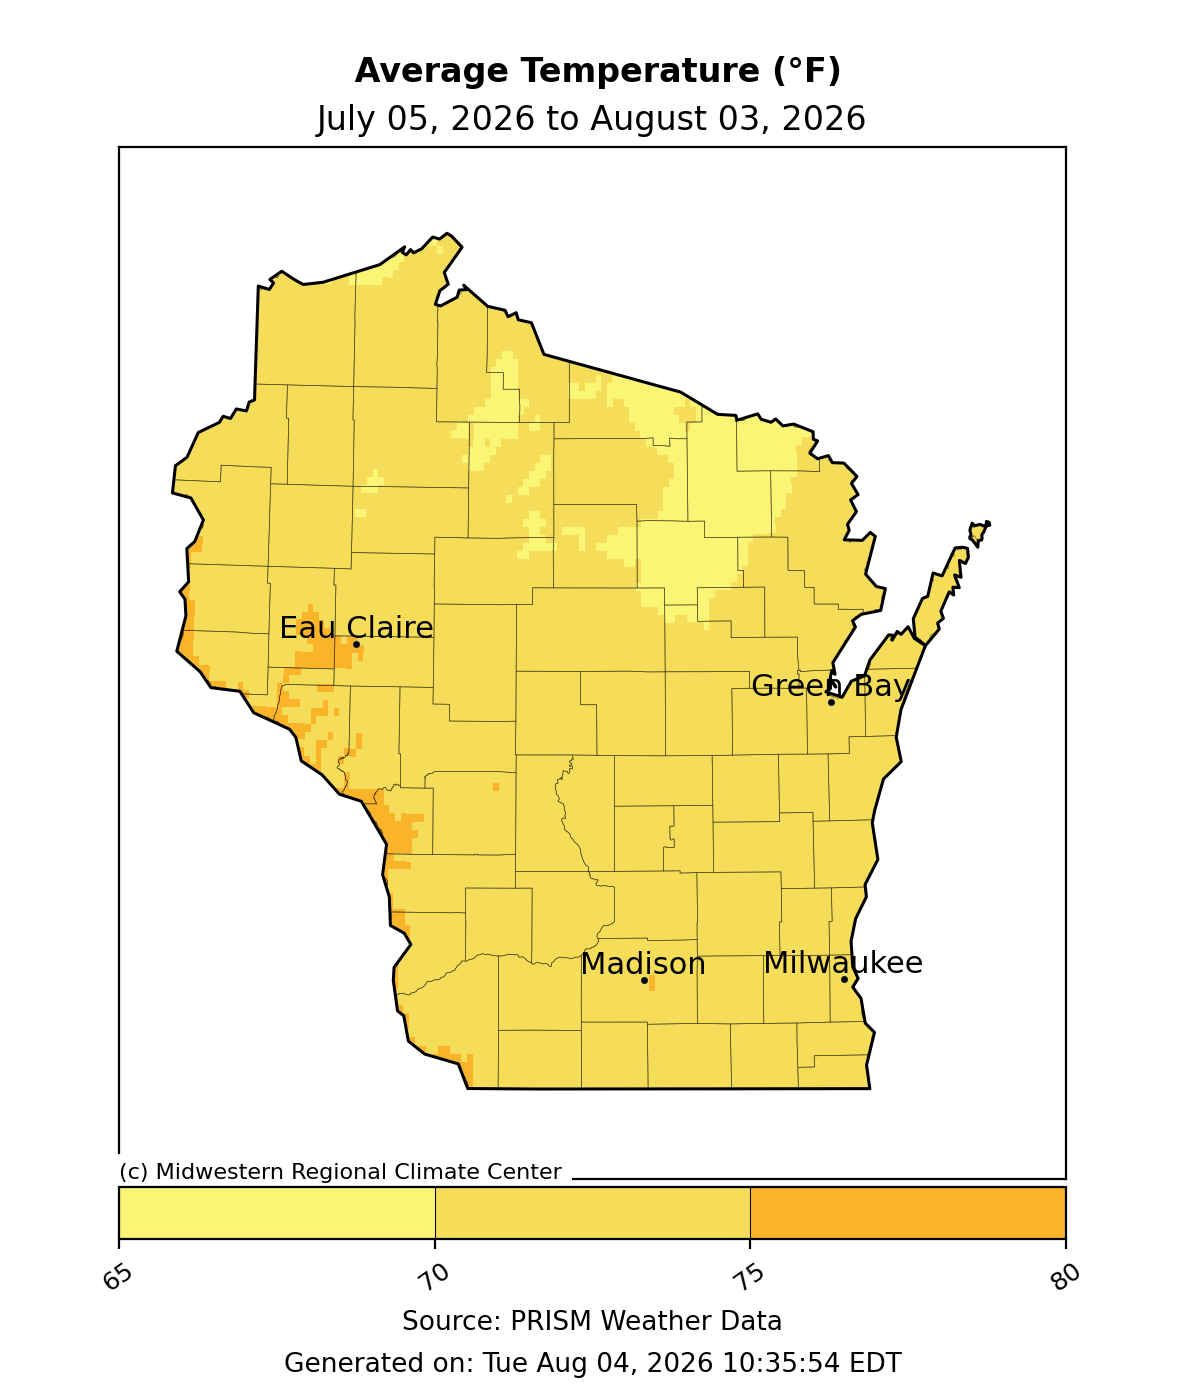
Image Description ↓
Choropleth map titled “Average Temperature (°F), July 05, 2026 to August 03, 2026” from the Midwestern Regional Climate Center, sourced from PRISM Weather Data. Most of Wisconsin shows 70–75°F (medium yellow). A pale yellow band of 65–70°F stretches across the north-central/northeastern counties. Small pockets of 75–80°F (orange) appear near Eau Claire and along the western border by the Mississippi River. Madison, Milwaukee, Green Bay, and Eau Claire are marked with dots and labels. Generated Tue Aug 04, 2026, 10:35:54 EDT.
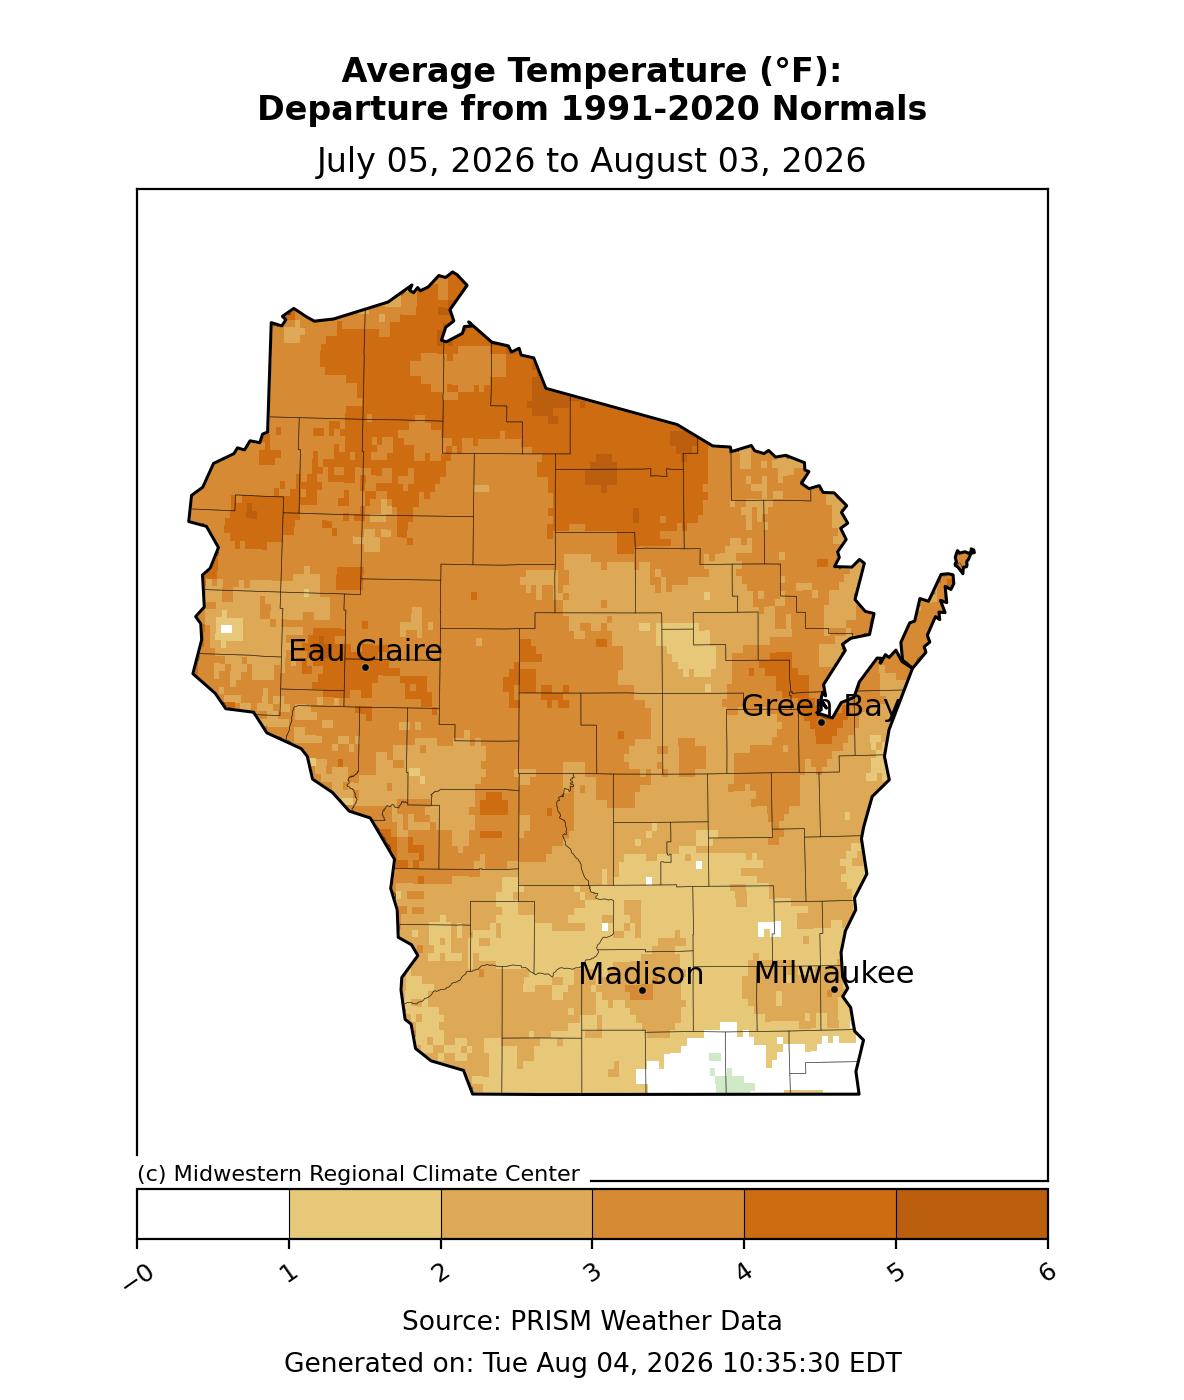
Image Description ↓
Choropleth map of Wisconsin titled “Average Temperature (°F): Departure from 1991-2020 Normals,” for the period July 05, 2026 to August 03, 2026. A color scale from white (0°F) through tan and orange to dark brown (6°F) shows departure from normal average temperature. Most of the state shows departures of 2–5°F above normal, with the darkest orange/brown shading (4–6°F) concentrated in the northern third of the state and along parts of the Lake Michigan shoreline near Green Bay. Central and south-central Wisconsin, including areas near Madison, show more moderate departures of roughly 1–3°F, with a few small near-normal (white) patches near the Illinois border and scattered small white spots elsewhere (likely missing data). Cities labeled with point markers: Eau Claire, Green Bay, Madison, and Milwaukee. Source: PRISM Weather Data. Credit: (c) Midwestern Regional Climate Center. Generated on Tue Aug 04, 2026 10:35:30 EDT.
Growing Degree Days (Base 50°F)
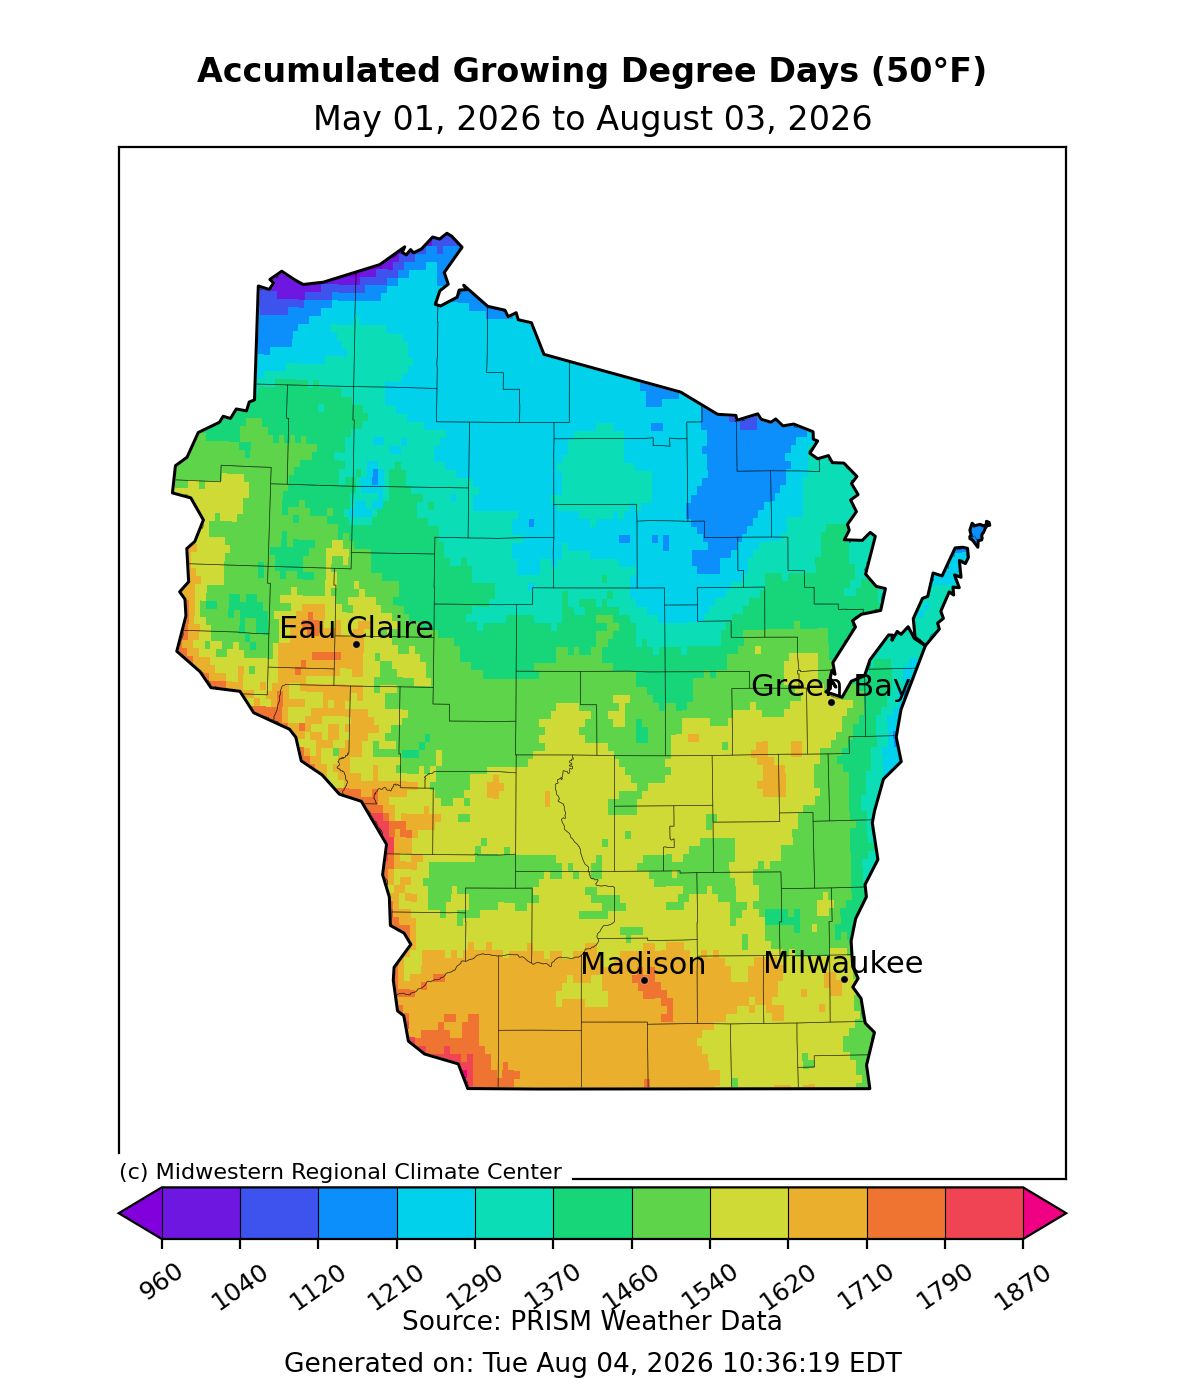
Image Description ↓
Color-coded map of Wisconsin titled “Accumulated Growing Degree Days (50°F),” showing accumulation from May 01, 2026 to August 03, 2026, sourced from PRISM Weather Data via the Midwestern Regional Climate Center. A color scale from purple (960 GDD) through blue, teal, green, yellow, orange, to red (1870 GDD) indicates accumulation levels. The northernmost part of the state shows the lowest values (purple/blue, ~960–1200), transitioning through teal and green in the central region, to yellow and orange in the south, with the highest values (orange/red, ~1700–1870) in the far southwest corner. Four cities are labeled with markers: Eau Claire in west-central Wisconsin (green/yellow zone), Green Bay in the northeast (teal zone), and Madison and Milwaukee in the south (orange/yellow zone). Chart generated Tue Aug 04, 2026, 10:36:19 EDT.
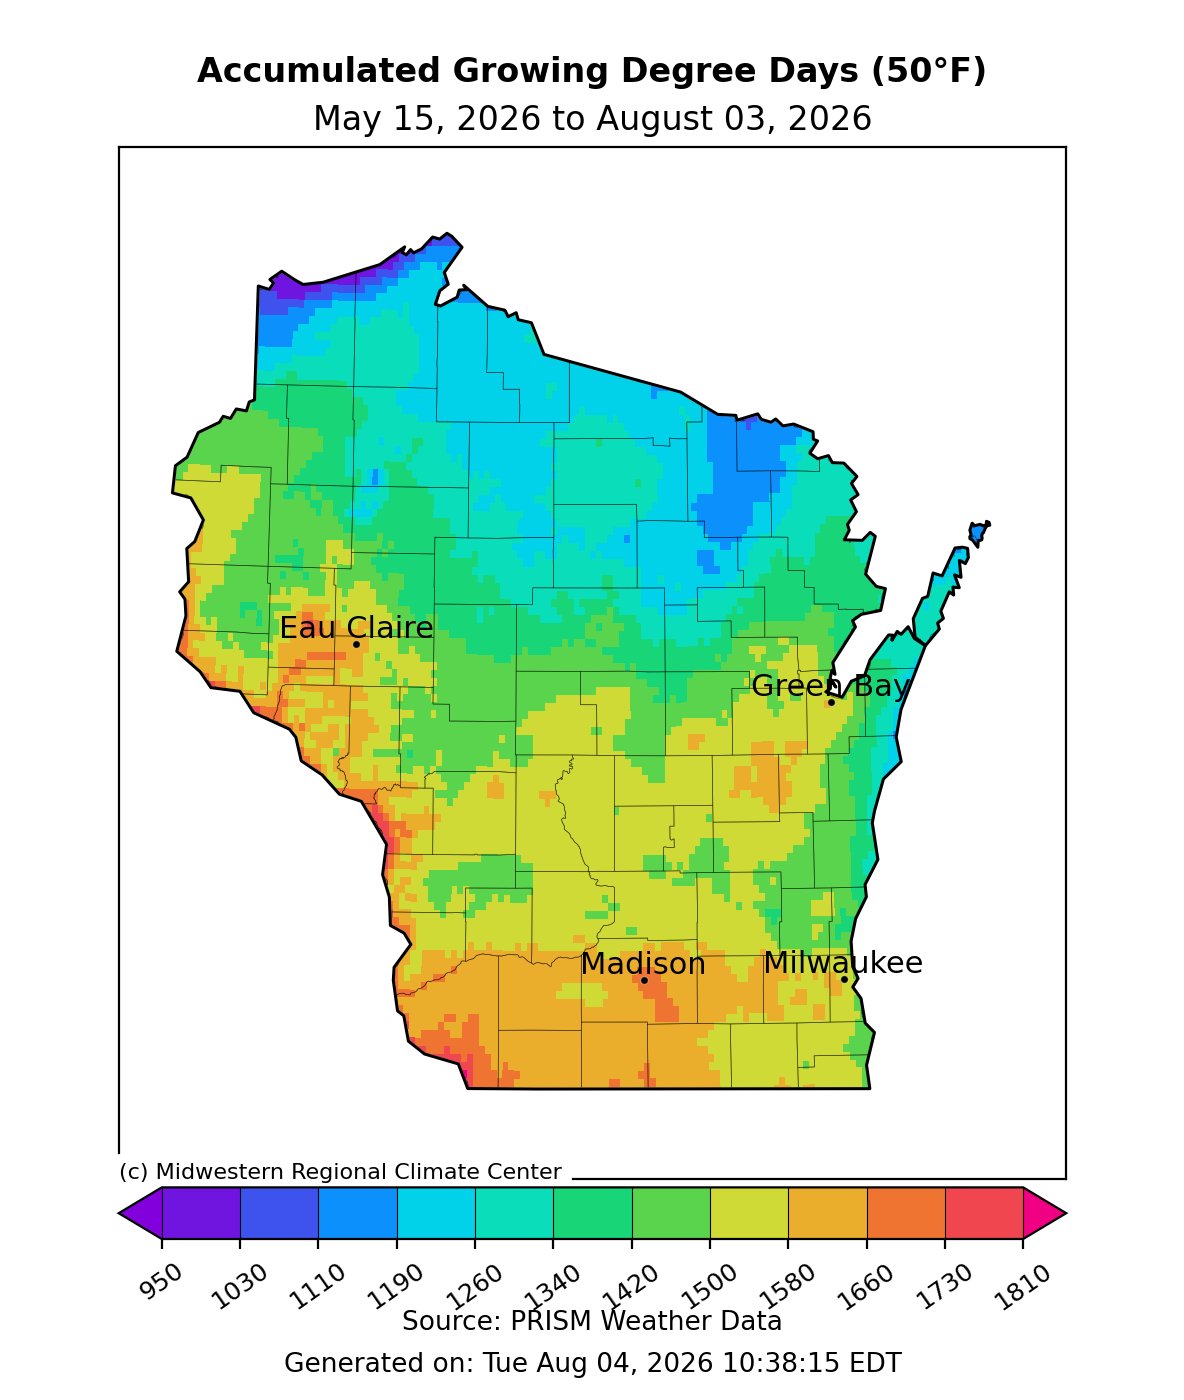
Image Description ↓
Color-shaded map of Wisconsin showing accumulated Growing Degree Days (base 50°F) from May 15, 2026 to August 3, 2026, sourced from PRISM Weather Data and generated by the Midwestern Regional Climate Center on Aug 4, 2026. A color scale from purple (950) through blue, teal, green, yellow, orange, to red (1810) indicates GDD totals. The lowest accumulations (purple/blue, roughly 950–1100) appear in far northern Wisconsin. Mid-range values (teal/green, roughly 1100–1400) cover the northern and central regions, including areas near Eau Claire and Green Bay. The highest accumulations (yellow/orange, roughly 1500–1700) occur in southern Wisconsin, including Madison and Milwaukee, with small pockets of red (near 1810) in isolated southwestern spots. City markers indicate Eau Claire, Green Bay, Madison, and Milwaukee.
- Starting May 1 – Growing degree day accumulation ranges from 1790 GDD in the far south and west to 1210 GDD in the far north. These values are 105-115% of normal.
- Starting May 15 – Growing degree day accumulation ranges from 1730 GDD in the far south and west to 1190 GDD in the far north. These values are 110-120% of normal.
Crop Progress and Condition
Crop Progress Report for Corn
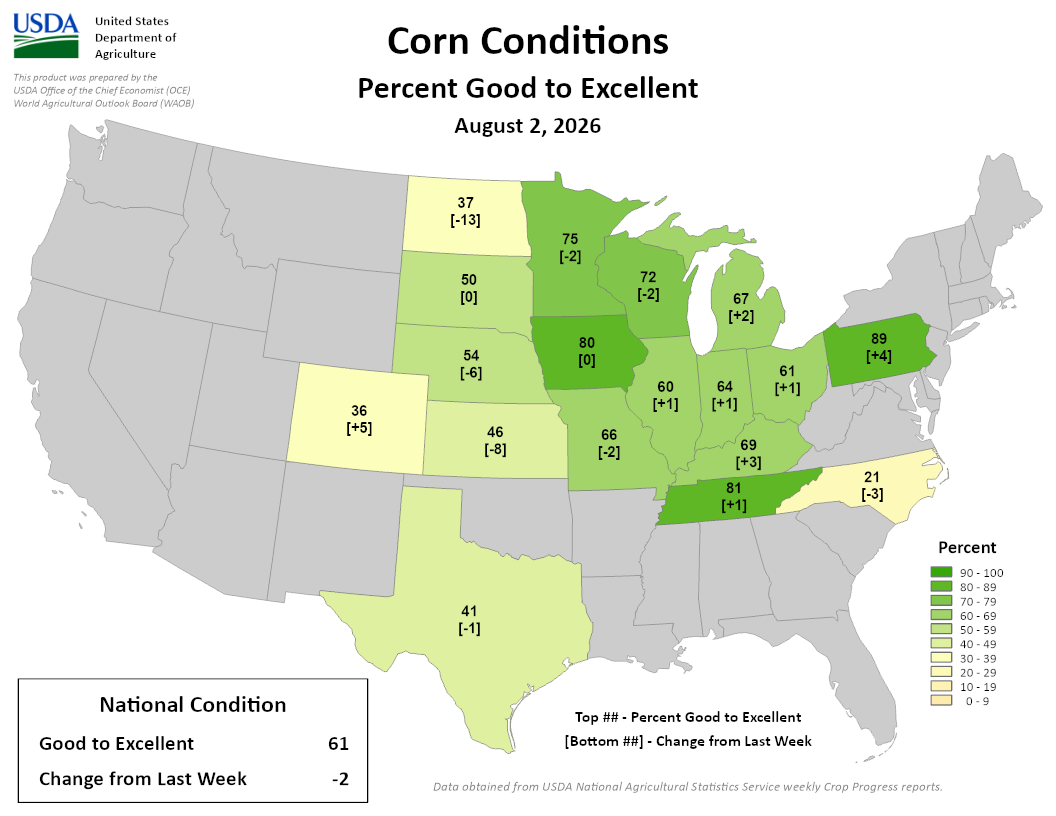
Image Description ↓
USDA corn conditions map, Aug 2, 2026: percent good-to-excellent by state, national 61% (-2 from last week). Image description below.
Image description: USDA/NASS map titled “Corn Conditions: Percent Good to Excellent, August 2, 2026,” showing corn-growing states shaded by percent rated good-to-excellent, with change from prior week in brackets.
State values (percent good-to-excellent [change from last week]):
- South Dakota: 37 [-13]
- Minnesota: 75 [-2]
- Wisconsin: 72 [-2]
- Michigan: 67 [+2]
- Pennsylvania: 89 [+4]
- Iowa: 80 [0]
- Nebraska: 50 [0]
- Kansas: 54 [-6]
- Colorado: 36 [+5]
- Missouri: 66 [-2]
- Illinois: 60 [+1]
- Indiana: 64 [+1]
- Ohio: 61 [+1]
- Kentucky: 69 [+3]
- Tennessee: 81 [+1]
- North Carolina: 21 [-3]
- Texas: 41 [-1]
National condition: 61% good-to-excellent, a decrease of 2 percentage points from the previous week. Data sourced from USDA National Agricultural Statistics Service weekly Crop Progress reports, prepared by the USDA Office of the Chief Economist and World Agricultural Outlook Board.
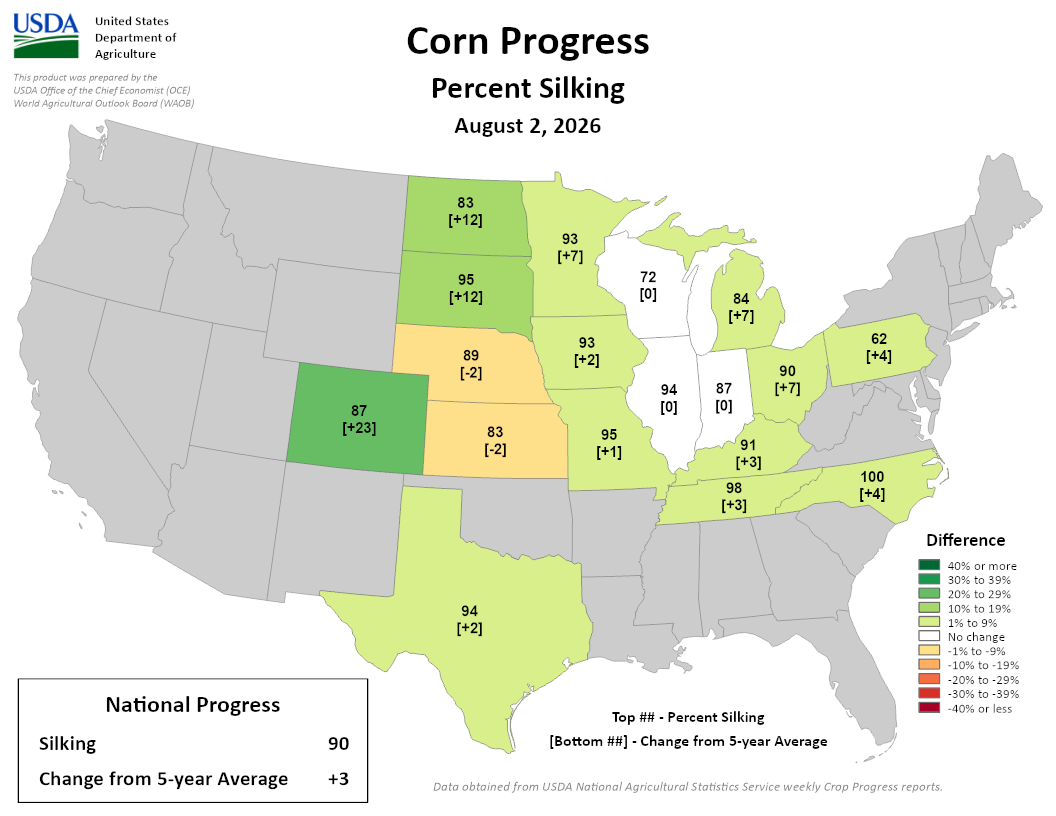
Image Description ↓
Choropleth map of the United States titled “Corn Progress: Percent Silking, August 2, 2026,” prepared by USDA’s Office of the Chief Economist and World Agricultural Outlook Board. Each corn-producing state shows a percent-silking value and its change from the 5-year average in brackets. Colors range from dark green (largest positive change) through light green, white (no change), to orange/red (negative change). State values: North Dakota 95 [+12], South Dakota 83 [+12], Nebraska 89 [-2], Kansas 83 [-2], Colorado 87 [+23], Minnesota 93 [+7], Iowa 93 [+2], Missouri 95 [+1], Wisconsin 72 [0], Illinois 94 [0], Indiana 87 [0], Michigan 84 [+7], Ohio 90 [+7], Pennsylvania 62 [+4], Kentucky 91 [+3], Tennessee 98 [+3], North Carolina 100 [+4], Texas 94 [+2]. A legend explains the color-coded difference ranges from “40% or more” (dark green) to “-40% or less” (dark red), with white indicating no change. A national progress box reports overall Silking at 90% and Change from 5-year average at +3. Data source: USDA National Agricultural Statistics Service weekly Crop Progress reports.
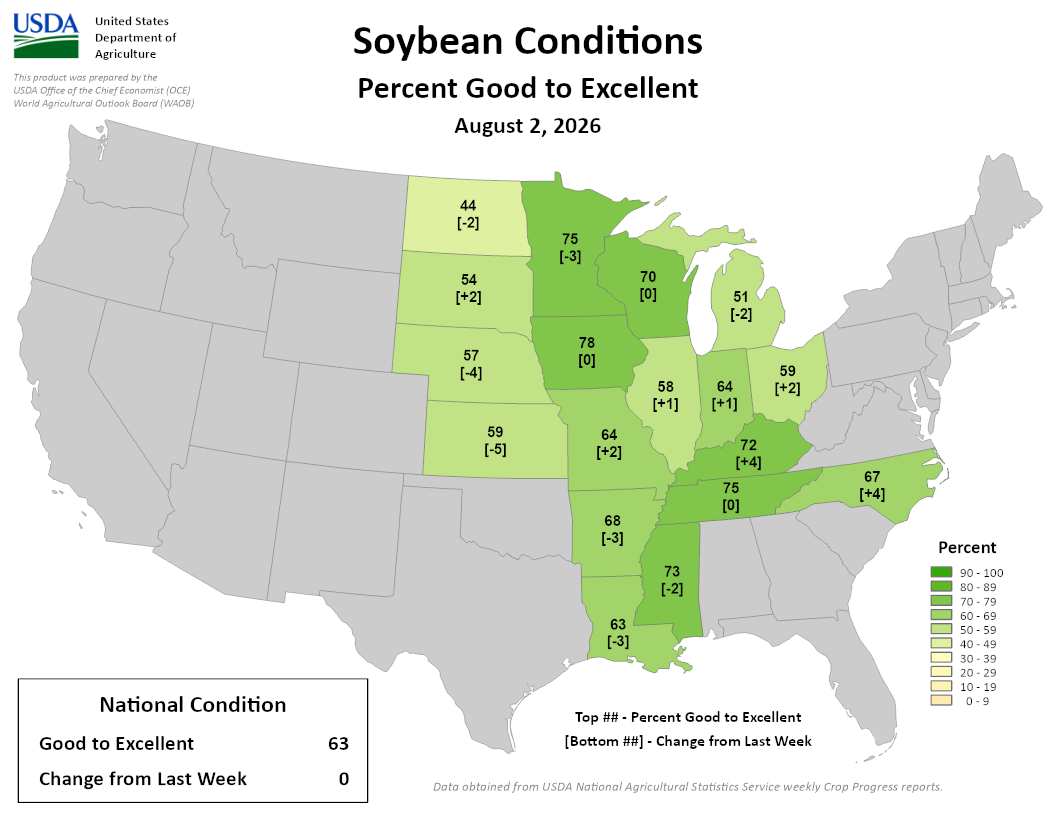
Image Description ↓
USDA choropleth map titled “Soybean Conditions: Percent Good to Excellent, August 2, 2026,” prepared by USDA Office of the Chief Economist. Shading indicates percent good-to-excellent by state, from light (0-9%) to dark green (90-100%). State values (percent, with change from prior week in brackets): North Dakota 44 [-2], South Dakota 54 [+2], Minnesota 75 [-3], Wisconsin 70 [0], Michigan 51 [-2], Nebraska 57 [-4], Iowa 78 [0], Illinois 58 [+1], Indiana 64 [+1], Ohio 59 [+2], Kansas 59 [-5], Missouri 64 [+2], Kentucky 72 [+4], North Carolina 67 [+4], Arkansas 68 [-3], Tennessee 75 [0], Mississippi 73 [-2], Louisiana 63 [-3]. States not reported (gray) include those outside the main soybean belt. A legend box shows National Condition: Good to Excellent 63%, Change from Last Week 0. Data source: USDA National Agricultural Statistics Service weekly Crop Progress reports.
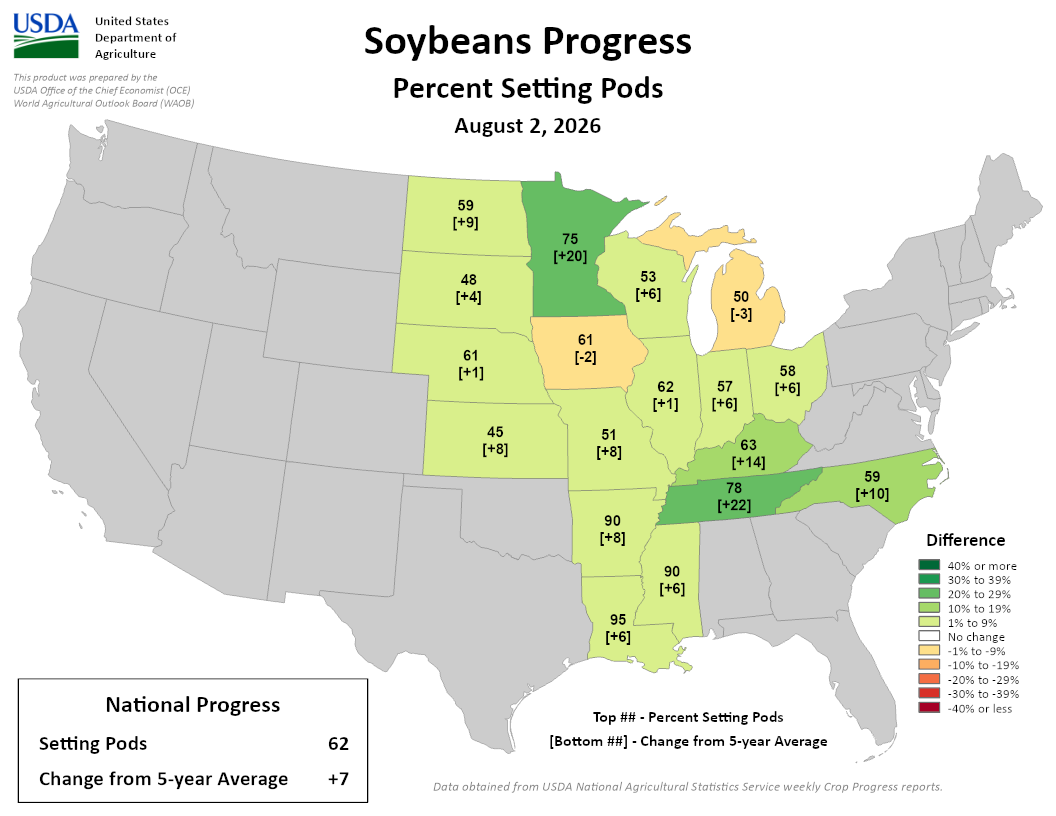
Image Description ↓
Choropleth map of the contiguous United States showing soybean crop progress by state as of August 2, 2026, from USDA’s Office of the Chief Economist and World Agricultural Outlook Board. Each colored state displays two numbers: the percent of soybeans setting pods (top) and the percentage-point difference from the 5-year average (bottom, in brackets). States are shaded green for positive differences (darker green = larger increase) and orange/red for negative differences (darker = larger decrease); white indicates no change; gray states have no data reported.
State-level values:
- Minnesota: 75% [+20]
- North Dakota: 59% [+9]
- South Dakota: 48% [+4]
- Nebraska: 61% [+1]
- Kansas: 45% [+8]
- Iowa: 61% [-2]
- Missouri: 51% [+8]
- Arkansas: 90% [+8]
- Louisiana: 95% [+6]
- Mississippi: 90% [+6]
- Illinois: 62% [+1]
- Indiana: 57% [+6]
- Ohio: 58% [+6]
- Michigan: 50% [-3]
- Wisconsin: 53% [+6]
- Kentucky: 63% [+14]
- Tennessee: 78% [+22]
- North Carolina: 59% [+10]
National summary (bottom left box): Setting Pods 62%; Change from 5-year Average +7.
Source note: Data obtained from USDA National Agricultural Statistics Service weekly Crop Progress reports.
- Wisconsin had 5.7 days suitable for fieldwork statewide, down from last week due to rain in the south and east.
- Soybeans are 86% blooming, with 53% of soybeans setting pods.
- Corn silking is 72% complete, with 16% of corn at dough stage.
- Corn and soybean conditions are 72% and 70% good to excellent, respectively. Corn was down by 2% from last week’s report.
- Winter wheat is 69% harvested.
- Oats are 93% coloring and 41% harvested.
- Pasture and range were rated 54% good to excellent, down 3% from last week.
- The third cutting of alfalfa is 50% complete.
- Read the full USDA report.
Forecasts and Outlooks
7 Day Precipitation Forecast
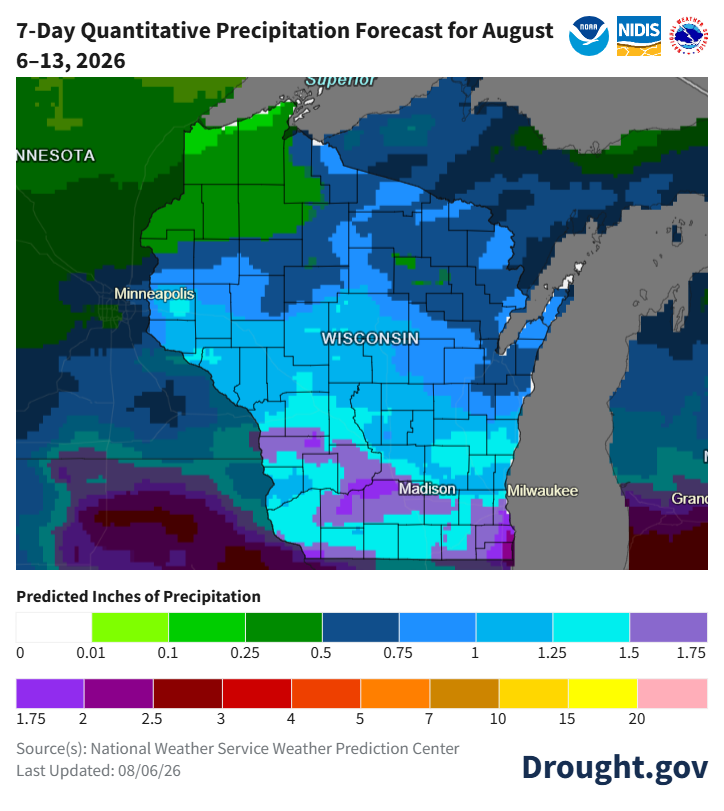
Image Description ↓
Title: 7-Day Quantitative Precipitation Forecast for August 6–13, 2026.
Map details:
- Southern Wisconsin (including Madison and Milwaukee): Shaded light cyan, purple, and magenta, indicating 1.25 to over 2.0 inches of predicted precipitation.
- Central Wisconsin: Shaded bright blue and cyan, indicating 0.75 to 1.25 inches of rainfall.
- Northern Wisconsin: Shaded green and dark blue, indicating 0.25 to 0.75 inches of rainfall.
Key Legend (Predicted Inches of Precipitation):
- 0 to 0.5 inches: White, lime green, dark green
- 0.5 to 1.25 inches: Dark blue, bright blue, cyan
- 1.25 to 2.0+ inches: Light purple, magenta, dark red
Source: National Weather Service Weather Prediction Center / Drought.gov (Last Updated: 08/06/26).
- When? –Rainfall chances are highest on Sunday (8/9), Monday (8/10), Tuesday (8/11), and Wednesday (8/12).
- Where? – Rainfall chances are highest in the southern counties, with lesser chances to the north.
- Check your local forecast for details on totals and timing.
- Average precip (1991-2020) for this week: 0.89”.
8-14 Day Temperature and Precipitation Outlook
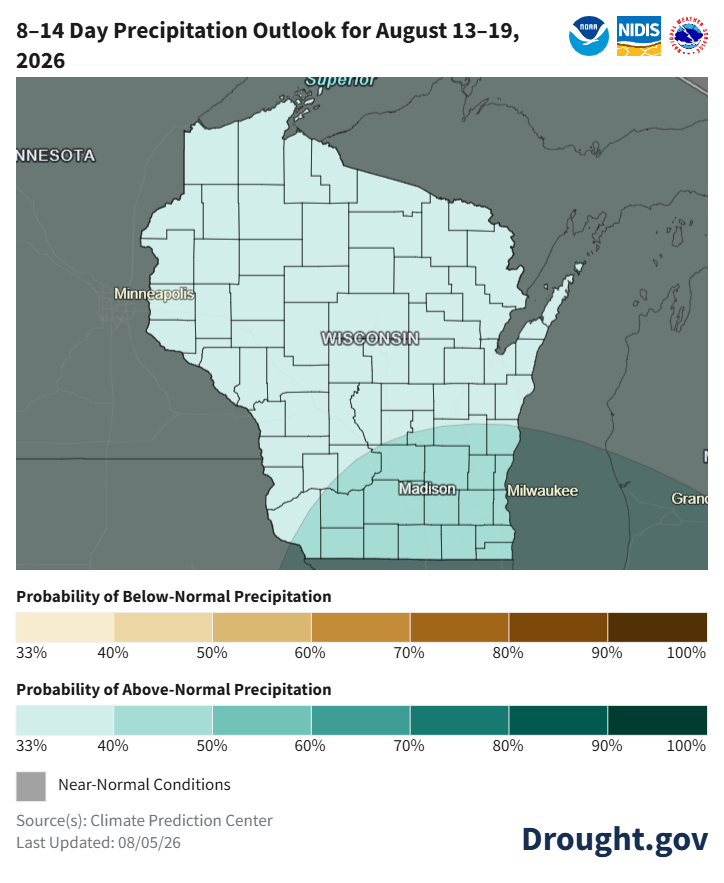
Image Description ↓
Title: 8–14 Day Precipitation Outlook for August 13–19, 2026.
Map details:
- Southern Wisconsin (including Madison and Milwaukee): Shaded light teal, indicating a 33% to 40% probability of above-normal precipitation.
- Central and Northern Wisconsin: Shaded light green/grey, indicating equal chances or near-normal conditions.
Key Legend:
- Below-Normal Probability: Beige/tan to dark brown (33% to 100%)
- Above-Normal Probability: Light teal to dark green (33% to 100%)
- Grey area: Near-Normal Conditions
Source: Climate Prediction Center / Drought.gov (Last Updated: 08/05/26).
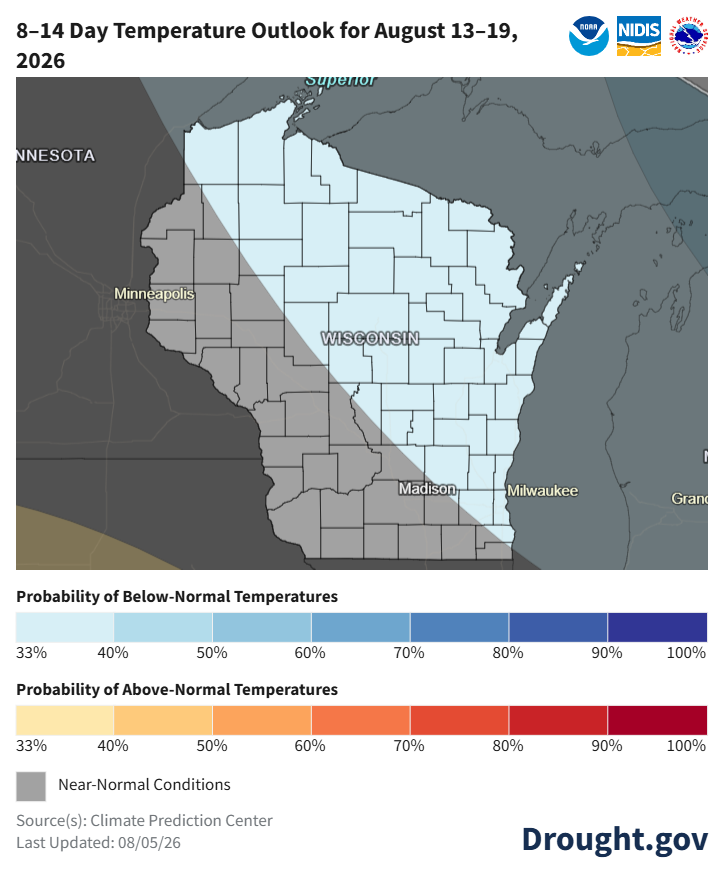
Image Description ↓
Title: 8–14 Day Temperature Outlook for August 13–19, 2026.
Map details:
- Northern, Central, and Eastern Wisconsin: Shaded light blue, indicating a 33% to 40% probability of below-normal temperatures.
- Southwestern Wisconsin (including areas west of Madison): Shaded grey, indicating near-normal temperature conditions.
Key Legend:
- Below-Normal Probability: Light blue to dark blue (33% to 100%)
- Above-Normal Probability: Yellow to dark red (33% to 100%)
- Grey area: Near-Normal Conditions
Source: Climate Prediction Center / Drought.gov (Last Updated: 08/05/26).
- Mid August:
- Statewide normals (1991-2020) for August 13-19 are 67.4°F and 0.89”.
30 Day Temperature and Precipitation Outlook
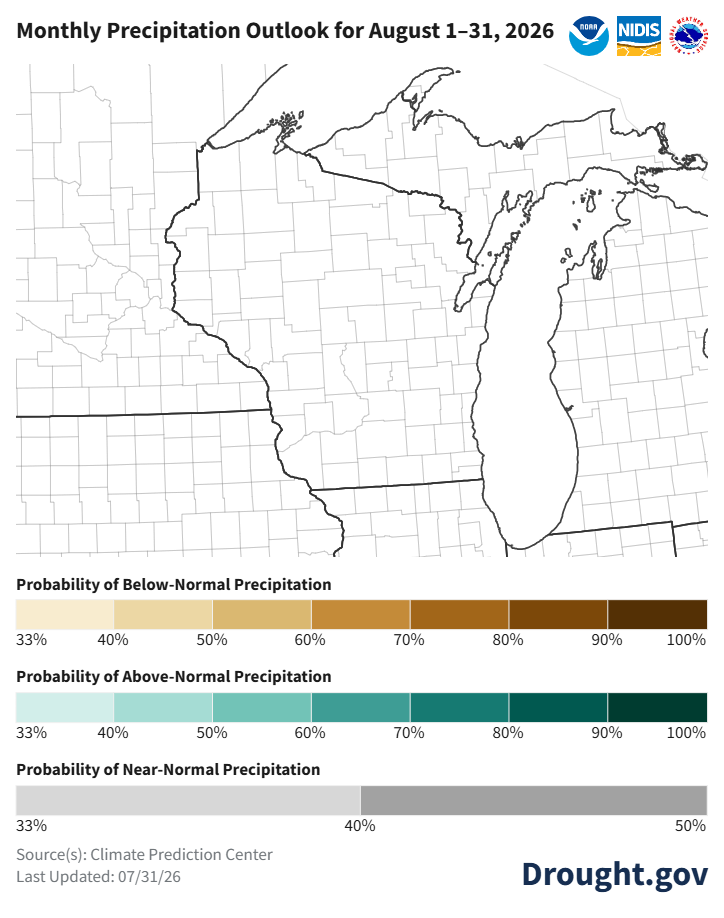
Image Description ↓
NOAA/NIDIS map from the Climate Prediction Center, dated August 1–31, 2026, covering Wisconsin, Michigan, and neighboring states (Illinois, Iowa, Minnesota). The map area itself shows no color shading, indicating equal chances of below-normal, near-normal, or above-normal precipitation across the region this month. Three legend bars appear below the map: “Probability of Below-Normal Precipitation” (cream to dark brown, 33%–100%), “Probability of Above-Normal Precipitation” (pale to dark teal, 33%–100%), and “Probability of Near-Normal Precipitation” (light to dark gray, 33%–50%). Source: Climate Prediction Center. Last updated 07/31/26. NOAA, NIDIS, and National Weather Service logos appear in the top right; “Drought.gov” appears in the bottom right.
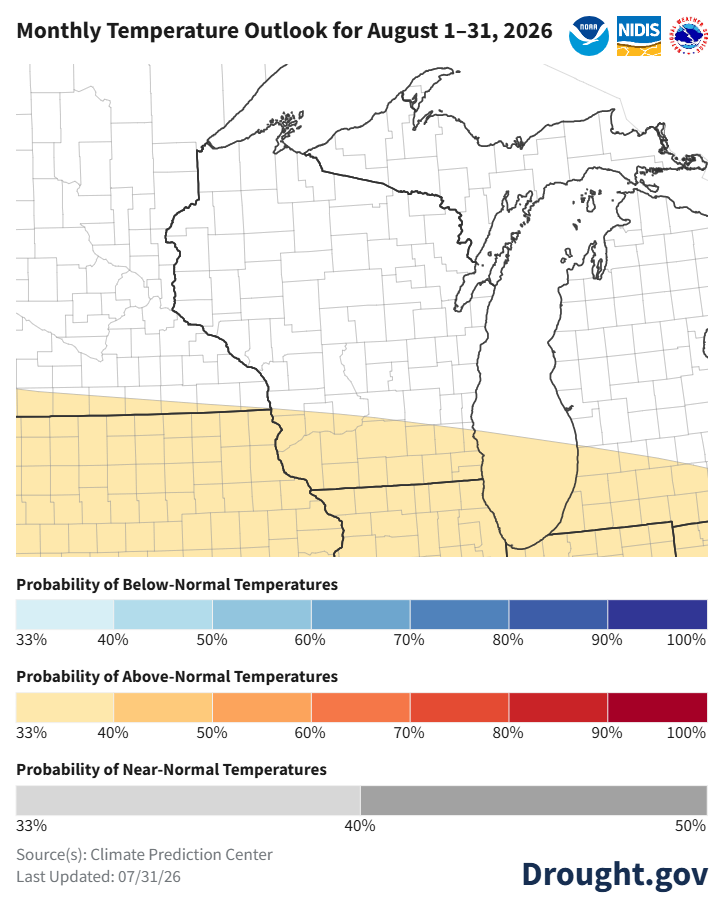
Image Description ↓
NOAA/NIDIS map titled “Monthly Temperature Outlook for August 1–31, 2026,” covering Wisconsin, Michigan, and surrounding states, sourced from the Climate Prediction Center, last updated 07/31/26. A light-orange band across southern Wisconsin, northern Illinois, and adjacent areas indicates a 33–40% probability of above-normal temperatures. The remainder of the mapped region, including most of Wisconsin and Michigan, is unshaded (white), indicating equal chances among below-normal, near-normal, and above-normal temperatures. Three color-coded legends appear below the map: “Probability of Below-Normal Temperatures” (light to dark blue, 33%–100%), “Probability of Above-Normal Temperatures” (light to dark orange/red, 33%–100%), and “Probability of Near-Normal Temperatures” (light to dark gray, 33%–50%).
- August: Temperatures and precipitation are uncertain (equal chances) across most of Wisconsin. Southern counties have a slightly higher probability (33-40% odds) of being warmer than normal.
- Statewide normals (1991-2020) for August 1-31 are 67.2°F and 3.90”.
90 Day Temperature and Precipitation Outlook
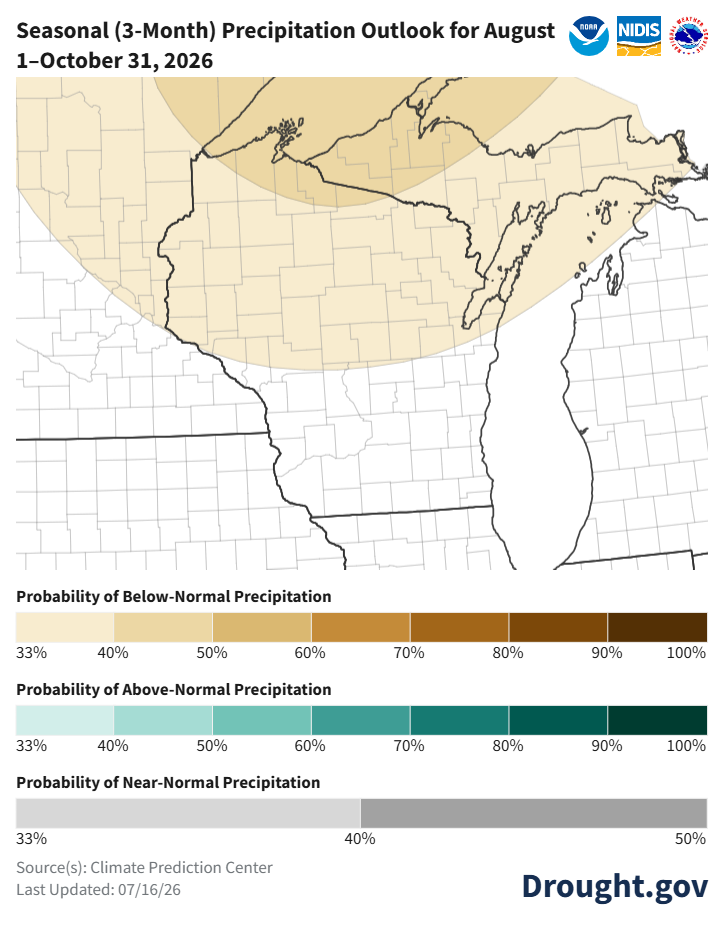
Image Description ↓
Map titled “Seasonal (3-Month) Precipitation Outlook for August 1-October 31, 2026.” The map shows the Climate Prediction Center’s three-month precipitation outlook for Wisconsin.
A broad tan-shaded area covers most of northern Wisconsin, including areas near Lake Superior and extending across much of the northern half of the state. The shading indicates a 33%-40% probability of below-normal precipitation during the August through October period.
Most of southern Wisconsin is unshaded, indicating equal chances (EC) of below-normal, near-normal, or above-normal precipitation. No areas of Wisconsin are shaded green, indicating there is no forecast signal favoring above-normal precipitation anywhere in the state.
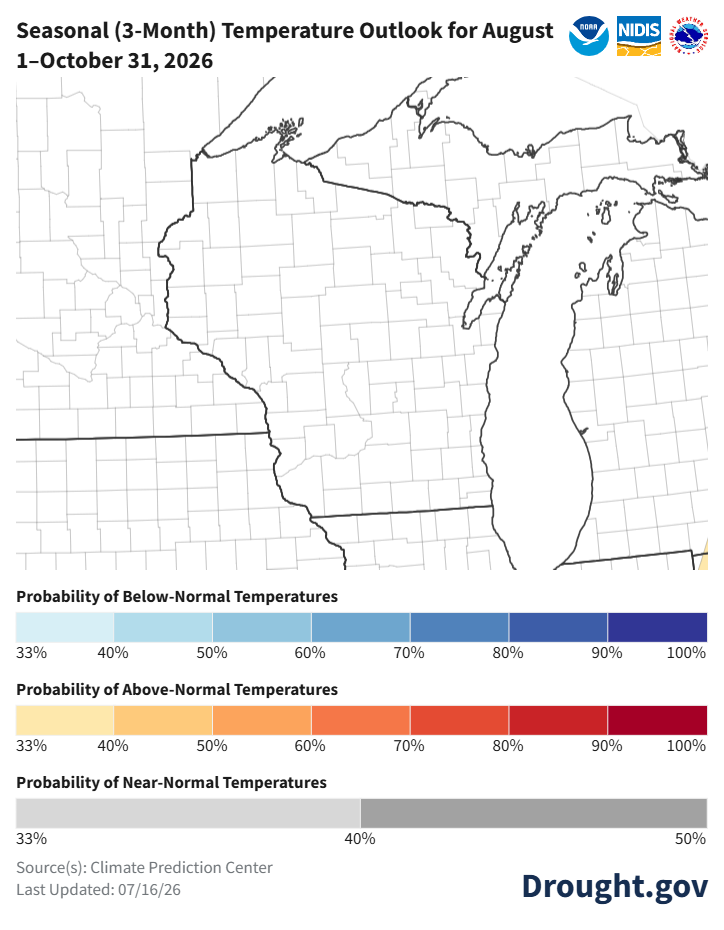
Image Description ↓
Map titled “Seasonal (3-Month) Temperature Outlook for August 1-October 31, 2026.” The map shows the Climate Prediction Center’s three-month temperature outlook for Wisconsin and surrounding states.
Wisconsin is entirely unshaded (white), indicating Equal Chances (EC) of below-normal, near-normal, or above-normal temperatures during the August through October 2026 period. No portion of Wisconsin is shaded blue for below-normal temperatures or orange/red for above-normal temperatures, indicating no strong seasonal temperature signal for the state.
A very small area of light orange shading appears outside Wisconsin near the lower-right edge of the map, indicating increased odds of above-normal temperatures in a region beyond the map’s Wisconsin focus area. This outlook does not affect Wisconsin.
- Aug-Oct: Temperatures are uncertain with equal chances. Precipitation shows a slight lean (33-40% odds) towards below normal precipitation. Below normal precipitation is a bit more likely in the far north (40-50% odds).
- Statewide normals (1991-2020) for Aug-Oct are 57.8°F and 10.50”.
User Survey
Are you a regular user of the Ag Weather Outlook for Wisconsin (AgWOW)? Or maybe you are viewing this page for the first time this week? Either way, we want to hear your feedback on this resource! Please take a few minutes and fill out this survey. Your feedback will help us better serve your ag-weather data needs through AgWOW.
If you have any trouble accessing or filling out the survey, please email Josh Bendorf at jbendorf@wisc.edu. Thank you!