Managing vegetable pests and diseases can be a challenge, especially when patterns and outbreaks vary from year to year. The Vegetable Disease and Insect Forecasting Network (VDIFN) helps take the guesswork out of management by providing data-driven risk forecasts for your farm.
This guide walks you through:
- Key concepts behind pest and disease models
- VDIFN basics and navigation
- Step‑by‑step example for insect pest forecasting
- Step‑by‑step example for disease forecasting
- Next steps & resources for integrated pest and disease management
You can access the Vegetable Disease and Insect Forecasting Network tool and follow along at agweather.cals.wisc.edu/vdifn
Follow-Along VDIFN Video Tutorial
Walk through the contents of this guide in video format below:
Acknowledgments & Funding
The Vegetable Disease and Insect Forecasting Network has been created and maintained through the collaborative efforts of Dr. Amanda Gevens, Dr. Russell Groves, and Ben Bradford. Their commitment to providing vegetable growers with timely, research-based recommendations and tools has advanced successful integrated pest and disease management across Wisconsin. Additions to the site have come from contributions of programmers, research scientists, and students of the Gevens and Groves research programs since 2014.
Funding for this tool has come from multiple sources including the Wisconsin Potato Industry Association, Midwest Food Products Association, Wisconsin Specialty Crop Block Grant Program, and US Department of Agriculture National Institute of Food and Agriculture Specialty Crop Research Initiative Program.
Pests and Diseases: How do They Grow?
Insect growth depends on temperature.
Unlike warm‑blooded animals, insects can’t regulate their body temperature. Insects develop more slowly when it’s cold, more quickly when it’s warmer, and may not develop at all below certain threshold temperatures. Each different insect species will grow at a different rate, and will respond differently to changes in temperature.
It’s a similar story with pathogens, the microbes that cause disease on our crops. Different pathogens will have different growth rates and responses to environmental conditions.
Pathogen development can be affected by things like temperature, relative humidity, and leaf wetness.
Why is this important to us?
If we understand the relationship between a specific insect and the temperature of its environment, we can use temperature data to estimate how far along that insect is. This can help us make management decisions that are often more responsive than relying on a calendar date or waiting for symptoms to appear, because temperature can vary year-by-year.
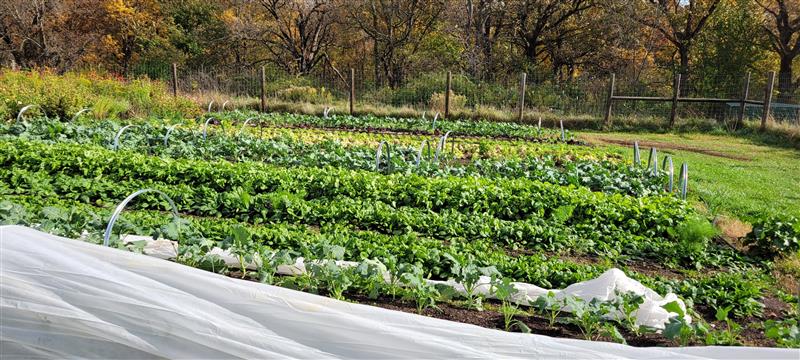
For example; if we know when squash vine borer is about to start laying eggs, we can put up floating row covers to exclude them from our squash plants. The same is true for diseases, which can be much harder to spot before they become a problem.
We can do exactly this using pest and disease models. Read below to learn how these models work, and how to use them.
Pest Models: The Basics
A pest model is a mathematical tool that uses temperature data to estimate how far along an insect is in its development. Each pest has its own unique model, because each pest has unique temperature requirements for developing.
Each pest model acts a bit like a recipe. If you have a recipe for chocolate chip cookies, including the baking temperature and baking time, you will know when to take them out of the oven. Similarly, by modeling the life cycle of a pest, pest models help us make timely management decisions, like when to plant, scout, exclude, or spray.
There are a few details about pest models that you should know when using them:
- Degree Days
- Biofix Date
- Minimum and Minimum Temperatures
Degree Days
In order to track insect growth using temperature, we need a way to measure heat energy as it accumulates throughout the season. A degree day (DD) is a unit that measures how much heat energy a pest can use for growth and development each day.
- Degree days can accumulate each day throughout the season, like cups of water filling a bucket.
- On cooler days, less degree days will accumulate. On warmer days, more will accumulate.
- Degree days can be calculated in Fahrenheit or Celsius. VDIFN uses Fahrenheit degree days by default, which you’ll see listed as FDD.
With careful research, scientists have been able to align accumulated degree days with insect developmental events or life stages. For example:
- For cabbage looper, the first small larvae appear around 325 FDD, and feeding peaks around 520 FDD.
- Squash vine borer egg-laying peaks around 1000 FDD.
- Adult Japanese beetles emerge starting around 970 FDD, with peak feeding around 1600 FDD.
For a comprehensive list of degree day events for common insect pests in Wisconsin, visit Degree Days for Common Insect Pests.
Another way to think about this is like cups filling a bucket. Instead of asking “How many cups do we need to fill this bucket?”, we can ask “How many degree days need to accumulate before squash vine borers start laying their eggs on my squash?”
Biofix Date: Starting the Stopwatch
Each pest model has a start date, or “biofix date”. Think about the biofix date like starting a stopwatch – after the biofix date, degree days start to accumulate each day.
Most pest models use January 1 as a biofix date, but some models use other, mid-year dates or scouting events. For example, the biofix for the Cabbage Looper model is automatically set to May 15th.
Minimum and Maximum Temperatures
Each insect pest has a minimum temperature needed to grow, and a maximum temperature where they grow as quickly as possible. Each pest model uses these unique values. Below the minimum temperature, degree days will not accumulate. Above the maximum temperature, degree days will accumulate at a maximum rate.
Disease Models: The Basics
Disease models are similar to the pest models described above in many ways. There are two unique components of disease models that you should know when using them:
- Disease Model Units
- Crop Emergence Date or Last Fungicide Application Date
Disease Model Units: Measuring Environmental Conditions
Like how pest models use degree days, disease models also use units to turn environmental data into something that we can measure and relate to pathogen development. Instead of degree days, disease models can use a variety of units, including the following:
- Physiological days (p-days)
- Disease Severity Values (DSVs)
- Daily Infection Values (DIVs)
- Cumulative Disease Severity Index (CDSI)
Researchers have been able to align these units with disease development. For example:
- The risk of Early Blight is highest 400 p-days after crop emergence. Preventive fungicide applications should be initiated once 300 p-days are reached to protect the crop during the highest risk period.
- For Onion Botrytis Leaf Blight, recommendations are tiered. When the Cumulative Disease Severity Index (CDSI) is between 21 and 31, risk is in the “warning threshold”, and the recommendation is not to spray unless rain is predicted or overhead irrigation is used. Once CDSI goes above 31 into the “high risk” zone, initial spray application is recommended as soon as possible.
Crop Emergence Date or Last Fungicide Application Date: Starting the Stopwatch
Instead of starting with a “biofix date” like pest models, disease models use one of two potential starting dates.
Emergence Date: For crops that were direct seeded, this is the date that those plants emerged. For crops that were transplanted, this is the date that transplants were planted in the field.
Last Fungicide Application Date: In some disease models, like the one for late blight, the start date may also be the last date that fungicide was applied.
VDIFN Tool Basics and Navigation
The Vegetable Disease and Insect Forecasting Network (VDIFN) automatically runs pest and disease models using gridded weather data downloaded daily from NOAA servers. This data includes daily minimum and maximum temperatures and relative humidity. After running a chosen model, VDIFN displays degree-day accumulations or disease severity values on a map as color-coded risk scores. These are based on the estimated risk to crops in our chosen model, ranging from very low to very high risk.
This gives users a snapshot of risk on a particular farm or field, which can help inform timely decisions about management, instead of treating on a preset schedule or waiting for symptoms to appear. VDIFN can provide more concrete answers to questions like “when is the highest risk for onion botrytis at my farm?” or “when should I plant my sweet corn to avoid seedcorn maggots?”. These answers are often much more accurate than using a fixed calendar date, because they account for year-to-year changes in temperature and conditions.
VDIFN can also allow users to see patterns of risk across the state. For heat based models, including all insect pest models and the early blight disease model, risk will always progress from south/southwest to north as the season progresses. This can be used to visualize how risk will be heading towards a particular location over time.
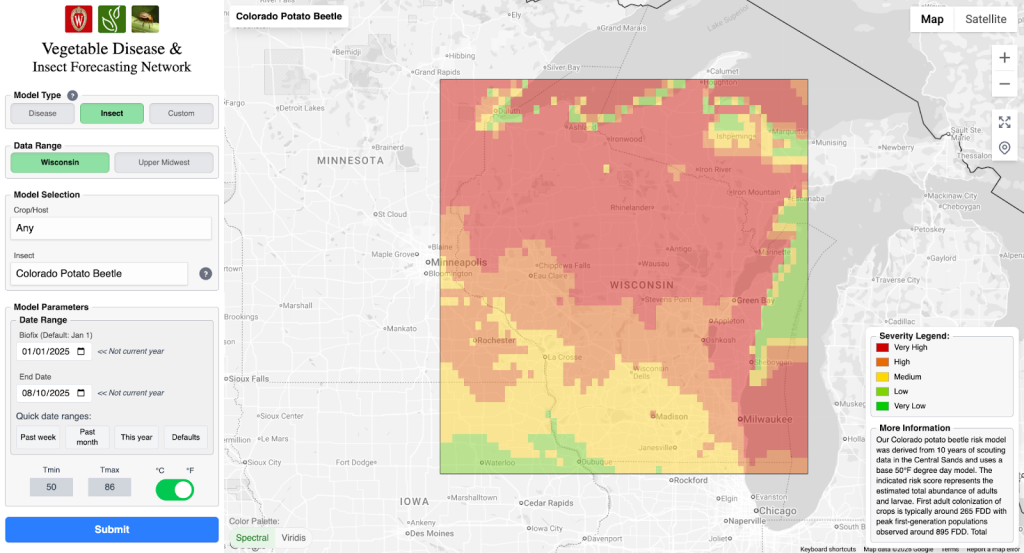
VDIFN’s interface includes three basic sections:
- Left panel: Navigation and model settings
- Center: Interactive map and pest severity display
- Right Panel: Zoom buttons, legend, and important model information
How to Use VDIFN: Pest Model Walkthrough
Walk through how to use the VDIFN tool for an insect model using the scenario below:
- It’s April 23, 2025, and we are wanting to plant sweet corn at the West Madison Agricultural Research Station. Last year we had an issue with seedcorn maggot, and want to determine risk of seedcorn maggot before planting.
- You can access the Vegetable Disease and Insect Forecasting Network tool and follow along at agweather.cals.wisc.edu/vdifn
Pest Model: Data Entry
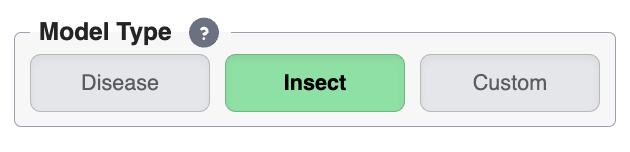
1. Select model type
At the top of the navigation panel on the left, start by selecting our model type. Here, you can choose between the “Disease”, “Insect” and “Custom” model types.
Select “Insect” for this example.
2. Choose your data range
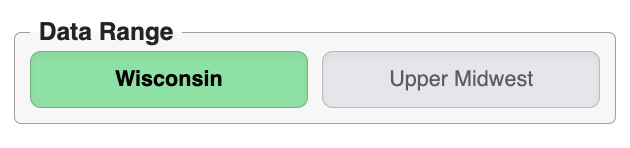
Next, select map area in the “data range” section. You can choose to view risk for the state of Wisconsin, or expand to the Upper Midwest region.
For this example, select the “Wisconsin” data range.
3. Choose crop and pest
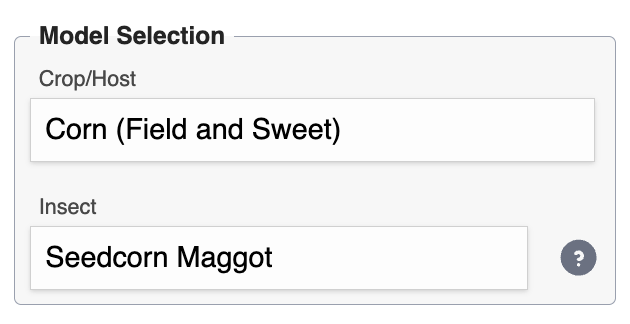
Next, choose the crop and pest that you would like to model.
For the “Crop/Host” field, select “Corn (Field and Sweet)”
For the “Insect” field, select “Seedcorn Maggot”
Optional: To read more about the insect biology or model parameters, click on the “question mark” button next to the “Insect” field for more information.
4. Set date range
Reference the “Biofix Date” section above to learn more.
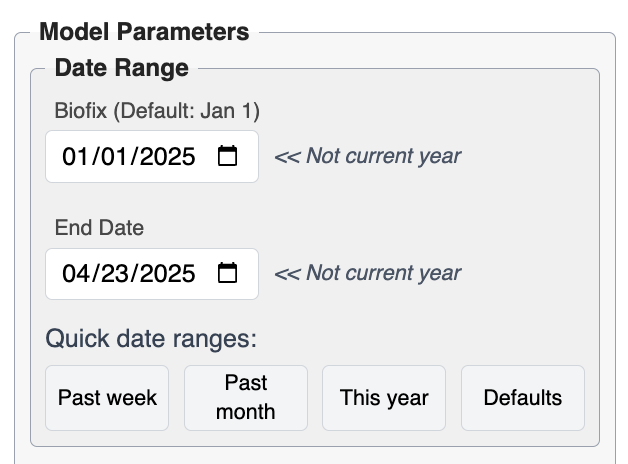
The biofix date should automatically be set for the current year based on the pest model you choose. You can double check this by clicking on that “question mark” button and reading what the biofix should be set to, and adjusting if necessary.
The biofix date for the seedcorn maggot model is automatically set to January 1 of the current year. Select “January 1, 2025”.
Set the end date to our current date of “April 23, 2025” .
VDIFN is not currently able to use weather forecasts to run the models out into the future – the map will show us risk specifically for the end date entered here.
5. Minimum and Maximum Temperatures
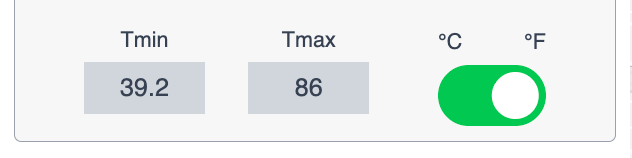
At the bottom of the panel, minimum and maximum temperatures for the seedcorn maggot model are displayed. The values are automatically-populated when you select your pest, so you do not have to add them in.
This model uses a minimum temperature of 39.2 degrees Fahrenheit and maximum of 86 degrees Fahrenheit. This is because seedcorn maggots need a temperature of more than 39.2 degrees Fahrenheit to develop, and at temperatures hotter than 86 degrees, development stays at a maximum rate and does not accelerate.
6. Choose a color palette
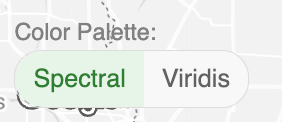
You can also change the color palette with the toggle button on the bottom left. “Spectral” uses a red to green color scheme and “Viridis” uses a yellow to purple color scheme (colorblind-friendly)
7. Review parameters and run the model
Double-check that the selected model and dates are correct. Click Submit.

Pest Model: Interpreting Results
The map now displays the current risk for seedcorn maggot across the state of Wisconsin.
- Green areas have low risk for seedcorn maggot
- Yellow areas have medium risk.
- Red areas are experiencing very high risk
Risk at a specific location can be viewed one of two ways:
1. Zoom in to your location using the (+) button on the top right corner of the screen, then use your mouse to drag the map to the farm.
2. If you are currently at your desired location, click the “show my location” button in the top right corner.
Use the steps above to view risk at the West Madison Agricultural Research Station (8502 Mineral Point Rd, Verona, WI 53593).
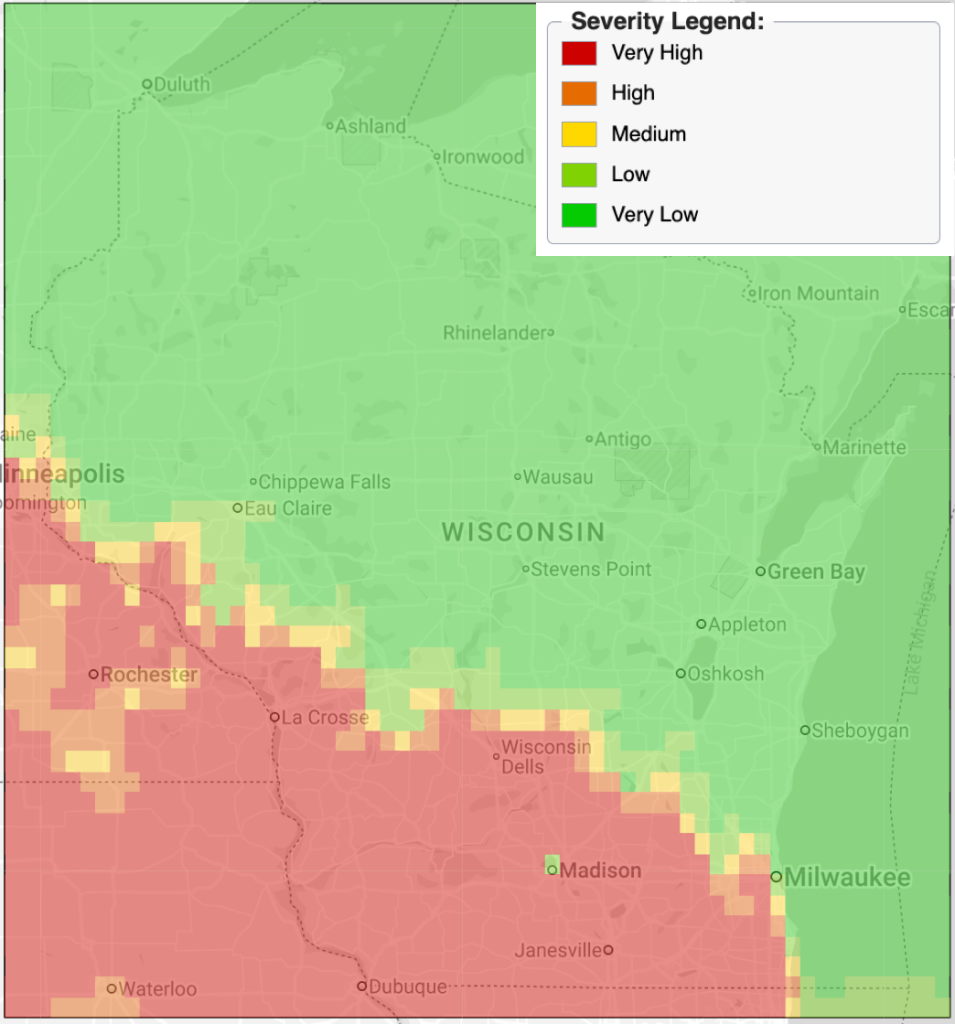
The West Madison Ag Research Station is in the red zone – there is very high risk for seedcorn maggot right now.
After running a model, you can click on an individual map grid point to view more detailed information about conditions at that location, including cumulative degree days for each day.
Click on the West Madison Agricultural Research Station (8502 Mineral Point Rd, Verona, WI 53593) to see the amount of cumulative degree days at this location.
As of April 23, 2025, there are 376.2 cumulative degree days at the station.
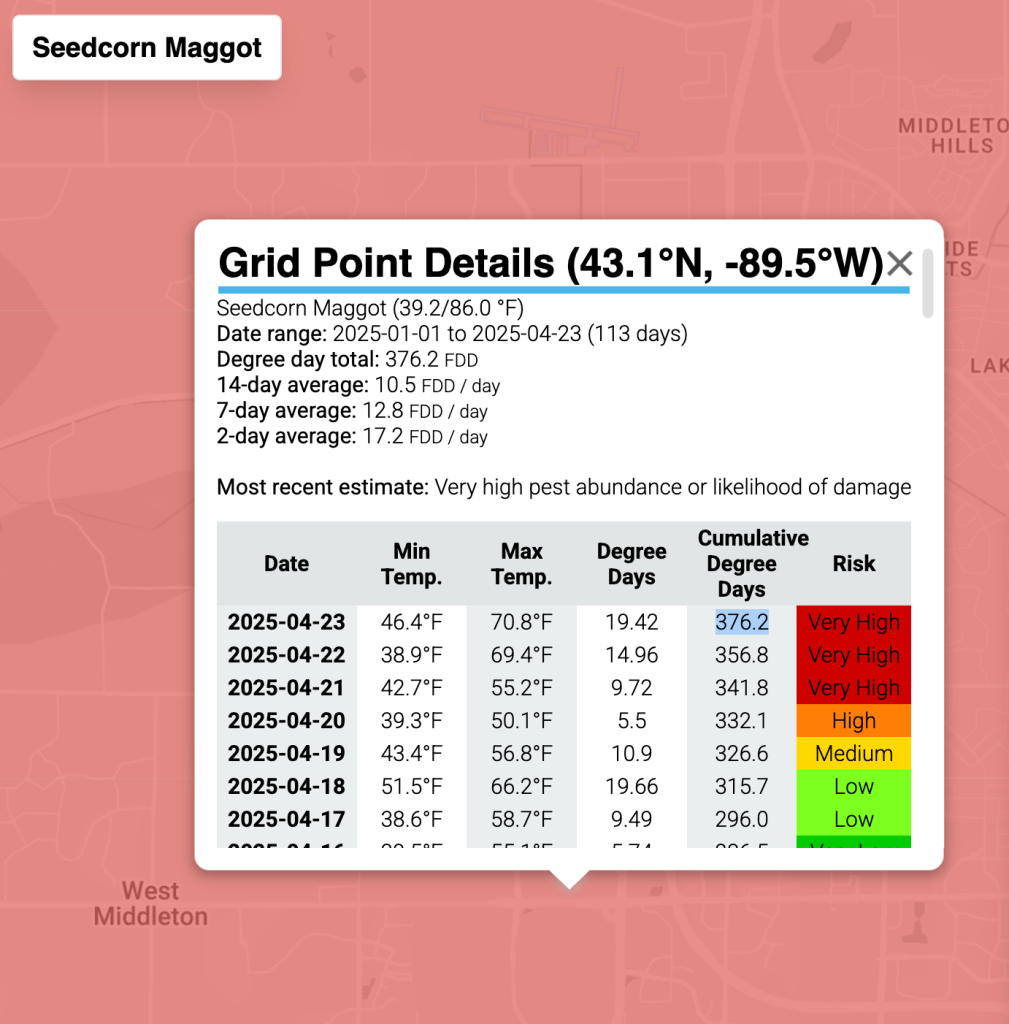
This value can be used to understand more specifics about seedcorn maggot risk on-farm, and help determine when to plant the sweet corn.
To do this, read the “More Information” box on the lower righthand part of the screen.
By reading this section, we learn that:
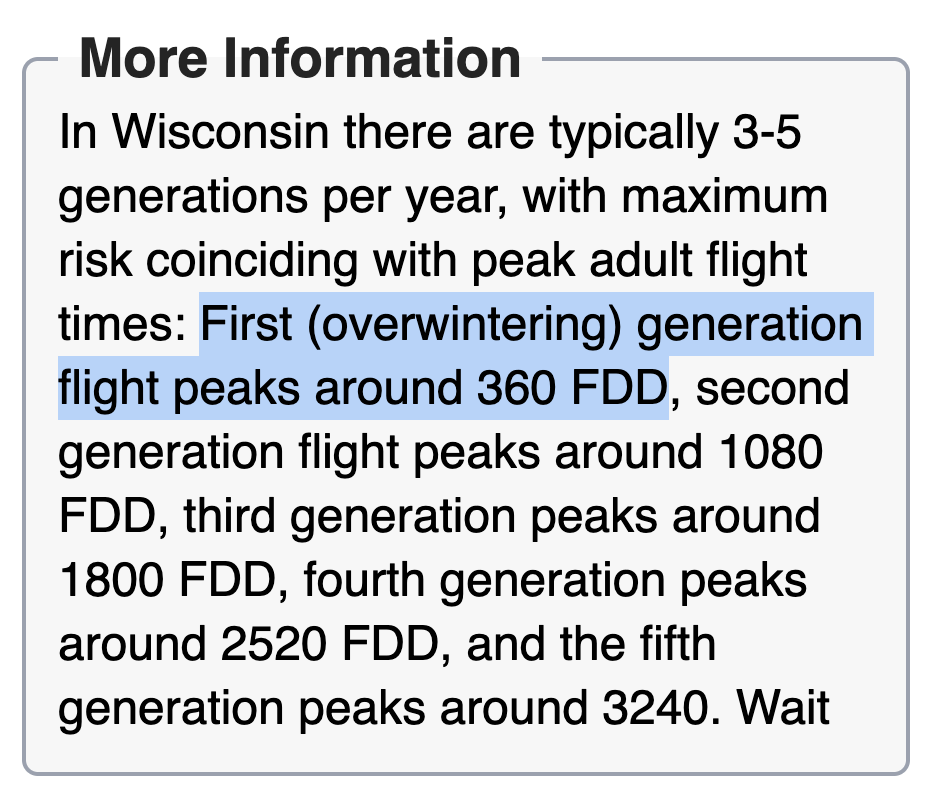
- There are typically 3-5 generations of seedcorn maggot in Wisconsin every year.
- Maximum risk for corn damage coincides with peak adult flight times. This is when seedcorn maggots are flying, mating, and laying eggs, which will then hatch and eat planted corn seeds.
- For the first, overwintering generation of seedcorn maggots, adult flights peak at 360 cumulative degree days
We can compare this to the accumulated degree days at the research station:
- 360 FDD: Cumulative Degree Days for peak seedcorn maggot adult flight
- 376.2 FDD: Current Cumulative Degree Days at the research station
This explains why the risk for seedcorn maggot damage is very high at the research station – the first generation of seedcorn maggot adults are likely in peak flight and egg-laying.
Pest Model: Next Steps
For management recommendations, return to the “More Information” box.
This section recommends waiting until 450 more degree days have accumulated after peak flight to plant sweet corn. This means that we should plan to plant our sweet corn when the research station has accumulated 810 FDD, which is 450 FDD after peak flight (450+360=810). VDIFN can be used to check seedcorn maggot risk at the station as time progresses.
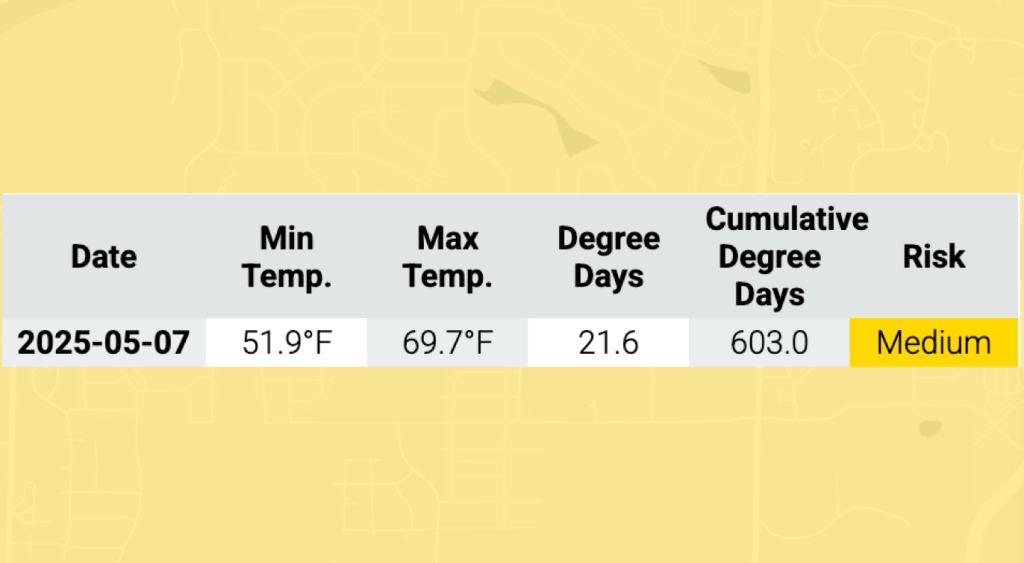
Enter May 7, 2025 as a new “End Date”. Submit the model, then click on the research station to see updated cumulative degree days.
The new degree day accumulation is 603 FDD. Seedcorn maggot risk is lower, but not yet at the optimal level of 810 FDD.
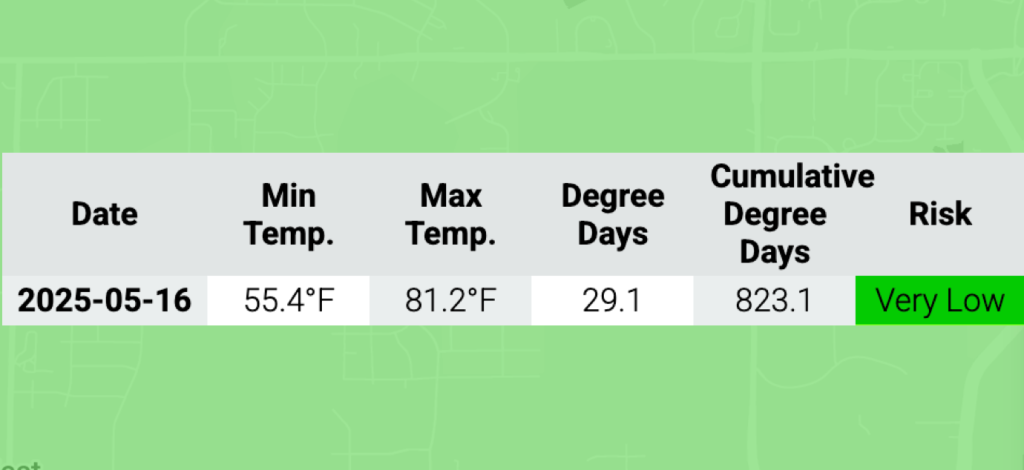
Enter May 16, 2025 as a new “End Date”. Submit the model, then click on the research station to see updated cumulative degree days.
The new degree day accumulation is 823.1 FDD. The recommended 810 FDD accumulation has been reached, and risk for seedcorn maggot is very low if corn is planted now.
By using VDIFN in this example, we were able to avoid planting out sweet corn at a time where there was high risk of damage from seedcorn maggot. This gives us a better shot at a healthy crop and better yields this season.
How to Use VDIFN: Disease Model
Walk through how to use the VDIFN tool for an insect model using the scenario below:
- It’s June 27, 2025, and we are wanting to plan an effective preventative fungicide application for early blight on tomato at the West Madison Agricultural Research Station. We planted our tomato transplants in the field on May 20, 2025.
- You can access the Vegetable Disease and Insect Forecasting Network tool and follow along at agweather.cals.wisc.edu/vdifn
Disease Model: Data Entry
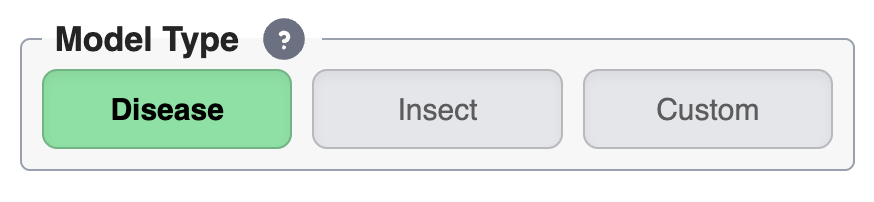
1. Select model type
At the top of the navigation panel on the left, start by selecting our model type. Here, you can choose between the “Disease”, “Insect” and “Custom” model types.
Select “Disease” for this example.
2. Choose your data range
Next, select map area in the “data range” section. You can choose to view risk for the state of Wisconsin, or expand to the Upper Midwest region.
For this example, select the “Wisconsin” data range.
3. Choose crop and pest
Next, choose the crop and pest that you would like to model.
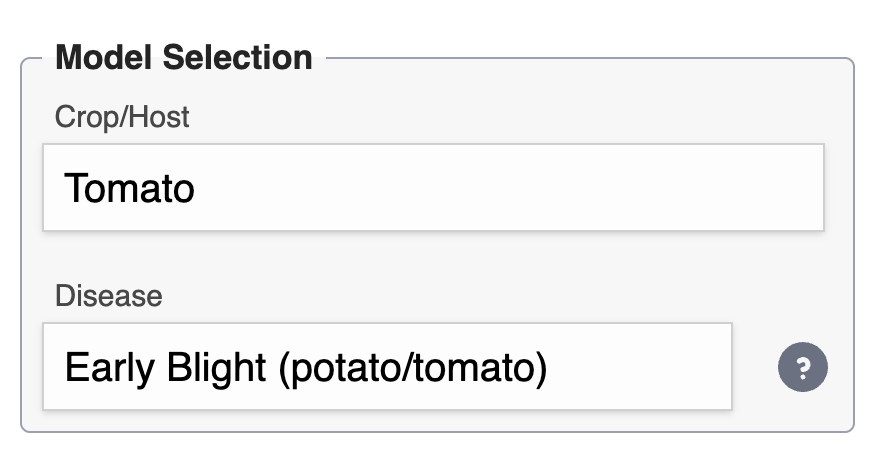
For the “Crop/Host” field, select “Tomato”
For the “Disease” field, select “Early Blight”
Optional: To read more about the pathogen biology or model parameters, click on the “question mark” button next to the “Insect” field for more information.
4. Set date range
See the “Crop Emergence Date and Last Fungicide Application section above to learn more.
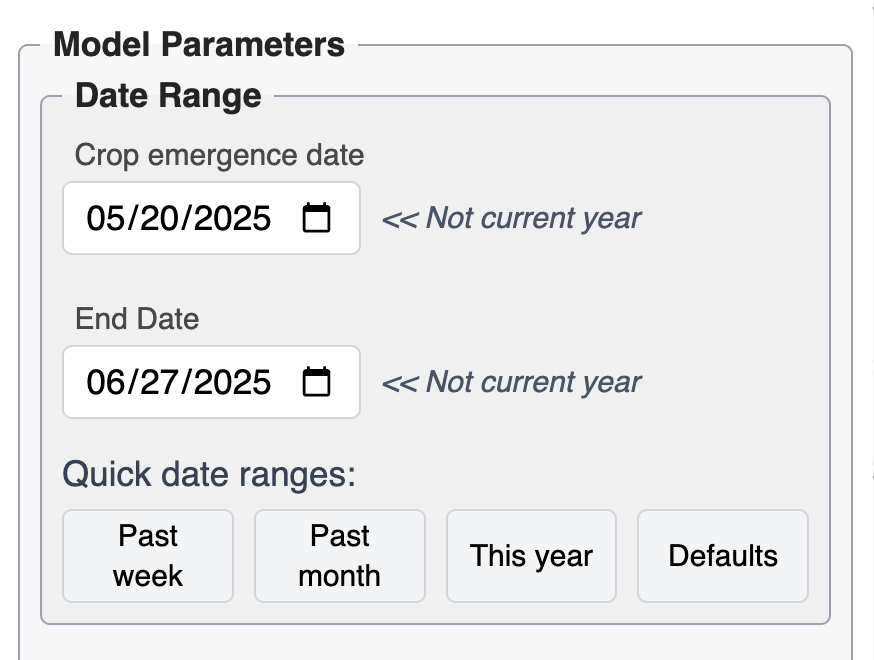
For this example, tomato transplants were planted out in the field on May 20th, 2025. That will be the crop emergence date for this model.
For “Crop Emergence Date”, select “May 20, 2025”.
Set the end date to our current date of “June 27, 2025” .
VDIFN is not currently able to use weather forecasts to run the models out into the future – the map will show us risk specifically for the end date entered here.
5. Choose a color palette
You can also change the color palette with the toggle button on the bottom left. “Spectral” uses a red to green color scheme and “Viridis” uses a yellow to purple color scheme (colorblind-friendly)
6. Review parameters and run the model
Double-check that the selected model and dates are correct. Click Submit.
Disease Model: Interpreting Results
The map now displays the current risk for early blight across the state of Wisconsin.
- Green areas have low early blight risk
- Yellow areas have medium risk.
- Orange areas are experiencing high risk
Risk at a specific location can be viewed one of two ways:
- Zoom in to your location using the “+” button on the top right corner of the screen, then use your mouse to drag the map to the farm.
- If you are currently at your desired location, click the “show my location” button in the top right corner
Use the steps above to view risk at the West Madison Agricultural Research Station (8502 Mineral Point Rd, Verona, WI 53593).
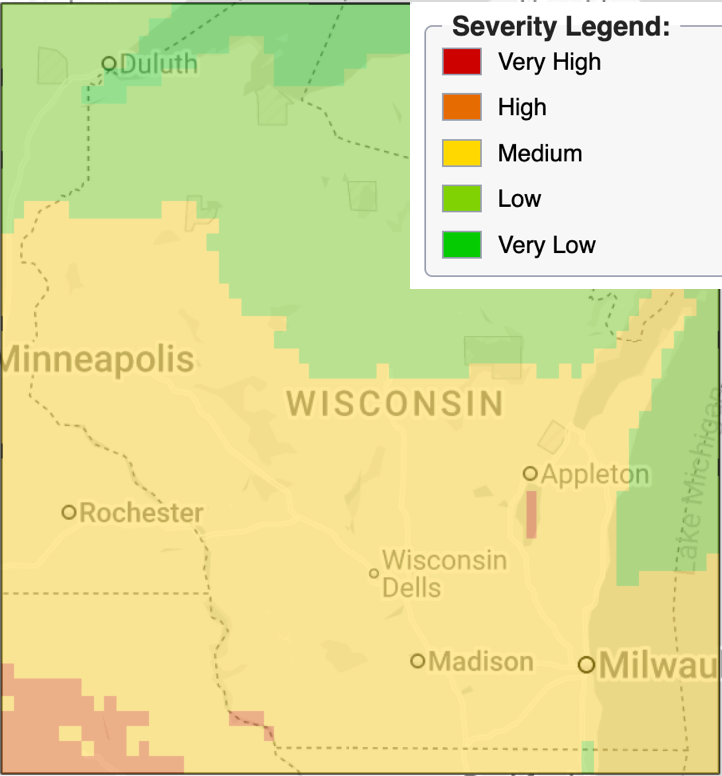
The West Madison Ag Research Station is in the yellow zone – there is medium risk for early blight right now.
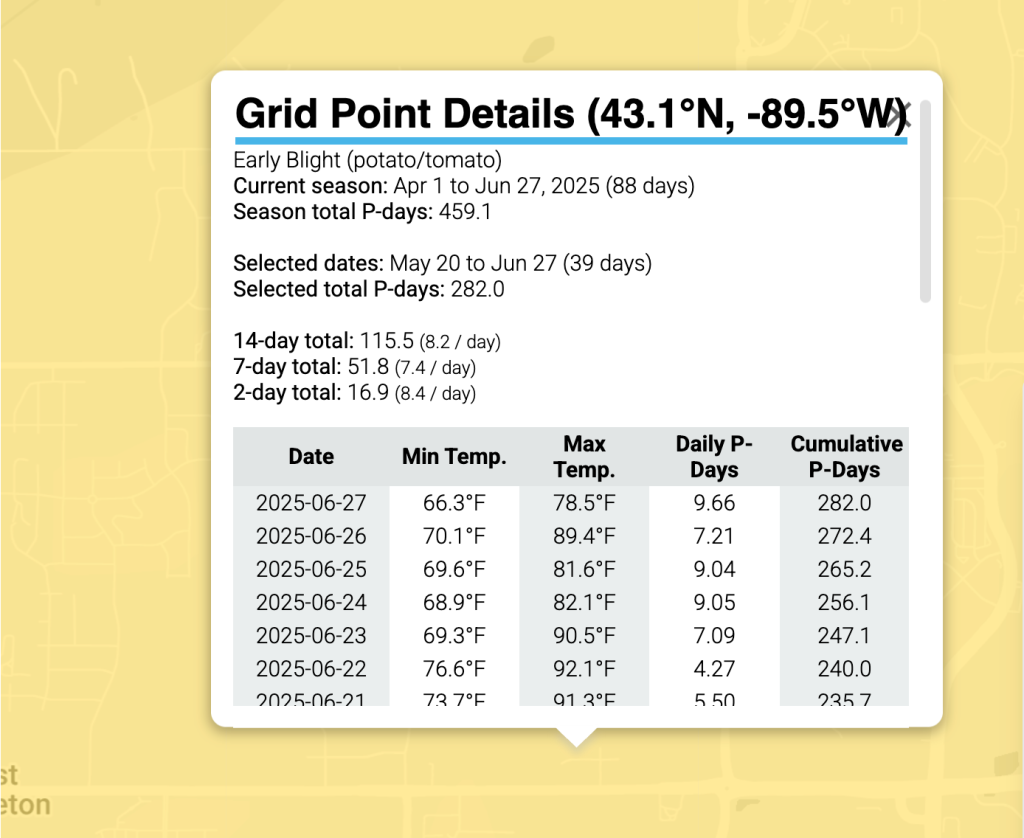
After running a model, you can click on an individual map grid point to view more detailed information about conditions at that location, including specific accumulated risk values for each day.
Click on the West Madison Agricultural Research Station (8502 Mineral Point Rd, Verona, WI 53593) to see the amount of physiological days, or “p-days” at this location.
As of June 27, 2025, there are 282.0 cumulative p-days at the station.
Disease Model: Next Steps
This cumulative p-day value can be used to understand more specifics about early blight risk on-farm, and help determine when to apply preventative fungicide. To do this, click on the “Question Mark” button next to the model field to learn more.
By reading this section, we learn that:
- Early blight risk begins to increase at 200 p-days, with highest risk between 350 and 400 p-days.
- Once 300 p-days are reached, intensive scouting and/or preventative fungicide applications should be started to protect tomatoes during the highest risk period for early blight.
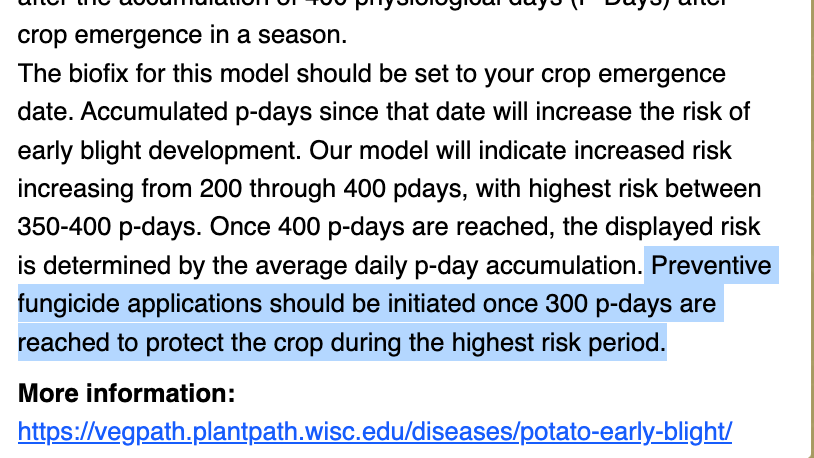
We can compare this recommended p-day value to the cumulative p-days at the research station:
- 300 P-Days: Intensive Scouting and/or Preventative Fungicide Applications Start
- 282 P-Days: Current Cumulative P-Days at the research station
The research station is close to reaching the recommended 300 p-day mark for preventative fungicide applications. This information can be used by planning to spray soon, and scout regularly for symptoms.
By using VDIFN in this example, we were able to apply our preventative fungicide at the right time before we started to see extensive early blight damage in the field.
How to Use VDIFN: Custom Model Tool
The “Custom Model” tool has the ability to run and visualize any degree day model. Once a model is submitted, users can customize the color gradient type, amount of gradations, and minimum or maximum color points.
This tool can be used as an easy way to visualize the progression of the seasons, or to cross-reference the degree-days for plant or insect developmental milestones. For example, some insect pests like Squash Bugs do not currently have a degree day model built into VDIFN, but have degree day-based recommendations for scouting and treatment that can be found online at the UW-Madison Vegetable Crop Entomology website.
For more information on custom modeling, click on the question mark button next to the “model types”.
Next Steps and Additional Resources
The VDIFN tool enhances our understanding of vegetable pests and diseases, supporting good management practices throughout the season. VDIFN is most effective when used together with a strong integrated pest management plan, including strategies like:
- Crop rotation
- Resistant varieties
- Biological control & natural enemies
- Field sanitation & debris removal
- Scouting for pests and symptoms
For support with pest or disease identification, visit:
For vegetable pest management information, research, and resources for pollinators and beneficial insects, visit the UW-Madison Vegetable Crop Entomology Program website (Dr. Russ Groves).
For vegetable disease management information, research, and newsletter updates, visit the UW-Madison Vegetable Pathology Program website (Dr. Amanda Gevens).
For more resources on vegetable and fruit production, visit the UW-Madison Extension Crops and Soils Specialty Crops Homepage.
For questions and feedback, please contact Ariana Abbrescia (abbrescia@wisc.edu) and/or Ben Bradford (bbradford@wisc.edu)
Reviewers: Dr. Amanda Gevens, Dr. Russ Groves, Rue Genger
Last reviewed on July 16, 2026