Video Summary
Hava Blair, researcher and SnapPlus lead, UW–Madison Department of Soil and Environmental Sciences introduces two powerful tools for planning and managing manure applications in Wisconsin: SnapPlus Version 3 and the Runoff Risk Advisory Forecast.
In this demo, Hava walks through how to use SnapPlus for nutrient management planning, mapping field boundaries, identifying setbacks, and exporting manure spreading maps. She also explains how the Runoff Risk Advisory Forecast helps farmers assess daily and seasonal runoff risks using real-time weather and soil data. These free tools support environmentally responsible and regulation-compliant manure management.
Resources
Transcript
0:05
All right, super.
0:06
I had to make sure my audio and video are on.
0:08
Hi, everybody.
0:09
Thank you for the introduction, Dan.
0:11
So to close out today, I’m here to show you a few slides and then get online and do a live demo of how to use two different tools that are relevant to what we’ve been discussing today in terms of manure restriction maps and figuring out where you can spread your manure safely and avoiding runoff and releases.
0:30
So I want to first acknowledge everybody on the Snap Plus team.
0:34
So we have a small group that maintains not only the Snap Plus software for nutrient management planning, but also additional tools like the Runoff Risk advisory Forecast that I’ll talk about today.
0:46
And I wanted to make sure to give them a shout out.
0:48
So we are behind the scenes here at the Department of Soil and Environmental Sciences and we have the fun job of trying to make and improve these tools to get our jobs done and help make it easier to make these spreading maps and, and deal with the different types of restrictions we have to think about.
1:04
So the first tool I want to talk about today is Snap Plus version 3.
1:08
So I know we probably have some Snap Plus users in the audience today.
1:12
And so many of you have heard for a number of years that the new online version of Snap Plus is coming.
1:18
And I’m happy to report that it’s here, it’s up, and we think we’ve made some really nice improvements, especially when it comes to mapping and understanding restrictions.
1:27
So if you want to check this out yourself and do exactly what I’m showing in the demo today, you can find Snap Plus version three at the web address that’s on this screen.
1:37
And I’m sure someone can also drop that in the chat too of the Zoom meeting.
1:42
So this is a free online software for nutrient management in Wisconsin.
1:46
And now that we have an online platform, that means that it’s even easier to access and stay updated.
1:53
And it allows us to make a lot of improvements very quickly to the software.
1:58
In terms of our discussion today, you know, the big picture is that Snap Plus helps farmers and crop consultants, right?
2:05
Nutrient management plans that are compliant with all the relevant regulations.
2:09
But if we zoom in to what we’ve been talking about today, Snaplus is a great tool specifically for planning manure applications, helping you account for different types of restrictions that might be related to soil or to season or to slope.
2:23
And even better, it helps you get a visual of those restrictions by offering this integrated mapping option.
2:30
So within Snap plus version three, we have a mapping tab that is integrated with the application and allows you to draw your field boundaries, view and add key features like wells that might be have setbacks on them.
2:46
And then you can also export PDF spreading maps for the both winter and non winter season.
2:52
So this is, I think, one of the most exciting things that we can do with Snap Plus because it really does allow us to understand what can be a very complicated set of different overlapping restrictions and requirements on the map.
3:06
So after we get done with the sides today, I’ll pull up Snap Plus version 3 and we’ll work through together some examples of how do we look at the maps, How do we turn on and off these different layers and understand what’s happening with the different setbacks.
3:21
The second tool I want to introduce briefly now and then we’ll talk about in a minute is a tool called the Runoff Risk Advisory Forecast.
3:29
And this is a map tool.
3:31
It’s a map risk assessment tool for planning manure applications.
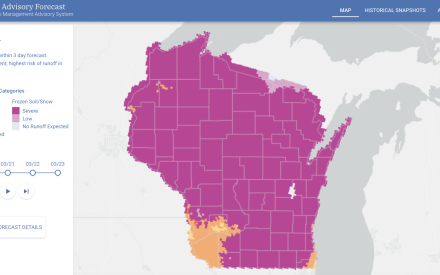
3:35
So you can go to the map and see a color-coded map of Wisconsin for updated four times a day, and it shows you in which part of the states there is low or medium or severe risk of runoff.
3:50
And I’ll describe more in the next slide what these different colors and categories mean.
3:55
We have recently updated this website.
3:57
So the Runoff Risk Advisory got a facelift this year and you can find it at this web address that I’ve listed on the slide.
4:05
In terms of what we how we determine runoff risk, you know, where does that come from?
4:10
This is actually modelled with a bunch of different data sources coming from the National Weather Service.
4:15
So it looks at precipitation, temperature, soil moisture, and landscape characteristics to make this determination of these four daily forecasts of runoff risk.
4:27
And this is all coming from a National Weather Service or model from the NOAA or National Oceanic and Atmospheric Association.
4:35
And what we do is display those models updated four times a day on our website to allow people to see when it might be a good or a risky time to spread.
4:46
And when you’re looking at these maps, you’ll see two different types of color categories that I want to talk about.
4:51
So the first one is for non frozen soil.
4:54
So we treat frozen and non frozen soil differently because we know that there are different risks of runoff for those two scenarios.
5:02
In the non frozen case like we are right now, we see these four different categories.
5:06
So that’s severe, moderate, low and then no runoff expected.
5:11
The important thing to know about these categories are they reflect a 72 hour or you know three day risk forecast.
5:19
So what we’re trying to do there is look into the future and say, OK, we might not expect rain today, but if you spread today and you get a big rainstorm tomorrow, we still have a risk of losing potentially a lot of manure and run off.
5:33
So that 72 hour risk category forecast is one way to try to get at the that idea of when might be a good day to spread of a least risky day to spread if you need to spread.
5:44
And we can see that really easily on a map that allows you to zoom in and check out the forecast for your location.
5:52
In the winter, we have a slightly different forecast because of course with frozen or snow covered soils in the winter, we know that even a little bit of precip or runoff can take a lot of manure with it very quickly because we don’t really have any opportunities with frozen soil for water to infiltrate.
6:09
So we’re expecting a lot more runoff.
6:11
That means that when you’re looking at this map in the winter and you’re seeing these kind of purple colors, we have the low and the severe categories and those actually reflect a 10 day risk.
6:21
So we’re widening that window out.
6:24
We’re showing what is the 10 day risk forecast in terms of the winter spreading because we need to think about that increased risk of runoff in the winter months.
6:34
All right, that’s the end of the slides today.
6:36
Now I want to take our last few minutes together and actually show you what these tools look like online.
6:43
So hopefully you are still seeing my screen there.
6:48
Perfect.
6:49
OK, so let’s start with Snap Plus.
6:51
I’m logged into Snap Plus version 3 today.
6:54
I have a example plan open and we’re looking at the Maps tab right now.
6:59
So I’m logged in and the first thing that I’ll point out is what we’re looking at here in these first few fields.
7:05
So I have some field boundaries drawn on my map and they’re labeled, and then we can also see some examples of the types of features that you can draw in snap maps in order to illustrate some of these different setbacks and restrictions that you might have.
7:22
So on my manure fields here in the center of the map, I have several grassed waterways that are illustrated with these lines, and they have spreading restrictions around them there.
7:33
The other thing that we’re seeing on this map is we’re seeing some examples of wells down here next to some of these raindrop features when we’re navigating in Snap Maps.
7:43
1 important thing to know is that we can always view a legend by clicking on this button with the triangle, square, and circle.
7:50
And that gives us an idea of what the different features that we’re seeing on our map are.
7:55
So we can see examples of the drinking wells and the grass waterways that I mentioned.
7:59
And then we also have a tile outlet and some spreading prohibited areas in red.
8:06
Now you might have noticed when I first pulled this up that we have many, many different layers in Snap Plus.
8:11
So I have just a subset of them turned on right now.
8:14
But I want to call out a few that are really important for thinking about manure restriction maps and setbacks.
8:20
And one of those categories is something called a direct conduit to groundwater.
8:25
So direct conduits to groundwater are one good example would be a well, but there are many different kinds of direct conduits to groundwater and these are of particular concern because they are opportunities if we are spreading near one of these features that manure might make it into the groundwater really, really quickly.
8:43
So these are features that you can draw in Snap Plus and then Snap Plus will automatically add the relevant set back for winter and non winter spreading on each of these features.
8:54
So an example of what that looks like is down on one of my southern fields here.
9:00
And if I go here to the South field, we can see I have two examples of private wells.
9:07
And right now for the layers, if I turn on my winter layers here, my manure prohibited winter layer at the top, I can see that my setbacks change.
9:18
And now I’m looking at a winter map and we see that there is actually a you need to be a longer distance.
9:23
You have a greater set back from this private well in the winter.
9:26
So we’re seeing that red area.
9:28
That’s your no spread zone on this map.
9:31
And then you have a small area too, that’s actually coming from this well feature.
9:36
The other thing we can do if we want to see those buffers all the time, even when we don’t have winter turned on, is we can go and we can control different types of buffers, whether that’s fertilizer or manure or winter manure buffers.
9:49
Here in this section of the Layers tab for the direct conduits to groundwater, it’s a very similar story for our water layers.
9:58
So it’s important to be aware of water features that might be need a surface water quality management area, which is a special type of restricted spreading area and those are streams and rivers and lakes and ponds.
10:12
In our application, all of these water features are coming directly from the DNR water layer.
10:17
And then just like the direct conduits to groundwater, SNAP Plus will automatically set the appropriate set back distance or restricted distance 1000 or 300 feet on those Swigmas or surface water quality management areas.
10:32
I see we’re in our final couple minutes.
10:33
So I just want to do one more thing, which is illustrate how you can get a PDF map out of SNAP Plus, and then we’ll quickly look at the runoff risk forecast.
10:41
Once you’ve made your maps.
10:43
We can export a PDF with the PDF button here, and that allows us to customize our spreading maps.
10:49
So you might choose to map 1 field or a couple fields depending on the size.
10:54
And then we have decisions about how to customize the legend and the font size on this map before we export it as a PDF.
11:04
When we click export, that will save a PDF in our downloads folder.
11:08
And then we can repeat that process for any maps that we want to make of other fields or other parts of the application.
11:15
All right, last minute here.
11:16
I’m going to skip over to the Runoff Risk Advisory Forecast.
11:20
This is 1 tool that I encourage you to visit on your own.
11:23
And there’s my PDF map that popped up.
11:25
And you can see today, it’s pretty dry.
11:27
So we really only have a little bit of low runoff risk in the northwestern, far northwestern part of the state here.
11:33
And when we’re looking at this tool, the way to get a detailed forecast for a specific part of the state is to zoom in and do your best to zoom into your general area.
11:44
And then we can click this Get Forecast Details button and click on the map to get a detailed forecast of the 10 day Outlook and the precipitation and even some information about soil temperature and soil saturation for our location.
12:00
The other really cool feature that I want to highlight about the Runoff Risk Advisory forecast is that we have historical snapshots that allow you to look at times of the year when we might actually have more runoff.
12:08
So I know we had some in June here where we had a really most of the state here had some runoff potential.
12:15
So this is an example of how you can go back in time and see the forecasts.
12:19
These 4 forecasts updated today for the Runoff Risk Advisory.
12:24
All right, I see it’s 1:30.
12:25
I’m going to stop sharing my screen.
12:27
Please go ahead and visit both of these sites that I shared today.
12:29
They are free and available for everybody to use and let us know if you have any questions.
Badger Crop Connect
Timely Crop Updates for Wisconsin
Second and fourth Thursdays 12:30 – 1:30 p.m.
Live via Zoom