Introduction
Soil health indicators are sensitive to a number of factors including soil type, in-field management practices, laboratory protocols, sampling time and depth, and spatial variation.
The goal of this article is to provide guidance related to the importance of using the same lab to assess changes in soil health over time, in addition to the importance of sampling at a consistent time of year and depth when collecting samples for soil health evaluation.
Laboratory Considerations
When it comes to soil health testing, there are several different methods that laboratories may use when testing for the same thing. Different methods of sample handling, preparation, and analysis (i.e. chemistry and instrumentation) across laboratories often yield different results1. As such, it is important to utilize the same laboratory with a consistent method and procedure to avoid analytical fluctuations in soil health data and results over time. Have a conversation with your lab so that you understand what method(s) they are utilizing. Then, in the event you need to go elsewhere for testing services, you know which method(s) you should request to maintain as much consistency in results as possible. Please note that even if methodologies are the same between labs, there is likely to be some degree of variation between different labs, as is common with any soil test.
When, How, and Where to Sample Soils
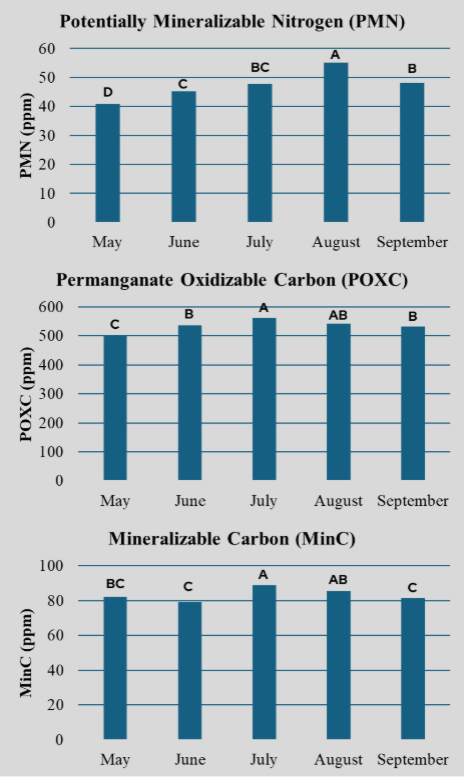
There are some guidelines that one can follow for the best quality and consistency of soil health test results from year to year. The most important consideration to emphasize is to be consistent in your sampling technique and time from year to year. Research conducted in Wisconsin has shown that sampling month and sampling depth have a significant impact on the test result2 (Figure 1).
Sampling Month
As seen in the figure below, the chemical/biological soil health test results presented in this work are generally greater in July-August than at any other time before or after that window. This is due to several factors including elevated soil temperatures, adequate soil moisture, and active crop root systems secreting exudates which feed microbial communities. To note, optimal sampling time may not always be the same for other soil health tests, such as evaluating soil compaction with a penetrometer, for example. Penetrometer readings in a dry alfalfa field during July-August (the time period mentioned above) would likely indicate that the soil is compacted, though it may not be. Again, consistency over time is key.
Sampling Depth
Figure 1 below shows that soil health test results were significantly greater in the surface (0-6″) sample than in the subsurface (6-12″) sample. This is because there is a greater abundance of plant roots, organic substances, and nutrients present and available in the upper 2-6 inches of the soil compared to greater depths. As such, it is generally recommended to use a 6-inch sampling depth.
Sampling Locations
Be sure to sample from the same location during each sampling event from year to year. Sampling location refers to the point(s) in the field where samples are collected from. Common approaches include both GPS grid-point sampling as well as conventional sampling. Both approaches have utility, but just remember that consistency is key. The number of samples to collect per field, or per field area, is subjective but should be based on the variation that exists within the specific field.
Common questions to think about might include: What is the topography like across the field? Is it uniform or does it vary substantially from one end to the other? How much does soil type change throughout the field? Is the field managed the same way all the way around, or are different practices being used in different areas? Collecting more samples from a given area will help account for the inherent variability that exists in the field.
Some laboratories suggest that a soil health sample should not represent more than 20 acres. As prefaced above, consider collecting separate soil samples from areas of the field where soil texture or drainage class differ, and where historical management has been different. Walk a “W” shape pattern through the delineated sampling area to collect 15-20 cores (to capture spatial variability) and composite them into one sample. Do this in each sampling area.
Lastly, post-sample collection handling is important to consider. Leaving soil samples exposed to high heat conditions (i.e. on the dash of the truck) for a long period of time will result in different lab results than if samples were refrigerated / kept cool directly following sample collection. Refrigeration is often recommended over leaving samples exposed to the elements or freezing. Be sure to check with your lab for recommended sample handling procedures. Despite the inherent variability that exists amongst many soil health tests due to soil variation in the field, following the tips above should help produce the most consistent results.
Sampling Month
Sampling Depth
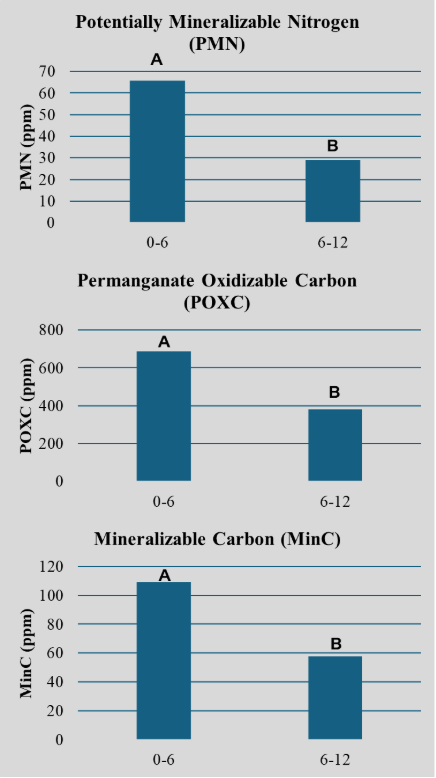
Figure 1. Effect of sampling month (left) and depth (right) on three soil health indicators. Bars within a single soil health indicator graph (i.e. Sampling Month – PMN) with different letters are significantly (p<0.10) different (Adapted from 2).
Choosing Soil Health Tests
There are many ways to measure soil health (e.g. physical, chemical, or biological indicators, in-field assessments, etc.), so selecting which test(s) you utilize should be based on the goals you have set for enhancing and monitoring soil health on your farm. Some soil health tests measure individual indicators (i.e. Mineralizable Carbon), while others combine several measures – like the Cornell CASH test or the Haney Test.
What makes a test “good” in any specific situation depends on individual preferences, specific questions being asked, and specific goals on the farm. For example, soil health tests that do not include physical indicators (e.g. aggregate stability) are not the most suitable tests for determining whether soil structure is improving in your field as a result of adding cover crops into your cropping system.
Additionally, not all of the available tests are based on research that is directly applicable to every cropping / management system. If evaluating and monitoring changes in soil health as a function of changes in management practice(s) is a goal, here are some helpful sources to guide your choice:
Wisconsin Studies
Studies from Wisconsin show that practices like cover cropping, reduced tillage, using manure, and keeping the soil covered help improve many of the well-studied soil health tests below1,2,3,4. This suggests that these indicators are useful for tracking changes in soil health over time as farm practices change.
- Soil Organic Matter (SOM)
- Soil Organic Carbon (SOC)
- Total Nitrogen (TN)
- Potentially Mineralizable Nitrogen (PMN)
- Permanganate Oxidizable Carbon (POXC)
- Mineralizable Carbon (MinC)
- Autoclaved Citrate Extractable (ACE) Protein
National Studies
The Soil Health Institute tested over 30 soil health indicators at 124 research sites across North America5. Their results suggested prioritizing the three tests below, because they responded to farm practices, are easy to measure, and described key soil functions with less overlap than some other tests:
- Soil organic carbon (SOC)
- Aggregate stability (AS)
- Mineralizable Carbon (MinC)
Concluding Thoughts
Generally speaking, a primary goal for soil health testing is to detect real changes in soil function over time as a result of changes that are made in crop and soil management practices (e.g. reduced tillage, cover cropping, etc.) As discussed in this resource, there are several sources of variability in soil health test results (e.g. sampling location, time, and depth, and laboratory use). Additionally, soils are inherently variable, as is local weather.
Without consistency in sampling and lab selection, there is a greater likelihood for variability in soil health test results, making it more difficult to evaluate whether your soils are progressing the way you’d like. To maximize your ability to accurately detect changes in soil function by using soil health tests, consistency is key.
Related Articles
Soil Health in Wisconsin: Characteristics of Healthy Soil
This article highlights the characteristics of healthy soil and describes how these characteristics, and soil health generally, can contribute to sustainable crop production and indirectly impact society beyond the farm field.
In this article, we present some foundational considerations related to soil health testing and describe situations where soil health testing can provide useful information about specific soil functions to farmers, landowners, agronomists, and crop consultants.
An Overview of Common Soil Health Indicators
An overview of the following soil health indicators: Soil Organic Matter (SOM), Soil Organic Carbon (SOC), Potentially Mineralizable Carbon (MinC), Permanganate Oxidizable Carbon (POXC), Total Nitrogen (TN), Potentially Mineralizable Nitrogen (PMN), Autoclaved Citrate Extractable (ACE) Protein, and Aggregate Stability (AS).
References
- Leeford et al., 2023. Potential carbon mineralization assays are confounded by different soil drying temperatures. Geoderma. https://doi.org/10.1016/j.geoderma.2023.116596
- Diederich et al., 2019. Increasing labile soil carbon and nitrogen fractions require a change in system, rather than practice. Soil Science Society of America Journal. https://doi.org/10.2136/sssaj2018.11.0458
- Malone et al., 2023. Linking soil health indicators to management history and soybean yield. Field Crops Research. https://doi.org/10.1016/j.fcr.2023.108951
- Augarten et al., 2023. Cropping systems with perennial vegetation and livestock integration promote soil health. Agricultural & Environmental Letters. https://doi.org/10.1002/ael2.20100
- Bagnall et al., 2023. A minimum suite of soil health indicators for North American agriculture. Soil Security. https://doi.org/10.1016/j.soisec.2023.100084
Updated: July 25, 2025
Reviewed by: Francisco Arriaga and Abby Augarten