Video Summary
This video features Dr. Natasha Rayne, assistant professor and extension soil fertility specialist at UW–Madison, discussing the concept of manure nitrogen credits and their importance in agricultural nutrient management. She explains how nitrogen credits are calculated, the variability in nitrogen content across different types of manure, and the factors affecting nitrogen availability. The presentation highlights the challenges in estimating nitrogen availability due to environmental factors and manure management practices. Natasha emphasizes the need for accurate manure testing and explores opportunities to refine nitrogen estimates to improve crop yields and reduce environmental impact.
Resources
- Nutrient application guidelines for field, vegetable, and fruit crops in Wisconsin (A2809)
- Updates in progress: A2809 Website
Transcript
0:05
All right, wonderful.
0:06
Well, thank you, Chris.
0:08
Thank you everyone for joining this webinar today.
0:12
I want to just jump right in.
0:14
Manure nitrogen credits, right?
0:16
What what do we know?
0:18
And, and, and what is what is what is next?
0:23
All right, OK.
0:27
So the way I want to get started is give a brief definition of nitrogen credits and but I want to be quick with getting to why does this matter?
0:37
Why do we need to have a discussion on nitrogen credits, right, specifically looking at how nitrogen credits are determined, right?
0:46
So giving you basically quickly telling you why we’re doing this.
0:50
And then finally, where do we go from here?
0:55
All right.
0:56
So in its simplest definition and nitrogen credits, it’s that nitrogen as when, when we’re talking about manure nitrogen credits, it’s that nitrogen that is supplied by manure that is subtracted from the recommended fertilizer nitrogen rate, right?
1:16
So we know that there’s lots of benefits to manure – physical soft, physical chemical, but also it supplies it, it supplies nutrients, right?
1:25
And so we need to account for those nutrients in particular.
1:28
We’re focusing on nitrogen on on today.
1:32
But as promised, I was going to be quick with telling you why, why this matters, Why this discussion or about nitrogen credits.
1:41
Well, I believe that when we have a deeper understanding of the methods and maybe the assumptions that go into these nitrogen credits or the methods that are used for nitrogen credits, that I hope that you walk away with an opportunity to see how we may further refine nitrogen estimates.
2:06
So I don’t want you to get lost in all, well, it’s so complicated.
2:10
Yes, it’s complicate complicated, but are there opportunities for us to further refine our nitrogen estimates from manure?
2:19
So that’s how I want you to come into, into this.
2:25
All right.
2:26
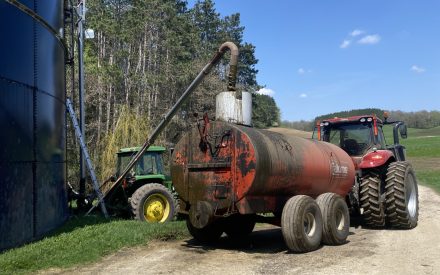
So when we think about nitrogen application in the form of manure, I mean it’s, it’s, it’s no secret that a lot of manure is being applied to, to cropland across the US And much of this manure, this manure contains nitrogen.
2:44
So when we look at nitrogen, that’s supplied in the form of manure.
2:47
We see a lead role for poultry, poultry manure followed by dairy manure and then non dairy, so cattle manure but non dairy.
2:58
So with 1.2 roughly 1.2 million metric tons, we see poultry manure standing out there.
3:07
So I must say that these these data are based on two things, right, Are based on both the tonnage of manure that is applied, but also the nutrient content of these these different manure types.
3:23
Now Speaking of different or nutrient content pertaining to these different manure types, these manure types are not created equal.
3:32
They’re not created equal.
3:33
And this, these data in front of us in this table and that were retrieved by the UW Soil and Forage lab.
3:43
They, they show that we see different manure types.
3:46
We see that there’s that they are different in their nitrogen content.
3:50
We focus on nitrogen and, and then their ammonium content, right?
3:55
So that’s that.
3:56
So, but with then when we even look deeper and take one of these manure types and look at the variability of nutrient content, we see quite a range.
4:09
We, we see quite a range of values.
4:12
For example, if you look at semi solid or dairy semi solid manure, we see that values range from .2 to 48 lbs of nitrogen per per ton, right?
4:24
In an assessment of several dairy farms across Wisconsin, we also see that variability in, in, in, in total nitrogen.
4:36
Well, what do we learn from this?
4:38
Well, we learned that.
4:39
So first of all, manure types are not created equal.
4:42
There’s variability, but also management.
4:45
Management plays a role in determining what the nitrogen content and I focus on nitrogen, what the nitrogen content for these different manure types will be, right?
4:56
So manure storage, for example, or handling, all those factors play a role in determining what my nitrogen content will be.
5:08
Now that’s nitrogen content that’s completely different from available nitrogen, right?
5:14
Because that’s the question we’re trying to answer here.
5:17
When we’re talking about nitrogen credits, we’re talking about nitrogen availability.
5:21
Not all of this nitrogen when it comes to the content is available for uptake or used by, by by by crops.
5:30
So we have inorganic nitrogen, we have organic nitrogen.
5:33
That inorganic nitrogen is primarily in the form of ammonium, which can be lost as ammonia in volatilization.
5:41
All right, There’s several things that can happen to that ammonium.
5:44
It can be nitrified, it can be that nitrate can be denitrified, can be lost as nitrous oxide, and so on.
5:52
But what we struggle with, I think most of the time is estimating that other part, right, the mineralization of that organic nitrogen, because, you know, it’s a function of the environment, right?
6:03
It’s hard to predict the environment.
6:05
So when we’re talking about available nitrogen, nitrogen, then we’re talking about that ammonium nitrogen that is not lost, right?
6:14
And that nitrogen that is mineralized from organic nitrogen.
6:19
All right.
6:20
So, so keep that in mind as we’re we’re going through this.
6:24
What I did here is basically pulled together what different universities have put out in terms of the availability of nitrogen in that first year.
6:37
And I did that to show you a couple of things, right?
6:41
So when we see these numbers and by the way, for Wisconsin, these numbers are presented in what we call the A2809.
6:50
That’s just the number we gave to our nutrient application guidelines, right, for the state of Wisconsin.
6:58
So, so when you look in there, you see a bunch of numbers for first year nitrogen availability.
7:03
What I want to highlight here is the variables that are considered or the variables behind these numbers, right?
7:12
For example, for Wisconsin, we look at OK, what was the application method and the time to incorporation, right?
7:21
What was the time to incorporation?
7:23
So we talked about whether it was incorporate, whether whether it was injected incorporation, the time to incorporation, that sort of thing, right.
7:33
The University of Minnesota takes it a step further and they talk when they talk about injection, they also talk about the difference between sweep injection or knife injection or you sweep injecting or injecting with knives, knives or coulters, right?
7:49
So there’s always these variables that we need to look into.
7:53
And again, I’m going back to my earlier statement.
7:57
As we’re going through this, I want you to think as at, I want you to think about opportunities, opportunities to further refine our recommendations.
8:07
When you look at Iowa, you see that they also say that the, the, the variability that they present is as a function of bedding type, bedding amount and so on and so forth.
8:19
I’m going to move on.
8:20
This is a table that you’ll see in our nutrient application guidelines, right?
8:26
You see first year availability, second year availability, third year availability for different manure types.
8:33
And for example, if we look at solid, solid beef manure, right, you see that for unincorporated manure or you know, incorp manure that sits on the surface for more than 72 hours that the availability is 25%, OK?
8:53
That is an availability index, if you will, right?
8:56
It’s a percentage 25% is going to be available in that first year.
9:01
Now here’s what I want you to know, that 25% that includes both the ammonium that is not lost and the mineralization rate, OK?
9:12
I want you to understand that.
9:15
However, not everybody does it that way, right?
9:19
If you look at how and these availability coefficients and availability or plant available nitrogen specifically is calculated, Wisconsin uses that first one right.
9:32
We look at total nitrogen times, an availability coefficient that you saw in that table that I presented right, times the rate of manure that you apply.
9:42
However, some people needed to need to see it clear.
9:45
They want it separate.
9:46
They look at that ammonium nitrogen and then a mineralization coefficient for your organic nitrogen.
9:53
Others take it a step further and say, no, you can’t just consider the ammonium, you have to consider the loss of it.
10:00
So there’s a loss coefficient also.
10:03
You know, a time will not permit me to go into great detail with each one of these equations.
10:09
But the debate here, the discussion is not whether 1 is better than the other.
10:14
I’m just showing you that there’s several different ways to calculate availability availabilities, in particular the plant available nitrogen, right?
10:25
And what all goes into these, these calculations?
10:30
All right.
10:30
So how do we come to these different availability coefficients that, well, there’s different ways when we look at the availability of, of, of nitrogen and, and, and, and how it’s calculated in, in, in different papers and research and whatnot, you see that the most common method is fertilizer equivalence, right?
10:48
You might have heard of it.
10:50
And then there’s mineralization or decay series, right, that people create by, for example, in field with litter back technique, with the litter back technique or in the lab, right?
11:02
And so with an incubation study.
11:04
And then there’s salt test indices, right, the pre side dress nitrate test, right and in season nitrate test that we do right can be a good measure of to evaluate how much of that manure nitrogen mineralized over the season up to that point, right.
11:24
We have to distinguish between availability and recovery though there, there can be some confusion with availability.
11:31
So the first part is availability, but some people also calculate or look at recovery and recovery is nothing more than answer the question, hey, how much nitrogen makes it into the crop, right?
11:46
So that’s another level, right?
11:48
So, but I want to focus on that availability, but I want you to know that these two methods to estimate recovery, the difference method using labeled nitrogen is another way in which we track trace where that nitrogen from the manure is going.
12:04
Does it end up in the crop?
12:07
All right, so this is an example of that fertilizer equivalents.
12:10
What we see here is basically what fertilizer equivalents, what you’re trying to do.
12:14
You’re trying to see what fertilizer nitrogen rate would give you the same yield, or in this case, in this example, the nutrient uptake would give you the same nutrient uptake as a given rate of manure.
12:29
OK, That’s what you’re looking at, right?
12:31
So in this example, you see that the rate of 60 kilograms of nitrogen, 60kg of nitrogen per hectare and 194kg of nitrogen per hectare coming from manure give you that same nutrient uptake.
12:46
So my availability coefficient in this example would be 31 percent, 60 / 194 * 100, right?
12:56
31%, right.
12:59
So, so that’s that and and using this methodology then Laboski et al looked at injection surface applied, surface broadcasting over different years, you know, of manure and calculated the the, yeah, the availability coefficient out of this.
13:18
And that 51% for injected manure off looks, looks very close to that injected manure that you saw in the previous table we talked about.
13:27
I think it was around 50%, right?
13:31
All right.
13:32
The other thing that I want to point out is the variability from year to year, right?
13:36
So we see that effect of environment coming back.
13:40
All right, quickly moving on to mineralization.
13:42
So remember that I said there’s different ways in which mineralization coefficients come about, right?
13:48
Either in lab studies or by burying bags in the in, in, in the field litter bag technique, right?
13:56
And that is how some of these numbers come about.
13:59
In this case, this was the lab study with different soil types where they looked at raw manure versus digestive manure and and came up with these availability coefficients that you see here in that last column, like for example, for a raw 39%.
14:16
The thing I want to point out here is Please note the variability.
14:21
Again, we’re going through this thinking about opportunities to refine our current recommendations.
14:30
All right.
14:32
I talked about, I mentioned the pre-sidedress nitrate test.
14:35
I looked at this study.
14:36
So this study was conducted number of years ago, 2004, five and six.
14:42
This was on farm research where they looked at how fertilizer, where you applied treatments, where you applied fertilizer versus manure, how they compared when it comes to pre-sidedress nitrate, nitrate test.
14:56
And two things that stand out to me.
14:59
Look at 2005, right?
15:01
Why do we have that?
15:03
Most of the values there are over that threshold value, that critical value of 21 PPM, by the way, that is the value that we use to determine whether a, a, a plot, whether a field would need additional nitrogen.
15:19
And it’s if it’s over that 21 PPM, no additional nitrogen is needed.
15:23
So if you look at 2005, clearly a lot of these fields right had plenty of of of nitrogen, nitrogen, right, whereas 2004, 2006 not not so much.
15:37
So that’s one one thing that jumps out of me.
15:39
The other thing is that not if you look at the different data points you see that not always was the pre-sidedress nitrate test able to distinguish between the fertilizer nitrogen, which by the way are these black bars and then the the manure, right.
15:59
So, so oftentimes there was not a statistical difference.
16:03
That kind of leads me to the question to ask, OK, how reliable is the PSNT, the pre-sidedress nitrate test then as an indicator of nitrogen mineralization from manure?
16:17
Don’t understand me wrong, It has been used to to measure in season nitrate and nitrate nitrate availability or nitrogen mineralization from manure, right.
16:29
So it is a good, a good soil test.
16:33
However, is it enough to give us the whole picture of what’s happening with nitrogen mineralization?
16:40
And in general, there is agreement that one index, one soil test in and of itself is not enough to give us that full picture of what’s happening with nitrogen mineralization during the season.
16:53
In fact, in fact, from this study, it was interesting to know that when they interviewed the participants, the farmers, they seem to trust their own analysis of the weather and their crop history of the field in addition to the nutrient content of content of the manure.
17:13
They trusted that better than the pre-sidedress nitrate test in and of itself All right so that’s interesting that that is an interesting finding from from this study all right so I mentioned the the recovery how recovery is kind of different from availability, right.
17:33
This this is just a study to show where this difference method was used to calculate nitrogen recovery.
17:43
So how much of that nitrogen from the manure ends up in the crop?
17:48
The, I would say one of the weaknesses of this method is that it assumes, right, that regardless of treatment, whether you have a high rate or a low rate of, of, of manure applied, that the same amount of nitrogen is delivered by the, by the soil itself, right?
18:09
So it doesn’t matter the manure treatment, the soil delivers the same amount of nitrogen to all your fields or all your treatments.
18:19
Is that true?
18:20
Well, some will argue that there is an additional effect or an effect when you add more manure, you’re making the microbes more lively, I would say more active, right?
18:33
They burst with energy, right?
18:35
We call that the priming effect, right?
18:38
So that is a weakness that we see with with, with this, with this method.
18:42
It just assumes that everything is the same regardless of treatment.
18:48
This is another example of where that same method was used to calculate nitrogen recovery, looking at different manure types.
18:55
And clearly there’s a lot of variability.
18:58
We found nitrogen recovery ranging from 2 to 52%.
19:02
That’s, that’s quite a bit.
19:03
So you’re saying, Natasha, we know all this now, right?
19:06
We have done a lot of research and that’s true in Wisconsin.
19:10
We’ve done a lot of research with manure.
19:12
What’s left to know?
19:14
Where do we go from here?
19:15
Well, in going around the state and talking to different stakeholders at different events and so on, right?
19:22
There’s plenty to do, right?
19:24
And, and, and one thing that keeps coming back is people just want to understand nitrogen dynamics when you have applied manure before or into a cover crop, right?
19:34
What I keep hearing is that what about applying manure into a living crop?
19:40
What are the nutrient dynamics there?
19:42
Understand that people have lots of questions about processed manure, right?
19:46
And understanding nitrogen credits from that methods of application.
19:52
We went over when I went over the slides, I did point out, right, that there’s universities that dive deeper into in, in greater detail about how did you apply the manure?
20:03
Did that have an effect?
20:05
Others look at a different bedding materials and so on and so forth.
20:09
So there’s, there’s plenty of opportunity here.
20:11
And I think, and I think I must mention this, updating the A2809, which is something we’re currently working on provides an excellent opportunity for us to ask these questions and to dive in deeper into trying to answer some of these questions, right.
20:31
So in summary, I want to say this nitrogen availability from manure is, is, is highly variable, you know, and, and very unpredictable if you think of nutrient content, we talked about the variability there, losses during and after application, right?
20:48
And it will always be, in my opinion, an estimate, always an estimate.
20:55
But is there an opportunity to refine these estimates?
20:59
Absolutely, as I said, right?
21:01
We can look at different weather patterns, various cropping systems, nitrogen creds based on soil type and so on and so forth, timing of application, right, processed versus raw manure and so on.
21:13
But here’s what I want to leave you with, right?
21:16
No matter how accurate our estimates, proper manure testing will always remain remain important.
21:27
And thank you.
21:28
Thank you for your time.
21:30
That’s all I had.
21:34
Chris, I don’t know if there’s questions, but I, I saw them drop some information in the chat, but you can definitely check that.
21:42
I didn’t see any immediately, but there could be some follow up ones now that you’re done speaking that you can address it.
21:48
Yep, I just saw one come in.
21:50
So do look in there.
21:51
And yeah, excellent.
21:55
I love the enthusiasm and I’m really happy that we have you to work on continue the manure research in our state for for our farmers.
22:05
It’s really beneficial.
22:08
Do you see that question in the chat, Natasha?
22:14
OK, let’s see here going down here Has UW done any investigation into biochar effects on nitrogen retention and availability from stored liquid manure?
22:26
I know that there is some biochar work going coming out of Platteville and Becky is on the call here.
22:38
I know Becky you were involved with with with some of that as well.
22:42
So I know that there’s work going on there in terms of the nitrogen retention itself and availability.
22:49
So nitrogen credits that is kind of that, that’s kind of my thing.
22:53
You know, I have that, that, that question or ask that question of the data.
22:59
But, and I know that one, at least one, one field trial is going in this summer.
23:07
So it’s, it’s definitely in the works, but I can’t speak to the the data so far if, if that makes sense.
23:17
Yeah, Thanks, Natasha.
23:18
Thank you again for for your time today and in your presentation.
Badger Crop Connect
Timely Crop Updates for Wisconsin
Second and fourth Thursdays 12:30 – 1:30 p.m.
Live via Zoom