Video Summary
In this video, Chris Clark, northeast Wisconsin nutrient and pest management outreach specialist with UW–Madison Extension, discusses whether Wisconsin liquid dairy manure can meet the micronutrient needs of row crops. She presents data from 29 years of manure samples, highlighting trends in micronutrient levels such as calcium, magnesium, sulfur, boron, copper, zinc, manganese, and iron. The presentation emphasizes the importance of regular manure testing to ensure nutrient adequacy for crops like corn, soybeans, and alfalfa. Chris also provides best management practices for manure application and discusses the variability in nutrient content due to factors like soil type, climate, and manure management.
Resources
- Manure Micronutrient Trend Data (University of Minnesota)
- Soil and Applied Boron (UW–Madison)
- Soil and Applied Sulfur (UW–Madison)
Transcript
0:05
All right, I’m up next and I’m going to be sharing on behalf of a team of people.
0:12
Can our Wisconsin dairy liquid manure provide enough micronutrients for our row crops?
0:18
And once again, I’m Chris Clark with the Nutrient and Pest Management team and outreach specialist in Northeast Wisconsin.
0:26
If you apply manure to alfalfa, if you have low organic matter soils that you’re working with growers on or you have fields within your farm that have low organic matter.
0:39
So I would say that’s 2% or less organic matter.
0:43
If you’re growing soybeans or corn silage and you have a vegetable canning crop that you fit into your crop rotation somewhere during the years of your cropping, this presentation is for you.
0:57
So pay attention.
1:00
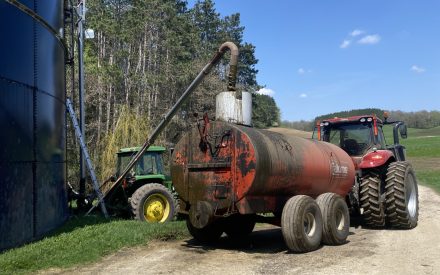
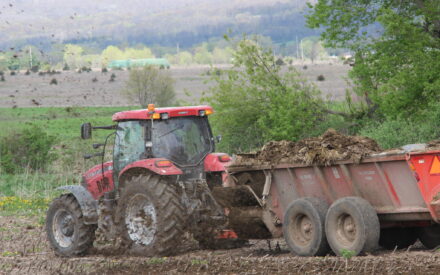
Overall, we do have a lot of manure in Wisconsin.
1:04
So some of the numbers that I could find is Wisconsin dairy farms produce an equivalent of about 12 billion gallons of dairy manure annually.
1:14
And a lot of that goes on to our our crop fields.
1:17
And it’s very hard sometimes to find agricultural fields that don’t have a manure history.
1:23
Why?
1:23
Well, we know that it has a great amount of nitrogen, phosphorus and potassium that’s provided in those manure sources.
1:32
Today, my focus is going to be on maybe the ones that are a little bit more overlooked.
1:37
So there’s a couple of secondary nutrients, calcium, magnesium and sulfur.
1:43
And then overall, our main question is about boron, copper, zinc, manganese and iron.
1:49
So our micronutrients, and I just have to put a little footnote there is not all, all of our plant micronutrients are actually analyzed in our manure samples.
1:57
So we don’t have all of the essential plant nutrients, but we’ve got a good chunk of them.
2:03
So here’s what this team did.
2:06
Natasha, our previous speaker, she was involved as well as Jerry Clark.
2:10
He’s a extension educator.
2:13
We have my coworker from the nutrient pest management team, Dan Marzu and myself as well as from AgSource Laboratories, a private laboratory, Dr Jim Friedrichs was involved with looking at this data.
2:26
So we organized 28 years of data.
2:29
So we have two previous data sets and when we saw that we’re like, you know what the last one was in 2015, it’s time that we bring that up to the forefront again.
2:40
So we were only looking at liquid dairy manure with that 11% dry matter intake and it also had to have micronutrient data on there.
2:51
And then once again, that was broken into those three different data sets that were out there.
2:56
Why is this suitable for our our dairy systems?
3:00
We know that even across the state of Wisconsin, we have varying climate.
3:05
So it’s still a little bit chilly, a lot cooler up here.
3:09
We get different amounts of rainfall.
3:11
We saw Josh present on different amounts of rainfall that are happening and that changes annually and throughout the different years, different soil types.
3:19
We’ve got definitely different management systems that we have both for how the cattle are fed, how the crops are fertilized and how the the manure is then contained, spread and moved around.
3:34
So all of these things together are then really useful because of that diversity that’s on our dairy farms.
3:41
And then looking at the big data, so 28 years of data, you’re like, what can that really tell us today?
3:46
Once we have that data, we can see some of the trends for things either increasing, decreasing, staying the same, and then we can watch for those items maybe a little bit closer on our individual farms.
4:01
So here are the three different data sets that were out there.
4:04
So in 1995, Ron Wiederholt is kind of the first one that had some information that we could find that also included book values, not just for N, P, and K, but he also dove into those micronutrients.
4:20
We, we couldn’t even necessarily find how many samples he used to put into that, that data set.
4:27
Then back in 2013 through 2015, now retired extension educator Richard Halopka, he teamed up with the nutrient pest management team as well as the university soil and forage testing lab.
4:41
And he looked at a lot of the same stuff that I’m presenting today.
4:45
He had 100 samples from of liquid dairy manure.
4:48
They analyzed it for the micronutrients.
4:51
Then how did we pull information into today’s data?
4:58
We had from 2021 through 2023, Doctor Jim Friedrichs pulled just Wisconsin dairy manure that had an analysis for the micronutrients and we had over 800 samples that we were able to pull into the data set.
5:15
Here’s the data.
5:17
Looking at it again, one of the things is we wanted to separate it by those secondary nutrients, calcium, magnesium, and sulfur, and then the iron, boron, copper, manganese, and zinc that were analyzed in it.
5:29
And you can see those three different things.
5:31
Well, I wouldn’t be a good extension educator if I provided you just with this chart, so we came up with graphs that tell a better story.
5:39
So here’s the first one.
5:41
And if you want to remember back the, the book value or the oldest data set from 1995 is the red line.
5:49
I put like a small clock symbol by that.
5:53
And then the W for the University of Wisconsin, that’s Richard Halopka’s data.
5:59
That’s the last data set that we had.
6:01
So that’s the Wisconsin W, it’s kind of like a light blue line.
6:05
And then we have our dairy cow that’s representing our dairy manure as close as we can to a complete data set right now in yellow.
6:13
I also put blue arrows.
6:15
And if we look from the left side of the graph to the right, we’ve got a blue arrow that’s going up above calcium.
6:22
That means that those numbers are trending higher across all of these 28 years of data.
6:27
The same thing is true for magnesium.
6:29
The numbers for the for magnesium is trending higher and then we get all the way to the right side and we have sulfur where we’ve got a yellow arrow pointing down.
6:39
This one is trending lower in our big data for the liquid dairy manure samples from Wisconsin.
6:48
Now we’re going to dive into the micronutrients all the way on the left side, kind of way above.
6:53
On the top, we’ve got iron.
6:55
That one is probably the highest one that we have with the largest amount of increase across all of the data.
7:02
Then we have boron.
7:04
That one has a yellow arrow.
7:05
We’re trending low across our 28 years of boron in our manure samples and then a combination of copper, manganese and zinc.
7:14
Those ones are all trending higher within our liquid dairy manure samples.
7:21
So here’s kind of a summary again, the calcium, magnesium, iron, zinc, copper and manganese, those values are all trending higher across the that those three data sets.
7:33
And then sulfur and boron are trending lower across all of the years as well.
7:39
So again, like Natasha said, one of the important things that we can denote from this is does your farm actually fit this same trend?
7:48
And the only way that you’re going to know that is collect a recent sample from your different manure sources, make sure that it’s representative, use clean equipment, take several sub samples as you’re like emptying A manure lagoon or make sure that it’s well mixed.
8:05
And then make sure that you choose a proper package.
8:07
So they’re not necessarily going to test the micronutrients in the basic manure package.
8:13
You’re going to have to check off those specific ones that you want or they may be a whole package.
8:20
So overall we still are asking the question, is the liquid dairy manure meeting our Wisconsin micronutrient needs for our row crops.
8:28
Overall, we know that micronutrient deficiencies are fairly rare in Wisconsin for our row crops.
8:34
Again, we have other crops that it it could be more of an issue.
8:38
But one thing that we do know is that when they are occurring in our fields that they tend to be spotty.
8:43
It’s not usually a whole field issue that we’re going to have a micronutrient issue.
8:49
They’re they tend to be in high demanding crops that have this micronutrient demand.
8:56
So we’ll we’ll get a little bit more into that.
8:58
But that information comes from again our recommendations A2809 as well as fields that have that sandy low organic matter condition out there.
9:08
So again, test your manure sources and then what crops might you be growing that have a high micronutrient demand and was it any of the ones that we just talked about in manure are trending low?
9:21
So I adapted this from Table 8.3 from A28 09 and again these are the nutrients that are trending higher in the manure right now.
9:33
So if I was growing alfalfa, I don’t really have anything that I’m gaining from these manure sources for these micronutrients.
9:42
But if I go down to soybeans, they have a really high demand for manganese.
9:47
And if I’m applying manure to my soybean fields, I’m probably meeting that demand for manganese as well as in wheat, a high demand for manganese.
9:56
And our pastures, if we have cows out there regularly rotationally grazing or they’ve been out there throughout the winter time, we can have a manganese being met in the in the crop need, OK.
10:10
So we also have some crops that have high micronutrient demands for some of the ones that we have that are in low amounts and these are dropping lower across all 28 years.
10:21
Alfalfa, ooh, We both have it for sulfur and boron and we said those ones were both trending lower in our manure data.
10:30
Corn silage has a high demand for sulfur as well as for soybeans.
10:34
And then pastures also have a high need for boron.
10:38
So those then are some particular crops that we might need to watch.
10:42
If you are advising someone on these crops or these are big ones on your your farm, you might want to look at a little bit closer.
10:51
And is there anything that you should be doing differently If you have alfalfa, corn, silage or soybeans on your farm, we can stick to these best management practices.
11:02
Again, this is suggested by our A2809 for micronutrient applications is first, you know that you have that high demand.
11:11
So we just went through those charts and we said here are the row crops that are at the highest level for some of the ones that are low in manure sources right now.
11:20
We also then have to confirm with a soil test that that micronutrient is testing low.
11:26
And again, unless you’re asking for the micronutrients, you may or may not be getting that data right now in your last soil test.
11:34
So go back and confirm that you may be tested for sulfur or boron in your fields and then this year in your growing season, collect plant tissue samples.
11:44
And those also also can determine through the plant tissue analysis whether or not it is low in that particular field.
11:54
So here’s a manure application example for you.
11:57
We got some kind of crop removal estimates for the micronutrients from Purdue University for a 200 bushel yielding corn or a 60 bushel soybeans.
12:11
And then we have 6 ton alfalfa.
12:15
So in the red I have that.
12:17
We applied from the data that we had, the most current data, 7000 gallons of liquid dairy manure.
12:24
Let’s say we’re going to put it on corn, the soybeans, or the alfalfa.
12:28
So first the iron we’re getting 9.03.
12:31
We said that was the highest one that had gone up in the trend.
12:36
We’re meeting at the 2.4 lbs per acre for corn, soybeans and alfalfa.
12:41
The same is true for manganese 1.099.
12:45
We’re meeting the needs of that .4 for corn, .6 for soybeans and alfalfa as well.
12:51
Zinc, we had 2.366 being provided from the dairy manure.
12:56
We’re definitely meeting all of those crop needs across there until we get to boron.
13:03
So we already kind of signified this.
13:04
The big data told us to pay attention to this one.
13:07
We’re only getting .0175 from our 7000 gallon liquid dairy manure, but our corn is looking for .2 lbs per acre.
13:16
Our soybean, we’re probably meeting that need.
13:19
Unfortunately, my image, I can’t see the alfalfa one. I think that one’s a little bit short as well.
13:26
And then copper, we’re meeting the needs of that.
13:31
So that just gives you an example of the importance again of taking your manure samples.
13:37
We also have another great resource in the Midwest where some data is really being collected.
13:43
So it’s called the manure DB and it’s for manure database.
13:47
This is the University of Minnesota.
13:49
They have multiple different partners and stakeholders within their university, as well as their agronomy department, where they’ve created a big database.
13:59
They have cooperating laboratories, both university labs and private labs that are contributing data to this.
14:07
Why are they doing this?
14:08
They want to keep our book values up to date and so we can then dive into that.
14:15
Here’s some of the stuff that it looks like and you can sort by different species.
14:21
Some of the main ones are beef, dairy, swine, poultry, and horse.
14:24
You can look for particular years that you want data.
14:28
If you’re from a particular state or if you want to do like an area of the US, you can look at that and then it’s going to give you information for that.
14:37
Nitrogen, phosphorus, and potassium.
14:39
Unfortunately, it doesn’t have any of the data that I presented to you today except for sulfur.
14:47
So that could be something that maybe over time they’ll be able to add to it.
14:52
Again, I echo that manure is a variable source of nutrients.
14:58
So it depends on what goes into the animal of what’s going to be coming out.
15:04
And the only way that you know about that is through regular analysis of your manure sources.
15:10
So by looking at the data, we did see that sulfur and boron are continuing to decrease in our liquid dairy manure sources.
15:19
So we may not be meeting the need of some of those high demanding crops out there, alfalfa, corn silage, or soybeans, especially in low organic matter soils.
15:29
So 2% or less.
15:31
So if you do have those low organic matter soils and you’re a farmer or a crop consultant or a a seed dealer out there, you may want to use a field test strip and then check on responses for sulfur and boron products.
15:44
It’s, it’s to your advantage to potentially add something into a starter mix in this scenario and check for it.
15:52
But on the flip side, we have plenty of calcium that’s being added in there.
15:57
There’s iron that’s probably in the highest amount.
16:00
We did some conversations that we don’t feel that any of this is is affecting crop growth as well as we talked with the dairy nutritionist and there’s no implications that zinc levels are getting a little high or copper is is trending higher in the manure as well that we’re applying to maybe an alfalfa field.
16:18
So overall, we feel like Wisconsin agronomists are already doing a really good job of watching the sulfur and watching some of the boron in these particular row crops.
16:28
Once again, I only did focus on row crops here.
16:32
So if you do have canning crops and you do have specialty crops, those vegetable crops, they definitely have higher needs and are much more sensitive to the micronutrients.
16:42
But we don’t traditionally put as much manure on those fields.
16:47
So if you do have questions, you can dive into that, that table on 8.3 and look up the demand levels for your different crops that you grow.
16:56
There’s 2 technical bulletins on sulfur and boron.
17:00
Feel free to reach out to myself or Natasha.
17:03
She’s been involved in this project the entire time.
17:06
And I do want to thank both AgSource Laboratories, the nutrient and pest management team, as well as our our previous data set contributors, Jerry Clark and Richard Halopka.
17:17
We were happy to just continue their project and add to it for you guys this year.
Badger Crop Connect
Timely Crop Updates for Wisconsin
Second and fourth Thursdays 12:30 – 1:30 p.m.
Live via Zoom