Objectives of the Wisconsin Alfalfa Yield and Persistence (WAYP) Program
- To verify the yield and quality of alfalfa harvested from production fields over the life of the stand beginning with the first production year (year after seeding).
- To quantify decreases in stand productivity of alfalfa fields as they age.
- To provide an objective dataset to other researchers seeking to answer questions about alfalfa growth, yield, and quality.
2025 Wisconsin Alfalfa Yield and Persistence Project Overview
This summary includes nineteen years of project data. UW-Madison Division of Extension educators were asked to identify forage producers willing to weigh and sample forage from 2024-seeded alfalfa fields and continue to do so for the life of the stand.
Six new fields were enrolled in the program in 2025 and 11 fields continued from previous years. Three of the new fields were on returning farms that had not enrolled a field in over ten years.
The current summary includes data for the first, second, third, and fifth production years from fields entered in the program from 2021 through 2025 (2020-2024 seeding).
This is the first time a field has been measured in the fifth year. However, no fourth-year stands remained in the project this year. A fourth or fifth production year has been measured 24 times, which is fortunate because they are valuable for obtaining long-term data.
As is always the case in these types of studies, there is some attrition of fields over time. This is either because the farmer decided to terminate the field because of winterkill, declining productivity, or because critical yield or forage quality data for single or multiple cuttings could not be obtained. This year, there were five fields dropped from the project that participated in 2024. All were older stands that were seeded in 2020 or 2021.
Production data was collected from 17 fields in 2025 with a total of 5,175 dry matter tons of forage harvested, weighed, and sampled across 1,054 acres. Over 19 years, data was collected from 144 fields with a total of 88,765 dry matter tons of forage harvested, weighed, and sampled from 8,824 acres. Background information on all project fields (current and past) is presented in Table 1. No fields had a fall cut in 2025. Fall cuts from 30 fields taken after October 1 are separated from Cuts 1-5 when yield or quality is shown by cut.
5-Year Weather Trends
2025 Weather
Very little winterkill was observed after a moderate winter despite snowfall totals being much below normal. Spring conditions fluctuated with March and April being warmer and drier than normal and May having cooler temperatures with precipitation generally below normal, although one location was above normal. Early summer saw above-normal temperatures and normal-to-above-normal precipitation. Temperature was below normal in August, but much above normal for the rest of fall. Precipitation was below normal from August through fall, causing delayed germination of summer-seeded stands. These stands eventually grew and established, and the stands looked good going into winter.
2024 Weather
Spring started with an early snowmelt and warm February and March temperatures. Very little winterkill was observed and much of Wisconsin was under drought conditions. Normal to above-normal temperatures in April and May led to timely fieldwork and planting. Near-record precipitation from mid-May through early July delayed harvest and stressed new seeding fields. Conditions then turned drier with July being normal and August to October below normal. This resulted in delayed germination in summer-seeded stands. Temperatures were normal from June through August and much above normal from September through November. This gave established stands time to recover heading into winter. Rain in November helped to alleviate drought conditions that developed during the fall.
2023 Weather
Spring started similar to 2022, with very little winterkill observed after a near-record winter snow provided adequate winter cover. Snowmelt recharged the soil, and some areas in northern and western Wisconsin experienced flooding. Normal to above-normal temperatures in April and May led to timely fieldwork, but cool soil temperatures slowed alfalfa green-up. Conditions turned dry in mid-May with some areas receiving little or no rainfall until July. Precipitation was adequate in July, but dry in many areas from mid- August through September, resulting in challenges for summer-seeded stands. Temperature was average to above average through the summer and wildfire smoke affected air quality in June and July. Fall temperatures remained above average and rainfall in October was welcomed to provide growth and strengthen stands heading into winter.
2022 Weather
Adequate winter snow provided cover, and there was very little winterkill observed. A cool, dry April led to a quick start to fieldwork but slowed alfalfa green-up. May temperatures were above normal, but precipitation was still below, and alfalfa seedings were slow to germinate. Mid-summer temperatures and precipitation were near normal. Temperature and precipitation from August through the fall were above normal, leading to good establishment of summer-seeded alfalfa and good fall growth of established stands. Fields entered winter with near-saturated moisture conditions.
2021 Weather
Spring again started with an early snowmelt and cool and dry conditions. This again allowed for timely seeding of alfalfa and other crops but slowed spring alfalfa growth and development. There had been a concern if alfalfa would survive the winter because of a warm fall and green growth into December, but winterkill was not observed in most areas was and very light if it occurred. Temperatures in March and early April were above normal, but late April and May were below normal. Summer and fall temps were above normal and a widespread killing frost did not happen until October 22. Precipitation varied throughout the state as it usually does. Early spring was generally drier than normal, allowing for timely fieldwork. June and July were also below normal. Heavy rain fell in August across central and eastern Wisconsin while southern areas had near-normal rainfall. Summer-seeded alfalfa was planted on time and received enough moisture for adequate growth. Fall precipitation was again below normal, allowing for a timely harvest. Most of the state went into winter with depleted subsoil moisture and an abnormally dry or moderate drought classification from the U.S. Drought Monitor.
2020 Weather
An early snowmelt in March turned into a cool and dry pattern. This allowed for timely seeding of alfalfa and other crops, but slowed spring alfalfa growth and development. Many growers, especially in northeastern Wisconsin experienced winterkill resulting in lost or severely reduced stands. Temperatures in April and May were below normal. Summer temps were above normal, and early fall was slightly below normal. Precipitation varied throughout the state. Early spring was generally drier than normal allowing for timely fieldwork and May through August was mostly normal, enough to provide crop needs and not interfere with timely harvest as in previous years. Some areas started to get dry by mid-summer and fall was normal to below normal. Summer-seeded alfalfa was planted on time and received enough moisture for adequate growth. A warm November (third warmest on record in Arlington) prevented stands from properly hardening off for winter dormancy and green growing plants were still observed in December.
Table 1. Field Background Information
Table 1. Field Background Information
| Field # | County | Field Size (ac) | Seeding Mo/Yr. | Seeding Rate (lb/ac) | First Production Year | Last Production Year |
|---|---|---|---|---|---|---|
| 107 | Outagamie | 103.7 | 05/06 | 15 | 2007 | 2009 |
| 207 | Outagamie | 79.3 | 04/06 | 16 | 2007 | 2009 |
| 307 | Outagamie | 37.0 | 04/06 | 16 | 2007 | 2010 |
| 407 | Outagamie | 156.7 | 04/06 | 16 | 2007 | 2009 |
| 507 | St. Croix | 51.0 | 08/06 | NA | 2007 | 2009 |
| 607 | Waupaca | 24.1 | 04/06 | 15 | 2007 | 2007 |
| 707 | Fond du Lac | 15.7 | 04/06 | 17 | 2007 | 2007 |
| 807 | Fond du Lac | 39.7 | 04/06 | 17 | 2007 | 2010 |
| 108 | Chippewa | 18.8 | 04/07 | 15 | 2008 | 2009 |
| 208 | Marathon | 5.2 | 04/07 | 15 | 2008 | 2011 |
| 308 | Winnebago | 115 | 05/07 | 15 | 2008 | 2011 |
| 408 | Winnebago | 36.0 | 08/07 | 15 | 2008 | 2011 |
| 508 | Winnebago | 22.0 | 05/07 | 15 | 2008 | 2011 |
| 608 | Outagamie | 83.7 | 05/07 | 20 | 2008 | 2011 |
| 708 | Outagamie | 147.8 | 04/07 | 16 | 2008 | 2011 |
| 808 | Outagamie | 53.0 | 04/07 | 16 | 2008 | 2011 |
| 908 | Outagamie | 50.3 | 05/07 | 15 | 2008 | 2011 |
| 1008 | Outagamie | 194.8 | 08/07 | 15 | 2008 | 2008 |
| 109 | St. Croix | 41 | 08/08 | NA | 2009 | 2011 |
| 209 | Winnebago | 67 | 04/08 | 15 | 2009 | 2012 |
| 309 | Winnebago | 78 | 08/08 | 15 | 2009 | 2011 |
| 409 | Brown | 75 | 08/08 | 18 | 2009 | 2011 |
| 509 | Chippewa | 16.2 | 04/08 | 15 | 2009 | 2009 |
| 609 | Calumet | 15 | 04/08 | 12 | 2009 | 2011 |
| 709 | Outagamie | 74.8 | 05/08 | 20 | 2009 | 2010 |
| 809 | Outagamie | 63 | 05/08 | 20 | 2009 | 2010 |
| 110 | Outagamie | 48 | 05/09 | 16 | 2010 | 2010 |
| 210 | Outagamie | 110.2 | 05/09 | 16 | 2010 | 2012 |
| 310 | Outagamie | 61.7 | 05/09 | 16 | 2010 | 2012 |
| 410 | Outagamie | 111 | 05/09 | 16 | 2010 | 2012 |
| 510 | Fond du Lac | 50.3 | 04/09 | 17 | 2010 | 2012 |
| 610 | Fond du Lac | 19.3 | 04/09 | 17 | 2010 | 2012 |
| 111 | Fond du Lac | 10 | 04/10 | 17 | 2011 | 2013 |
| 211 | Brown | 35.7 | 04/10 | 17 | 2011 | 2012 |
| 311 | Outagamie | 75.8 | 05/10 | 20/+4 TF | 2011 | 2011 |
| 411 | Outagamie | 72 | 05/10 | 20/+4 TF | 2011 | 2011 |
| 112 | St. Croix | 73.9 | 08/11 | 16 | 2012 | 2012 |
| 212 | Kewaunee | 73.5 | 05/11 | 17 | 2012 | 2014 |
| 312 | Outagamie | 143.6 | 05/11 | 16 | 2012 | 2014 |
| 412 | Outagamie | 75 | 05/11 | 16 | 2012 | 2014 |
| 512 | Outagamie | 189 | 05/11 | 16 | 2012 | 2014 |
| 612 | Outagamie | 45.9 | 05/11 | 16 | 2012 | 2014 |
| 712 | Outagamie | 38.7 | 05/11 | 16 | 2012 | 2013 |
| 812 | Dodge | 59.6 | 05/11 | 16 | 2012 | 2013 |
| 113 | Columbia | 44.6 | 08/12 | 15 | 2013 | 2015 |
| 213 | Outagamie | 150.7 | 04/12 | 16 | 2013 | 2014 |
| 313 | Outagamie | 54 | 04/12 | 16 | 2013 | 2014 |
| 413 | Outagamie | 79.3 | 04/12 | 16 | 2013 | 2014 |
| 513 | Brown | 156 | 08/12 | 28 | 2013 | 2013 |
| 114 | Fond du Lac | 32.8 | 04/13 | 19 | 2014 | 2016 |
| 214 | Fond du Lac | 35.7 | 07/13 | 17 | 2014 | 2016 |
| 314 | Fond du Lac | 9.4 | 05/13 | 15 | 2014 | 2016 |
| 414 | Fond du Lac | 20.3 | 05/13 | 18 | 2014 | 2017 |
| 514 | Kewaunee | 32 | 05/13 | 21 | 2014 | 2016 |
| 614 | Door | 60.8 | 05/13 | 18 | 2014 | 2016 |
| 714 | Columbia | 9.4 | 04/13 | 14 | 2014 | 2017 |
| 814 | Pierce | 16.3 | 09/13 | 15 | 2014 | 2015 |
| 914 | Marathon | 14.2 | 07/13 | 12 | 2014 | 2015 |
| 1014 | Marathon | 32.5 | 06/13 | 15 | 2014 | 2016 |
| 1114 | Outagamie | 104.3 | 05/13 | 16 | 2014 | 2014 |
| 1214 | Outagamie | 156.8 | 05/13 | 16 | 2014 | 2014 |
| 1314 | Outagamie | 69 | 06/13 | 16 | 2014 | 2014 |
| 1414 | Outagamie | 38.9 | 05/13 | 20/+3.5 TF | 2014 | 2016 |
| 1514 | Outagamie | 76.7 | 06/13 | 20/+3.5 TF | 2014 | 2015 |
| 115 | Manitowoc | 19.3 | 06/14 | 16 | 2015 | 2017 |
| 215 | Door | 52.0 | 07/14 | 18 | 2015 | 2016 |
| 315 | Outagamie | 55.7 | 05/14 | 16 | 2015 | 2016 |
| 415 | Outagamie | 110.2 | 05/14 | 16 | 2015 | 2016 |
| 515 | Outagamie | 86.5 | 05/14 | 16 | 2015 | 2018 |
| 615 | Outagamie | 45.8 | 05/14 | 16 | 2015 | 2016 |
| 715 | Outagamie | 225.0 | 05/14 | 16 | 2015 | 2016 |
| 815 | Marathon | 11.4 | 06/14 | 18 | 2015 | 2017 |
| 915 | Marathon | 5.61 | 06/14 | 15 | 2015 | 2016 |
| 1015 | Columbia | 15.9 | 04/14 | 15 | 2015 | 2018 |
| 116 | Marathon | 20.0 | 04/15 | 12 | 2016 | 2017 |
| 216 | Outagamie | 215.7 | 05/15 | 16 | 2016 | 2016 |
| 316 | Outagamie | 108.6 | 05/15 | 16 | 2016 | 2016 |
| 416 | Outagamie | 65.0 | 05/15 | 16 | 2016 | 2016 |
| 516 | Outagamie | 78.2 | 05/15 | 16 | 2016 | 2016 |
| 616 | Outagamie | 90.0 | 05/15 | 16 | 2016 | 2016 |
| 716 | Columbia | 11.9 | 05/15 | 16 | 2016 | 2018 |
| 117 | Door | 48.6 | 05/16 | 18 | 2017 | 2020 |
| 217 | Kewaunee | 33.7 | 07/16 | 20 | 2017 | 2019 |
| 317 | Outagamie | 89.6 | 05/16 | 16 | 2017 | 2019 |
| 417 | Outagamie | 103.4 | 05/16 | 16 | 2017 | 2018 |
| 517 | Outagamie | 285.3 | 05/16 | 16 | 2017 | 2019 |
| 617 | Columbia | 16.5 | 05/16 | 16 | 2017 | 2019 |
| 717 | Marathon | 6.2 | 05/16 | 12 | 2017 | 2018 |
| 817 | Marathon | 42.4 | 08/16 | 12 | 2017 | 2018 |
| 917 | Columbia | 16.5 | 05/16 | 15 | 2017 | 2019 |
| 1017 | Columbia | 16.2 | 05/16 | 15 | 2017 | 2019 |
| 118 | Kewaunee | 40.0 | 05/17 | 18 | 2018 | 2019 |
| 218 | Dane | 102.5 | 08/17 | 18 | 2018 | 2018 |
| 318 | Dane | 52.6 | 08/17 | 20 | 2018 | 2020 |
| 418 | Manitowoc | 53.9 | 05/17 | 18 | 2018 | 2018 |
| 518 | Fond du Lac | 38.0 | 05/17 | 18 | 2018 | 2020 |
| 618 | Fond du Lac | 14.3 | 08/17 | 20 | 2018 | 2020 |
| 718 | Fond du Lac | 8.0 | 05/17 | 17 | 2018 | 2020 |
| 818 | Fond du Lac | 58.0 | 05/17 | 17 | 2018 | 2020 |
| 918 | Fond du Lac | 57.0 | 05/17 | 17 | 2018 | 2021 |
| 1018 | Columbia | 19.5 | 08/17 | 15 | 2018 | 2020 |
| 1118 | Outagamie | 57.7 | 05/17 | 16 | 2018 | 2019 |
| 1218 | Outagamie | 46.7 | 05/17 | 16 | 2018 | 2018 |
| 1318 | Outagamie | 60.3 | 05/17 | 16 | 2018 | 2020 |
| 1418 | Marathon | 9.7 | 08/17 | 15 | 2018 | 2020 |
| 119 | Columbia | 22.3 | 05/18 | 16 | 2019 | 2021 |
| 219 | Marathon | 10.3 | 05/18 | 15 | 2019 | 2019 |
| 319 | Marathon | 31.6 | 05/18 | 15 | 2019 | 2020 |
| 419 | Marathon | 32.5 | 05/18 | 15 | 2019 | 2019 |
| 120 | Fond du Lac | 11.0 | 04/19 | NA | 2020 | 2022 |
| 220 | Columbia | 32.3 | 08/19 | 15 | 2020 | 2023 |
| 320 | Outagamie | 46.2 | 05/19 | 16 | 2020 | 2021 |
| 420 | Outagamie | 68.5 | 05/19 | 16 | 2020 | 2021 |
| 520 | Kewaunee | 57.0 | 05/19 | 18/2 RC, 2 MF | 2020 | 2020 |
| 620 | Marathon | 8.8 | 05/19 | 15 | 2020 | 2021 |
| 121 | Columbia | 19.8 | 04/20 | 13 | 2021 | 2023 |
| 221 | Oconto | 35.7 | 04/20 | 14 | 2021 | 2023 |
| 321 | Fond du Lac | 52.0 | 05/21 | 18 | 2021 | 2023 |
| 421 | Fond du Lac | 43.3 | 04/20 | 17 | 2021 | 2024 |
| 521 | Door | 45.0 | 06/20 | 17 | 2021 | 2024 |
| 621 | Kewaunee | 45.0 | 06/20 | 20 | 2021 | active |
| 721 | Outagamie | 182.2 | 04/20 | 16 | 2021 | 2023 |
| 821 | Outagamie | 53.9 | 04/20 | 16 | 2021 | 2022 |
| 921 | Outagamie | 16.3 | 04/20 | 16 | 2021 | 2023 |
| 1021 | Outagamie | 154.4 | 04/20 | 16 | 2021 | 2024 |
| 1121 | Outagamie | 102.4 | 04/20 | 16 | 2021 | 2023 |
| 1221 | Outagamie | 67.4 | 04/20 | 16 | 2021 | 2024 |
| 122 | Columbia | 31.0 | 08/21 | 14 | 2022 | 2024 |
| 123 | Columbia | 40.3 | 08/22 | 15 | 2023 | active |
| 223 | Outagamie | 76.9 | 05/22 | 18, 4% RC | 2023 | active |
| 323 | Outagamie | 78.7 | 05/22 | 18, 4% RC | 2023 | active |
| 423 | Outagamie | 60.0 | 05/22 | 18, 4% RC | 2023 | active |
| 523 | Outagamie | 138.6 | 05/22 | 18, 4% RC | 2023 | active |
| 124 | Columbia | 16.5 | 04/23 | 17 | 2024 | active |
| 224 | Outagamie | 53.0 | 05/23 | 18 | 2024 | active |
| 324 | Outagamie | 170.1 | 05/23 | 18 | 2024 | active |
| 424 | Kewaunee | 77.5 | 07/23 | 20 | 2024 | active |
| 524 | Fond du Lac | 11.6 | 04/23 | 16 | 2024 | active |
| 125 | Columbia | 22.1 | 04/24 | 16 | 2025 | active |
| 225 | Fond du Lac | 120.0 | 04/24 | 18 | 2025 | active |
| 325 | Brown | 22.0 | 05/24 | 18 | 2025 | active |
| 425 | Kewaunee | 38.5 | 05/24 | 18 | 2025 | active |
| 525 | Brown | 76.8 | 05/24 | 24 | 2025 | active |
| 625 | Marathon | 8.7 | 06/24 | 12 | 2025 | active |
Data Collection
Project fields were identified, and an accurate measure of field size was determined. Forage from an entire project field was weighed (usually with on-farm drive-over scales or calibrated wagons). Both empty and full weights for all trucks/wagons used were recorded.
From 2008 to 2020, two forage samples from each harvest were taken and submitted to the Marshfield Soil and Forage Analysis Laboratory for NIR analysis. (Only one sample was submitted per harvest in 2007.) Samples in 2021 were analyzed by Rock River Laboratory in Watertown and 2022-24 samples were analyzed at the UW Soil and Forage Laboratory in Madison.
Results from the two forage samples were averaged and recorded in a spreadsheet by the local coordinator. The procedure was changed in 2025 so that samples were combined after harvest and one sample from each cut was analyzed by Dairyland Laboratories. The data was shared with the producer following each harvest. At the end of the season, all data was collected and summarized for this report.
Harvest Schedules
Mean cutting dates by year are presented in Table 2 and cutting dates for all project fields harvested in 2025 are presented in Table 3. The 2025 cutting dates for all cuts were earlier than normal (Table 2).
The average date for the first and second cuts was two days earlier than the nineteen-year average and subsequent cuts were five to six days earlier. Average dates for each cutting ranked in the top five when compared with previous years. Average first-cut date has ranged from May 16 in 2012 to June 10 in 2013.
Regardless of first-cut date, the average fourth-cut date is generally by September 1, except for a few extreme weather years. This is usually necessitated by the impending corn silage harvest and producers not wanting to put the stand at risk with a late September cut.
Most fields in this study and all in 2025 were cut four times. Across years and sites and including fall cuts, 35 fields were cut three times, 293 fields were cut four times, and 28 fields were cut five times. A fall cut was taken 30 times.
First cut in 2025 occurred over a 13-day range (May 23 to June 5) (Table 3). Typically, the first cut occurred over 20 days because of varying locations and weather, but ranged from 10 in 2023 to 45 in 2015. Throughout the season, cutting dates are affected by weather and individual producers’ decisions, contributing to wider ranges in subsequent cuttings.
The average days between cutting for 4-cut fields were 1st to 2nd– 30, 2nd to 3rd– 27, and 3rd to 4th– 31. This was only the third time there were no 3-cut fields, with 2012 and 2024 as the other years. There has not been a 5-cut field since 2018, or a late fall cut field (after October 1) since 2021.
Table 2. Mean Cutting Dates By Year
Table 2. Mean Cutting Dates By Year
| Year | First Cut Date | Second Cut Date | Third Cut Date | Fourth Cut Date | Fifth Cut Date | Fall Cut Date |
|---|---|---|---|---|---|---|
| 2007 | May 22 | June 24 | July 25 | Aug. 30 | – | Oct. 21 |
| 2008 | June 3 | July 2 | Aug. 1 | Aug. 30 | – | Oct. 29 |
| 2009 | May 31 | July 1 | Aug. 4 | Sept. 5 | – | – |
| 2010 | May 22 | June 28 | Aug. 2 | Aug. 29 | – | Oct. 12 |
| 2011 | May 31 | July 1 | July 31 | Aug. 31 | – | Oct. 21 |
| 2012 | May 16 | June 14 | July 14 | Aug. 10 | Aug. 30 | Oct. 2 |
| 2013 | June 10 | July 11 | Aug. 6 | Sept. 7 | – | – |
| 2014 | June 4 | July 9 | Aug. 7 | Sept. 13 | – | – |
| 2015 | June 3 | July 2 | Aug. 3 | Aug. 27 | Sept. 12 | – |
| 2016 | May 29 | June 26 | July 26 | Aug. 19 | Sept. 1 | Oct. 1 |
| 2017 | May 30 | July 2 | Aug. 1 | Aug. 29 | – | – |
| 2018 | May 30 | June 27 | July 28 | Sept. 3 | Sept. 14 | – |
| 2019 | June 7 | July 10 | Aug. 9 | Sept. 6 | – | Oct. 8 |
| 2020 | June 3 | July 4 | Aug. 4 | Sept. 1 | – | Oct. 5 |
| 2021 | May 29 | June 27 | July 27 | Aug. 26 | – | Oct. 11 |
| 2022 | May 31 | June 27 | July 26 | Aug. 26 | – | – |
| 2023 | May 25 | June 20 | July 21 | Aug. 22 | – | – |
| 2024 | June 2 | July 4 | Aug. 5 | Sept. 1 | – | – |
| 2025 | May 28 | June 27 | July 24 | Aug. 24 | – | – |
| Average (mean) | May 30 | June 29 | July 30 | Aug. 29 | Sept. 6 | Oct. 12 |
Table 3. Summary of 2025 Cutting Dates
Table 3. Summary of 2025 Cutting Dates
| Field ID # | County | First Cut Date | Second Cut Date | Third Cut Date | Fourth Cut Date | Fifth Cut Date | Fall Cut Date |
|---|---|---|---|---|---|---|---|
| 621 | Kewaunee | May 31 | July 1 | July 26 | Aug. 24 | – | – |
| 123 | Columbia | June 1 | June 29 | July 27 | Aug. 25 | – | – |
| 223 | Outagamie | May 23 | June 21 | July 19 | Aug. 23 | – | – |
| 323 | Outagamie | May 23 | June 21 | July 20 | Aug. 24 | – | – |
| 423 | Outagamie | May 24 | June 21 | July 20 | Aug. 23 | – | – |
| 523 | Outagamie | May 23 | June 21 | July 20 | Aug. 24 | – | – |
| 124 | Columbia | June 1 | June 29 | July 27 | Aug. 25 | – | – |
| 224 | Outagamie | May 24 | June 22 | July 20 | Aug. 21 | – | – |
| 324 | Outagamie | May 25 | June 22 | July 20 | Aug. 22 | – | – |
| 424 | Kewaunee | May 26 | June 30 | July 26 | Aug. 22 | – | – |
| 524 | Fond du Lac | June 5 | July 2 | Aug. 1 | Aug. 31 | – | – |
| 125 | Columbia | May 27 | June 29 | July 27 | Aug. 25 | – | – |
| 225 | Fond du Lac | June 1 | July 1 | July 24 | Aug. 25 | – | – |
| 325 | Brown | May 25 | June 28 | July 24 | Aug. 26 | – | – |
| 425 | Kewaunee | June 1 | June 28 | July 30 | Aug. 25 | – | – |
| 525 | Brown | June 3 | July 3 | July 28 | Aug. 25 | – | – |
| 625 | Marathon | June 4 | July 8 | July 30 | Aug. 26 | – | – |
| Average (mean) | May 28 | June 27 | July 24 | Aug. 24 | – | – | |
| Earliest | May 23 | June 21 | July 19 | Aug. 21 | – | – | |
| Latest | June 5 | July 8 | Aug. 1 | Aug. 31 | – | – |
Forage Dry Matter at Harvest
Alfalfa was harvested as haylage for all but 23 individual cuttings over the nineteen years. Harvest dry matter percent data from the dry hay harvests were not included in the forage dry matter data means. Although project participants are not asked about storage structure, there is good reason to believe most of the farms are storing this forage in bunkers, piles, or bags.
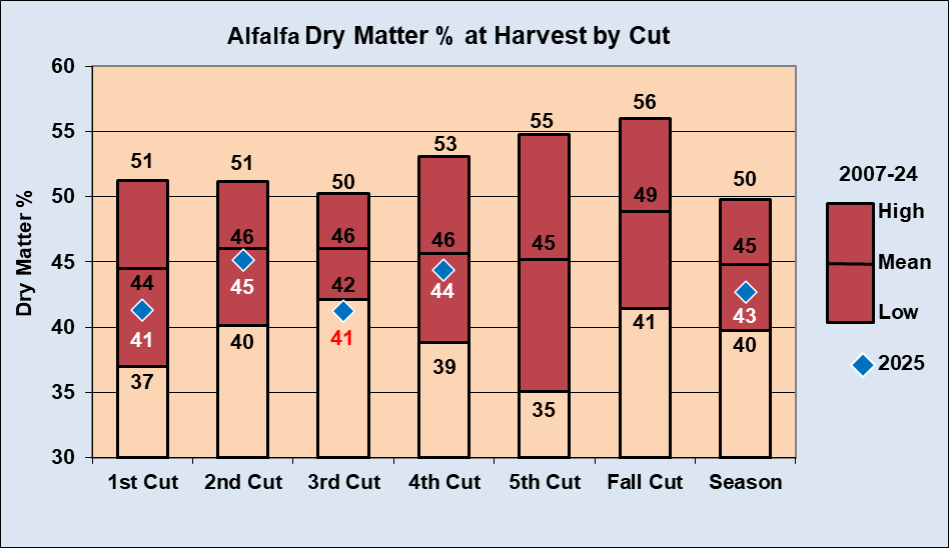
Throughout the duration of this project, total season dry matter percentage of harvested forage has ranged from 40 to 50% (Figure 1a), though individual cuttings and total-season field means sometimes exceeded 50%, especially later in the season. It’s been questioned if this is too dry for obtaining optimum storage porosity in a bunker or pile, but the continuous occurrence supports that stored forage quality is not negatively affected, or producers would adjust harvest practices. The overall season average is similar to the individual cut averages, which ranged from 41 to 45%. Normally, first cut tends to be harvested at lower dry matter than other cuts because drying weather improves through the season. All cuts and the season dry matter percent were below the long-term averages. Cut 3 was five percent below normal and the lowest in nineteen years. The 2025 season average dry matter was 43% and ranged from 39 to 52% for individual fields.
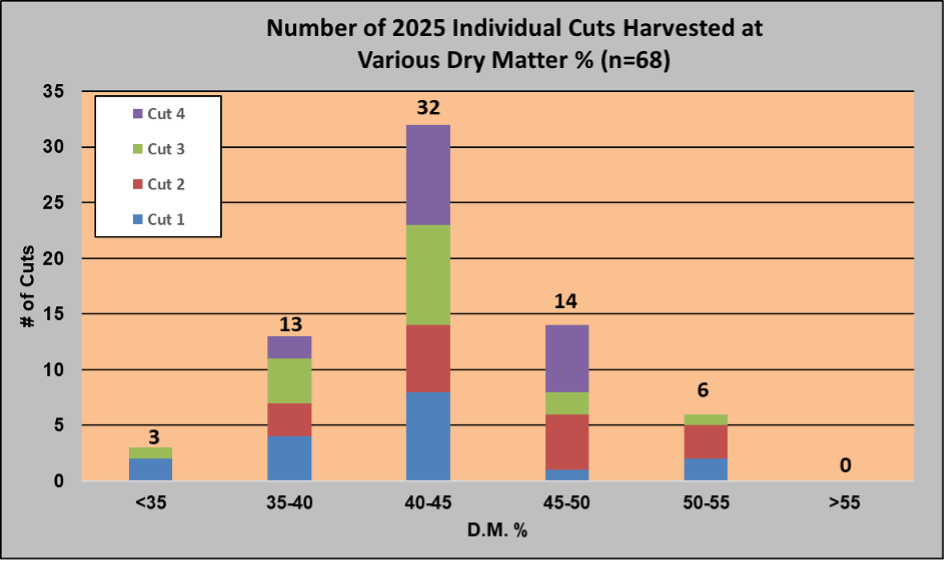
The distribution of individual cut dry matter percentage for 68 cuts from 2025 is shown in Figure 1b. Overall it is a normal distribution although some cuts tend to skew drier or wetter. Most cuts were harvested between 40 and 50% DM, but sixteen cuts had dry matter under 40% and six cuts were above 50%. Harvest moisture in 2025 was affected by soil moisture and weather. This was consistent throughout the season with six to eight fields outside the range for each cut except Cut 4. This chart shows the difficulty of harvesting alfalfa haylage in the ideal moisture range.
Season Forage Dry Matter Yield
Average yield by cutting and for the season in each project year are presented in Figure 2. The highest average dry matter yields of over 5.0 tons per acre were obtained in 2007, 2010, 2024 and again in 2025. The lowest average dry matter yields were in 2013 and 2020 at just over 3.6 tons per acre.
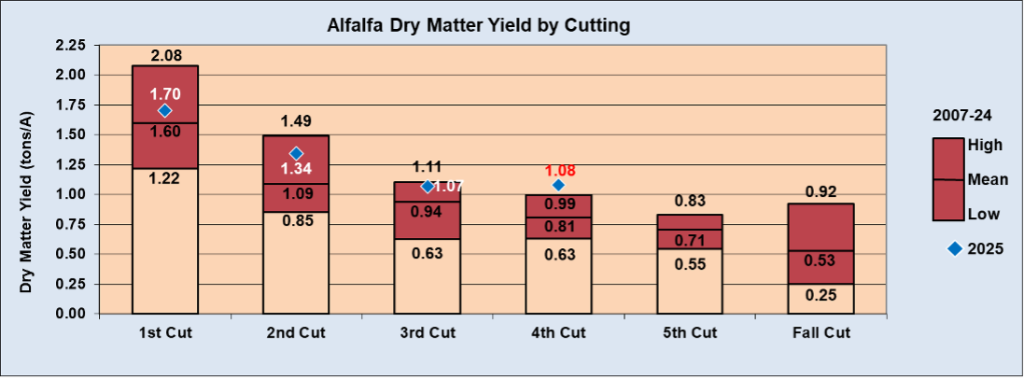
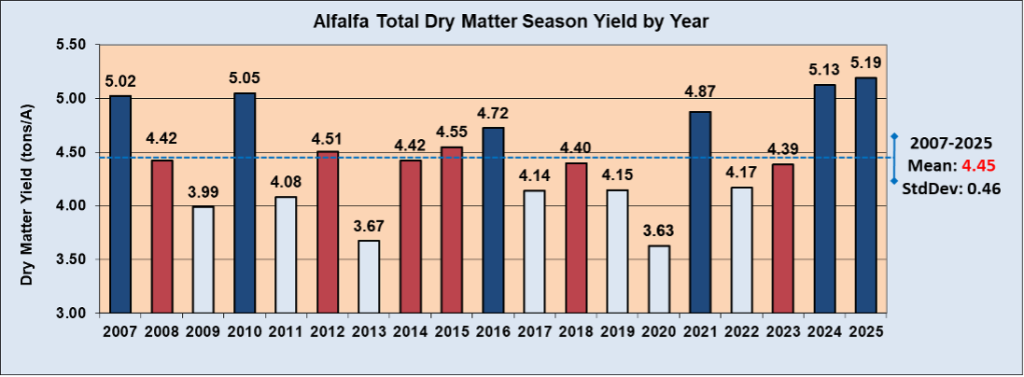
The overall mean yield of all years is 4.45 tons of dry matter per acre. The mean yield across all fields was 5.19 tons per acre in 2025, setting a record for best yield in the nineteen years of the study. The previous record was 5.13 tons per acre in 2024. This was also the second time that above-average years were observed.
All cuts had above average yield. First-cut yield of 1.70 tons was down from a record 2.08 tons in 2024. Although the overall yield was above average, this was inflated by the three southern Wisconsin fields averaging 2.66 tons. They were harvested several extra days later than planned after cold, wet weather delayed cutting. The other fourteen fields averaged 1.50 tons per acre. Cut 2 yielded 1.34 tons, which was the third-highest seen, trailing only 2007 and 2010. Cut 3 yielded 1.07 tons, which was only 0.04 tons per acre below the highest seen, and Cut 4 set a record of 1.08 tons per acre, beating the previous yield of 0.99 tons in 2023. Adequate rainfall through the harvest season resulted in good yields. Detailed yield data for each field by year are presented in Appendix A.
Once again, there was a variation between fields (Figure 3a). Yields ranged from a high of 6.65 to a low of 3.97 tons per acre. This difference of 2.68 tons is the fifth narrowest range. The margin range averages 3.11 tons per acre with the widest margin being 3.78 in 2013 and the narrowest at 2.19 in 2022.
The highest-yielding field at 6.65 tons per acre ranked first of 360 fields harvested over 19 years. Another field yielded 6.62 tons, with both being better than the previous record high of 6.60 in 2021. Both these fields had first cut delayed by rain and ranked in the top four for first cut yield.
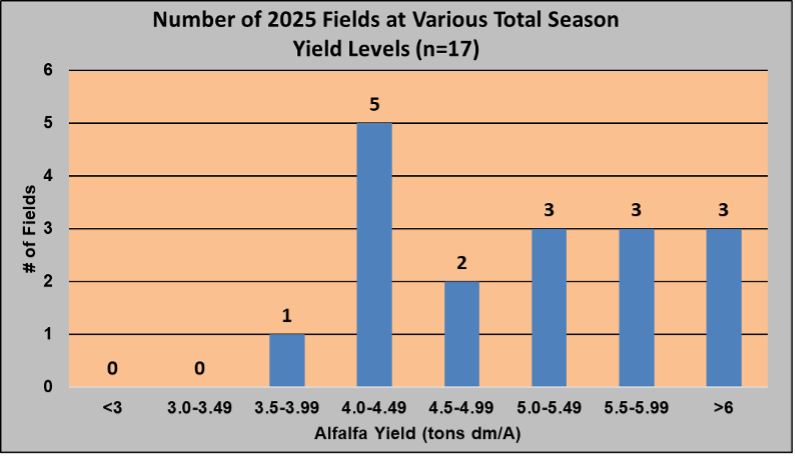
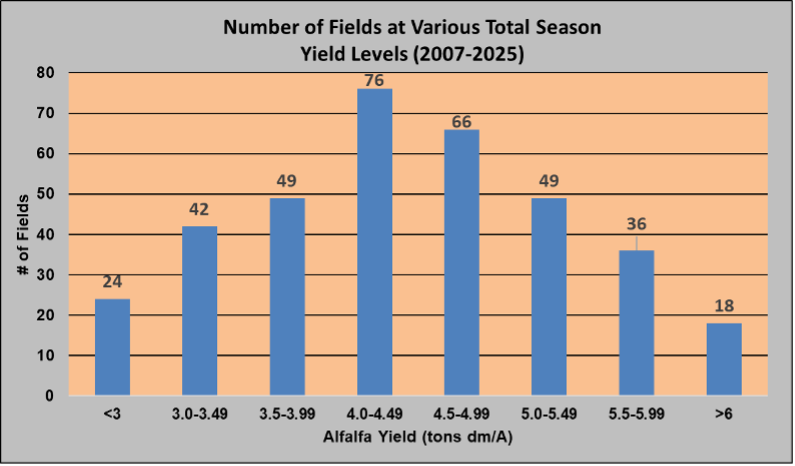
Three fields exceeded 6.0 tons per acre in 2025, the benchmark for top yields in the study, which has been reached only 18 times in 19 years (Figure 3b). No fields were below 3.0 tons per acre in 2025. That level has been reached by 24 fields in 19 years.
Cumulative Forage Dry Matter Yield
Yield attained over the life of the alfalfa stand is also summarized in addition to annual yield. The total stand yield has been broken down by the number of production years for the 140 fields that have complete data (Table 4). Fields still active were included with the current number of seasons. Table 5 shows the top five yielding fields by number of seasons.
This summary categorizes a field several ways to look at best years individually as well as over the best two to four consecutive years of the stand. County, years in the project, and annual cut schedule are shown in addition to dry matter yield. An “x” in the cut schedule signifies harvest years that were not included in the yield total. There were several new additions, including the first five-season field, three two-season fields, and two new fields for top one-season yield.
Table 4. Summary of overall field yield by number of seasons of the stand. (tn dm/A)
| Seasons | Cuts | Fields | Mean | Minimum | Maximum |
|---|---|---|---|---|---|
| 5 | 20 | 1 | 24.35 | – | – |
| 4 | 13-17 | 22 | 17.98 | 11.77 | 21.84 |
| 3 | 10-14 | 79 | 13.65 | 8.91 | 18.07 |
| 2 | 6-9 | 113 | 9.02 | 5.88 | 12.80 |
| 1 | 3-5 | 140 | 4.49 | 1.61 | 6.65 |
Table 5. Top overall yielding fields by number of seasons of the stand. (tn dm/A)
| Seasons | Field ID | County | Years | Cut Schedule | Yield |
|---|---|---|---|---|---|
| 5 | 621 | Kewaunee | 2021–2025 | 4, 4, 4, 4, 4 | 24.35 |
| 4 | 714 | Columbia | 2014–2017 | 4, 4, 4, 4 | 21.84 |
| 4 | 414 | Fond du Lac | 2014–2017 | 4, 4, 4, 4 | 21.12 |
| 4 | 1015 | Columbia | 2015–2018 | 4, 4, 4, 4 | 21.09 |
| 4 | 807 | Fond du Lac | 2007–2010 | 4, 4, 4, 4 | 20.47 |
| 4 | 608 | Outagamie | 2008–2011 | 4, 4, 4, 4 | 20.41 |
| 3 | 114 | Fond du Lac | 2014–2016 | 4, 4, 4 | 18.07 |
| 3 | 111 | Fond du Lac | 2011–2013 | 4, 4, 4 | 17.16 |
| 3 | 618 | Fond du Lac | 2018–2020 | 4, 4, 4 | 16.88 |
| 3 | 608 | Outagamie | 2008–2011 | 4, 4, 4, x | 16.87 |
| 3 | 716 | Columbia | 2016–2018 | 4, 4, 4 | 16.73 |
| 2 | 111 | Fond du Lac | 2011–2013 | 4, 4, x | 12.80 |
| 2 | 424 | Kewaunee | 2024-2025 | 4, 4 | 12.50 |
| 2 | 124 | Columbia | 2024-2025 | 4, 4 | 12.42 |
| 2 | 114 | Fond du Lac | 2014-2016 | 4, 4, x | 12.25 |
| 2 | 123 | Columbia | 2023-2025 | x, 4, 4 | 12.10 |
| 1 | 124 | Columbia | 2024-2025 | x, 4 | 6.65 |
| 1 | 125 | Columbia | 2025 | 4 | 6.62 |
| 1 | 921 | Outagamie | 2021-2022 | 4, x, x | 6.60 |
| 1 | 424 | Kewaunee | 2024 | 4 | 6.57 |
| 1 | 111 | Fond du Lac | 2011–2013 | x, 4, x | 6.55 |
Alfalfa Persistence
In-Season
An analysis was done to determine the percent of total season yield for each cutting (Table 6). Data was summarized for 3-, 4-, and 5-cut systems for all project years. Fall-cut fields were also included in the 4-cut summary with the final fall harvest not included in the total season yield.
It’s important to note the wide variation in percent yield for an individual cutting. In some cases, this is the result of environmental conditions (e.g. drought) before the harvest while in other situations it’s simply a function of cutting date (Tables 2 and 3).
The seventeen 4-cut fields in 2025 had lower proportion of yield in the 1st cut compared to the study mean, despite being above normal. This is because all other cuts were above normal by a bigger proportion. 2nd and 3rd cuts were near the mean. 4th cut had more than the mean because of record yield resulting from adequate moisture (Figure 2). No fields were cut three or five times in 2025.
Table 6. Average percent of total season yield by cutting for 3, 4 and 5 cut harvest systems* (2007-25)
3-Cut Systems (3, 4-Fall)
| First Cut | Second Cut | Third Cut | |
|---|---|---|---|
| 2025 | – | – | – |
| Average (mean) | 46 | 28 | 26 |
| Low | 26 | 15 | 13 |
| High | 72 | 43 | 49 |
* High and low figures are for individual cuttings and will not add to 100%
4-Cut Systems (4, 3+Fall, 5-Fall)
| First Cut | Second Cut | Third Cut | Fourth Cut | |
|---|---|---|---|---|
| 2025 | 32 | 26 | 21 | 21 |
| Average (mean) | 36 | 25 | 21 | 18 |
| Low | 20 | 12 | 5 | 5 |
| High | 58 | 42 | 36 | 34 |
* High and low figures are for individual cuttings and will not add to 100%
5-Cut Systems (5, 4+Fall)
| First Cut | Second Cut | Third Cut | Fourth Cut | Fifth Cut | |
|---|---|---|---|---|---|
| 2025 | – | – | – | – | – |
| Average (mean) | 32 | 21 | 18 | 16 | 13 |
| Low | 21 | 11 | 10 | 9 | 6 |
| High | 41 | 39 | 26 | 24 | 18 |
* High and low figures are for individual cuttings and will not add to 100%
Between Seasons
Persistence is influenced over time by the age of the stand, cutting schedule, and environment. For this project, persistence is being measured as a percentage of 1st production year dry matter yield.
Persistence data in Table 7 consists of 2006 through 2023-seeded fields and is averaged over all cutting schedules. Although ranges indicate a wide variation, average forage yield in the second (102%) and third (95%) production year have been comparable to the 1st production year. The yield for fourth year stands drops to 86% of the first production year. A 5th production year field was observed at 86% of the first production year. This is similar to the 4th year average from 23 fields, but caution should be taken because it is only one unique field. This individual field had the following yields compared to first year: 2nd– 98%, 3rd– 105%, 4th– 127%, and 5th– 86%.
Table 7. Percent of 1st production year yield by cutting and total season for 2nd, 3rd, and 4th production year stands. (2007-25)
Second Production Year Stands
| First Cut | Second Cut | Third Cut | Fourth Cut | Season | |
|---|---|---|---|---|---|
| 2025 | 89 | 109 | 124 | 142 | 104 |
| Average (mean) | 110 | 106 | 113 | 104 | 102 |
| Low | 44 | 39 | 23 | 28 | 63 |
| High | 275 | 291 | 491 | 279 | 236 |
Third Production Year Stands
| First Cut | Second Cut | Third Cut | Fourth Cut | Season | |
|---|---|---|---|---|---|
| 2025 | 113 | 114 | 119 | 61 | 100 |
| Average (mean) | 99 | 103 | 103 | 100 | 95 |
| Low | 34 | 43 | 32 | 23 | 63 |
| High | 250 | 299 | 370 | 172 | 183 |
Fourth Production Year Stands
| First Cut | Second Cut | Third Cut | Fourth Cut | Season | |
|---|---|---|---|---|---|
| 2025 | – | – | – | – | – |
| Average (mean) | 89 | 89 | 107 | 86 | 86 |
| Low | 38 | 34 | 36 | 23 | 37 |
| High | 150 | 151 | 321 | 148 | 139 |
Fifth Production Year Stands
| First Cut | Second Cut | Third Cut | Fourth Cut | Season | |
|---|---|---|---|---|---|
| 2025 | 68 | 94 | 218 | 69 | 86 |
To date, it appears that keeping stands for at least three production years after the seeding year seems to be a prudent decision, but the condition and productivity of individual fields are the most important factors in determining when to rotate to a different crop. The numbers could also be somewhat misleading because not all fields are kept for a full 3- or 4-year production cycle. Those that are removed earlier at the producer’s discretion no longer generate data which would likely result in lower averages. Therefore, this should be viewed as data from fields that producers’ judge good enough to keep.
Forage Quality
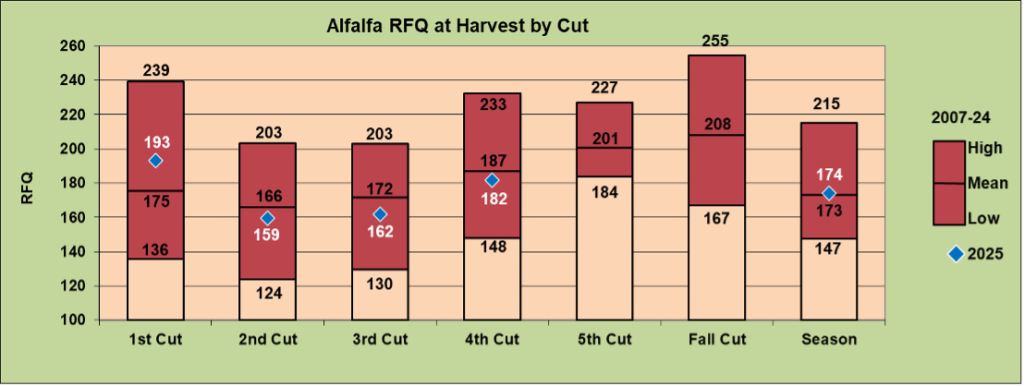
Forage quality, although extremely important, is not the primary focus of this project. However, it is impossible to evaluate changes in management to maximize yield and persistence without considering the impact on forage quality. The overall harvested relative forage quality (RFQ) of 174 in the 2025 season was nearly identical to 173 observed over the previous 18 years (Figure 7). Results of the four cuts ranged from 159 to 193 and showed a similar trend to previous years. Cut 1 was the fourth best seen and the other cuts were slightly below average. Individual field season average RFQs ranged from 152 to 202. Alfalfa quality is usually inversely related to yield. This was also generally the case in 2025.
Other notable forage quality results from 2025 include:
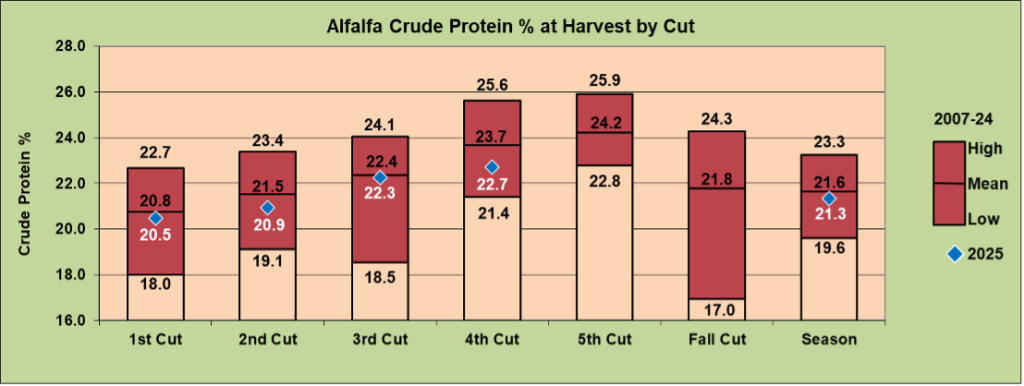
- Season crude protein (CP) percent was slightly below average at 21.3 (Figure 4). Cuts 1, 2, and 3 were slightly below average, while Cut 4 was the third lowest seen.
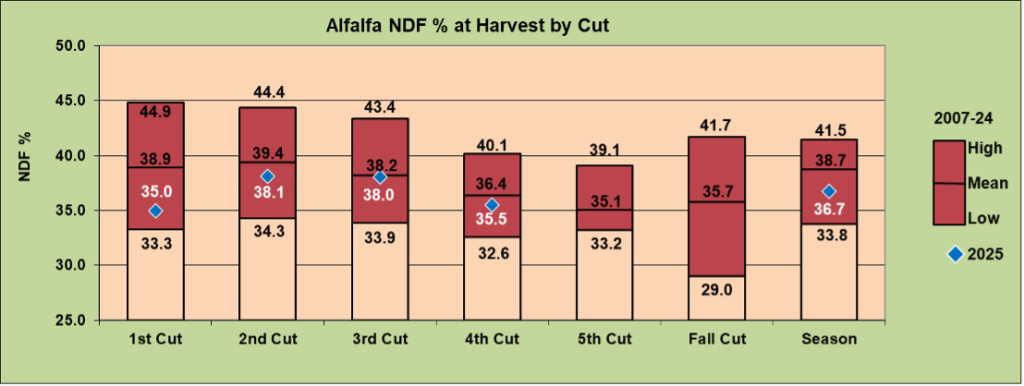
- NDF percent was the fifth lowest season average seen at 36.7, and 2.0 below the previous 18-year average. All cuts were at or below average with Cut 1 being the third lowest seen (Figure 5).
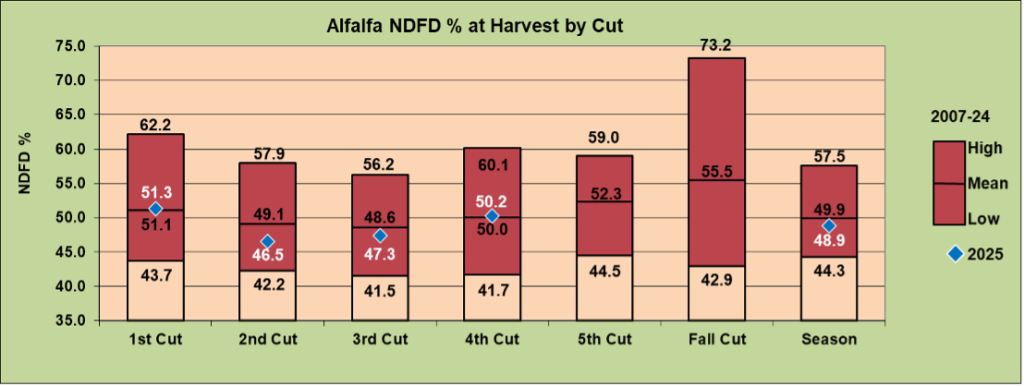
- NDFD percent of 48.9 was slightly below average for the season (Figure 6). Cuts 1 and 4 were near average, while Cuts 2 and 3 were below average.
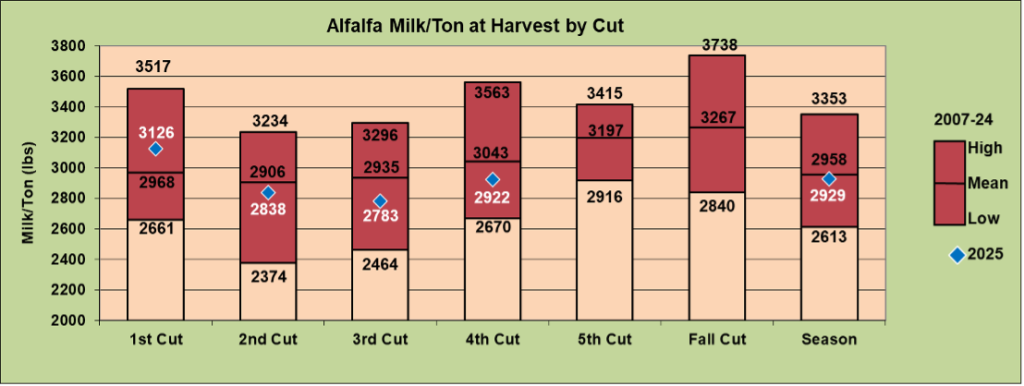
- Milk/Ton mirrored RFQ with Cut 1 being above average and Cuts 2, 3, and 4 below average. The season total average of 2929 was similar to the long-term mean of 2958 (Figures 7 and 8).
Summary
The Wisconsin Alfalfa Yield and Persistence Program is designed to provide forage growers, agricultural professionals, researchers, and the forage industry with a unique look at what is happening at the farm level.
As more fields are entered and years pass, the reliability of information continues to increase. Environmental conditions have had a profound influence on both yield and quality with some years being similar, but no two years being exactly alike.
Growers in 2025 experienced an overall record yield for the second consecutive year, with individual cut yields varying based on weather. First-cut yield was excellent in the south, and while the north experienced more variability, forage quality was good overall. Later cuts had excellent yield due to adequate moisture quality, but below normal forage quality. It is important to characterize these differences to know what has happened in the past and to plan for future years.
Acknowledgements
First and foremost, we wish to thank the producers who took the extra time and effort to obtain weights and forage samples for the project fields at each cutting. We also thank the coordinators listed below.
Past and Present UW Project Coordinators
- *Mike Bertram, Marathon & Columbia Counties
- *Aerica Bjurstrom, Kewaunee & Door Counties
- Greg Blonde, Waupaca County
- *Ashley Blackburn, Marathon County
- Jason Cavadini, Marathon County
- Jerry Clark, Chippewa County
- *Liz Gartman, Fond du Lac County
- Scott Gunderson, Manitowoc County
- Mark Hagedorn, Brown County
- *Kevin Jarek, Outagamie County
- Heidi Johnson, Dane County
- Tina Kohlman, Fond du Lac County
- David Laatsch, Dodge County
- Bryce Larson, Calumet County
- Mike Rankin, Fond du Lac County
- Scott Reuss, Oconto County
- Nick Schneider, Winnebago County
- Ryan Sterry, St. Croix County
- Amy Vandebrake, Pierce County
- Chelsea Zegler, Dane County
- Joe Zimbric, Fond du Lac County
* Present project coordinator
Funding for this project has been provided by the Midwest Forage Association (MFA) and UW–Madison Extension.
This report was written and data compiled by Mike Bertram, Superintendent, UW Arlington Agricultural Research Station. Questions may be directed to: mbertram@wisc.edu.
Reports from 2007-2014 were written by Mike Rankin, Emeritus Crops and Soils Agent, Fond du Lac County.
Appendix A
2007 Harvest Year Dry Matter Yield by Field, Cutting, and Total for Season
| Field ID # | Harvest Year | First Cut DM Yield | Second Cut DM Yield | Third Cut DM Yield | Fourth Cut DM Yield | Fifth Cut DM Yield | Fall Cut DM Yield | Season DM Yield |
|---|---|---|---|---|---|---|---|---|
| 107 | 2007 | 1.57 | 1.53 | 0.95 | 0.59 | 0.34 | 4.98 | |
| 207 | 2007 | 1.52 | 1.33 | 1.00 | 0.70 | 0.73 | 5.27 | |
| 307 | 2007 | 1.54 | 1.51 | 1.30 | 0.90 | 0.88 | 6.12 | |
| 407 | 2007 | 1.41 | 1.57 | 1.11 | 0.80 | 0.71 | 5.59 | |
| 507 | 2007 | 1.00 | 1.02 | 0.37 | 2.39 | |||
| 607 | 2007 | 1.79 | 1.77 | 1.20 | 1.14 | 5.90 | ||
| 707 | 2007 | 1.75 | 1.23 | 0.81 | 0.63 | 4.41 | ||
| 807 | 2007 | 1.79 | 1.19 | 1.42 | 1.10 | 5.51 | ||
| Average (mean) | 1.55 | 1.39 | 1.02 | 0.84 | 0.67 | 5.02 | ||
| Low | 1.00 | 1.02 | 0.37 | 0.59 | 0.34 | 2.39 | ||
| High | 1.79 | 1.77 | 1.42 | 1.14 | 0.88 | 6.12 |
2008 Harvest Year Dry Matter Yield by Field, Cutting, and Total for Season
| Field ID # | Harvest Year | First Cut DM Yield | Second Cut DM Yield | Third Cut DM Yield | Fourth Cut DM Yield | Fifth Cut DM Yield | Fall Cut DM Yield | Season DM Yield |
|---|---|---|---|---|---|---|---|---|
| 107 | 2008 | 1.28 | 1.11 | 1.07 | 0.43 | 3.89 | ||
| 207 | 2008 | 1.34 | 1.08 | 1.14 | 0.68 | 4.23 | ||
| 307 | 2008 | NA | 0.86 | 0.91 | 0.78 | – | ||
| 407 | 2008 | NA | 1.14 | 1.09 | 0.68 | – | ||
| 507 | 2008 | 1.95 | 1.08 | 0.76 | 3.79 | |||
| 807 | 2008 | 2.23 | 1.73 | 1.31 | 0.82 | 6.08 | ||
| 108 | 2008 | 1.38 | 0.74 | 1.15 | 3.27 | |||
| 208 | 2008 | 2.08 | 1.54 | 0.84 | 4.46 | |||
| 308 | 2008 | 1.46 | 0.83 | 1.27 | 0.93 | 0.45 | 4.95 | |
| 408 | 2008 | 0.86 | 0.49 | 0.85 | 0.50 | 2.70 | ||
| 508 | 2008 | 2.01 | 0.72 | 1.20 | 0.98 | 0.37 | 5.29 | |
| 608 | 2008 | 1.39 | 1.78 | 1.54 | 0.92 | 5.63 | ||
| 708 | 2008 | 1.28 | 1.05 | 1.18 | 0.89 | 4.40 | ||
| 808 | 2008 | 1.81 | 1.20 | 1.27 | 0.79 | 5.07 | ||
| 908 | 2008 | 0.73 | 0.94 | 0.89 | 1.12 | 3.68 | ||
| 108 | 2008 | NA | 1.06 | 0.97 | 0.83 | – | ||
| Average (mean) | 1.52 | 1.08 | 1.09 | 0.80 | 0.41 | 4.42 | ||
| Low | 0.73 | 0.49 | 0.76 | 0.43 | 0.37 | 2.70 | ||
| High | 2.23 | 1.78 | 1.54 | 1.12 | 0.45 | 6.08 |
2009 Harvest Year Dry Matter Yield by Field, Cutting, and Total for Season
| Field ID # | Harvest Year | First Cut DM Yield | Second Cut DM Yield | Third Cut DM Yield | Fourth Cut DM Yield | Fifth Cut DM Yield | Fall Cut DM Yield | Season DM Yield |
|---|---|---|---|---|---|---|---|---|
| 107 | 2009 | 0.95 | 1.06 | 0.30 | 0.99 | 3.31 | ||
| 207 | 2009 | 1.28 | 1.23 | 0.53 | 1.00 | 4.04 | ||
| 307 | 2009 | 1.02 | 1.23 | 0.69 | 0.93 | 3.87 | ||
| 407 | 2009 | 1.59 | 1.02 | 0.53 | 0.85 | 3.99 | ||
| 507 | 2009 | 1.38 | 0.90 | 0.49 | 0.76 | 3.53 | ||
| 807 | 2009 | 1.56 | 0.99 | 0.98 | 0.62 | 4.15 | ||
| 108 | 2009 | 1.52 | 0.83 | 0.80 | 3.15 | |||
| 208 | 2009 | 1.77 | 1.18 | 1.33 | 4.28 | |||
| 308 | 2009 | 1.24 | 0.94 | 0.56 | 1.15 | 3.89 | ||
| 408 | 2009 | 1.80 | 0.80 | 0.20 | 0.64 | 3.43 | ||
| 508 | 2009 | 1.74 | 1.00 | 0.59 | 0.98 | 4.32 | ||
| 608 | 2009 | 2.19 | 1.23 | 0.88 | 0.78 | 5.07 | ||
| 708 | 2009 | 1.40 | 1.34 | 0.63 | 0.98 | 4.35 | ||
| 808 | 2009 | 2.07 | 1.16 | 0.59 | 0.55 | 4.37 | ||
| 908 | 2009 | 1.88 | 0.99 | 0.30 | 0.95 | 4.13 | ||
| 109 | 2009 | 0.57 | 0.55 | 1.09 | 2.21 | |||
| 209 | 2009 | 1.92 | 1.60 | 0.69 | 1.06 | 5.27 | ||
| 309 | 2009 | 1.14 | 0.84 | 0.43 | 1.05 | 3.46 | ||
| 409 | 2009 | 1.45 | 1.24 | 0.35 | 0.32 | 3.37 | ||
| 509 | 2009 | 2.05 | 0.88 | 0.57 | 3.49 | |||
| 609 | 2009 | 2.36 | 0.58 | 0.20 | 0.95 | 4.10 | ||
| 709 | 2009 | 2.27 | 1.25 | 0.82 | 0.92 | 5.26 | ||
| 809 | 2009 | 2.08 | 1.03 | 0.85 | 0.72 | 4.68 | ||
| Average (mean) | 1.62 | 1.04 | 0.63 | 0.85 | 3.99 | |||
| Low | 0.57 | 0.55 | 0.20 | 0.32 | 2.21 | |||
| High | 2.36 | 1.60 | 1.33 | 1.15 | 5.27 |
2010 Harvest Year
| Field ID # | Harvest Year | First Cut DM Yield | Second Cut DM Yield | Third Cut DM Yield | Fourth Cut DM Yield | Fifth Cut DM Yield | Fall Cut DM Yield | Season DM Yield |
|---|---|---|---|---|---|---|---|---|
| 307 | 2010 | 1.16 | 1.24 | 1.24 | 0.52 | 4.17 | ||
| 807 | 2010 | 1.38 | 1.32 | 1.22 | 0.81 | 4.74 | ||
| 208 | 2010 | 1.99 | 1.65 | 1.26 | 0.62 | 5.52 | ||
| 308 | 2010 | 1.65 | 1.66 | 0.85 | 0.41 | 4.57 | ||
| 408 | 2010 | 1.85 | 1.46 | 0.76 | 0.51 | 4.58 | ||
| 508 | 2010 | 1.88 | 1.81 | 0.69 | 0.48 | 4.86 | ||
| 608 | 2010 | 2.09 | 1.79 | 1.46 | 0.82 | 6.16 | ||
| 708 | 2010 | 1.45 | 1.33 | 0.39 | 0.67 | 4.84 | ||
| 808 | 2010 | 1.66 | 1.77 | 1.57 | 0.90 | 5.91 | ||
| 908 | 2010 | 1.83 | 0.84 | 1.27 | 0.51 | 4.45 | ||
| 109 | 2010 | 1.57 | 1.42 | 0.90 | 1.33 | 5.23 | ||
| 209 | 2010 | 1.91 | 1.80 | 1.09 | 0.91 | 5.71 | ||
| 309 | 2010 | 2.16 | 1.85 | 0.91 | 0.70 | 5.61 | ||
| 409 | 2010 | 1.43 | 0.96 | 0.55 | 0.39 | 3.33 | ||
| 609 | 2010 | 2.34 | 1.78 | 1.05 | 1.00 | 6.17 | ||
| 709 | 2010 | 2.32 | 0.94 | 1.08 | 0.57 | 4.90 | ||
| 809 | 2010 | 1.86 | 1.67 | 1.07 | 0.47 | 5.07 | ||
| 110 | 2010 | 1.46 | 1.65 | 1.40 | 0.54 | 5.05 | ||
| 210 | 2010 | 2.07 | 1.76 | 0.94 | 0.51 | 5.28 | ||
| 310 | 2010 | 1.59 | 1.21 | 0.97 | 0.57 | 4.33 | ||
| 410 | 2010 | 2.00 | 1.26 | 0.94 | 0.41 | 4.61 | ||
| 510 | 2010 | 1.87 | 1.69 | 1.05 | 0.62 | 0.39 | 5.62 | |
| 610 | 2010 | 2.08 | 1.40 | 1.09 | 0.46 | 0.34 | 5.37 | |
| Average (mean) | 1.81 | 1.49 | 1.08 | 0.65 | 0.44 | 5.05 | ||
| Low | 1.16 | 0.84 | 0.55 | 0.41 | 0.34 | 3.33 | ||
| High | 2.34 | 1.85 | 1.57 | 1.33 | 0.62 | 6.17 |
2011 Harvest Year
| Field ID # | Harvest Year | First Cut DM Yield | Second Cut DM Yield | Third Cut DM Yield | Fourth Cut DM Yield | Fifth Cut DM Yield | Fall Cut DM Yield | Season DM Yield |
|---|---|---|---|---|---|---|---|---|
| 208 | 2011 | 0.78 | 0.90 | 1.05 | 0.45 | 3.18 | ||
| 308 | 2011 | 1.31 | 1.12 | 0.85 | 0.97 | 4.06 | ||
| 408 | 2011 | 1.19 | 0.72 | 0.67 | 0.51 | 3.09 | ||
| 508 | 2011 | 1.25 | 0.85 | 0.65 | 0.69 | 3.44 | ||
| 608 | 2011 | 1.10 | 0.83 | 1.16 | 0.45 | 3.54 | ||
| 708 | 2011 | 1.50 | 0.75 | 1.37 | 0.78 | 4.41 | ||
| 808 | 2011 | 1.07 | 0.65 | 1.15 | 0.90 | 3.77 | ||
| 908 | 2011 | 0.92 | 0.52 | 0.87 | 0.49 | 2.80 | ||
| 109 | 2011 | 1.29 | 0.97 | 1.03 | 0.76 | 4.05 | ||
| 209 | 2011 | 1.59 | 1.02 | 0.92 | 0.76 | 4.45 | ||
| 309 | 2011 | 1.53 | 1.15 | 1.14 | 0.95 | 4.77 | ||
| 409 | 2011 | 1.27 | 0.81 | 0.47 | 0.48 | 3.03 | ||
| 609 | 2011 | 1.76 | 0.90 | 1.68 | 0.78 | 5.12 | ||
| 210 | 2011 | 1.13 | 0.72 | 1.04 | 0.80 | 3.69 | ||
| 310 | 2011 | 1.25 | 0.63 | 0.97 | 0.78 | 3.63 | ||
| 410 | 2011 | 1.33 | 0.60 | 1.08 | 0.57 | 3.58 | ||
| 510 | 2011 | 1.47 | 1.08 | 1.07 | 0.73 | 4.35 | ||
| 610 | 2011 | 1.41 | 0.92 | 0.88 | 0.83 | 4.04 | ||
| 111 | 2011 | 2.45 | 1.29 | 1.32 | 1.19 | 6.26 | ||
| 211 | 2011 | 1.39 | 0.85 | 1.20 | 1.10 | 4.55 | ||
| 311 | 2011 | 2.30 | 0.94 | 1.66 | 1.00 | 5.90 | ||
| 411 | 2011 | 1.70 | NA | 1.68 | 0.64 | — | ||
| Average (mean) | 1.41 | 0.87 | 1.09 | 0.77 | 0.45 | 4.08 | ||
| Low | 0.78 | 0.52 | 0.47 | 0.45 | 0.45 | 2.80 | ||
| High | 2.45 | 1.29 | 1.68 | 1.19 | 0.45 | 6.26 |
2012 Harvest Year
| Field ID # | Harvest Year | First Cut DM Yield | Second Cut DM Yield | Third Cut DM Yield | Fourth Cut DM Yield | Fifth Cut DM Yield | Fall Cut DM Yield | Season DM Yield |
|---|---|---|---|---|---|---|---|---|
| 209 | 2012 | 1.47 | 1.01 | 0.97 | 0.40 | 3.85 | ||
| 210 | 2012 | 1.46 | 0.75 | 0.43 | 0.80 | 0.76 | 4.20 | |
| 310 | 2012 | 1.22 | 0.67 | 0.45 | 0.69 | 0.45 | 3.48 | |
| 410 | 2012 | 1.14 | 0.62 | 0.38 | 0.66 | 0.56 | 3.36 | |
| 510 | 2012 | 1.20 | 1.13 | 0.74 | 0.63 | 0.73 | 4.44 | |
| 610 | 2012 | 2.33 | 1.18 | 1.12 | 0.66 | 5.30 | ||
| 111 | 2012 | 2.03 | 1.79 | 1.55 | 1.18 | 6.55 | ||
| 211 | 2012 | 1.11 | 1.10 | 0.78 | 0.79 | 0.48 | 4.26 | |
| 112 | 2012 | 1.46 | 0.85 | 1.11 | 0.85 | 0.63 | 4.90 | |
| 212 | 2012 | 1.74 | 1.21 | 1.32 | 1.27 | 5.55 | ||
| 312 | 2012 | 1.65 | 0.78 | 0.59 | 0.70 | 0.68 | 4.40 | |
| 412 | 2012 | 2.06 | 0.81 | 0.64 | 0.86 | 0.64 | 5.00 | |
| 512 | 2012 | 1.33 | 0.88 | 0.66 | 0.55 | 0.34 | 3.76 | |
| 612 | 2012 | 0.84 | 0.63 | 0.88 | 0.93 | 0.58 | 3.86 | |
| 712 | 2012 | 1.30 | 0.94 | 0.65 | 0.69 | 0.72 | 4.31 | |
| 812 | 2012 | 1.02 | 1.88 | 0.84 | 0.78 | 0.34 | 4.86 | |
| Average (mean) | 1.46 | 1.01 | 0.82 | 0.78 | 0.55 | 0.59 | 4.51 | |
| Low | 0.84 | 0.62 | 0.38 | 0.40 | 0.34 | 0.34 | 3.36 | |
| High | 2.33 | 1.88 | 1.55 | 1.27 | 0.73 | 0.76 | 6.55 |
2013 Harvest Year
| Field ID # | Harvest Year | First Cut DM Yield | Second Cut DM Yield | Third Cut DM Yield | Fourth Cut DM Yield | Fifth Cut DM Yield | Fall Cut DM Yield | Season DM Yield |
|---|---|---|---|---|---|---|---|---|
| 111 | 2013 | 1.70 | 0.85 | 0.87 | 0.94 | 4.35 | ||
| 212 | 2013 | 1.89 | 1.47 | 1.06 | 0.99 | 5.40 | ||
| 312 | 2013 | 1.20 | 1.02 | 0.65 | 0.48 | 3.35 | ||
| 412 | 2013 | 1.26 | 1.16 | 0.74 | 0.63 | 3.79 | ||
| 512 | 2013 | 1.30 | 1.11 | 0.80 | 0.65 | 3.87 | ||
| 612 | 2013 | 0.86 | 0.86 | 0.63 | 0.43 | 2.78 | ||
| 712 | 2013 | 0.83 | 1.03 | 0.65 | 0.44 | 2.95 | ||
| 812 | 2013 | 1.94 | 1.26 | 1.03 | 0.84 | 5.07 | ||
| 113 | 2013 | 2.27 | 1.80 | 1.19 | 5.26 | |||
| 213 | 2013 | 0.82 | 1.08 | 0.62 | 0.76 | 3.28 | ||
| 313 | 2013 | 0.82 | 0.83 | 0.51 | 0.60 | 2.76 | ||
| 413 | 2013 | 0.92 | 1.11 | 0.72 | 0.50 | 3.25 | ||
| 513 | 2013 | 0.47 | 0.40 | 0.44 | 0.30 | 1.62 | ||
| Average (mean) | 1.25 | 1.08 | 0.76 | 0.63 | 3.67 | |||
| Low | 0.47 | 0.40 | 0.44 | 0.30 | 1.62 | |||
| High | 2.27 | 1.80 | 1.19 | 0.99 | 0.76 |
2014 Harvest Year
| Field ID # | Harvest Year | First Cut DM Yield | Second Cut DM Yield | Third Cut DM Yield | Fourth Cut DM Yield | Fifth Cut DM Yield | Fall Cut DM Yield | Season DM Yield |
|---|---|---|---|---|---|---|---|---|
| 212 | 2014 | 1.76 | 1.53 | 0.77 | 0.88 | 4.93 | ||
| 312 | 2014 | 1.69 | 0.97 | 0.70 | 0.80 | 4.16 | ||
| 412 | 2014 | 1.56 | 0.89 | 0.75 | 0.70 | 3.90 | ||
| 512 | 2014 | 1.48 | 0.59 | 0.76 | 0.65 | 3.48 | ||
| 612 | 2014 | 1.41 | 0.66 | 0.54 | 0.59 | 3.20 | ||
| 113 | 2014 | 1.80 | 1.70 | 1.24 | 1.03 | 5.79 | ||
| 213 | 2014 | 1.39 | 0.51 | 0.64 | 1.05 | 3.58 | ||
| 313 | 2014 | 1.09 | 0.53 | 0.66 | 0.84 | 3.13 | ||
| 413 | 2014 | 1.87 | 0.68 | 0.67 | 0.90 | 4.12 | ||
| 114 | 2014 | 1.93 | 1.88 | 1.24 | 1.25 | 6.28 | ||
| 214 | 2014 | 1.49 | 1.77 | 1.36 | 0.88 | 5.50 | ||
| 314 | 2014 | 1.88 | 1.14 | 1.02 | 0.73 | 4.77 | ||
| 414 | 2014 | 1.74 | 1.99 | 1.19 | 1.09 | 6.02 | ||
| 514 | 2014 | 1.77 | 0.89 | 0.55 | 0.75 | 3.95 | ||
| 614 | 2014 | 2.13 | 0.88 | 0.35 | 0.73 | 4.09 | ||
| 714 | 2014 | 2.96 | 1.24 | 1.02 | 0.91 | 6.12 | ||
| 814 | 2014 | 1.42 | 1.22 | 0.42 | 0.70 | 3.75 | ||
| 914 | 2014 | 1.18 | 1.20 | 0.93 | 3.31 | |||
| 1014 | 2014 | 2.04 | 1.58 | 1.20 | 4.82 | |||
| 1114 | 2014 | 1.42 | 0.73 | 0.76 | 0.74 | 3.65 | ||
| 1214 | 2014 | 1.23 | 0.54 | 0.95 | 0.70 | 3.42 | ||
| 1314 | 2014 | 1.20 | 0.49 | 0.88 | 0.83 | 3.39 | ||
| 1414 | 2014 | 1.28 | 1.93 | 0.72 | 1.31 | 5.23 | ||
| 1514 | 2014 | 1.87 | 1.24 | 0.91 | 1.58 | 5.50 | ||
| Average (mean) | 1.65 | 1.12 | 0.84 | 0.89 | 4.42 | |||
| Low | 1.09 | 0.49 | 0.35 | 0.35 | 3.13 | |||
| High | 2.96 | 1.99 | 1.36 | 1.36 | 6.28 |
2015 Harvest Year
| Field ID # | Harvest Year | First Cut DM Yield | Second Cut DM Yield | Third Cut DM Yield | Fourth Cut DM Yield | Fifth Cut DM Yield | Fall Cut DM Yield | Season DM Yield |
|---|---|---|---|---|---|---|---|---|
| 113 | 2015 | 1.59 | 1.50 | 1.61 | 0.85 | 5.55 | ||
| 114 | 2015 | 1.87 | 1.60 | 1.46 | 1.02 | 5.95 | ||
| 214 | 2015 | 1.25 | 0.88 | 0.88 | 0.72 | 0.66 | 4.40 | |
| 314 | 2015 | 1.76 | 1.15 | 0.95 | 0.75 | 4.61 | ||
| 414 | 2015 | 1.67 | 1.60 | 1.24 | 0.64 | 5.14 | ||
| 514 | 2015 | 1.25 | 1.84 | 1.17 | 4.26 | |||
| 614 | 2015 | 2.89 | 1.21 | 0.86 | 0.70 | 5.67 | ||
| 714 | 2015 | 1.29 | 0.99 | 1.63 | 0.89 | 4.80 | ||
| 814 | 2015 | 1.30 | 0.77 | 0.95 | 0.35 | 3.37 | ||
| 914 | 2015 | 2.26 | 0.73 | 1.00 | 3.99 | |||
| 1014 | 2015 | 2.39 | 0.62 | 1.11 | 4.12 | |||
| 1414 | 2015 | 2.04 | 1.26 | 0.95 | 0.82 | 5.06 | ||
| 1514 | 2015 | 2.03 | 1.14 | 1.03 | 0.84 | 5.03 | ||
| 115 | 2015 | 1.16 | 1.30 | 0.87 | 0.77 | 4.10 | ||
| 215 | 2015 | 1.65 | 1.10 | 0.70 | 1.07 | 3.45 | ||
| 315 | 2015 | 1.53 | 0.76 | 1.19 | 0.76 | 4.55 | ||
| 415 | 2015 | 1.90 | 0.81 | 0.98 | 0.76 | 4.45 | ||
| 515 | 2015 | 1.98 | 0.91 | 1.02 | 0.76 | 4.66 | ||
| 615 | 2015 | 1.20 | 0.69 | 0.57 | 0.29 | 2.74 | ||
| 715 | 2015 | 1.51 | 0.83 | 0.95 | 0.63 | 3.92 | ||
| 815 | 2015 | 1.83 | 1.17 | 0.91 | 3.90 | |||
| 915 | 2015 | 2.33 | 1.05 | 1.91 | 5.28 | |||
| 1015 | 2015 | 1.81 | 1.36 | 1.49 | 0.95 | 5.60 | ||
| Average (mean) | 1.76 | 1.10 | 1.11 | 0.75 | 0.66 | 4.55 | ||
| Low | 1.16 | 0.62 | 0.57 | 0.29 | 0.66 | 2.74 | ||
| High | 2.89 | 1.84 | 1.91 | 1.07 | 0.66 | 5.95 |
2016 Harvest Year
| Field ID # | Harvest Year | First Cut DM Yield | Second Cut DM Yield | Third Cut DM Yield | Fourth Cut DM Yield | Fifth Cut DM Yield | Fall Cut DM Yield | Season DM Yield |
|---|---|---|---|---|---|---|---|---|
| 114 | 2016 | 2.20 | 1.49 | 1.23 | 0.90 | 5.82 | ||
| 214 | 2016 | 1.74 | 1.12 | 0.76 | 0.45 | 4.06 | ||
| 314 | 2016 | 2.30 | 1.13 | 0.68 | 0.62 | 4.73 | ||
| 414 | 2016 | 1.97 | 1.47 | 1.12 | 0.80 | 5.35 | ||
| 514 | 2016 | 1.98 | 1.68 | 1.56 | 5.22 | |||
| 614 | 2016 | 2.22 | 1.12 | 1.28 | 1.07 | 5.70 | ||
| 714 | 2016 | 2.17 | 1.35 | 1.08 | 1.06 | 5.66 | ||
| 1014 | 2016 | 2.64 | 1.36 | 1.04 | 0.25 | 5.30 | ||
| 1414 | 2016 | 1.35 | 1.53 | 1.09 | 0.79 | 4.76 | ||
| 115 | 2016 | 1.57 | 1.40 | 1.00 | 0.67 | 0.80 | 5.44 | |
| 215 | 2016 | 1.85 | 1.36 | 0.88 | 0.44 | 4.54 | ||
| 315 | 2016 | 1.61 | 0.88 | 0.79 | 0.42 | 3.70 | ||
| 415 | 2016 | 1.49 | 1.35 | 0.74 | 1.07 | 4.65 | ||
| 515 | 2016 | 2.37 | 0.88 | 0.83 | 1.03 | 5.10 | ||
| 615 | 2016 | 1.31 | 0.81 | 0.76 | 0.80 | 3.67 | ||
| 715 | 2016 | 1.28 | 1.09 | 1.10 | 0.84 | 4.31 | ||
| 815 | 2016 | 1.94 | 0.84 | 0.93 | 3.70 | |||
| 915 | 2016 | 2.54 | 1.17 | 1.21 | 4.93 | |||
| 1015 | 2016 | 1.92 | 1.40 | 1.31 | 1.07 | 5.70 | ||
| 116 | 2016 | 2.35 | 1.14 | 1.73 | 5.21 | |||
| 216 | 2016 | 1.24 | 0.94 | 0.86 | 0.89 | 3.94 | ||
| 316 | 2016 | 1.45 | 0.85 | 0.79 | 0.84 | 3.94 | ||
| 416 | 2016 | 1.30 | 0.85 | 0.71 | 0.57 | 3.43 | ||
| 516 | 2016 | 1.65 | 0.82 | 0.88 | 0.86 | 4.21 | ||
| 616 | 2016 | 1.36 | 0.71 | 0.67 | 0.89 | 3.64 | ||
| 716 | 2016 | 2.15 | 1.30 | 1.26 | 1.36 | 6.07 | ||
| Average (mean) | 1.84 | 1.16 | 1.01 | 0.83 | 0.80 | 0.25 | 4.72 | |
| Low | 1.24 | 0.71 | 0.67 | 0.42 | 0.80 | 0.25 | 3.43 | |
| High | 2.64 | 1.68 | 1.73 | 1.36 | 0.80 | 0.25 | 6.07 |
2017 Harvest Year
| Field ID # | Harvest Year | First Cut DM Yield | Second Cut DM Yield | Third Cut DM Yield | Fourth Cut DM Yield | Fifth Cut DM Yield | Fall Cut DM Yield | Season DM Yield |
|---|---|---|---|---|---|---|---|---|
| 414 | 2017 | 1.46 | 0.79 | 1.18 | 1.17 | 4.60 | ||
| 714 | 2017 | 2.03 | 0.96 | 1.06 | 1.20 | 5.25 | ||
| 115 | 2017 | 1.12 | 1.14 | 1.04 | 0.94 | 4.23 | ||
| 515 | 2017 | 1.17 | 1.01 | 0.48 | 0.39 | 3.05 | ||
| 815 | 2017 | 1.97 | 0.61 | 0.75 | 0.57 | 3.89 | ||
| 1015 | 2017 | 2.04 | 0.98 | 0.58 | 0.79 | 4.39 | ||
| 116 | 2017 | 2.37 | 0.51 | 0.42 | 3.30 | |||
| 716 | 2017 | 2.00 | 1.33 | 1.10 | 0.90 | 5.32 | ||
| 117 | 2017 | 1.80 | 0.79 | 0.78 | 3.37 | |||
| 217 | 2017 | 1.64 | 1.50 | 1.10 | 0.89 | 5.13 | ||
| 317 | 2017 | 0.93 | 0.80 | 0.53 | 0.52 | 2.78 | ||
| 417 | 2017 | 0.97 | 0.83 | 0.39 | 0.42 | 2.60 | ||
| 517 | 2017 | 1.56 | 1.49 | 0.78 | 0.87 | 4.69 | ||
| 617 | 2017 | 1.75 | 1.15 | 0.97 | 0.92 | 4.79 | ||
| 717 | 2017 | 1.09 | 0.87 | 0.90 | 2.85 | |||
| 817 | 2017 | 1.99 | 1.12 | 0.88 | 3.99 | |||
| 917 | 2017 | 1.48 | 1.50 | 1.28 | 0.66 | 4.93 | ||
| 1017 | 2017 | 2.03 | 1.46 | 1.41 | 0.48 | 5.38 | ||
| Average (mean) | 1.63 | 1.05 | 0.87 | 0.77 | 4.14 | |||
| Low | 0.93 | 0.51 | 0.39 | 0.39 | 2.60 | |||
| High | 2.37 | 1.50 | 1.41 | 1.20 | 5.38 |
2018 Harvest Year
| Field ID # | Harvest Year | First Cut DM Yield | Second Cut DM Yield | Third Cut DM Yield | Fourth Cut DM Yield | Fifth Cut DM Yield | Fall Cut DM Yield | Season DM Yield |
|---|---|---|---|---|---|---|---|---|
| 515 | 2018 | 1.03 | 0.56 | 0.92 | 0.59 | 3.10 | ||
| 1015 | 2018 | 1.74 | 1.29 | 1.43 | 0.93 | 5.40 | ||
| 716 | 2018 | 1.76 | 1.29 | 1.20 | 1.08 | 5.34 | ||
| 117 | 2018 | 1.32 | 1.76 | 0.86 | 0.26 | 4.20 | ||
| 217 | 2018 | 1.68 | 1.60 | 1.00 | 4.28 | |||
| 317 | 2018 | 1.07 | 0.85 | 0.62 | 0.71 | 3.25 | ||
| 417 | 2018 | 1.29 | 0.85 | 0.69 | 0.65 | 3.48 | ||
| 517 | 2018 | 1.54 | 1.02 | 0.78 | 0.82 | 4.15 | ||
| 617 | 2018 | 1.51 | 0.95 | 1.77 | 0.69 | 4.93 | ||
| 717 | 2018 | 1.43 | 0.63 | 1.14 | 0.78 | 3.99 | ||
| 817 | 2018 | 1.69 | 1.13 | 1.12 | 0.91 | 4.86 | ||
| 917 | 2018 | 1.62 | 0.76 | 1.13 | 0.82 | 4.33 | ||
| 1017 | 2018 | 1.48 | 0.84 | 1.42 | 0.98 | 4.72 | ||
| 118 | 2018 | 1.46 | 1.20 | 1.05 | 1.00 | 4.72 | ||
| 218 | 2018 | 1.73 | 1.00 | 1.44 | 1.39 | 5.56 | ||
| 318 | 2018 | 1.22 | 0.93 | 1.03 | 1.01 | 4.19 | ||
| 418 | 2018 | 1.19 | 1.22 | 0.99 | 1.16 | 0.83 | 5.39 | |
| 518 | 2018 | 1.23 | 1.24 | 0.97 | 0.82 | 4.27 | ||
| 618 | 2018 | 2.01 | 1.67 | 0.81 | 1.20 | 5.69 | ||
| 718 | 2018 | 1.38 | 1.65 | 1.07 | 0.97 | 5.06 | ||
| 818 | 2018 | 1.43 | 0.72 | 0.50 | 0.65 | 3.30 | ||
| 918 | 2018 | 1.18 | 1.08 | 0.28 | 0.66 | 3.20 | ||
| 1018 | 2018 | 1.50 | 1.38 | 1.79 | 0.90 | 5.58 | ||
| 1118 | 2018 | 1.40 | 0.55 | 0.99 | 0.67 | 3.61 | ||
| 1218 | 2018 | 1.18 | 1.15 | 0.98 | 1.11 | 4.42 | ||
| 1318 | 2018 | 1.57 | 1.07 | 0.82 | 0.62 | 4.07 | ||
| 1418 | 2018 | 1.12 | 0.78 | 0.78 | 0.91 | 3.59 | ||
| Average (mean) | 1.44 | 1.08 | 1.02 | 0.86 | 0.83 | 4.40 | ||
| Low | 1.03 | 0.55 | 0.28 | 0.26 | 0.83 | 3.10 | ||
| High | 2.01 | 1.76 | 1.79 | 1.39 | 0.83 | 5.69 |
2019 Harvest Year
| Field ID # | Harvest Year | First Cut DM Yield | Second Cut DM Yield | Third Cut DM Yield | Fourth Cut DM Yield | Fifth Cut DM Yield | Fall Cut DM Yield | Season DM Yield |
|---|---|---|---|---|---|---|---|---|
| 117 | 2019 | 1.42 | 0.88 | 0.65 | 2.95 | |||
| 217 | 2019 | 2.14 | 1.23 | 1.18 | 4.55 | |||
| 317 | 2019 | 0.80 | 1.01 | 0.41 | 0.66 | 2.89 | ||
| 517 | 2019 | 1.14 | 1.35 | 0.60 | 0.75 | 3.84 | ||
| 617 | 2019 | 1.30 | 0.92 | 0.76 | 0.64 | 3.62 | ||
| 917 | 2019 | 1.36 | 1.07 | 0.90 | 0.79 | 4.13 | ||
| 1017 | 2019 | 1.61 | 1.11 | 0.99 | 0.82 | 4.53 | ||
| 118 | 2019 | 1.04 | 0.91 | 0.57 | 0.86 | 3.37 | ||
| 318 | 2019 | 1.64 | 1.65 | 1.01 | 0.87 | 5.17 | ||
| 518 | 2019 | 1.53 | 1.44 | 1.18 | 1.83 | 5.98 | ||
| 618 | 2019 | 2.30 | 1.71 | 1.23 | 1.16 | 6.40 | ||
| 718 | 2019 | 1.72 | 1.24 | 1.13 | 0.74 | 4.83 | ||
| 818 | 2019 | 1.94 | 1.51 | 0.95 | 0.91 | 5.32 | ||
| 918 | 2019 | 1.79 | 1.18 | 0.91 | 0.62 | 4.50 | ||
| 1018 | 2019 | 1.56 | 1.72 | 1.27 | 0.66 | 5.22 | ||
| 1118 | 2019 | 0.61 | 0.93 | 0.52 | 0.75 | 2.81 | ||
| 1318 | 2019 | 1.14 | 1.16 | 0.53 | 0.73 | 3.55 | ||
| 1418 | 2019 | 1.66 | 1.09 | 0.63 | 0.86 | 3.38 | ||
| 119 | 2019 | 1.35 | 1.10 | 1.04 | 4.36 | |||
| 219 | 2019 | 1.54 | 1.18 | 0.86 | 0.46 | 4.04 | ||
| 319 | 2019 | 1.35 | 0.46 | 0.66 | 0.40 | 2.88 | ||
| 419 | 2019 | 1.14 | 0.85 | 0.67 | 0.23 | 2.89 | ||
| Average (mean) | 1.46 | 1.17 | 0.85 | 0.85 | 0.36 | 4.15 | ||
| Low | 0.61 | 0.61 | 0.41 | 0.62 | 0.23 | 2.81 | ||
| High | 2.30 | 2.30 | 1.27 | 1.83 | 0.46 | 6.40 |
2020 Harvest Year
| Field ID # | Harvest Year | First Cut DM Yield | Second Cut DM Yield | Third Cut DM Yield | Fourth Cut DM Yield | Fifth Cut DM Yield | Fall Cut DM Yield | Season DM Yield |
|---|---|---|---|---|---|---|---|---|
| 117 | 2020 | 0.70 | 0.27 | 0.28 | 1.25 | |||
| 318 | 2020 | 1.48 | 1.35 | 1.06 | 0.50 | 4.39 | ||
| 518 | 2020 | 1.22 | 0.78 | 0.78 | 2.78 | |||
| 618 | 2020 | 1.92 | 1.01 | 0.82 | 1.04 | 4.80 | ||
| 718 | 2020 | 1.45 | 0.71 | 0.83 | 0.75 | 3.73 | ||
| 818 | 2020 | 1.15 | 1.02 | 0.29 | 0.68 | 3.15 | ||
| 918 | 2020 | 0.91 | 0.77 | 0.93 | 0.63 | 3.24 | ||
| 1018 | 2020 | 1.33 | 1.51 | 1.26 | 0.83 | 4.92 | ||
| 1318 | 2020 | 0.53 | 0.86 | 0.37 | 0.89 | 2.65 | ||
| 1418 | 2020 | 1.80 | 1.15 | 0.83 | 0.75 | 4.52 | ||
| 119 | 2020 | 1.35 | 0.59 | 0.96 | 0.83 | 3.73 | ||
| 319 | 2020 | 1.06 | 0.60 | 0.50 | 1.09 | |||
| 120 | 2020 | 1.53 | 0.99 | 1.28 | 0.85 | |||
| 220 | 2020 | 1.40 | 0.99 | 1.30 | 0.90 | |||
| 320 | 2020 | 0.68 | 0.85 | 0.77 | 0.65 | |||
| 420 | 2020 | 1.01 | 1.25 | 1.11 | 0.77 | |||
| 520 | 2020 | 0.99 | 0.58 | 1.14 | 0.55 | |||
| 620 | 2020 | 1.36 | 0.86 | 1.08 | ||||
| Average (mean) | 1.22 | 0.90 | 0.87 | 0.76 | 0.92 | 3.63 | ||
| Low | 0.53 | 0.27 | 0.28 | 0.50 | 0.75 | 1.25 | ||
| High | 1.92 | 1.51 | 1.30 | 1.04 | 1.09 | 4.92 |
2021 Harvest Year
| Field ID # | Harvest Year | First Cut DM Yield | Second Cut DM Yield | Third Cut DM Yield | Fourth Cut DM Yield | Fifth Cut DM Yield | Fall Cut DM Yield | Season DM Yield |
|---|---|---|---|---|---|---|---|---|
| 818 | 2021 | 1.29 | 0.97 | 1.45 | 0.87 | 4.58 | ||
| 119 | 2021 | 1.47 | 0.78 | 1.09 | 0.85 | 4.19 | ||
| 120 | 2021 | 1.85 | 1.20 | 1.16 | 0.94 | 5.14 | ||
| 220 | 2021 | 2.01 | 1.32 | 1.10 | 0.74 | 5.17 | ||
| 320 | 2021 | 1.23 | 0.59 | 0.57 | 0.59 | 2.98 | ||
| 420 | 2021 | 1.74 | 0.74 | 0.87 | 0.78 | 0.51 | 4.64 | |
| 620 | 2021 | 1.28 | 1.68 | 0.90 | 0.61 | 4.47 | ||
| 121 | 2021 | 1.95 | 1.63 | 1.40 | 0.90 | 5.88 | ||
| 221 | 2021 | 1.74 | 1.19 | 1.13 | 0.99 | 5.04 | ||
| 321 | 2021 | 1.76 | 1.16 | 1.02 | 0.83 | 4.76 | ||
| 421 | 2021 | 2.27 | 1.60 | 1.51 | 0.77 | 6.15 | ||
| 521 | 2021 | 1.79 | 0.84 | 1.70 | 4.33 | |||
| 621 | 2021 | 2.11 | 1.19 | 0.35 | 1.07 | 4.73 | ||
| 721 | 2021 | 1.99 | 0.59 | 1.22 | 1.06 | 0.67 | 5.52 | |
| 821 | 2021 | 1.88 | 0.78 | 0.74 | 0.62 | 0.64 | 4.66 | |
| 921 | 2021 | 2.53 | 0.84 | 1.40 | 1.04 | 0.79 | 6.60 | |
| 1021 | 2021 | 1.48 | 1.01 | 0.97 | 0.89 | 4.35 | ||
| 1121 | 2021 | 2.00 | 0.87 | 1.03 | 0.96 | 4.87 | ||
| 1221 | 2021 | 1.57 | 0.57 | 0.83 | 0.86 | 0.74 | 4.56 | |
| Average (mean) | 1.79 | 1.03 | 1.08 | 0.85 | 0.67 | 4.87 | ||
| Low | 1.23 | 0.57 | 0.57 | 0.59 | 0.51 | 2.98 | ||
| High | 2.53 | 1.68 | 1.68 | 1.07 | 0.79 | 6.60 |
2022 Harvest Year
| Field ID # | Harvest Year | First Cut DM Yield | Second Cut DM Yield | Third Cut DM Yield | Fourth Cut DM Yield | Fifth Cut DM Yield | Fall Cut DM Yield | Season DM Yield |
|---|---|---|---|---|---|---|---|---|
| 120 | 2022 | 1.55 | 0.79 | 0.60 | 0.65 | 3.59 | ||
| 220 | 2022 | 1.50 | 0.96 | 1.13 | 0.69 | 4.27 | ||
| 121 | 2022 | 1.89 | 1.08 | 0.67 | 0.79 | 4.43 | ||
| 221 | 2022 | 1.98 | 1.35 | 0.93 | 0.85 | 5.11 | ||
| 321 | 2022 | 1.31 | 0.72 | 0.69 | 0.51 | 3.23 | ||
| 421 | 2022 | 1.47 | 1.10 | 0.80 | 0.62 | 3.99 | ||
| 521 | 2022 | 1.41 | 0.45 | 1.06 | 2.92 | |||
| 621 | 2022 | 2.00 | 0.67 | 1.13 | 0.82 | 4.62 | ||
| 721 | 2022 | 1.73 | 0.68 | 0.84 | 0.94 | 4.19 | ||
| 821 | 2022 | 1.60 | 0.63 | 0.97 | 1.05 | 4.24 | ||
| 921 | 2022 | 1.72 | 1.34 | 0.87 | 0.87 | 4.80 | ||
| 1021 | 2022 | 1.67 | 0.64 | 0.77 | 0.83 | 3.91 | ||
| 1121 | 2022 | 1.70 | 0.60 | 0.95 | 1.28 | 4.53 | ||
| 1221 | 2022 | 1.56 | 0.70 | 0.89 | 0.95 | 4.10 | ||
| 122 | 2022 | 1.33 | 1.05 | 0.96 | 1.27 | 4.61 | ||
| Average (mean) | 1.63 | 0.85 | 0.88 | 0.87 | 4.17 | |||
| Low | 1.31 | 0.46 | 0.60 | 0.51 | 2.92 | |||
| High | 2.00 | 1.35 | 1.13 | 1.28 | 5.11 |
2023 Harvest Year
| Field ID # | Harvest Year | First Cut DM Yield | Second Cut DM Yield | Third Cut DM Yield | Fourth Cut DM Yield | Fifth Cut DM Yield | Fall Cut DM Yield | Season DM Yield |
|---|---|---|---|---|---|---|---|---|
| 220 | 2023 | 1.61 | 0.66 | 1.27 | 0.79 | 4.32 | ||
| 121 | 2023 | 1.40 | 0.70 | 1.06 | 0.69 | 3.86 | ||
| 221 | 2023 | 2.06 | 1.10 | 0.90 | 1.21 | 5.27 | ||
| 321 | 2023 | 1.28 | 0.81 | 0.62 | 2.71 | |||
| 421 | 2023 | 1.34 | 1.17 | 0.99 | 1.10 | 4.60 | ||
| 521 | 2023 | 2.00 | 0.83 | 0.89 | 0.67 | 4.39 | ||
| 621 | 2023 | 2.08 | 0.84 | 0.78 | 1.24 | 4.94 | ||
| 721 | 2023 | 1.56 | 0.96 | 0.52 | 1.08 | 4.12 | ||
| 921 | 2023 | 1.75 | 0.96 | 0.59 | 1.26 | 4.56 | ||
| 1021 | 2023 | 1.22 | 0.97 | 1.00 | 1.09 | 4.28 | ||
| 1121 | 2023 | 1.40 | 1.01 | 0.85 | 1.10 | 4.36 | ||
| 1221 | 2023 | 1.30 | 0.90 | 0.61 | 1.11 | 3.91 | ||
| 122 | 2023 | 2.03 | 0.90 | 1.26 | 0.83 | 5.02 | ||
| 123 | 2023 | 2.06 | 1.34 | 1.30 | 1.11 | 5.81 | ||
| 223 | 2023 | 1.92 | 1.06 | 0.89 | 0.90 | 4.77 | ||
| 323 | 2023 | 1.46 | 0.85 | 0.57 | 0.98 | 3.86 | ||
| 423 | 2023 | 1.65 | 0.90 | 0.55 | 0.94 | 4.04 | ||
| 523 | 2023 | 1.57 | 0.95 | 0.64 | 0.81 | 3.97 | ||
| Average (mean) | 1.65 | 0.94 | 0.85 | 0.99 | 4.38 | |||
| Low | 1.22 | 0.66 | 0.52 | 0.67 | 2.71 | |||
| High | 2.08 | 1.34 | 1.30 | 1.26 | 5.81 |
2024 Harvest Year
| Field ID # | Harvest Year | First Cut DM Yield | Second Cut DM Yield | Third Cut DM Yield | Fourth Cut DM Yield | Fifth Cut DM Yield | Fall Cut DM Yield | Season DM Yield |
|---|---|---|---|---|---|---|---|---|
| 421 | 2024 | 1.84 | 1.13 | 0.94 | 0.72 | 4.63 | ||
| 521 | 2024 | 1.92 | 0.95 | 0.90 | 1.16 | 4.93 | ||
| 621 | 2024 | 2.26 | 1.04 | 1.12 | 1.59 | 6.01 | ||
| 1021 | 2024 | 1.84 | 0.97 | 0.76 | 0.66 | 4.23 | ||
| 1221 | 2024 | 2.36 | 0.86 | 0.92 | 0.51 | 4.64 | ||
| 122 | 2024 | 1.51 | 1.19 | 1.14 | 0.78 | 4.62 | ||
| 123 | 2024 | 2.16 | 1.34 | 1.33 | 0.91 | 5.73 | ||
| 223 | 2024 | 2.19 | 1.52 | 1.30 | 0.75 | 5.76 | ||
| 323 | 2024 | 2.01 | 1.29 | 0.77 | 0.43 | 4.49 | ||
| 423 | 2024 | 2.06 | 1.57 | 1.10 | 0.35 | 5.08 | ||
| 523 | 2024 | 1.97 | 1.24 | 0.93 | 0.44 | 4.58 | ||
| 124 | 2024 | 2.12 | 1.39 | 1.33 | 0.92 | 5.75 | ||
| 224 | 2024 | 2.46 | 1.46 | 1.11 | 0.84 | 5.88 | ||
| 324 | 2024 | 1.84 | 1.11 | 0.98 | 0.46 | 4.40 | ||
| 424 | 2024 | 2.59 | 1.67 | 1.36 | 0.95 | 6.57 | ||
| 524 | 2024 | 2.11 | 1.20 | 0.46 | 0.95 | 4.73 | ||
| Average (mean) | 2.08 | 1.25 | 1.03 | 0.78 | 5.13 | |||
| Low | 1.51 | 0.86 | 0.46 | 0.35 | 4.23 | |||
| High | 2.59 | 1.67 | 1.36 | 1.59 | 6.57 |
2025 Harvest Year
| Field ID # | Harvest Year | First Cut DM Yield | Second Cut DM Yield | Third Cut DM Yield | Fourth Cut DM Yield | Fifth Cut DM Yield | Fall Cut DM Yield | Season DM Yield |
|---|---|---|---|---|---|---|---|---|
| 621 | 2025 | 1.44 | 1.12 | 0.76 | 0.74 | 4.06 | ||
| 123 | 2025 | 2.67 | 1.44 | 1.25 | 1.00 | 6.36 | ||
| 223 | 2025 | 1.45 | 1.19 | 1.11 | 1.18 | 4.93 | ||
| 323 | 2025 | 1.02 | 1.13 | 1.01 | 1.21 | 4.37 | ||
| 423 | 2025 | 1.39 | 1.53 | 1.29 | 1.26 | 5.47 | ||
| 523 | 2025 | 0.95 | 1.10 | 1.17 | 1.06 | 4.28 | ||
| 124 | 2025 | 2.80 | 1.58 | 1.26 | 1.01 | 6.65 | ||
| 224 | 2025 | 1.72 | 1.46 | 1.43 | 1.24 | 5.85 | ||
| 324 | 2025 | 1.45 | 1.21 | 0.94 | 1.06 | 4.66 | ||
| 424 | 2025 | 2.14 | 1.58 | 0.89 | 1.32 | 5.93 | ||
| 524 | 2025 | 1.76 | 1.61 | 1.09 | 0.81 | 5.28 | ||
| 125 | 2025 | 2.52 | 1.69 | 1.27 | 1.14 | 6.62 | ||
| 225 | 2025 | 1.32 | 1.25 | 0.98 | 0.90 | 4.45 | ||
| 325 | 2025 | 1.26 | 1.53 | 0.97 | 1.60 | 5.36 | ||
| 425 | 2025 | 2.34 | 1.14 | 1.39 | 0.76 | 5.63 | ||
| 525 | 2025 | 1.31 | 1.17 | 0.60 | 1.35 | 4.42 | ||
| 625 | 2025 | 1.40 | 1.08 | 0.75 | 0.75 | 3.97 | ||
| Average (mean) | 1.70 | 1.34 | 1.07 | 1.08 | 5.19 | |||
| Low | 0.95 | 1.08 | 0.60 | 0.74 | 3.97 | |||
| High | 2.80 | 1.69 | 1.43 | 1.60 | 6.65 |
Published: April 21, 2026
Reviewed by: Luana Queiroz, Liz Gartman and Kevin Jarek