

Weather and climate conditions this week in Wisconsin
Here are this week’s take-home points about the weather. As a reminder, AgWOW reports will be published weekly throughout the growing season. Scroll down for the full report.
Additionally, we’re collecting user feedback. Regardless of whether it’s your first time here or if you are a regular user, we’d love to hear from you!
Key Points
Recent Conditions
- Temperatures were commonly 2-4°F warmer than normal. However, some northern Wisconet stations reported overnight low temperatures at or below freezing on the morning of 9/14.
- Central counties received the highest precipitation totals last week (2-4”), while most of the state received at least a half inch of rain.
Impact
- For Wisconet stations included in the chart and table, most saw decreased soil moisture from last week’s report. The exception was Rice Lake, which received 1.6” of rain.
- Satellite-based soil moisture estimates indicate the dryness has worsened across south-central counties, while some northeast and east-central counties are indicated as having near-normal soil moisture for mid-September.
- Drought coverage in Wisconsin decreased by 4%. However, D3 drought expanded in the north-central region, and D2 drought expanded into Clark and Jackson Counties.
- Corn silage harvest is well underway as most of the corn crop has now reached dent stage. Pasture and range conditions improved slightly from last week’s report.
Outlook
- Rain chances over the next 7 days are highest in the southern tiers of counties, with lesser chances in central and northern counties. Chances are lowest in the far north.
- Late September temperatures will likely be above normal statewide, with precipitation in the eastern counties showing a below-normal lean.
- The outlook for October, and for the rest of fall into early winter, indicates a lean towards above-normal temperatures with precipitation uncertain (“equal chances”).
Agronomic, Fruit, and Vegetable Considerations
Field Conditions
- Crop conditions are highly reflective of moisture throughout the state. Much needed rainfall this week was too late for most row crops. Pockets of drought-stressed crops are scattered throughout Wisconsin, especially in the northern regions of the state, with silage harvest beginning early due to low moisture and/or disease pressure.
Forage Management
- Fourth crop alfalfa is being harvested. Use the Alfalfa Cutting Tool to plan your final cut to manage for persistence.
- Read about the impacts of drought on alfalfa if your crop is affected.
- Silage season is here. View moistures collected from dry down events: Corn Silage Dry Down Monitoring Tool.
- If your silage crop has been impacted by drought, read these harvest considerations.
- In areas that are impacted by drought, take caution with annual forages such as sorghum-sudangrass for concerns related to nitrate toxicity.
- Consider planting a cover crop after silage. A cover crop can not only provide environmental benefits but also forage for livestock.
Pest Management
- Scout fields to note what weed species are part of a late season flush.
- Wisconsin has soybean tentiform leafminer confirmed in 5 counties. This pest is unlikely to cause economic damage, but please report the pest if found.
- Red crown rot was confirmed in WI last year. Know what to scout for in your soybean fields this year.
- Fall armyworm trapping is concluding.
- Read the late-season field crops disease report. Diseases may be visible in corn and soybean fields, so make appropriate harvest plans if disease is present.
Manure Applications
- Reminder of Wisconsin’s NR 151 Runoff Rules with the timing of manure spreading and current runoff levels. Check DATCP Runoff Risk Advisory Forecast.
Small Grains
- If you are planting winter wheat this fall, consider revisiting Small Grains Recommendations and Row Width and Seeding Rates in WI.
- Read the Top 9 Recommendations for Winter Wheat Establishment in 2026. The planting window (September 20-October 10) is here.
Fruit Considerations – General
- Reminder: Always read and follow directions on the label and keep in mind pre-harvest intervals (PHI) as we move through harvest.
- Sanitation: Remove and destroy (chop/compost) fallen or rotting fruit ~weekly to prevent any internally developing larvae from reaching maturity, and to limit the spread of disease.
- Grape growers dealing with uneven ripening may reference this 2024 WI Fruit News article: Understanding and Addressing Uneven Ripening in Grapes.
- Apple and grape growers can reference the NEWA weather station network to monitor for disease infection periods in their area. Check out your nearest weather station: NEWA Weather Station Network (Cornell).
- Wisconsin fruit growers can reference the Midwest Fruit Pest Management Guide for a list of registered products and recommended best practices. View the MFPMG Online.
- Sun scald and southwest injury to trunks and branches have been observed across many orchards and vineyards this summer, likely due to wide variations in winter temperatures that can cause trunk and branch cracking. Growers may consider flagging trees and branches while harvesting, then return this winter to prune out impacted branches and take a closer look at injury.
- Fruit sunburn has been observed across many fruit crops in southern WI. Consider removing this fruit while out picking to prevent other pests attracted to the volatiles (scent).
Fruit Considerations – Disease
- Black rot and fruit rot symptoms continue to be reported in vineyards around WI. Review this 2022 article by Dr. Leslie Holland on Fruit and Cluster Rots for more information on black rot and fruit rot management around harvest.
- Downy mildew may impact grape quality at harvest. Read more about signs/symptoms and management in this 2024 WI Fruit News article on late-season downy mildew.
Fruit Considerations – Insects
- Apple growers should continue monitoring pheromone traps and degree-day (base 50℉) accumulation for Codling moth through harvest.
- Grape and berry growers monitoring spotted wing drosophila should continue checking and refreshing traps weekly through harvest.
- Apple maggot pressure is variable across the state. Growers should continue to use red sphere traps to monitor populations.
- Brown marmorated stink bug has been observed at West Madison. Keep an eye out for large populations through harvest.
- Check out the WI DATCP Orchard Insect Pest Bulletin for more information on current insect trap captures across the state.
Vegetable Considerations – General
- As warm season crops start to wind down, now is the time to start thinking about residue management. Either removing or tilling in residue helps with both disease and pest management for next season. Many insect pests including squash vine borer and cabbage maggot overwinter in residue left in the field. Plant pathogens including early blight and Septoria can also be carried into the next season on residue remaining in the field into the next season. For smaller scale growers who would like to reduce tillage, another option to help with residue breakdown is flail mowing and tarping.
- Make note of diseases you are dealing with this season and consider trialing resistant varieties next year.
- It is time to start thinking about fall cover crops. Use the Midwest Cover Crops Council Cover Crop Selection Tool to help decide the best species that fit your goals and planting window.
- Winter squash storage: temperatures should range from 50-55°F. Relative humidity should be between 50-70%. The area should be well ventilated. Store pumpkins away from ethylene producing crops like apples, melons and tomatoes
Vegetable Considerations – Disease
- Xanthomonas leaf spot vs black rot in brassicas
- XLS is similar to brassica black rot but unlike black rot, it does not become systemic. It causes leaf spots but does not enter vascular tissue. XLS is also prefers cooler temperatures compared to black rot which prefers temperatures around 80°F.
- Symptoms are small circular lesions on leaves that are tan to dark brown in color and often surrounded by a yellow halo. Spots can appear oily or water soaked on the underside of leaves. As the disease progresses, dark oval shaped spots may form on the petiole.
- For comparison, black rot often starts as v shaped lesions that move in from the leaf margins. As the disease progresses, vascular tissue of leaves may appear black when leaves are held up to the light.
- Since XLS is not systemic, removing infected leaves can reduce the spread. Other management options include avoiding working in plants when wet and spraying with copper if you catch the disease early.
- Thank you to Dan Fillius of Iowa State Extension for sharing great information on this disease
- Brassica alternaria starts as small black lesions that grow in a bullseye pattern as the lesions expand. It is spread through overhead irrigation, windborne spores, and insects such as flea beetles. Management options include avoiding working in fields when wet, management of weeds in the brassica family that serve as alternative hosts (ex: shepherd’s purse and wild mustards), removal of infected plants, and fungicides.
- If pumpkin vines are impacted by powdery mildew, harvest as soon as possible. If powdery mildew spreads to the handles, it can make them brittle and reduce desirability for customers. If applying fungicides for powdery mildew management, mid September is the recommended time for the last application. If you have other diseases present in your pumpkins, this article from Purdue has late season management tips.
Vegetable Considerations – Insects
- Cabbage aphid populations can increase quickly especially on long season crops such as Brussel sprouts. Their populations actually grow more quickly in relatively cooler temperatures (50-68°F). They prefer to feed on new growth including developing Brussel sprout buds. If plants are infected this fall, but residue cannot be tilled in or removed, be sure to remove/destroy crop residue early next spring before eggs hatch. Management options include biological controls and insecticides although they must be applied early before an infestation is severe.
Dive deeper into each report section by clicking a topic below.
Precipitation Trends
7 Day Precipitation
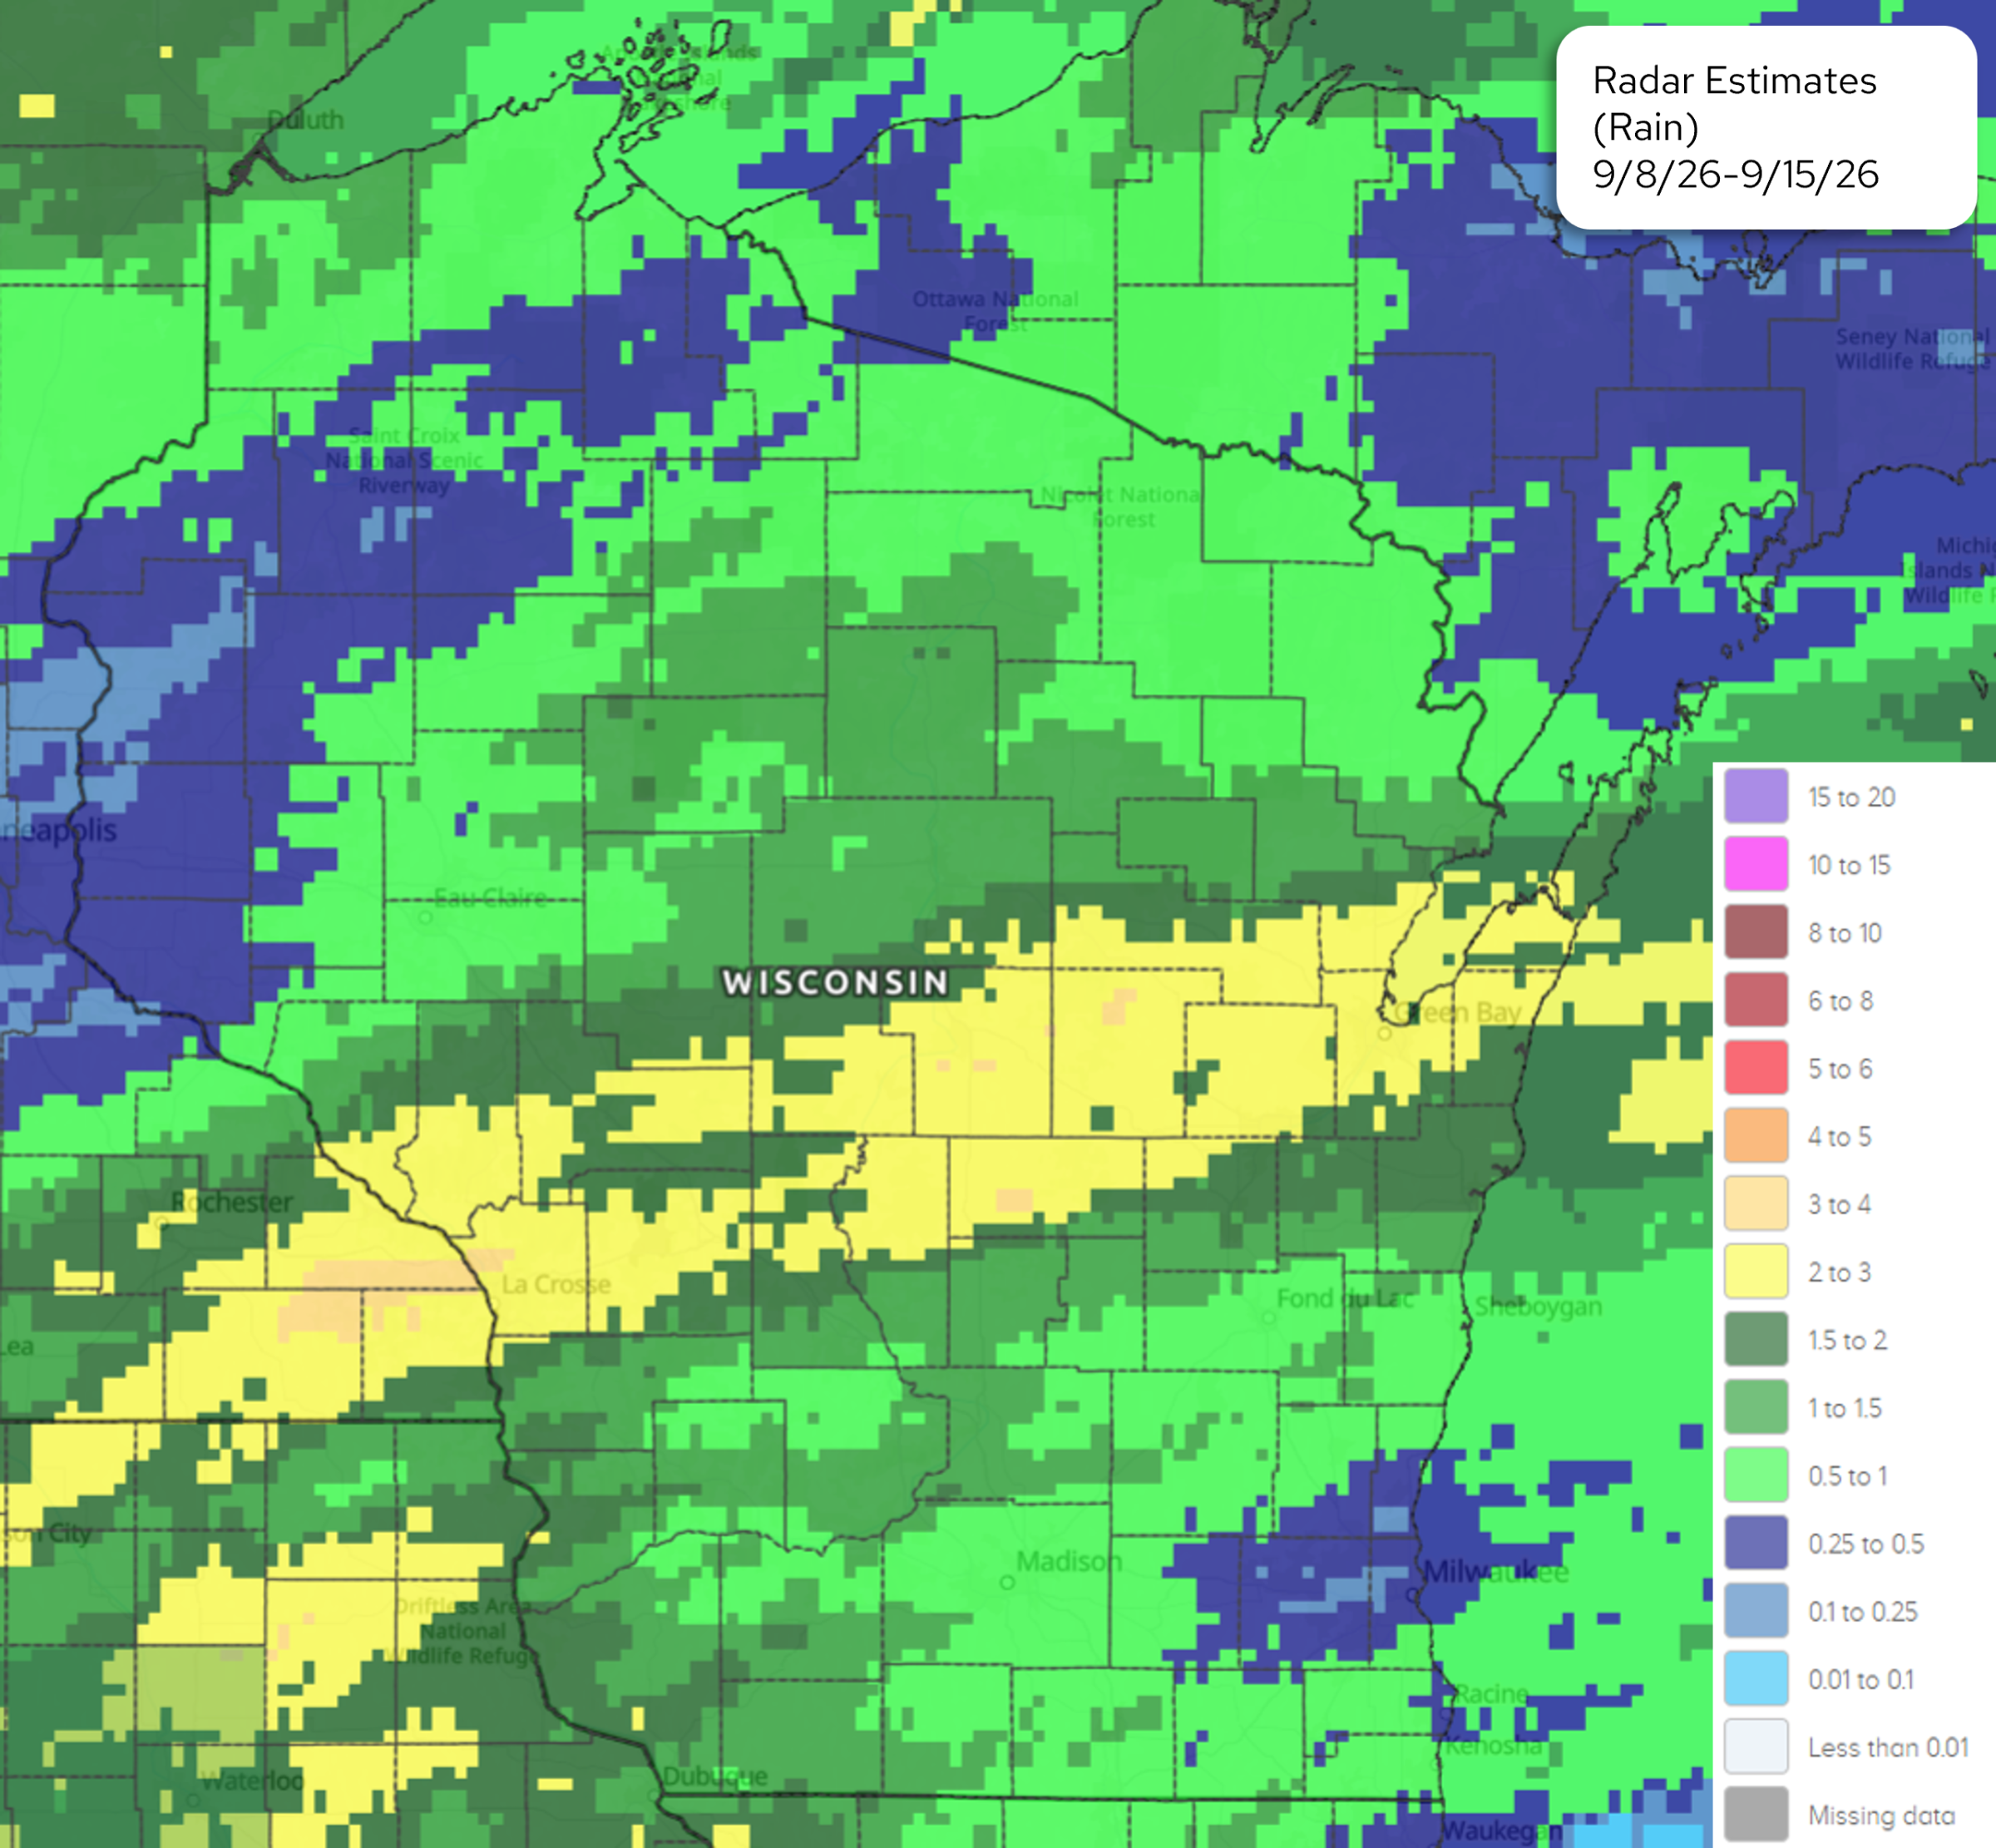
Image Description ↓
The radar estimate map displays 7-day precipitation totals covering Wisconsin and neighboring regions. A wide band of rainfall measuring 2 to 4 inches (yellow shades) stretches horizontally across central Wisconsin from west to east. Northern Wisconsin recorded lighter precipitation amounts ranging from 0.5 to 1.5 inches (green tones), while southern areas near Madison, Milwaukee, Racine, and Kenosha recorded totals between 0.25 and 1 inch (purple and green shades). The legend indicates color-coded precipitation values ranging from less than 0.01 inches to 20 inches.
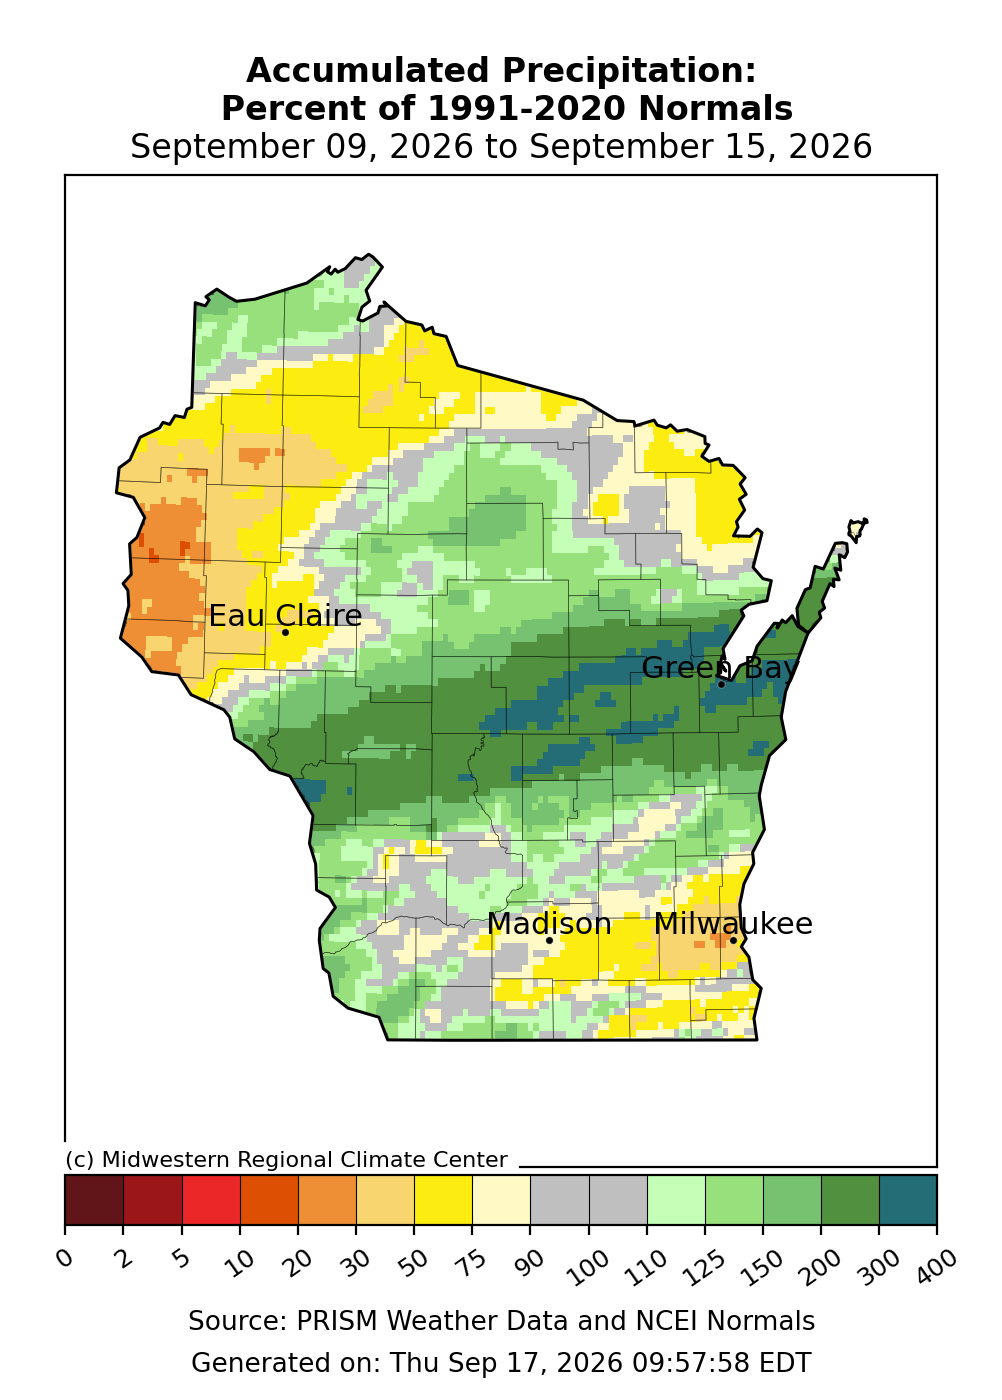
Image Description ↓
This map, titled “Accumulated Precipitation: Percent of 1991-2020 Normals,” covers September 9 to September 15, 2026, and is credited to the Midwestern Regional Climate Center, using PRISM Weather Data and NCEI Normals, generated September 17, 2026. A color scale ranges from dark red (0% of normal) through orange, yellow, and pale yellow (under 100%), to gray (near 100%), and greens through teal (above 100%, up to 400%). Western Wisconsin, near Eau Claire, shows the heaviest rainfall relative to normal, with dark orange and yellow-orange shading indicating roughly 150–300% or more of normal precipitation. A band across northern and north-central Wisconsin is shaded yellow and pale yellow, indicating below-normal precipitation, roughly 30–90% of normal. Central and eastern Wisconsin, including areas near Green Bay, Madison, and much of the region between them, show green and teal shading, indicating at or above-normal precipitation, generally 100–200% or higher. Small patches of yellow and orange near Milwaukee and along the far south indicate localized below-normal totals in those spots.
- Central counties received the highest precipitation totals last week. In a belt from La Crosse to Green Bay, totals of 2-4” were common (150-400% of normal).
- Most of the state received at least a half inch of rain.
- Counties in the northwest and around Milwaukee were the driest (0.1-0.5”), which had totals that were ≤50% of normal.
- Highest Wisconet station total from last week: 2.53” (Mindoro, La Crosse County; Warrens, Monroe County). Totals in La Crosse & Monroe Counties were as high as 200-400% of normal.
30 Day Precipitation Total and Departure from Normals
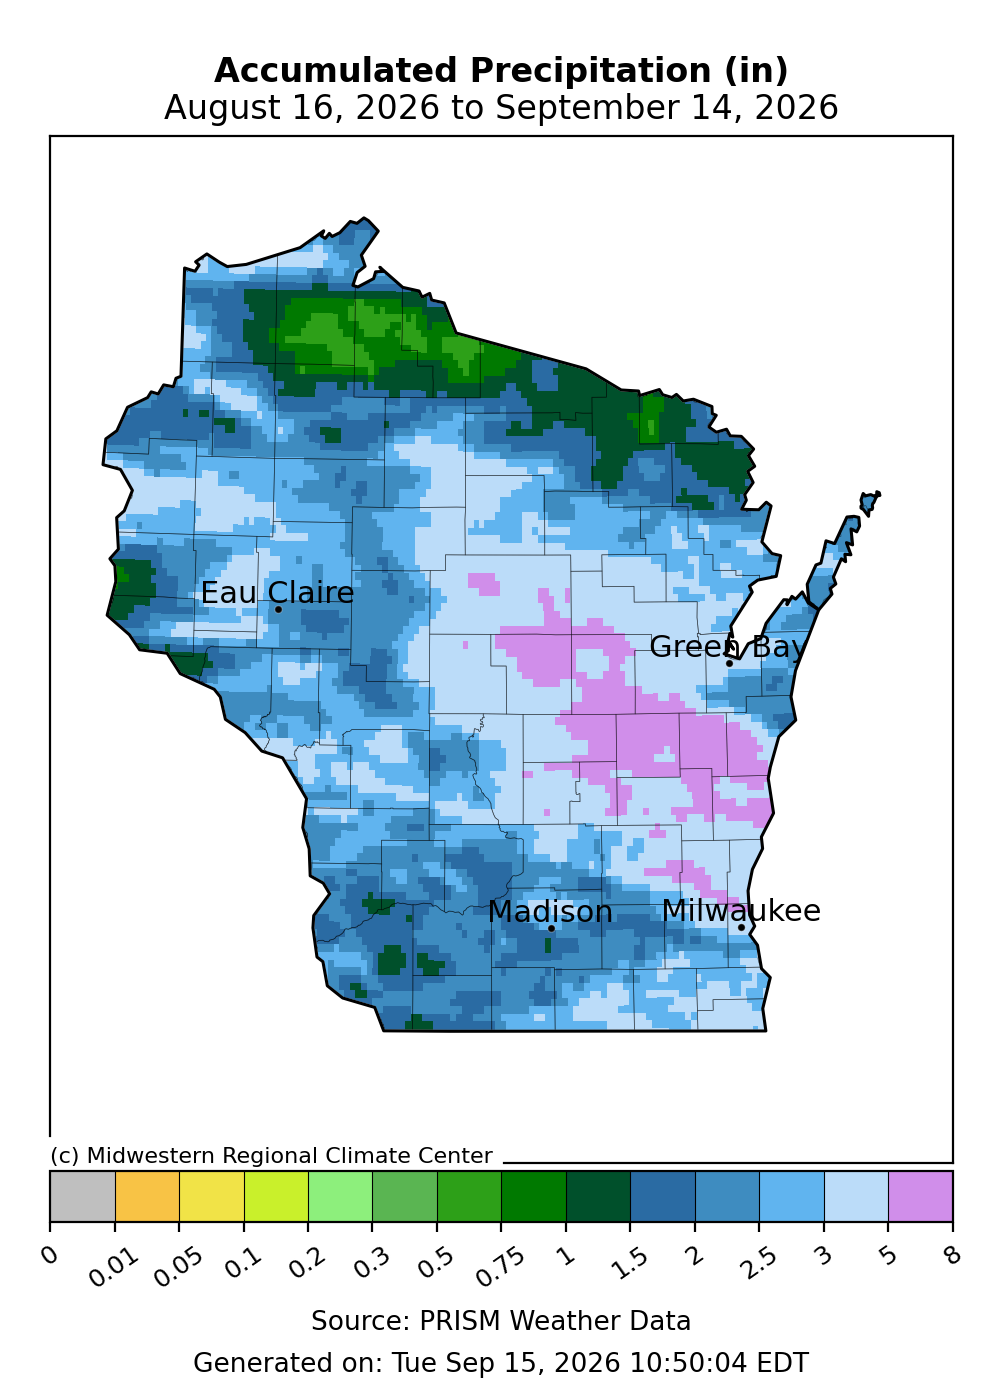
Image Description ↓
The map shows total rainfall accumulation across Wisconsin over a 30-day period. Most of central, southern, and western Wisconsin recorded 1.5 to 3 inches of rainfall (medium blue). Portions of central and eastern Wisconsin near Green Bay received higher accumulations of 5 to 8 inches (purple). Northern Wisconsin received totals ranging from 0.3 to 1 inch (green tones). Key labelled cities include Eau Claire, Green Bay, Madison, and Milwaukee. Data sourced from PRISM Weather Data by the Midwestern Regional Climate Center.
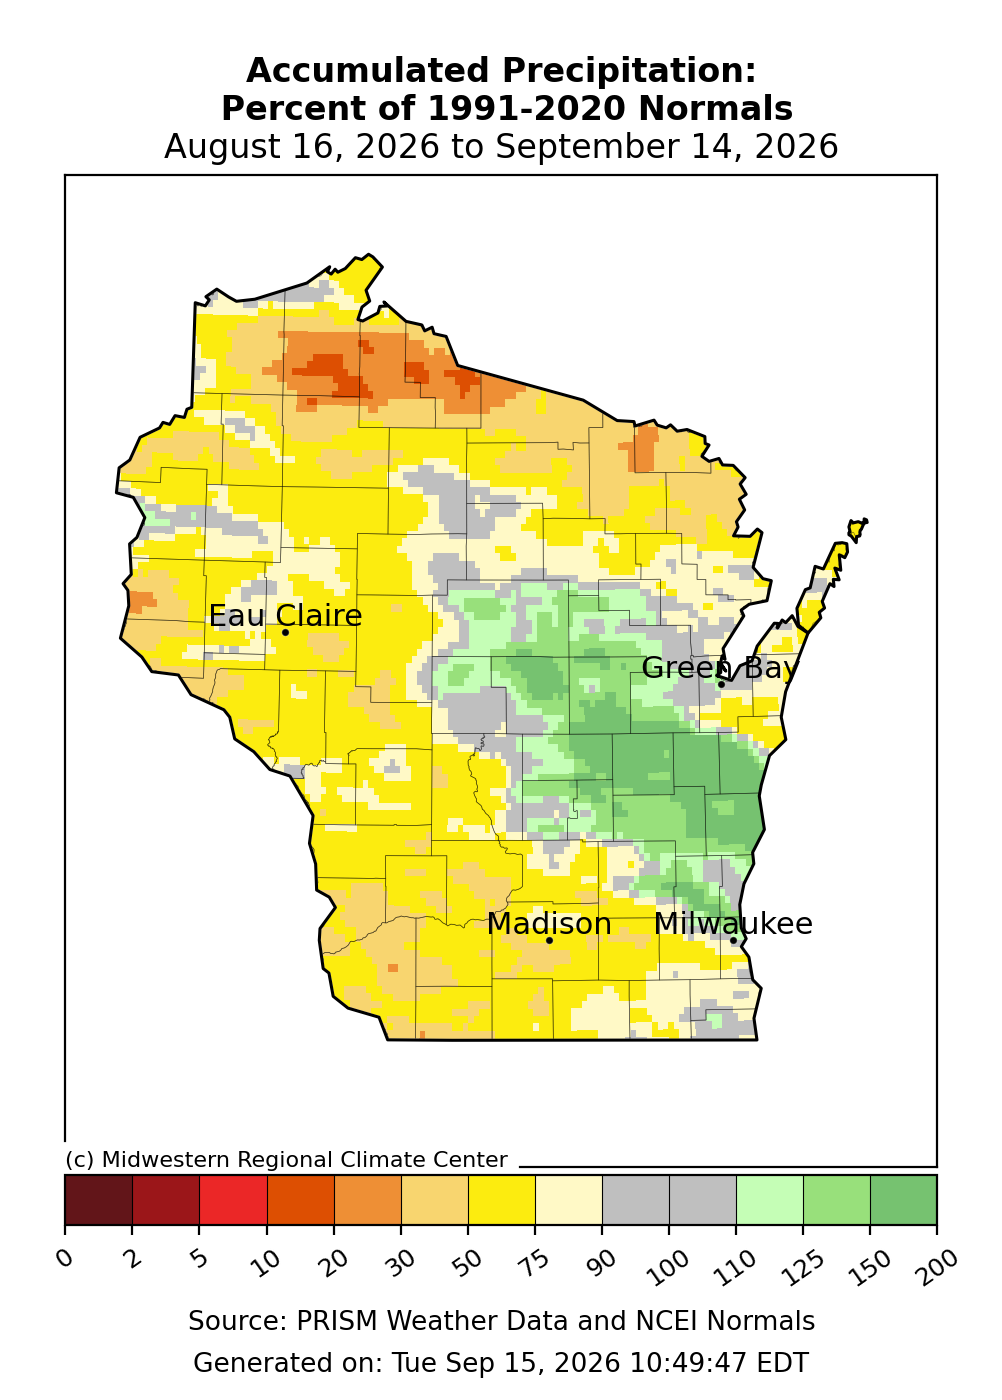
Image Description ↓
The map illustrates precipitation percentages across Wisconsin relative to 30-year climate normals. Most of central, western, and southern Wisconsin experienced below-normal precipitation, ranging between 50 percent and 90 percent (yellow and light yellow shades), with localized areas in northern Wisconsin receiving 20 percent to 50 percent of normal rainfall (orange). Portions of eastern and southeastern Wisconsin around Green Bay and Milwaukee received above-normal precipitation, reaching 110 percent to 150 percent (green shades). Major cities marked include Eau Claire, Green Bay, Madison, and Milwaukee. Data sourced from PRISM Weather Data and NCEI Normals by the Midwestern Regional Climate Center.
- Rainfall totals of 5-8” were common from Wausau down to Milwaukee. These totals were 110-200% of normal.
- Southwest and west-central counties commonly saw below-normal rainfall over the past 30 days. Totals ranged from 50-90% of normal, with pockets of ≤50%.
- Further north, totals were much less. Totals of ≤1.5” were common, which was ≤50% of normal. Some locations in the far north received totals that were ≤20% of normal.
90 Day Precipitation Total and Percent of Normals
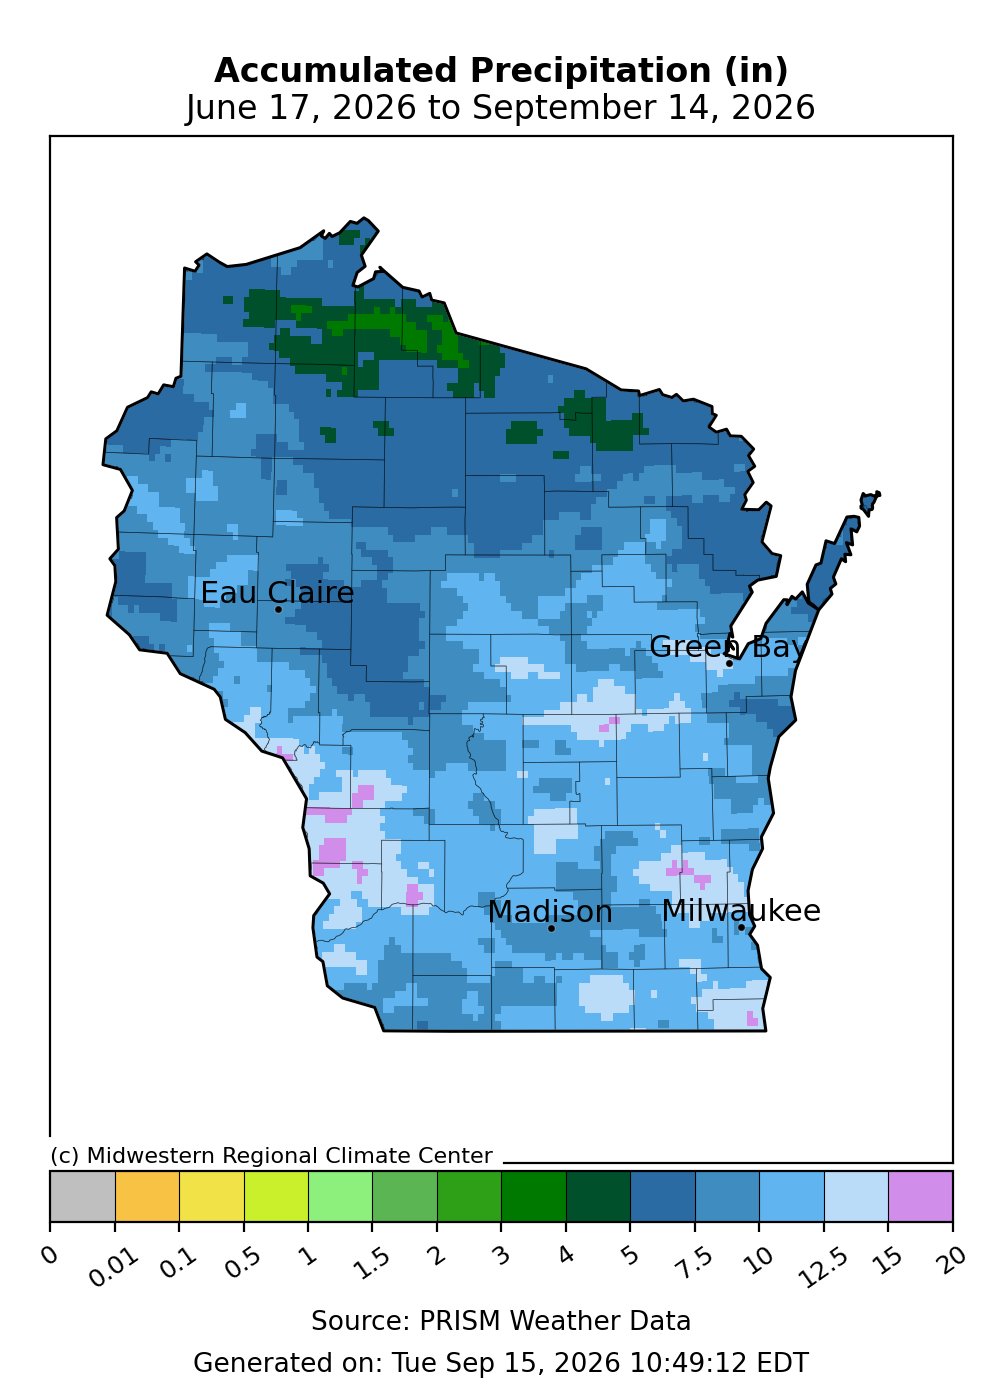
Image Description ↓
The map depicts overall accumulated precipitation in inches across Wisconsin during a 90-day summer window. Southern, central, and eastern regions logged between 7.5 and 12.5 inches of total rainfall (medium blue tones), with scattered southern areas reaching 12.5 to 15 inches (light blue/purple). Northern Wisconsin recorded lower overall totals between 2 and 5 inches (green shades). Major reference points include Eau Claire, Green Bay, Madison, and Milwaukee. Data sourced from PRISM Weather Data by the Midwestern Regional Climate Center.
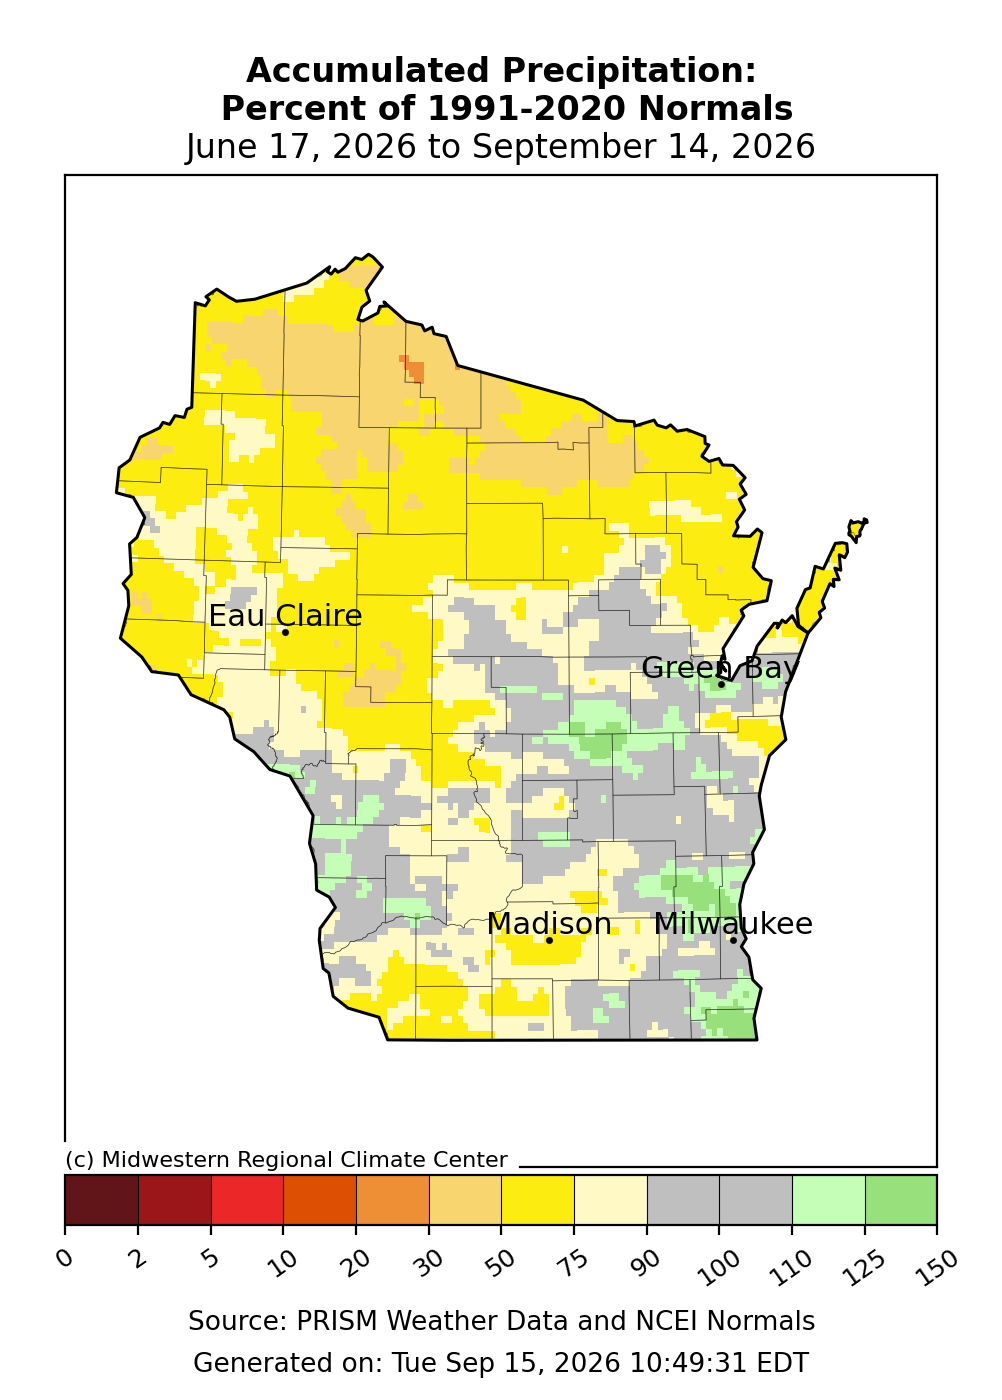
Image Description ↓
The map displays 90-day precipitation totals relative to 1991–2020 historical averages across Wisconsin. Central, western, and northern regions show below-normal precipitation ranging between 50 percent and 90 percent of normal (yellow and light yellow). Eastern, southern, and central-eastern regions mostly recorded near-normal precipitation levels between 90 percent and 110 percent (grey), with select pockets reaching 110 percent to 125 percent (light green). Cities marked include Eau Claire, Green Bay, Madison, and Milwaukee. Data sourced from PRISM Weather Data and NCEI Normals by the Midwestern Regional Climate Center.
- In the southern 2/3 of the state, totals ranged from 10-15” for most, with localized areas of 15-20”. Rainfall totals in this region were near to average (75-125%).
- Northern counties were the driest, with most locations receiving totals that were at or below 75% of normal.
2026 Precipitation
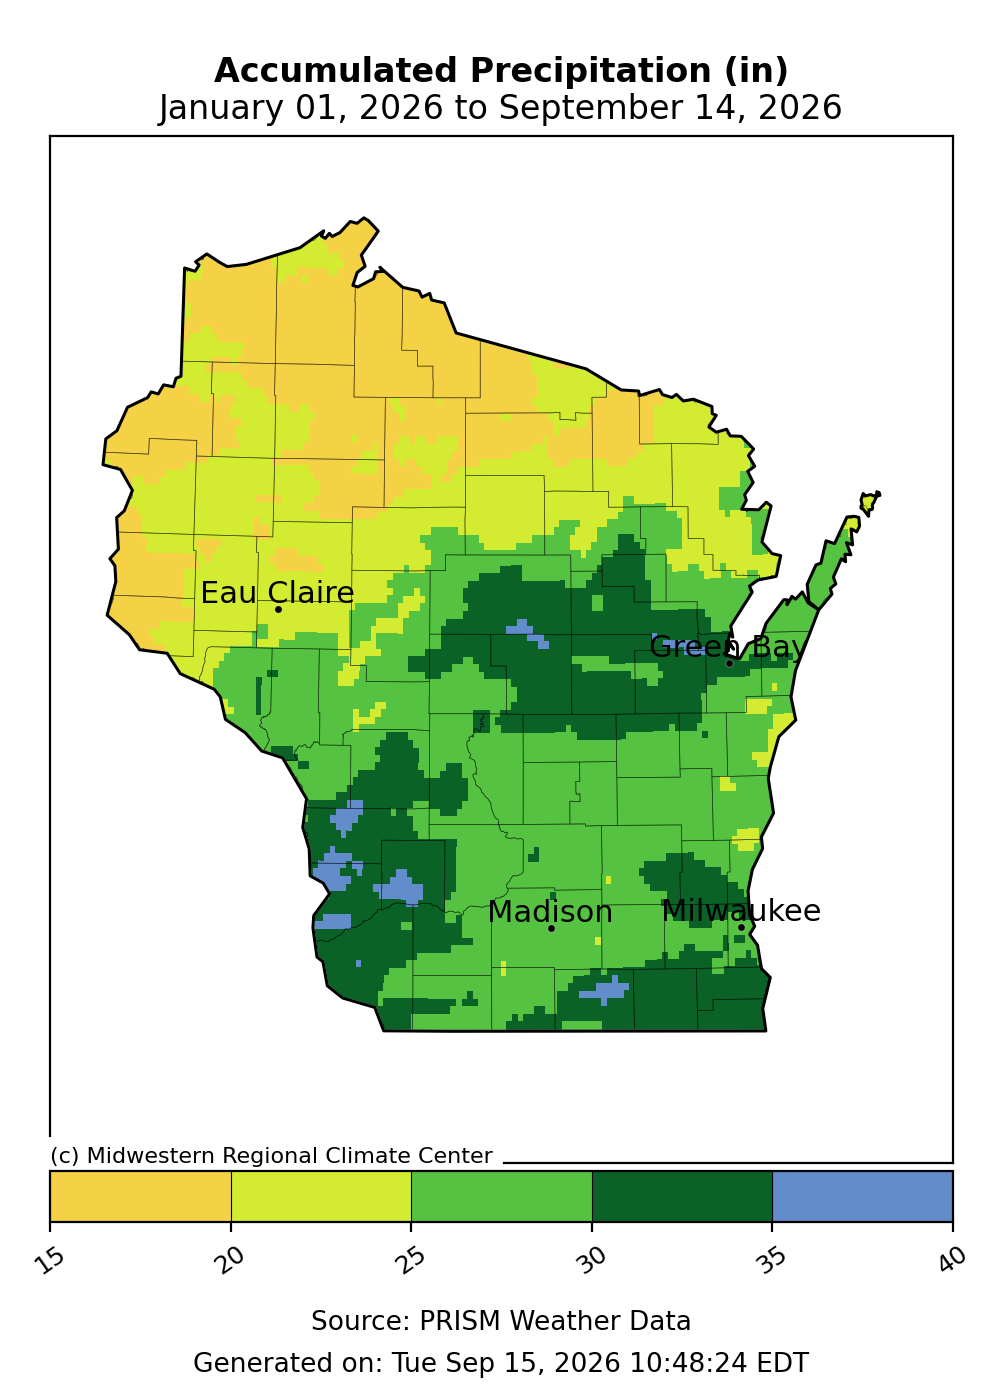
Image Description ↓
The map displays total year-to-date rainfall across Wisconsin. Northern counties recorded total precipitation between 15 and 25 inches (yellow to lime green). Central and southern regions recorded higher accumulation totals between 25 and 35 inches (dark green). Isolated areas in the south and west reached between 35 and 40 inches of total precipitation (blue). Cities marked on the map include Eau Claire, Green Bay, Madison, and Milwaukee. Data sourced from PRISM Weather Data by the Midwestern Regional Climate Center.
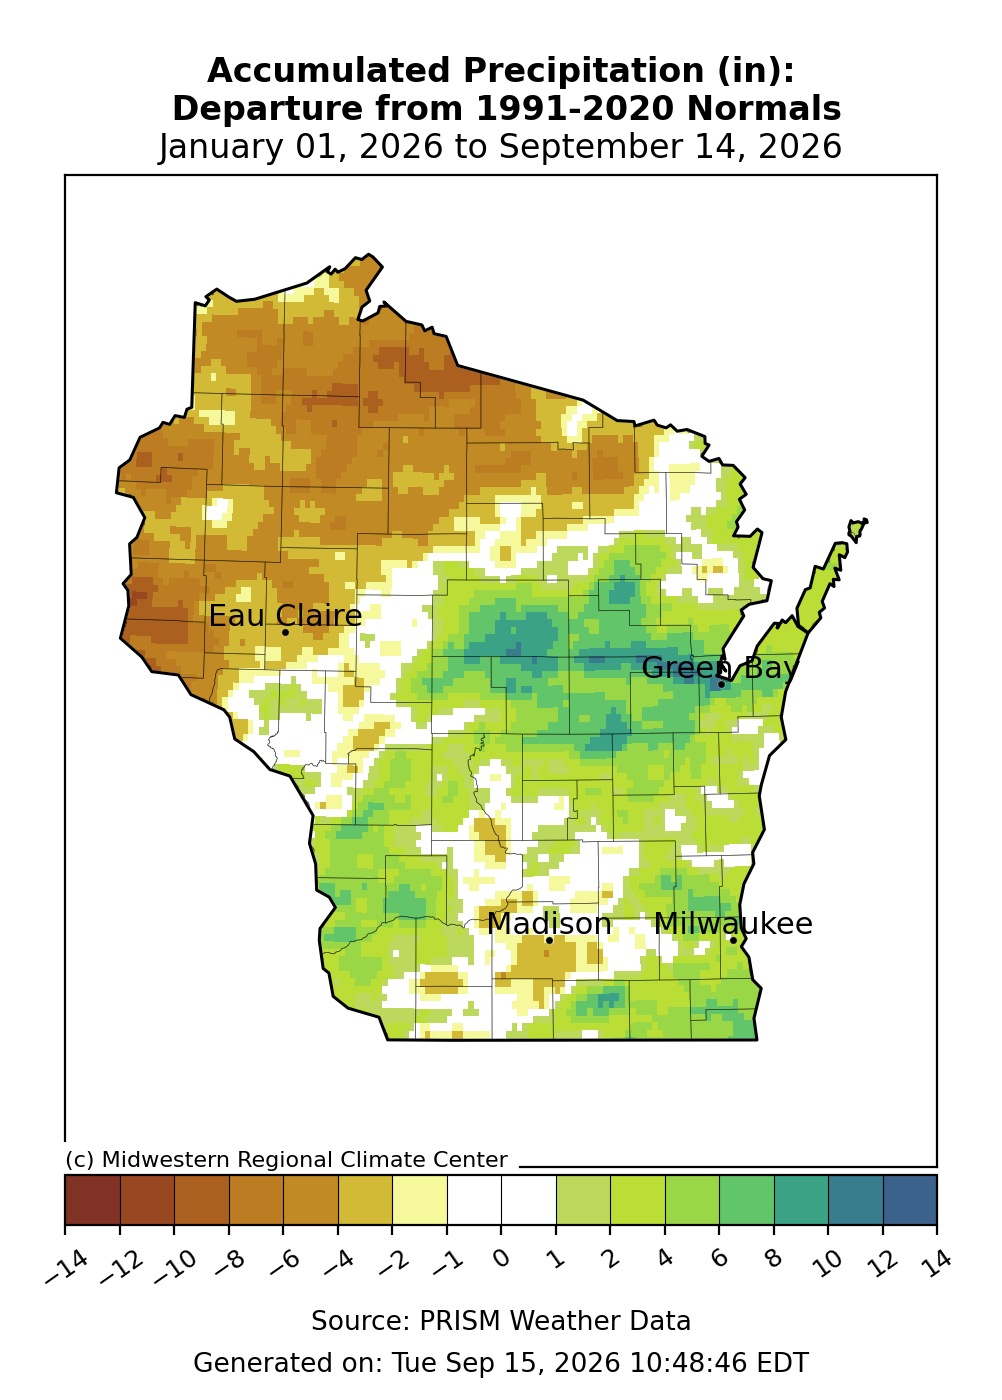
Image Description ↓
The map shows departure from normal precipitation in inches across Wisconsin for the year-to-date period. Northern and western areas experienced below-normal precipitation, ranging from 2 to 10 inches below normal (brown and tan shades). Central, eastern, and southern regions recorded above-normal precipitation, ranging from 1 to 8 inches above average (light green to dark green shades). Major reference cities labeled include Eau Claire, Green Bay, Madison, and Milwaukee. Data sourced from PRISM Weather Data by the Midwestern Regional Climate Center.
Soil Moisture and Temperature Trends
Soil Moisture Models
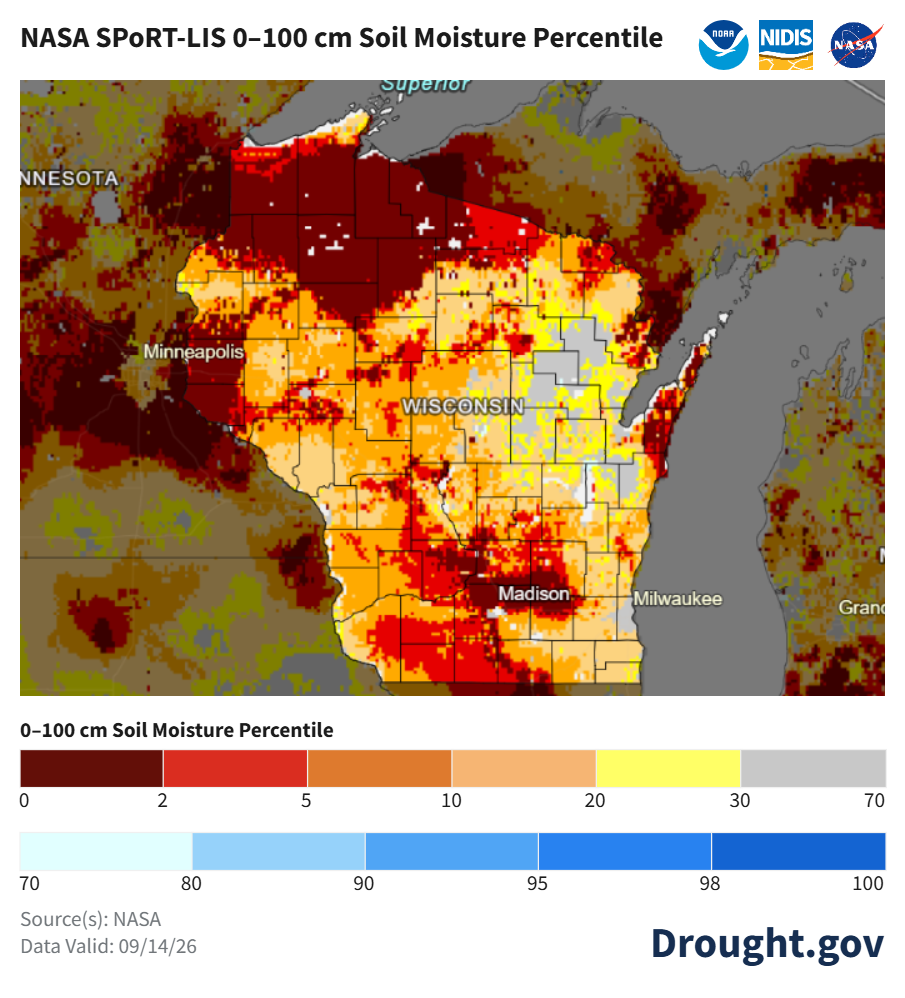
Image Description ↓
The map illustrates 0 to 100 centimeter soil moisture percentiles across Wisconsin. Extremely dry conditions persist across northern counties, with values remaining under the 2nd percentile (dark red). Central, western, and southern regions show dry conditions between the 2nd and 20th percentiles (red, orange, and light orange). Eastern and south-central counties near Milwaukee and Madison display near-normal levels between the 30th and 70th percentiles (grey). Logos for NOAA, NIDIS, and NASA are located at the top right, with source credit to NASA and Drought.gov.
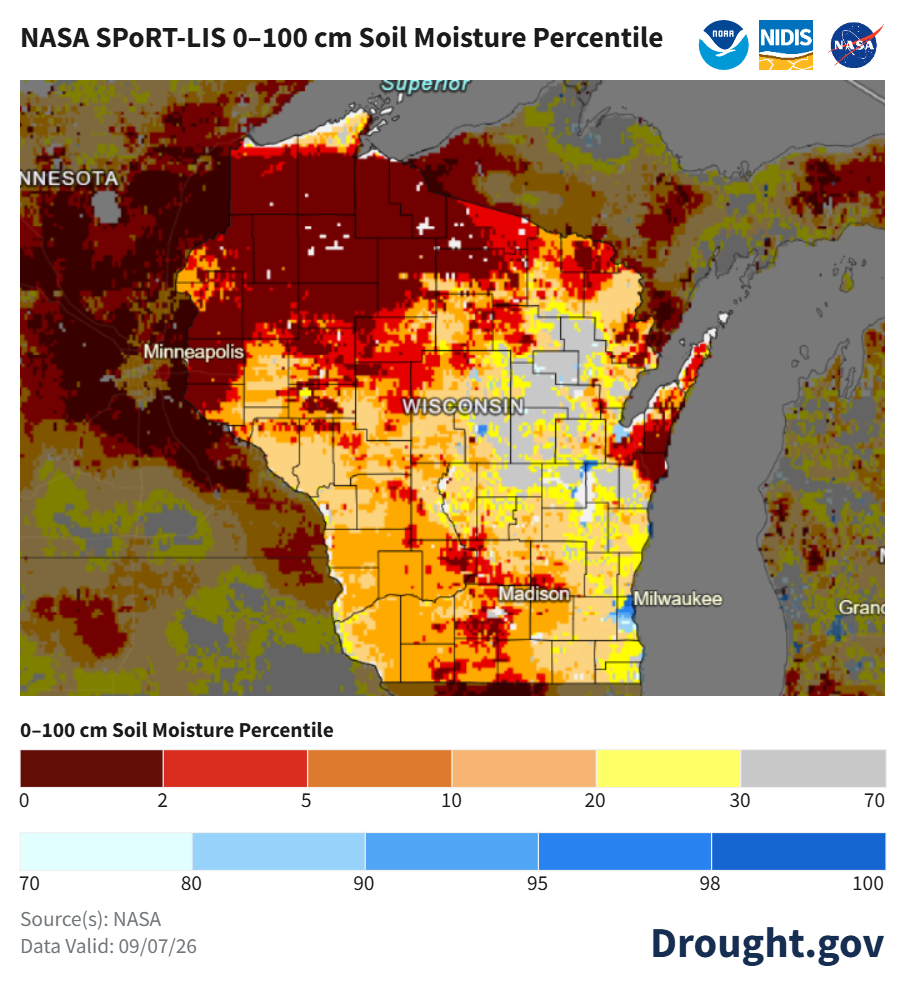
Image Description ↓
The map shows soil moisture percentiles across Wisconsin at a depth of 0 to 100 centimeters. Northern Wisconsin depicts severe dryness, with soil moisture percentiles falling below the 2nd to 5th percentile range (dark red and red shading). Central and western regions range mostly between the 5th and 30th percentiles (orange and yellow tones). Southeastern Wisconsin and areas around Madison show moderate to average moisture levels between the 30th and 70th percentiles (grey and white). Logos for NOAA, NIDIS, and NASA appear at the top right, with data attributed to NASA and Drought.gov.
- Satellite-based soil moisture estimates indicate similar conditions compared to last week’s report.
- Dryness has worsened across south-central counties, and some northeast and east-central counties are indicated as having near-normal soil moisture for mid-September.
- Notes on how to interpret the maps:
- Red areas = top 5 driest in 100 years.
- Dark red areas = top 2 driest in 100 years.
- Dark blue areas = top 2 wettest in 100 years.
Wisconet Soil Moisture
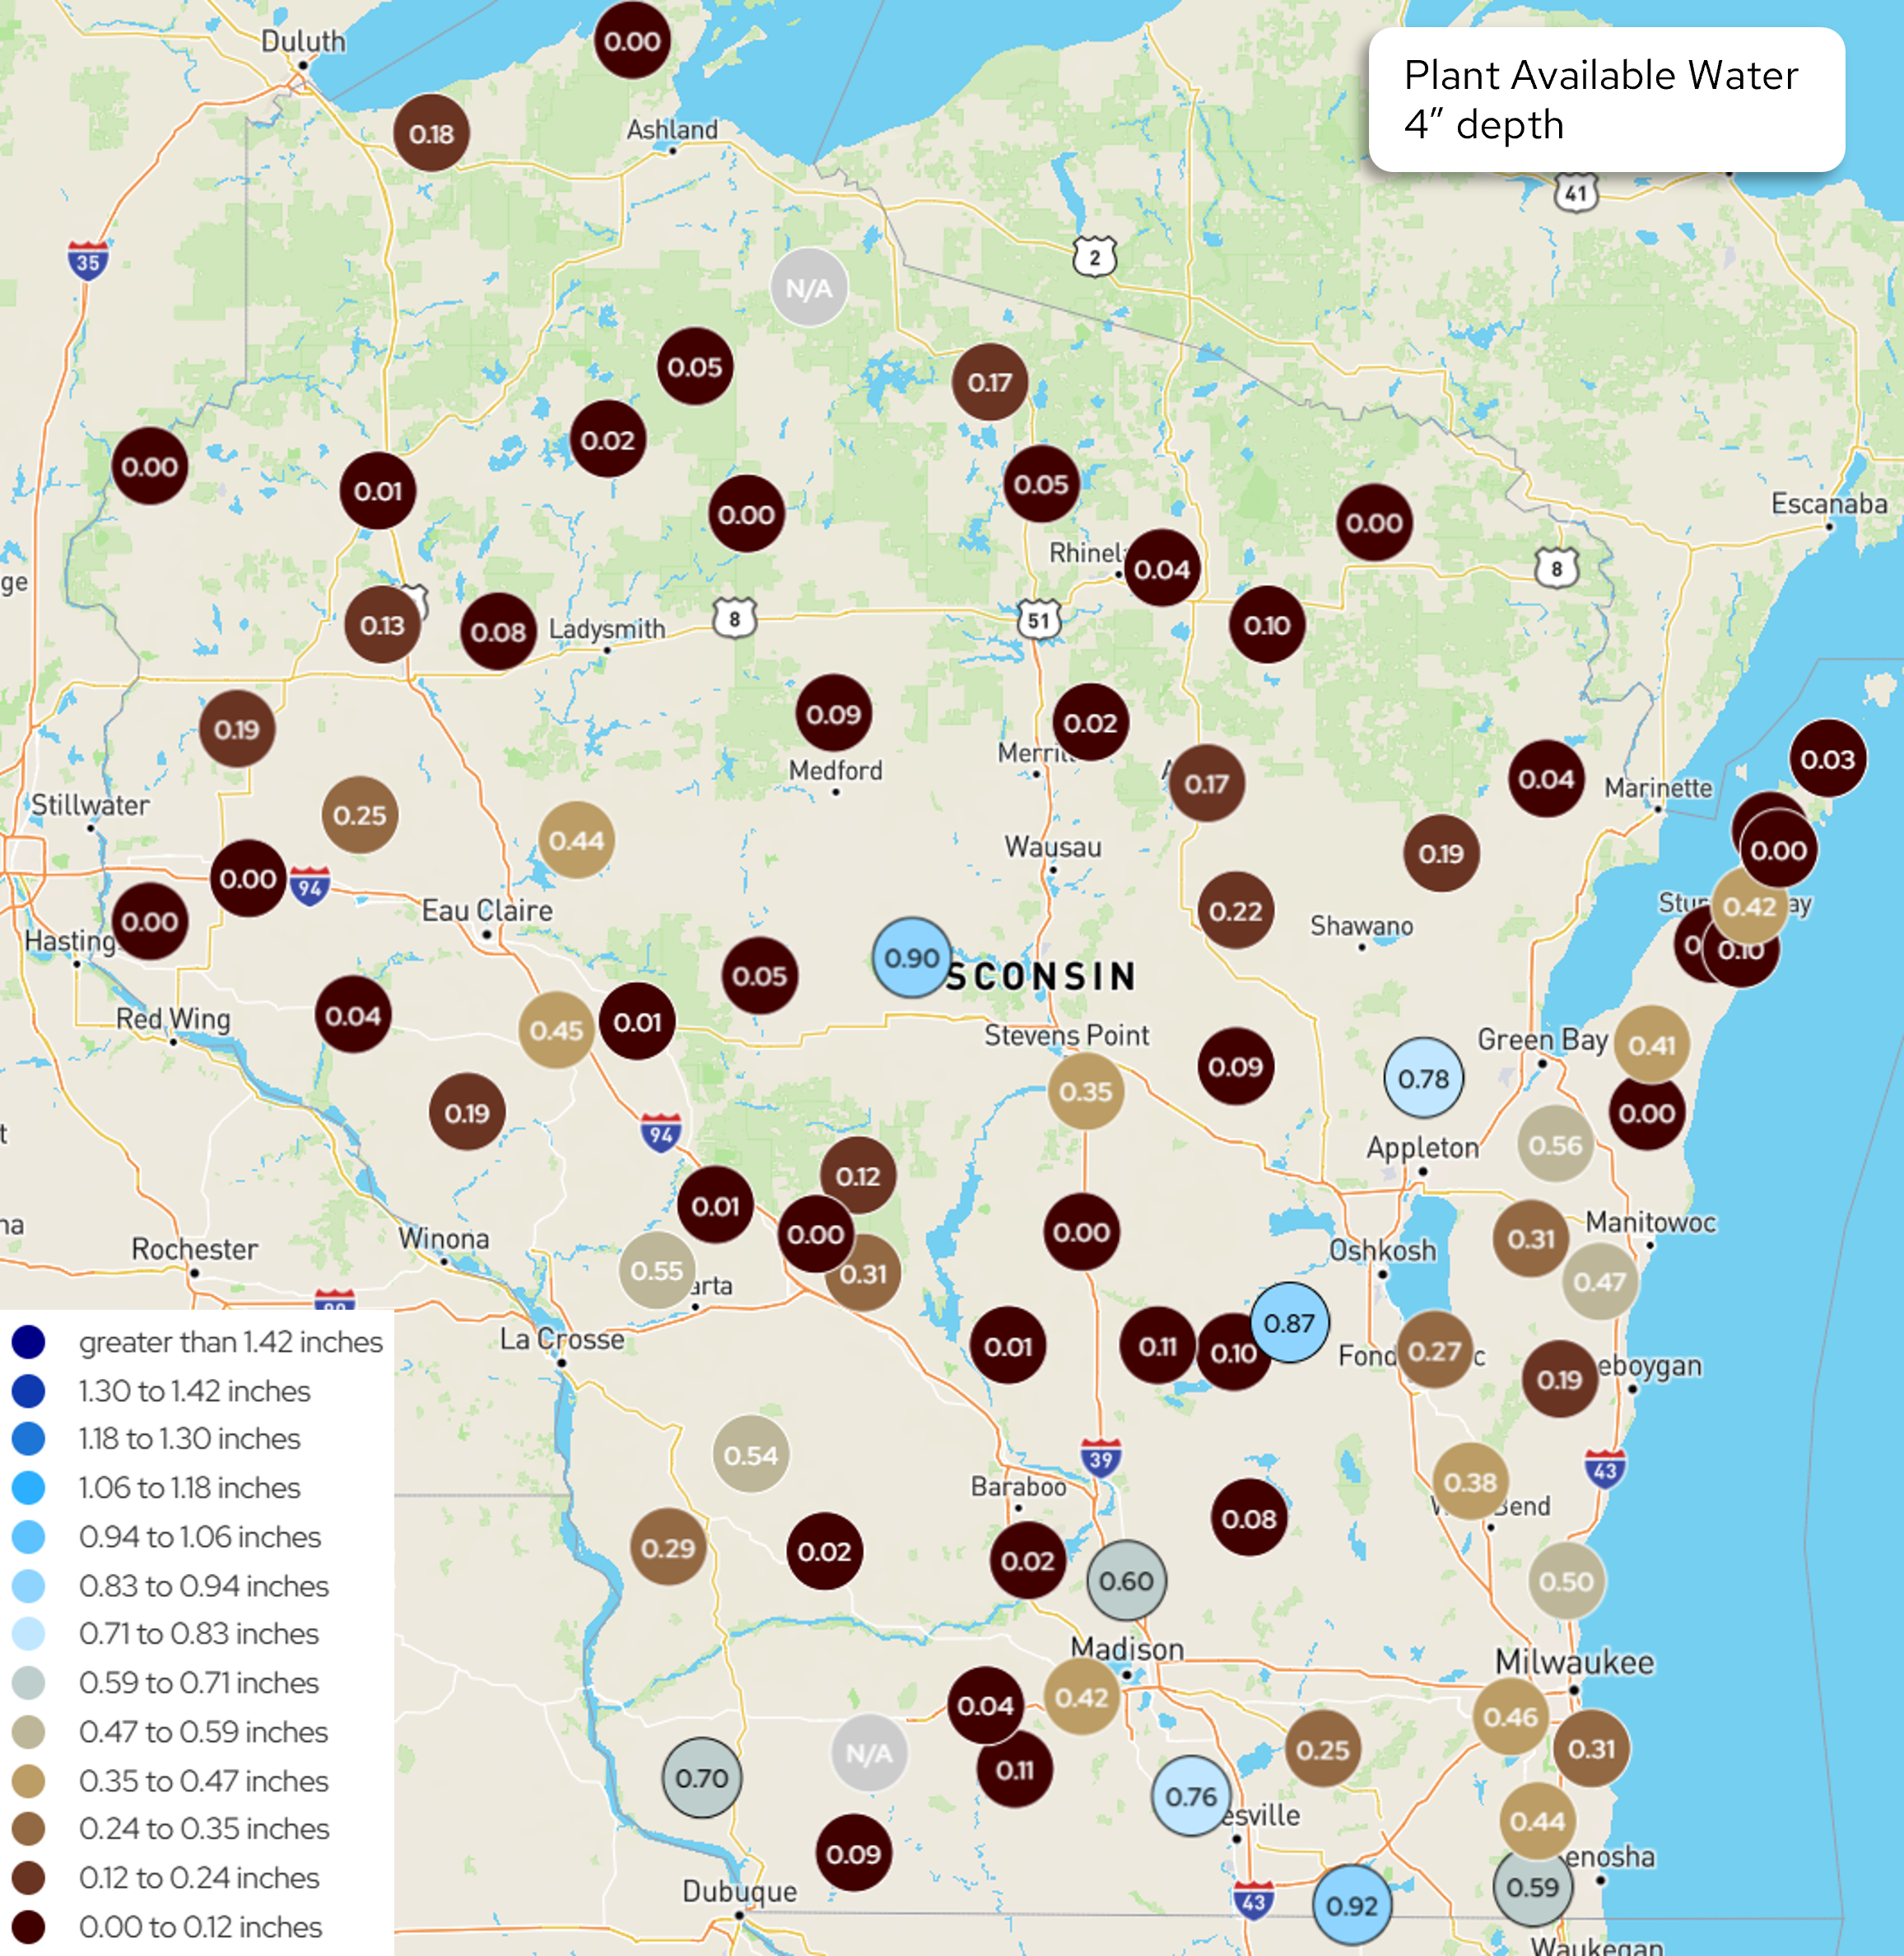
Image Description ↓
The map shows point measurements for plant available water at a 4-inch soil depth across Wisconet monitoring stations in Wisconsin. Most stations across northern, central, western, and southern Wisconsin display low moisture levels under 0.35 inches, represented by dark brown and medium brown circular markers. A few stations in central and eastern Wisconsin, near Stevens Point, Fond du Lac, and Janesville, show higher readings between 0.70 and 0.92 inches (blue markers). The legend categorizes values ranging from 0.00 inches up to greater than 1.42 inches.
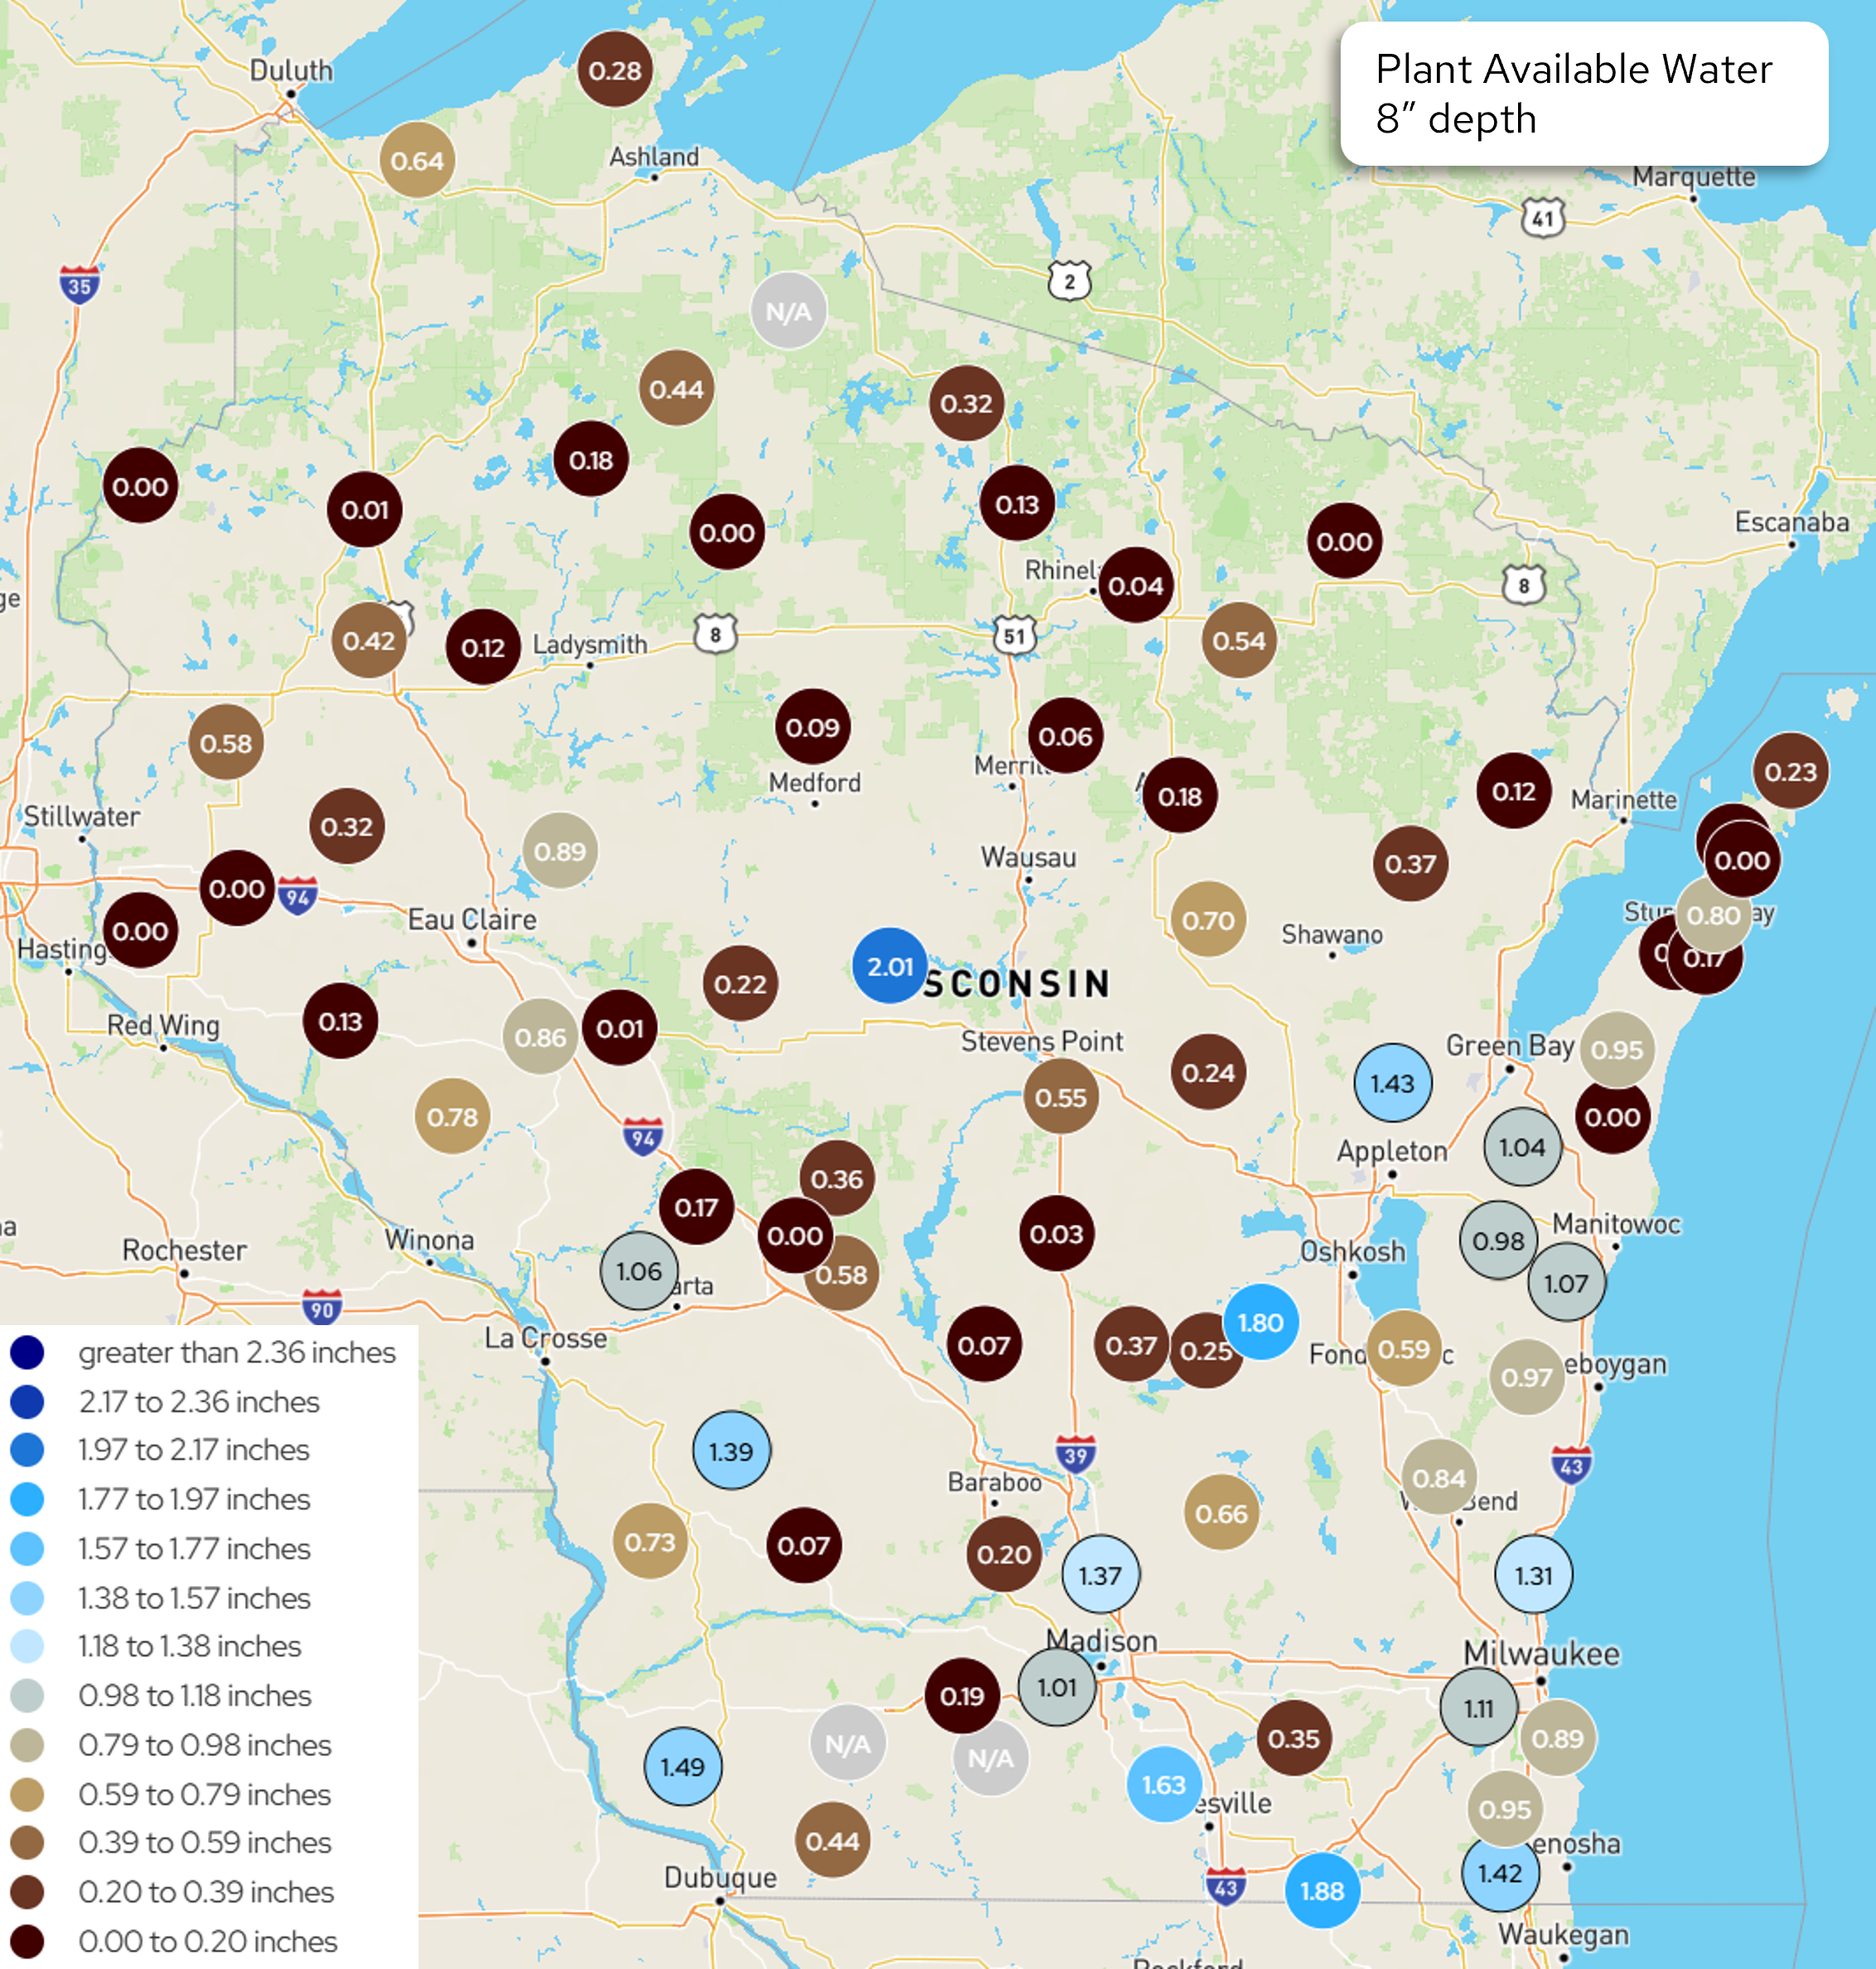
Image Description ↓
The map depicts station data for plant available water at an 8-inch soil depth across Wisconsin. Western, northern, and central stations largely record values between 0.00 and 0.58 inches (dark brown, medium brown, and light brown markers). Higher water levels between 1.01 and 2.01 inches (light blue to medium blue markers) are concentrated in south-central, eastern, and select central areas, including stations near Stevens Point, Madison, and Milwaukee. The legend outlines ranges from 0.00 to greater than 2.36 inches.
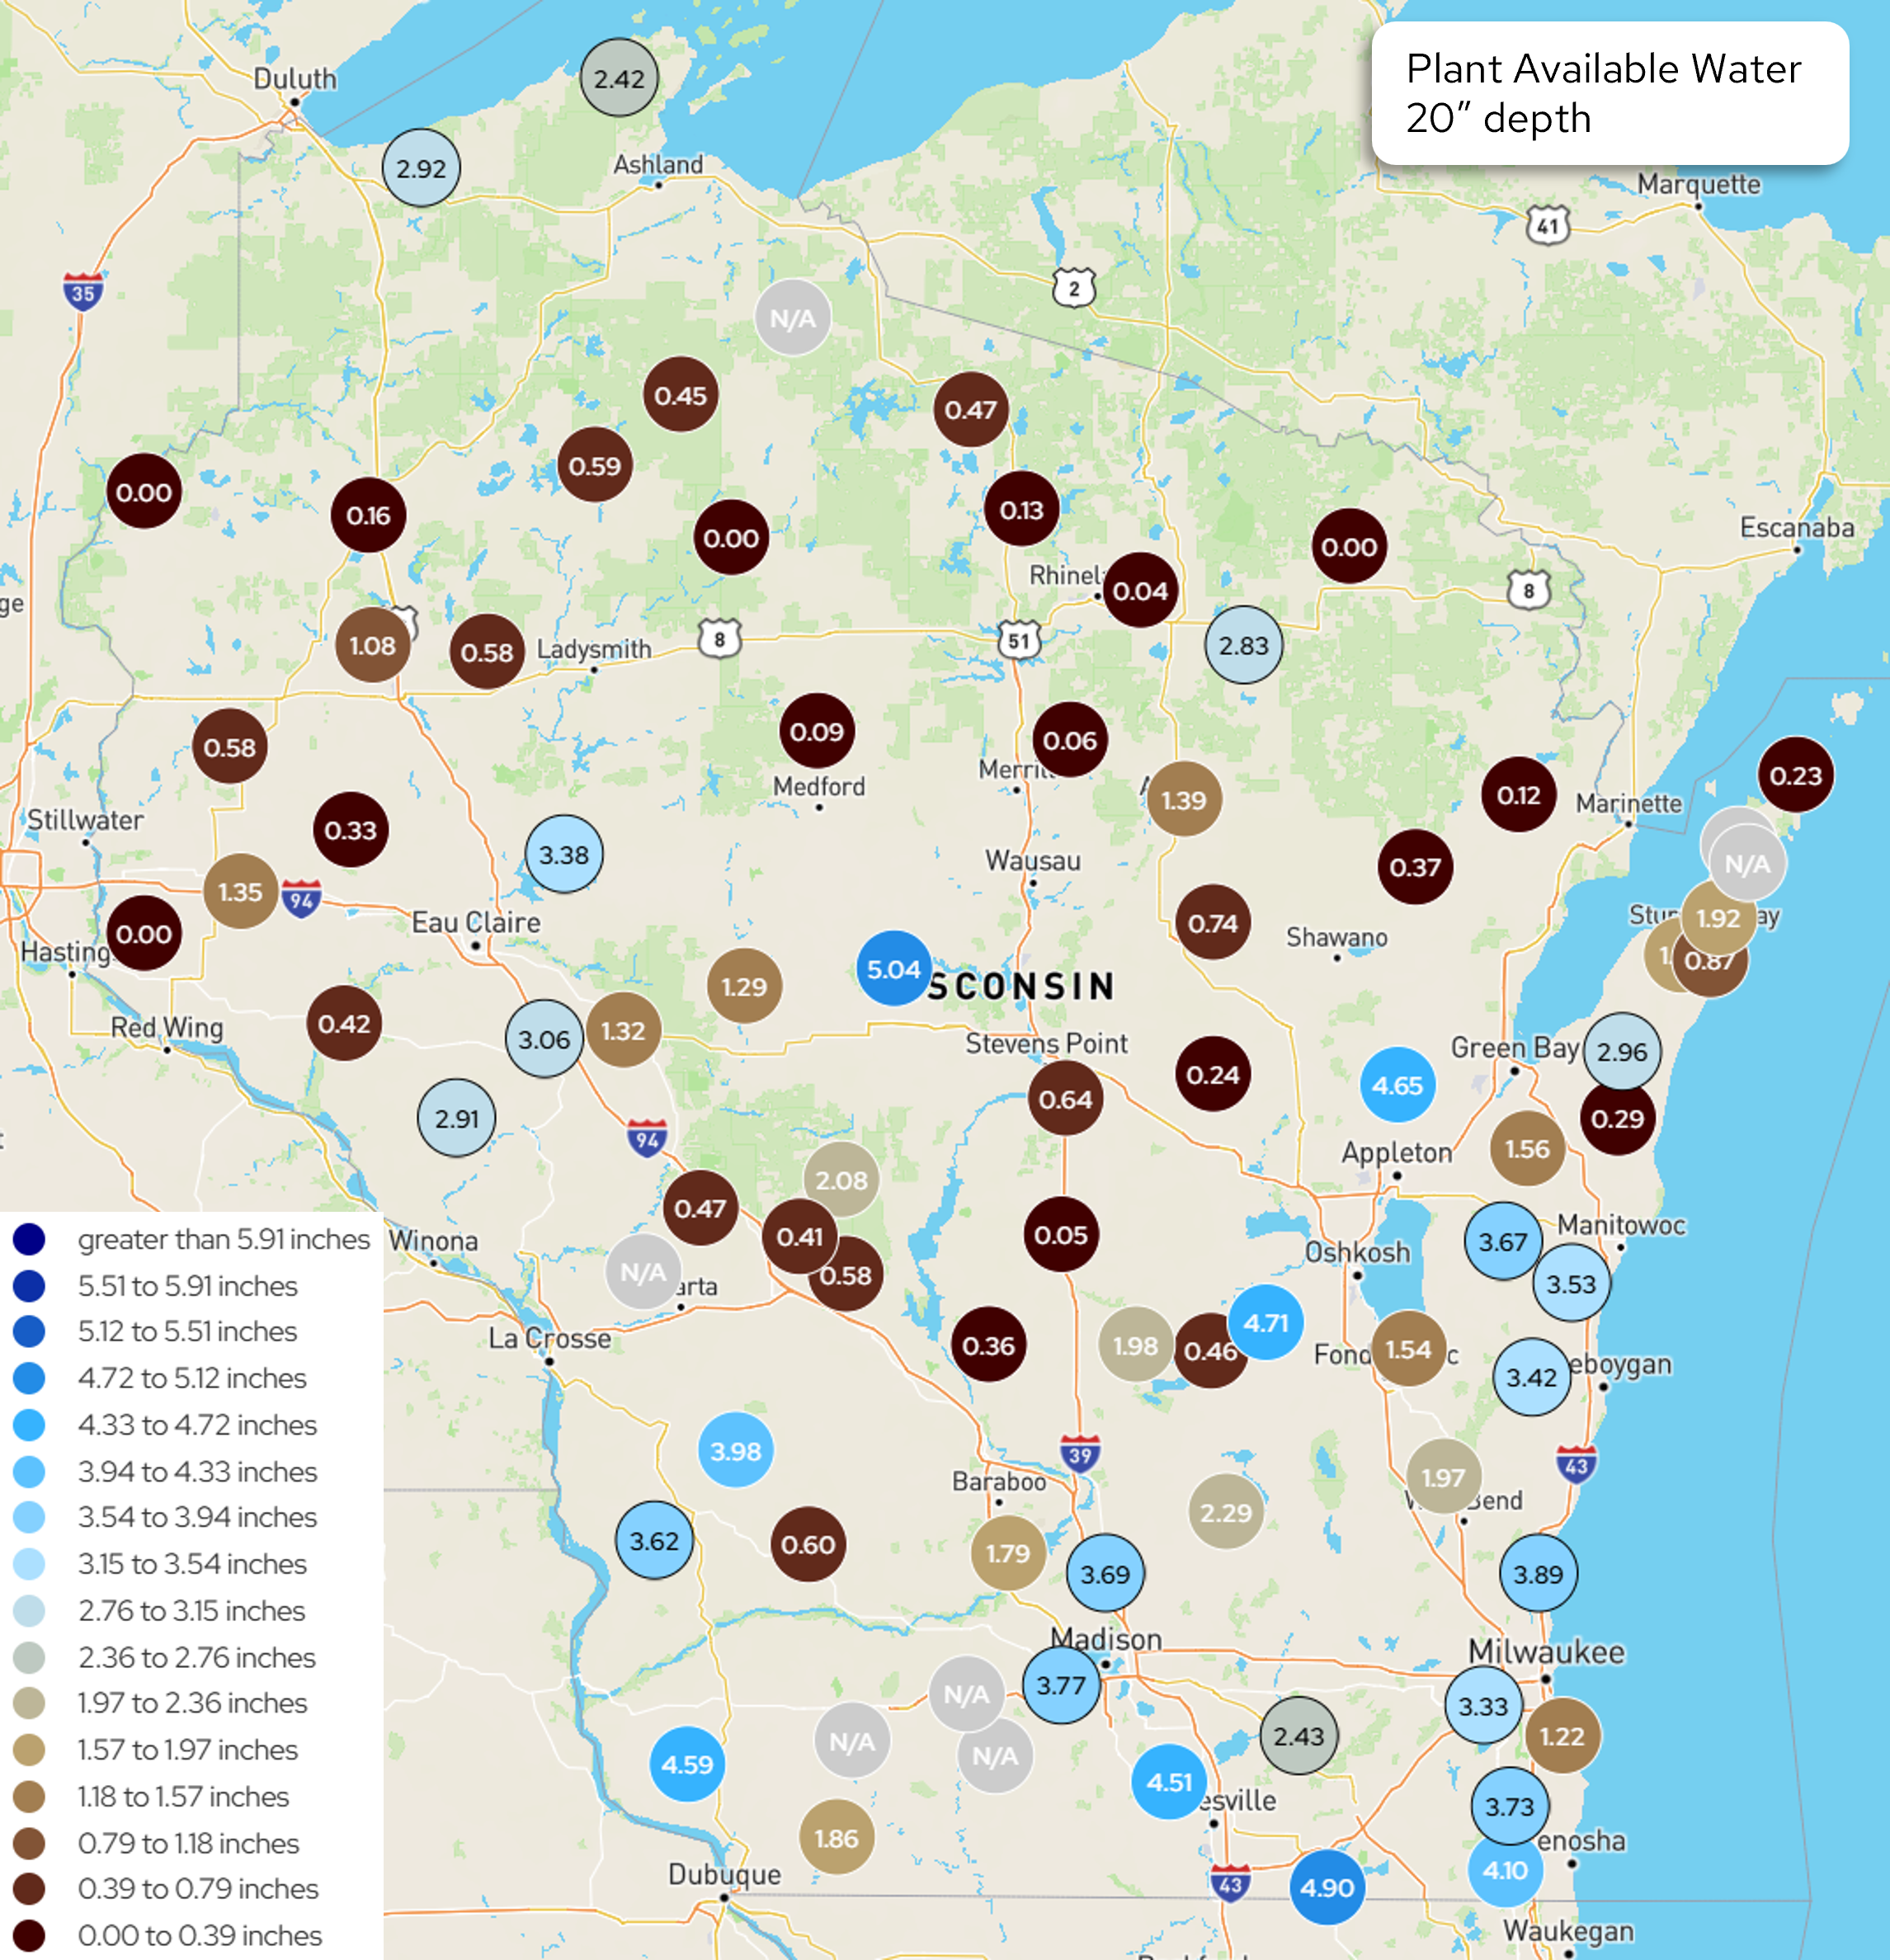
Image Description ↓
The map displays subsoil moisture readings for plant available water at a 20-inch depth across Wisconet stations. Northern counties exhibit lower readings ranging from 0.00 to 0.59 inches (dark brown markers). Higher plant available water measurements between 2.42 and 5.04 inches (blue and light blue markers) are recorded across central, southern, and eastern Wisconsin stations, including points near Stevens Point, Appleton, Green Bay, Madison, and Milwaukee. The legend scales values from 0.00 up to greater than 5.91 inches.
- For Wisconet stations included in the chart and table, most saw decreased soil moisture from last week’s report. The exception was Rice Lake, which received 1.6” of rain.
- Stations included in the chart and table that are currently in D1 drought are Hancock (Waushara), Marshfield (Marathon), and Osseo (Trempealeau).
- Stations included in the chart and table that are currently in D2 drought are River Falls (Pierce) and Rice Lake (Barron).
- The maps (above) show the daily average Wisconet plant available water (inches) on September 14th.
- The table (below) shows total precipitation and changes in plant available water from September 7th (Start) to September 14th (End).
- What is plant available water? To learn more, read this article from UW Extension Ag Water Quality on plant available water. There is also a webinar from UW Extension on soil water management that you can watch.
- Example: Imagine that you have 4 inches of soil in the bottom of a bucket. In that soil, there are 1.5 inches of plant available water. Therefore, if you removed the soil and left only the water available for plant roots to take up, you would have 1.5 inches of water in the bottom of the bucket.
- The wilting point is when plant available water is at 0 inches, and the plant can no longer access water at that depth in the soil.
| Wisconet Station | County | Total Precipitation (in.) | 4″ Start | 4″ End | 8″ Start | 8″ End | 20″ Start | 20″ End |
|---|---|---|---|---|---|---|---|---|
| Arlington | Columbia | 0.15 | 0.82 | 0.60 | 1.60 | 1.37 | 3.92 | 3.69 |
| Brillion | Calumet | 0.64 | 0.58 | 0.31 | 1.40 | 0.98 | 4.08 | 3.67 |
| Hancock | Waushara | 2.20 | 0.02 | 0.00 | 0.10 | 0.03 | 0.20 | 0.05 |
| Lancaster | Grant | 0.78 | 0.74 | 0.70 | 1.58 | 1.58 | 4.68 | 4.59 |
| Marshfield | Marathon | 1.93 | 1.02 | 0.90 | 2.13 | 2.01 | 5.16 | 5.04 |
| Osseo | Trempealeau | 1.09 | 0.64 | 0.45 | 1.08 | 0.86 | 3.40 | 3.06 |
| Porter | Rock | 0.16 | 0.96 | 0.76 | 1.92 | 1.63 | 4.80 | 4.51 |
| Rice Lake | Barron | 1.60 | 0.00 | 0.13 | 0.00 | 0.42 | 0.66 | 1.08 |
| River Falls | Pierce | 0.47 | 0.00 | 0.00 | 0.00 | 0.00 | 0.00 | 0.00 |
| Suring | Oconto | 0.87 | 0.45 | 0.19 | 0.76 | 0.37 | 0.76 | 0.37 |
| Walworth | Walworth | 0.54 | 0.97 | 0.92 | 1.94 | 1.88 | 4.95 | 4.90 |
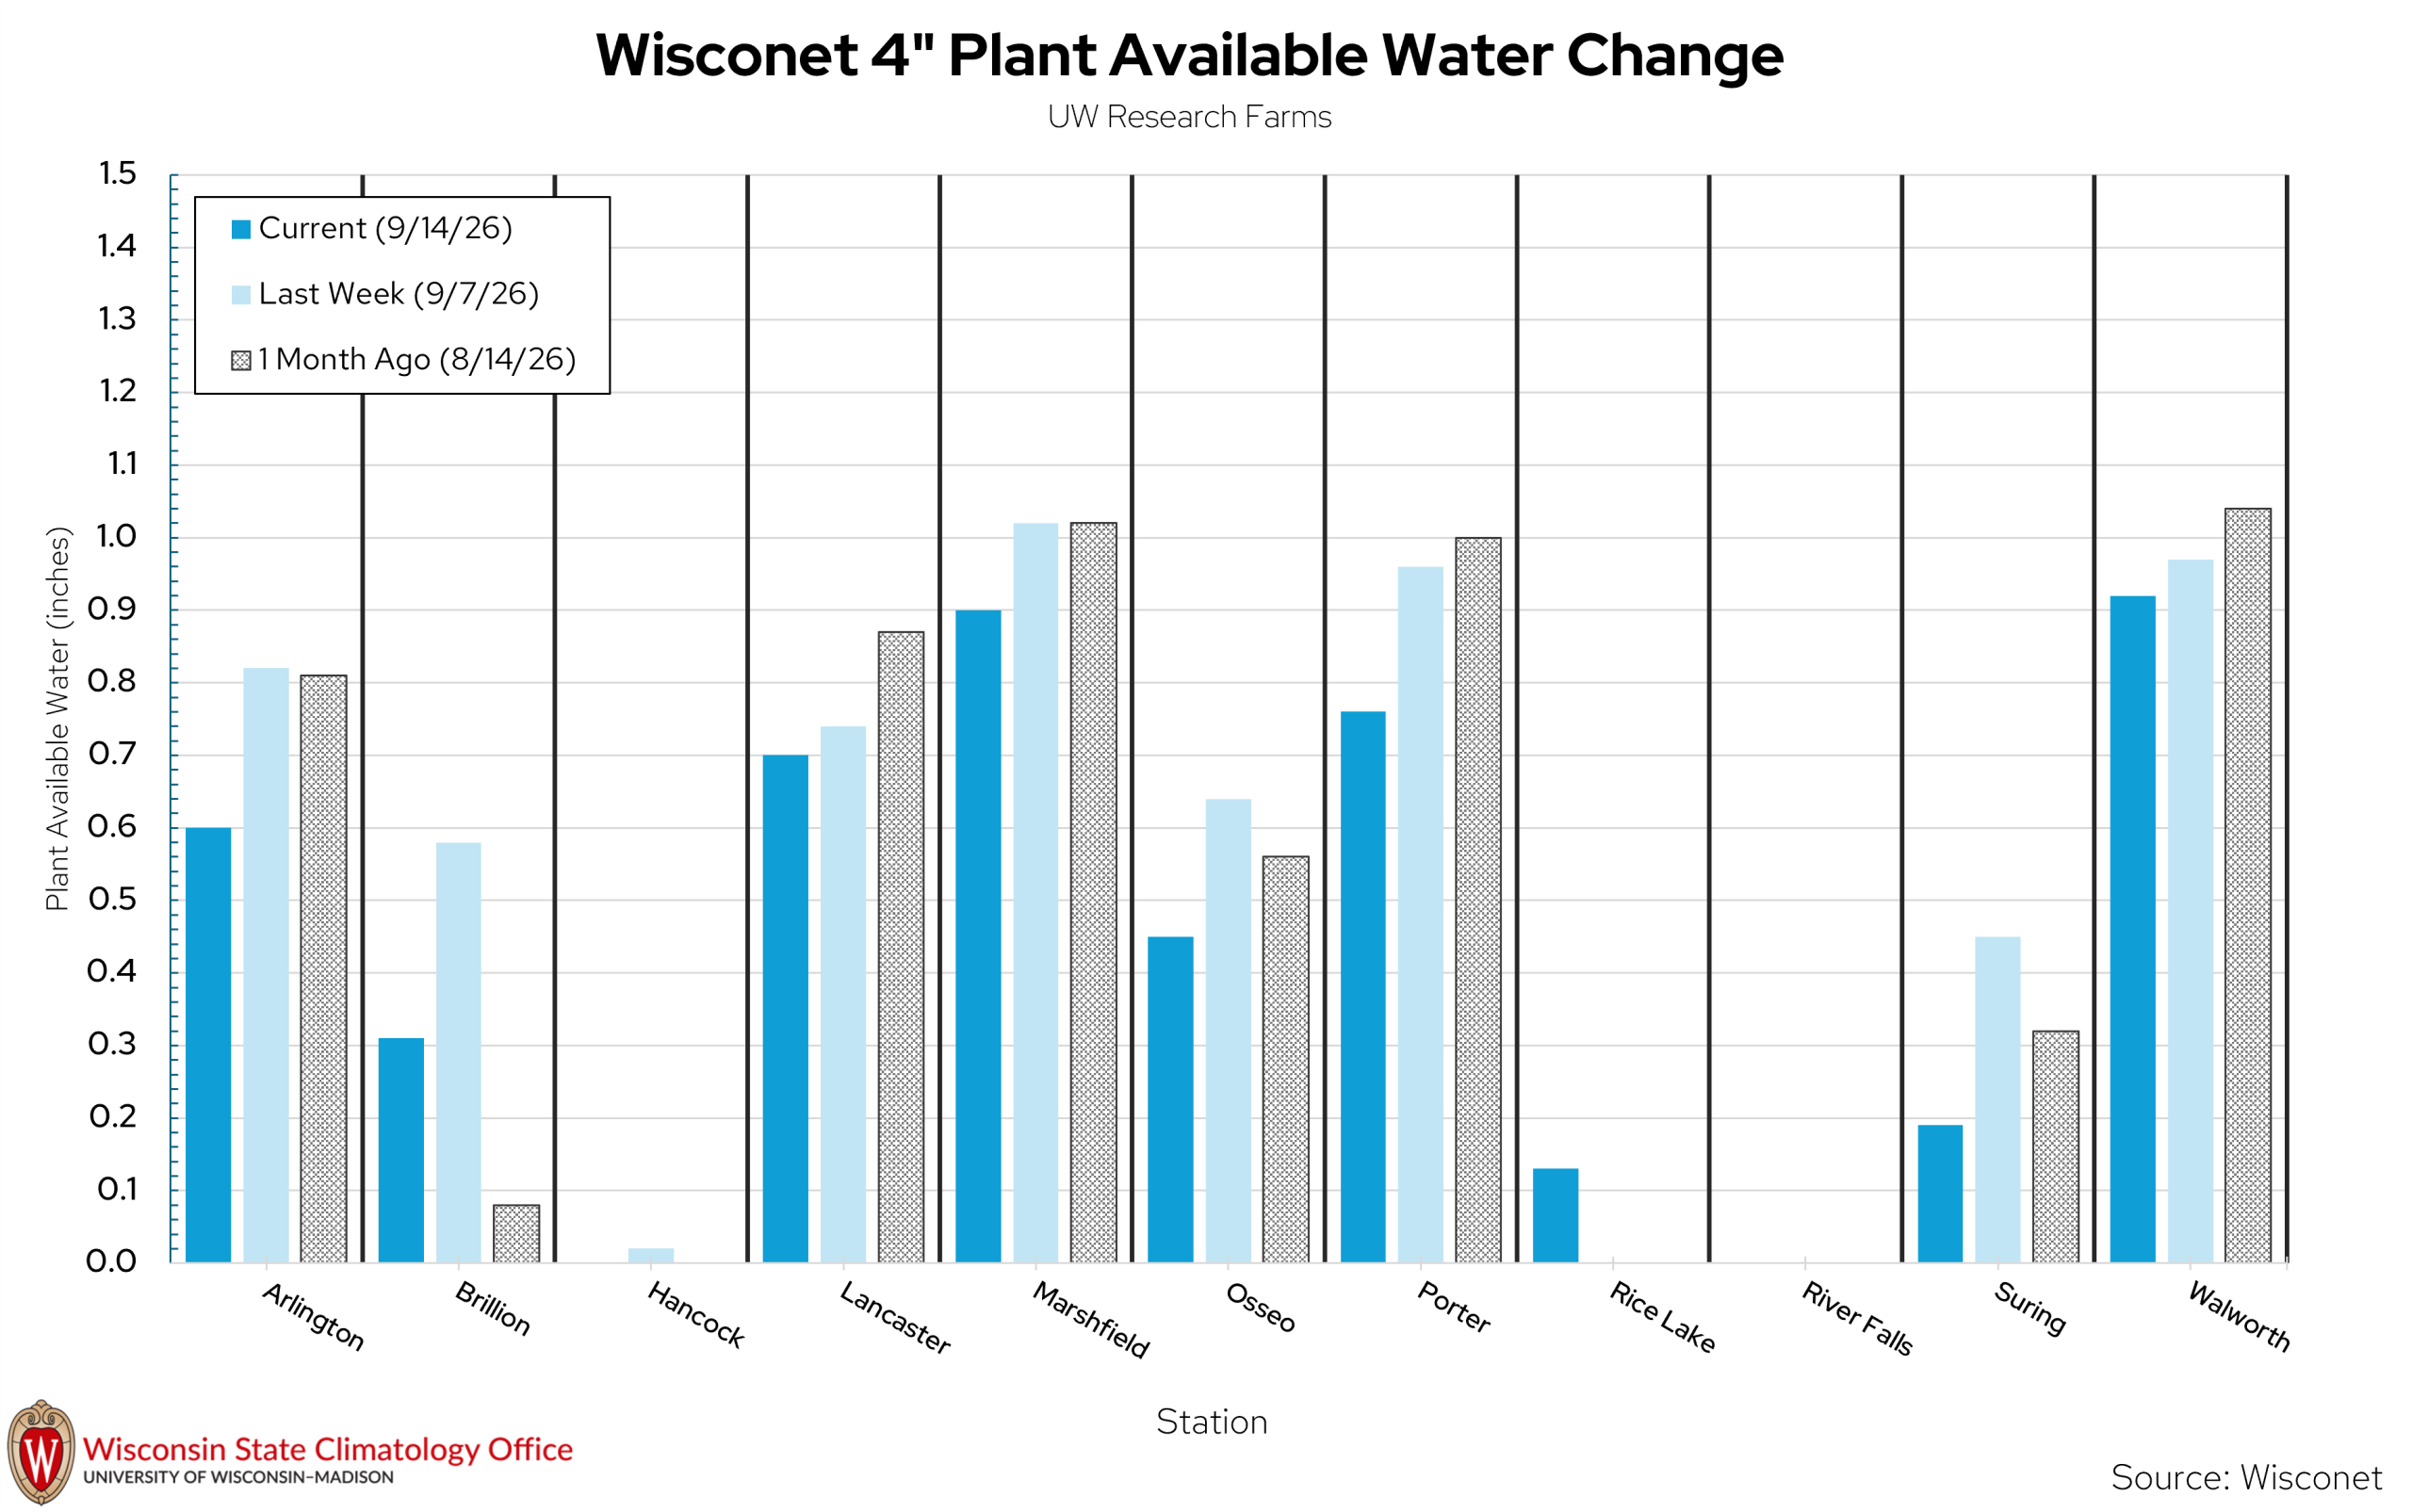
| Wisconet Station | Current 4″ Soil Moisture | Last Week’s 4″ Soil Moisture | 1 Month Ago 4″ Soil Moisture |
|---|---|---|---|
| Arlington | 0.60 | 0.82 | 0.81 |
| Brillion | 0.31 | 0.58 | 0.08 |
| Hancock | 0.00 | 0.02 | 0.00 |
| Lancaster | 0.70 | 0.74 | 0.87 |
| Marshfield | 0.90 | 1.02 | 1.02 |
| Osseo | 0.45 | 0.64 | 0.56 |
| Porter | 0.76 | 0.96 | 1.00 |
| Rice Lake | 0.13 | 0.00 | 0.00 |
| River Falls | 0.00 | 0.00 | 0.00 |
| Suring | 0.19 | 0.45 | 0.32 |
| Walworth | 0.92 | 0.97 | 1.04 |
USDA Soil Moisture Reports
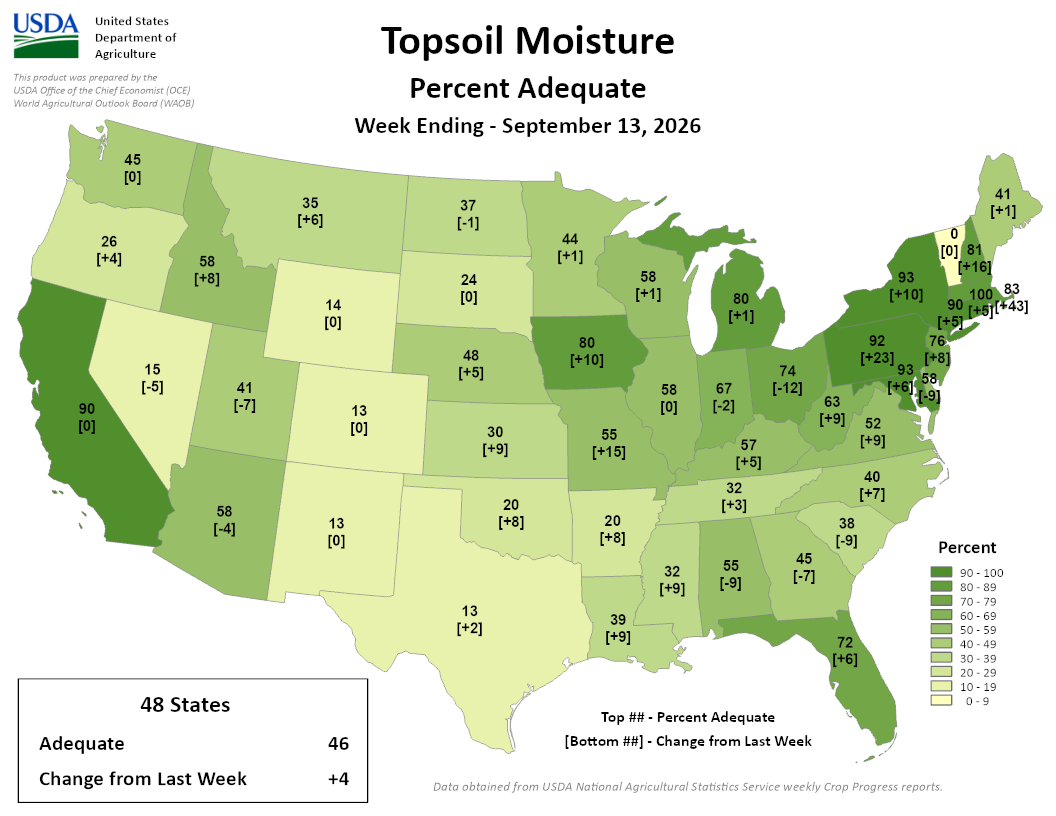
Image Description ↓
A USDA map displaying adequate topsoil moisture levels across the contiguous United States for the week ending September 13, 2026. Each state shows its top number as the percentage of topsoil moisture rated adequate and its bottom number in brackets as the change from the prior week. Percentages range from 13 percent in Colorado, New Mexico, and Texas to 100 percent in Rhode Island. Wisconsin shows 80 percent adequate (+1 change), Minnesota shows 58 percent adequate (+1 change), Iowa shows 80 percent adequate (+10 change), and Illinois shows 58 percent adequate (0 change). The 48-state total stands at 46 percent adequate, reflecting a +4 percent increase from the previous week.
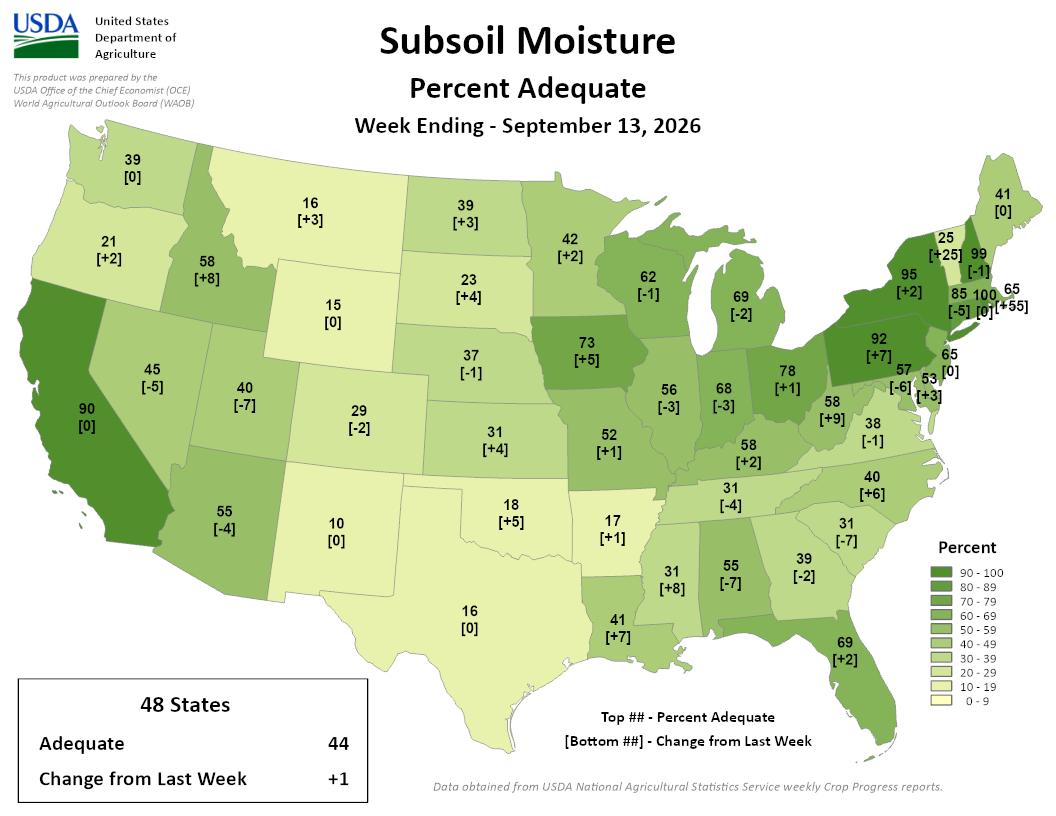
Image Description ↓
A USDA map showing adequate subsoil moisture levels across the contiguous United States for the week ending September 13, 2026. Each state displays its top number as the percentage of subsoil moisture rated adequate and the bottom number in brackets as the change from the previous week. Percentages range from 10 percent in New Mexico to 100 percent in Rhode Island. High adequate moisture levels above 90 percent are reported in California, New York, Pennsylvania, and Connecticut. Wisconsin shows 69 percent adequate (-2 change), Minnesota shows 62 percent adequate (-1 change), and Iowa shows 73 percent adequate (+5 change). Nationally, subsoil moisture is rated 44 percent adequate, representing a +1 percent change from the previous week.
- 58% and 62% of agricultural soils in the state are reported as having adequate topsoil and subsoil moisture.
- 41% and 37% of agricultural soils in the state are reported as having short to very short topsoil and subsoil moisture, respectively.
Wisconet Soil Temperature
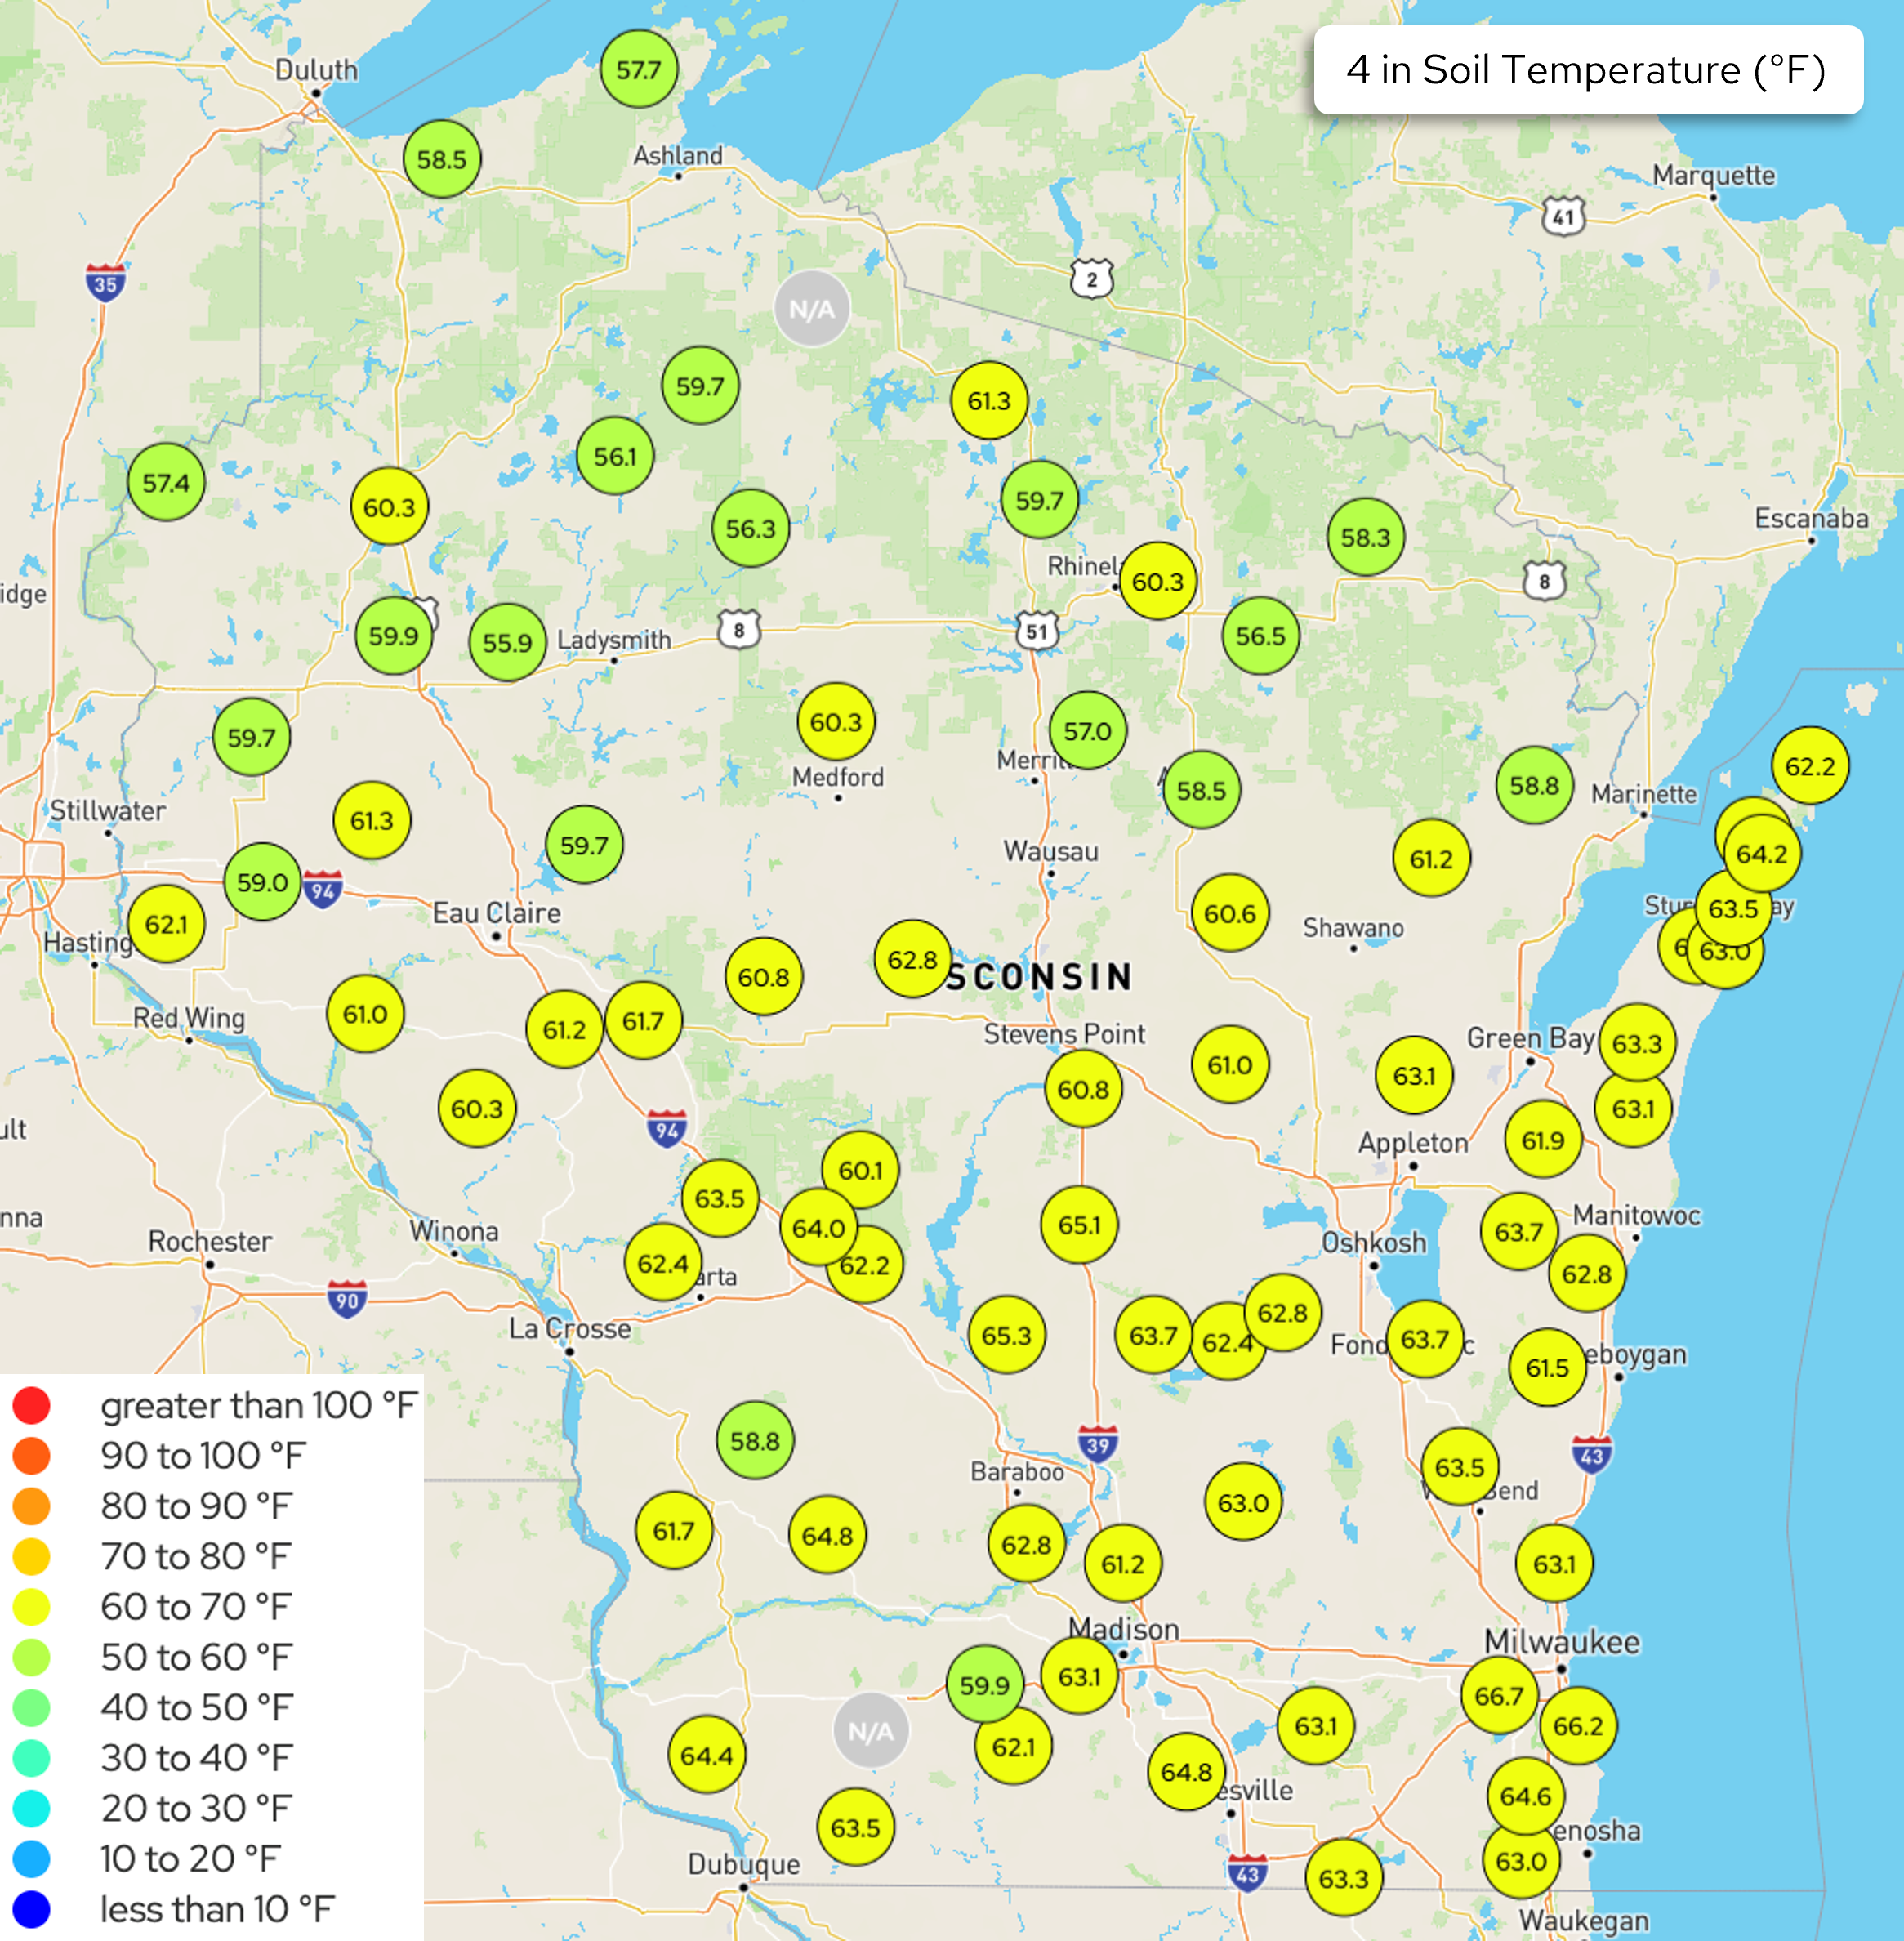
Image Description ↓
The map shows 4-inch soil temperature readings across Wisconet stations in Wisconsin. Nearly all reporting stations across the state display temperatures falling within the 60 to 70 degrees Fahrenheit range, indicated by bright yellow-green markers. Numerical values range from 55.9 degrees Fahrenheit in northern areas to 66.7 degrees Fahrenheit in southeastern areas near Milwaukee. The color key lists temperature categories from less than 10 degrees Fahrenheit to greater than 100 degrees Fahrenheit.
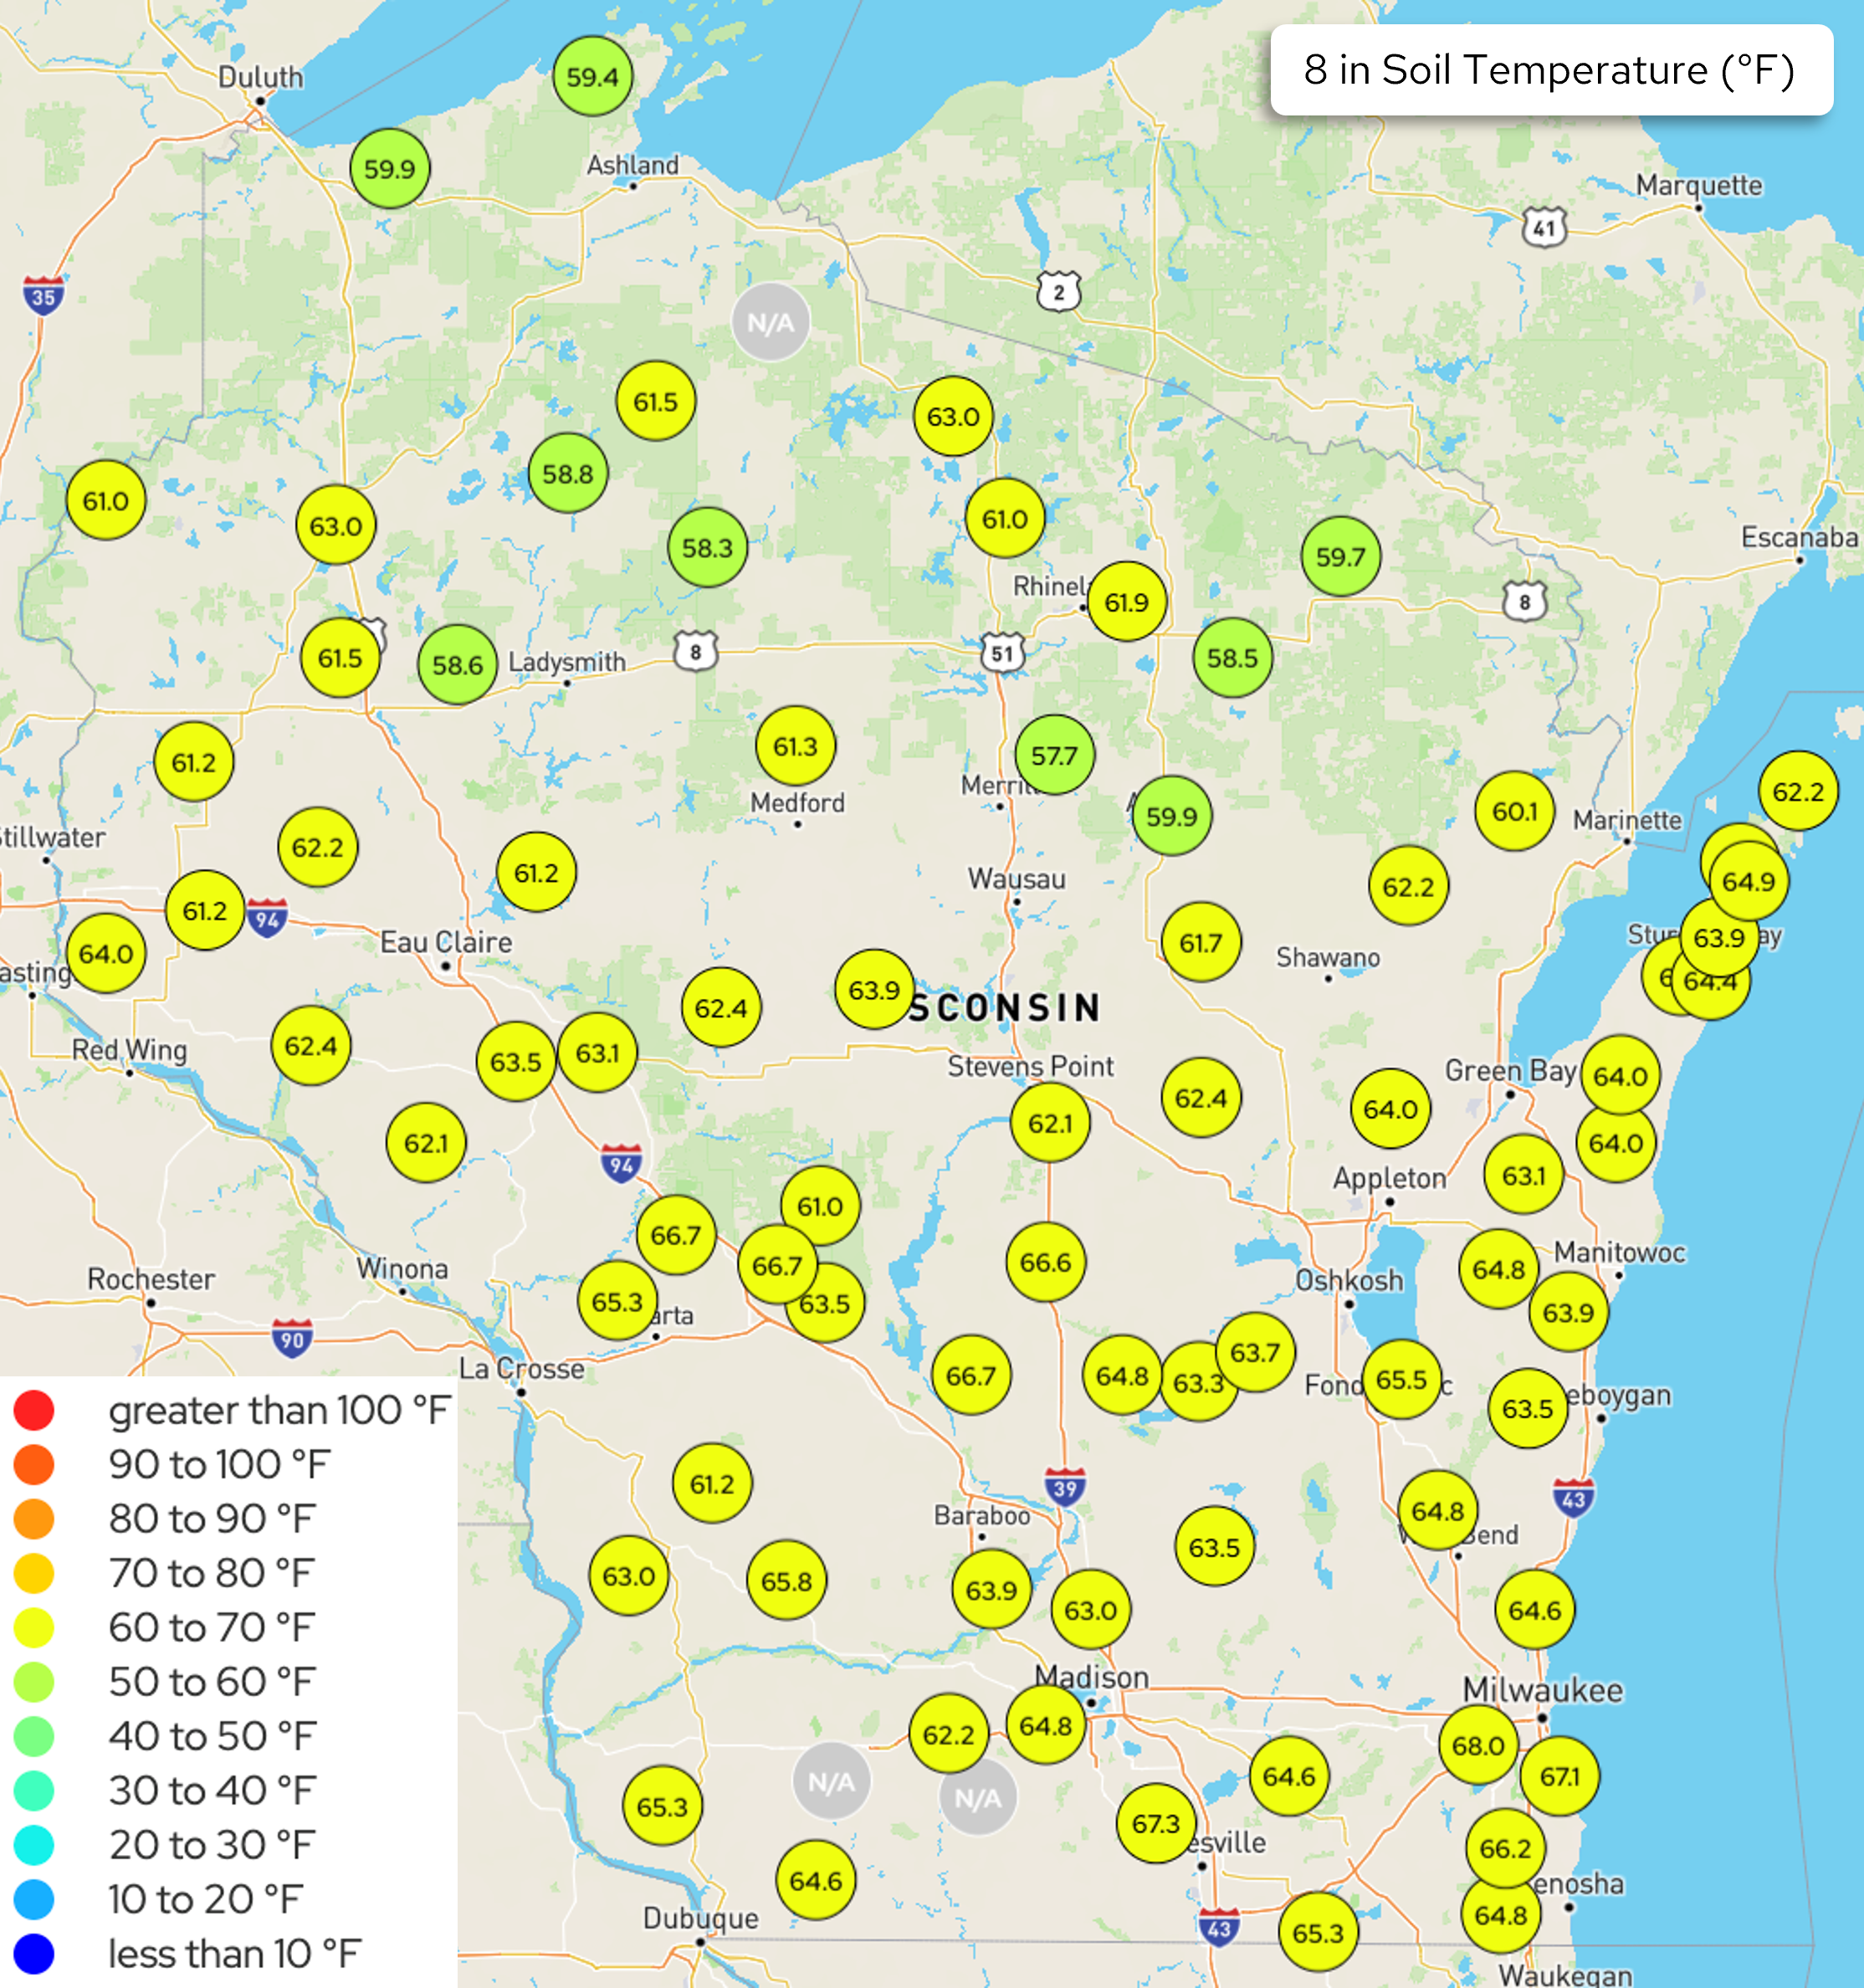
Image Description ↓
The map illustrates station measurements for soil temperature at an 8-inch depth across Wisconsin. All active stations record temperatures within the 50 to 70 degrees Fahrenheit range, represented by lime green and yellow-green circular markers. Values range from 57.7 degrees Fahrenheit in northern regions to 68.0 degrees Fahrenheit in the southeastern corner near Milwaukee. The legend provides reference categories ranging from under 10 degrees Fahrenheit to over 100 degrees Fahrenheit.
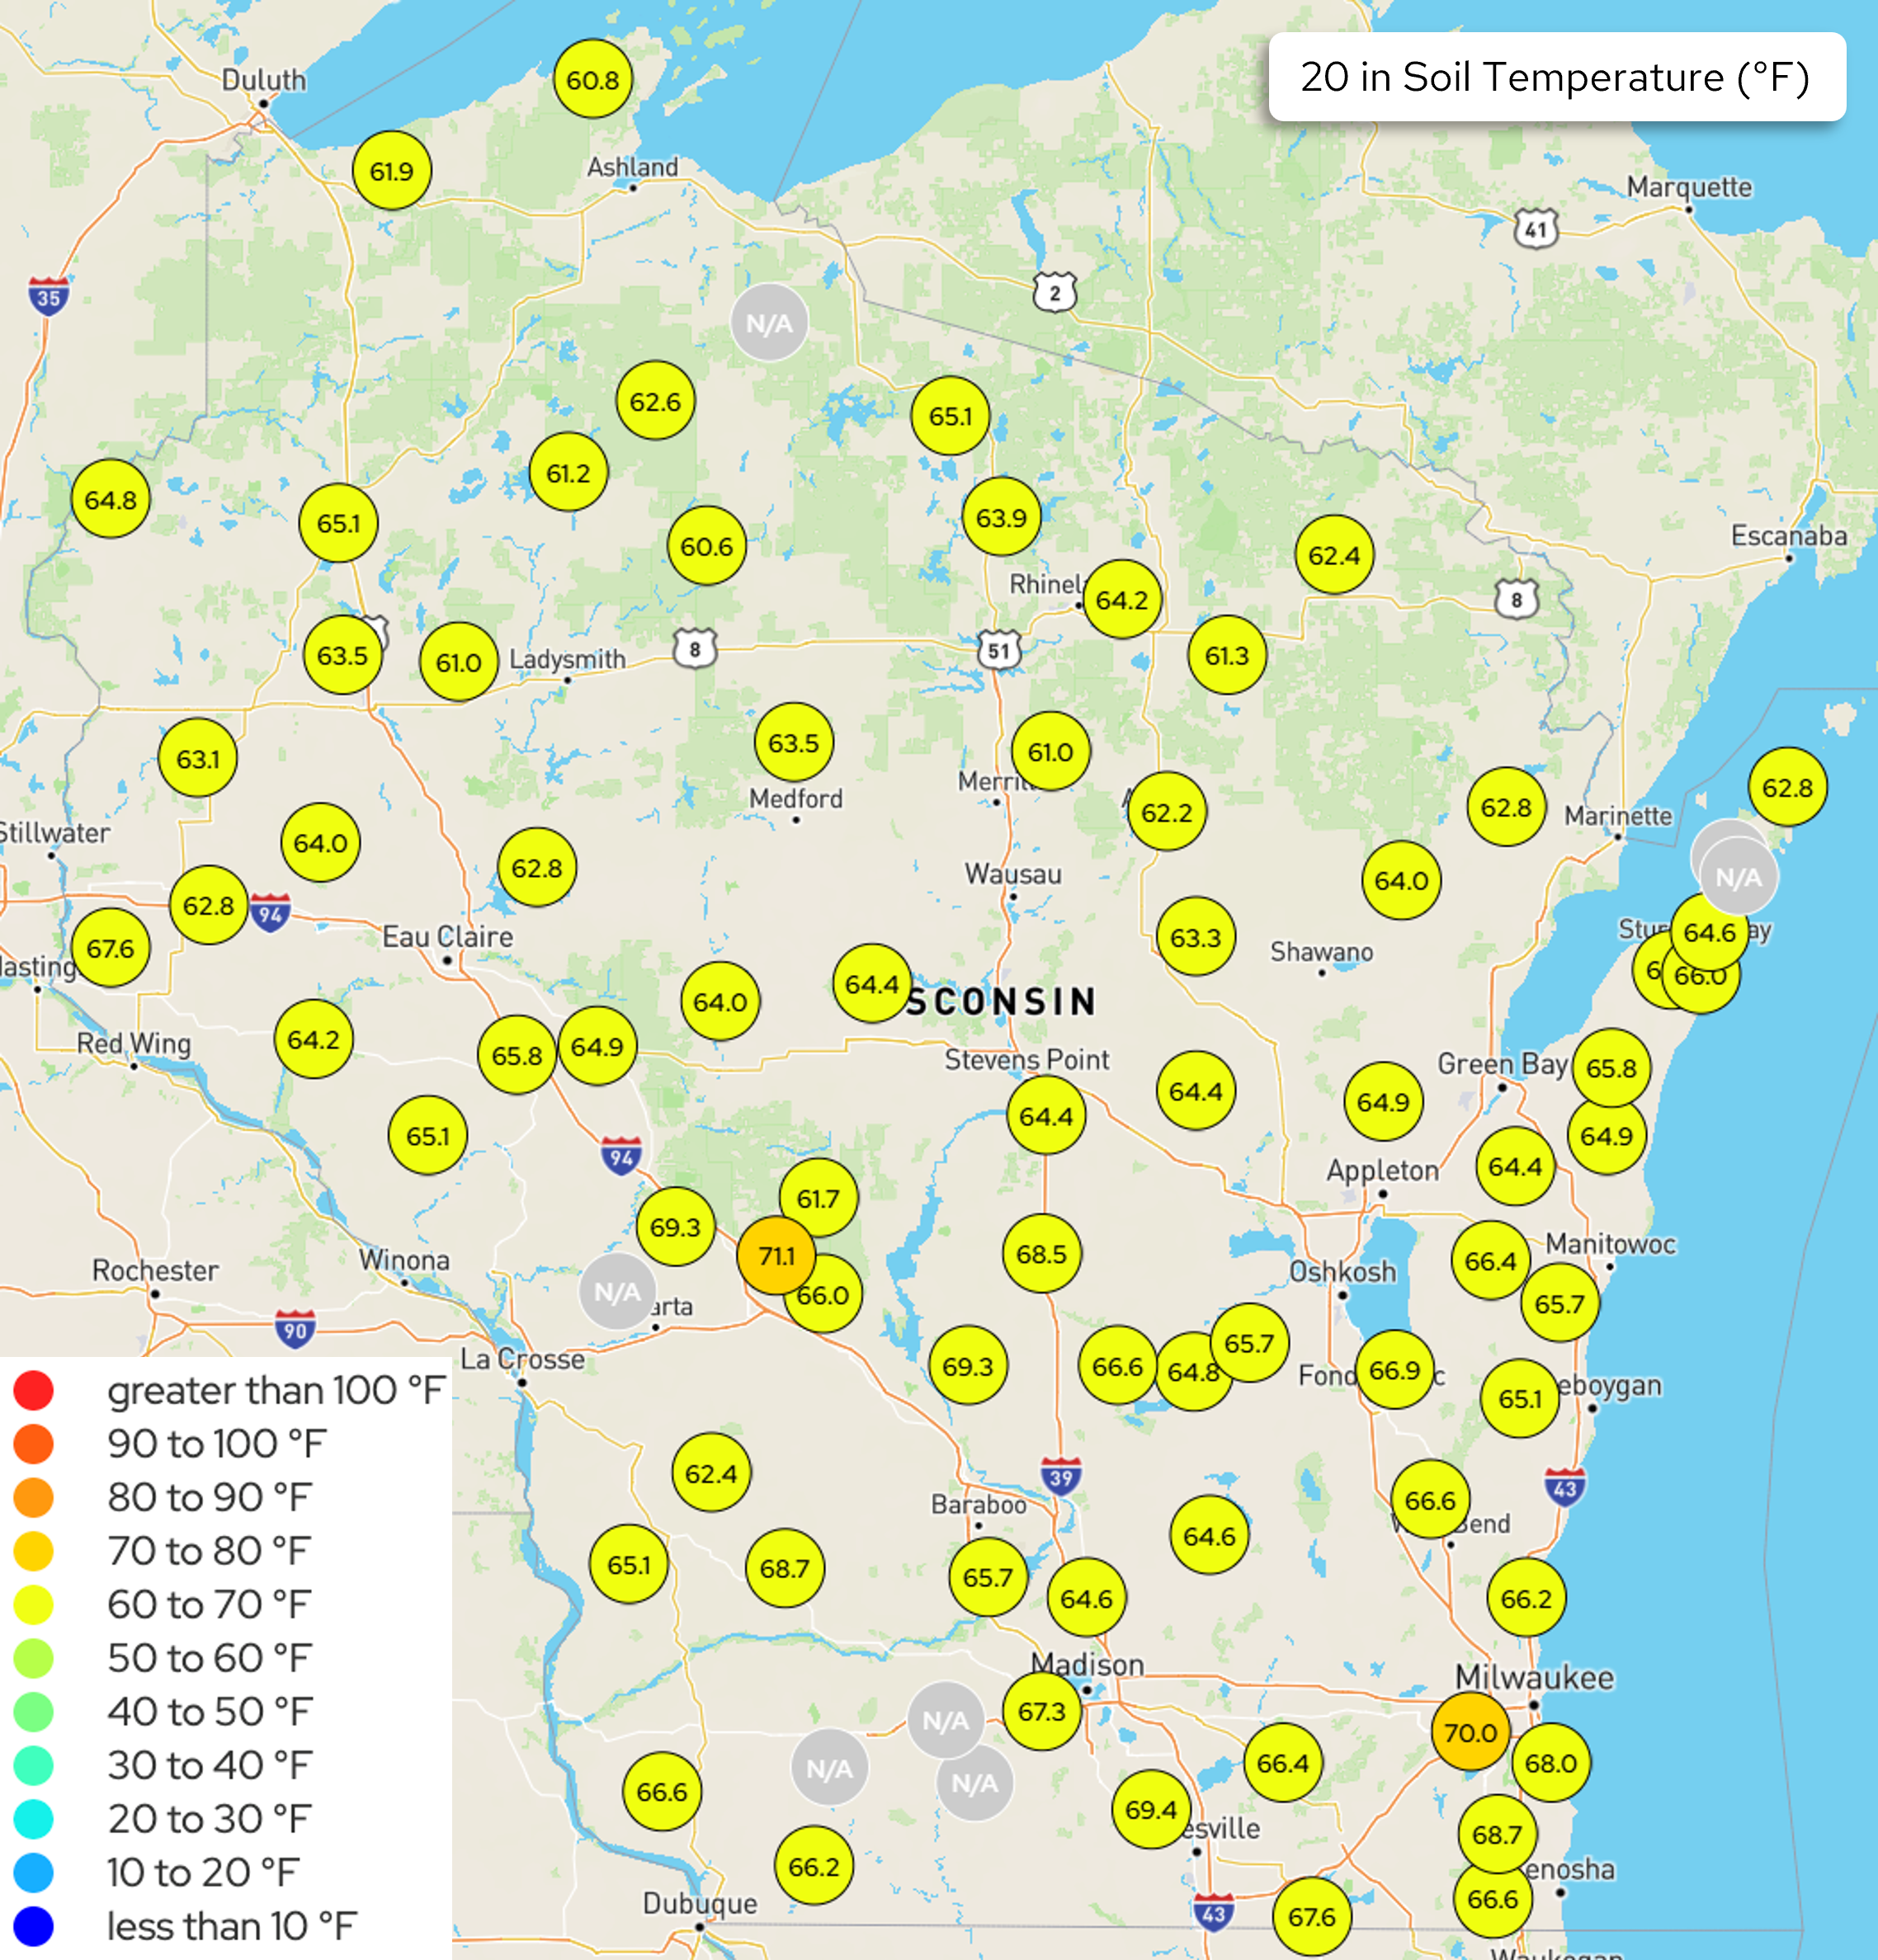
Image Description ↓
The map shows subsoil temperature data at a 20-inch depth across Wisconet stations throughout Wisconsin. Station readings across the state fall within the 60 to 70 degrees Fahrenheit scale (yellow-green markers), with a few southern stations reaching between 70.0 and 71.1 degrees Fahrenheit (dark yellow markers) near Sparta and Milwaukee. Northern stations record slightly cooler values between 60.6 and 65.1 degrees Fahrenheit. The color legend scales temperatures from less than 10 degrees Fahrenheit to greater than 100 degrees Fahrenheit.
- The maps show daily average Wisconet soil temperature conditions on September 14th.
U.S. Drought Monitor
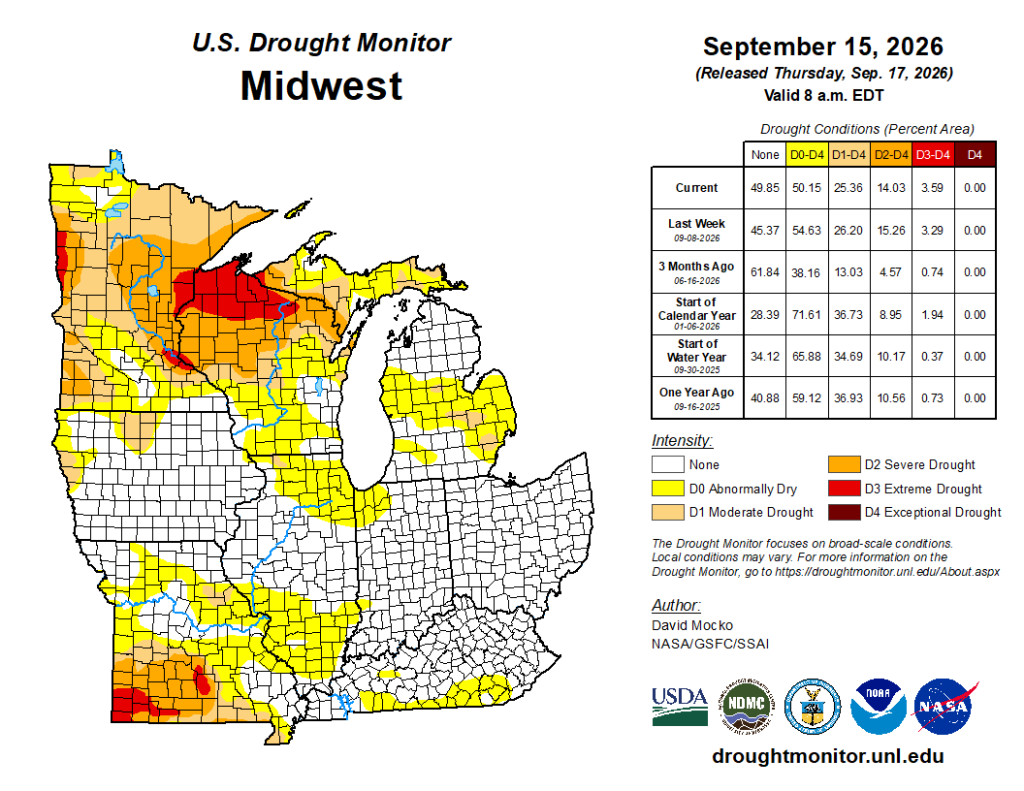
Image Description ↓
A U.S. Drought Monitor map for the Midwest region valid September 15, 2026, released September 17, 2026. The map shows extreme drought (D3, red shading) concentrated in northern Wisconsin and northeastern Minnesota, with severe drought (D2, orange shading) spanning across northern Minnesota, northern Wisconsin, and parts of southern Missouri. Abnormally dry (D0) to moderate drought (D1) conditions cover much of the remaining central Midwest, while eastern states like Indiana, Ohio, and Kentucky remain mostly clear of drought (None). A table on the right lists current Midwest coverage percentages: None at 49.85 percent, D0-D4 at 50.15 percent, D1-D4 at 25.36 percent, D2-D4 at 14.03 percent, D3-D4 at 3.59 percent, and D4 at 0.00 percent. Author: David Mocko, NASA/GSFC/SSAI.
Compared to last week:
- Midwest: D1 and D2 coverage both decreased from last week’s report, with D3 coverage unchanged. There were both 1 class improvements and 1 class degradations noted in Wisconsin and neighboring states.
- 74.6% of the Midwest region is drought free (~25.4% in D1-D4).
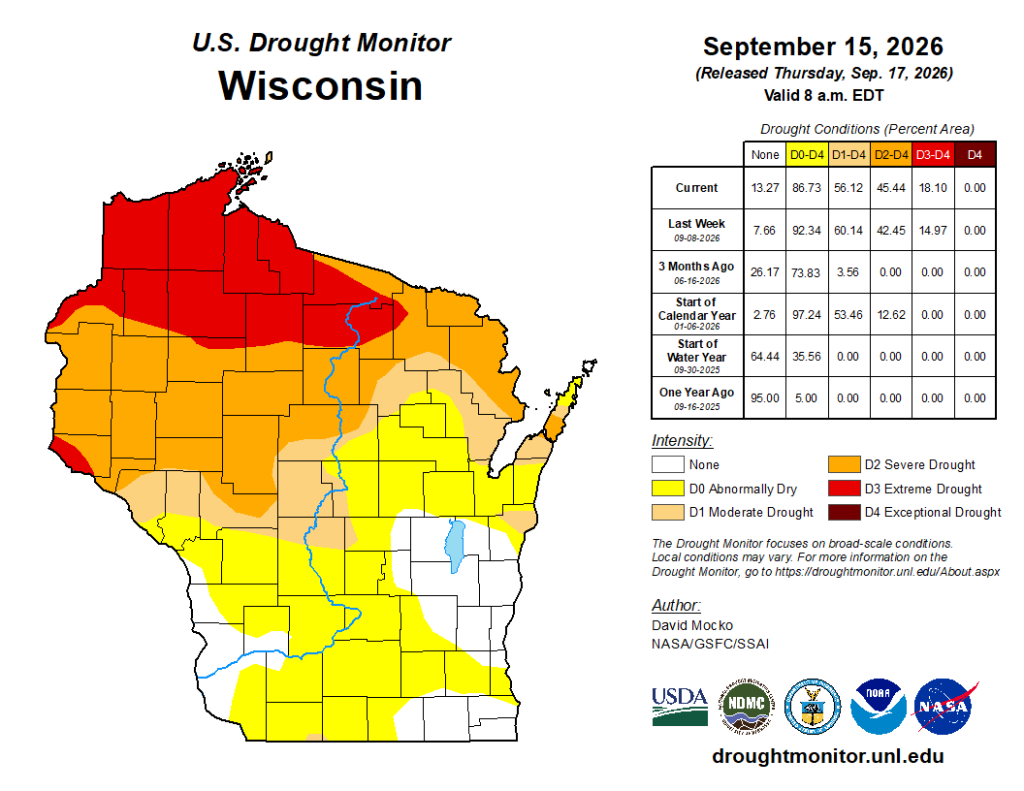
Image Description ↓
A U.S. Drought Monitor map for Wisconsin valid September 15, 2026, released September 17, 2026. Northern Wisconsin is shaded in red indicating extreme drought (D3), surrounded by a broad band of orange across northern and west-central regions indicating severe drought (D2). Central and southern areas are predominantly yellow indicating abnormally dry conditions (D0), with tan patches showing moderate drought (D1). A data table shows current coverage percentages: None at 13.27 percent, D0-D4 at 86.73 percent, D1-D4 at 56.12 percent, D2-D4 at 45.44 percent, D3-D4 at 18.10 percent, and D4 at 0.00 percent. Author: David Mocko, NASA/GSFC/SSAI.
- Wisconsin: D1-D4 coverage decreased by 4%. However, D3 drought expanded in the north-central region, and D2 drought expanded into Clark and Jackson Counties.
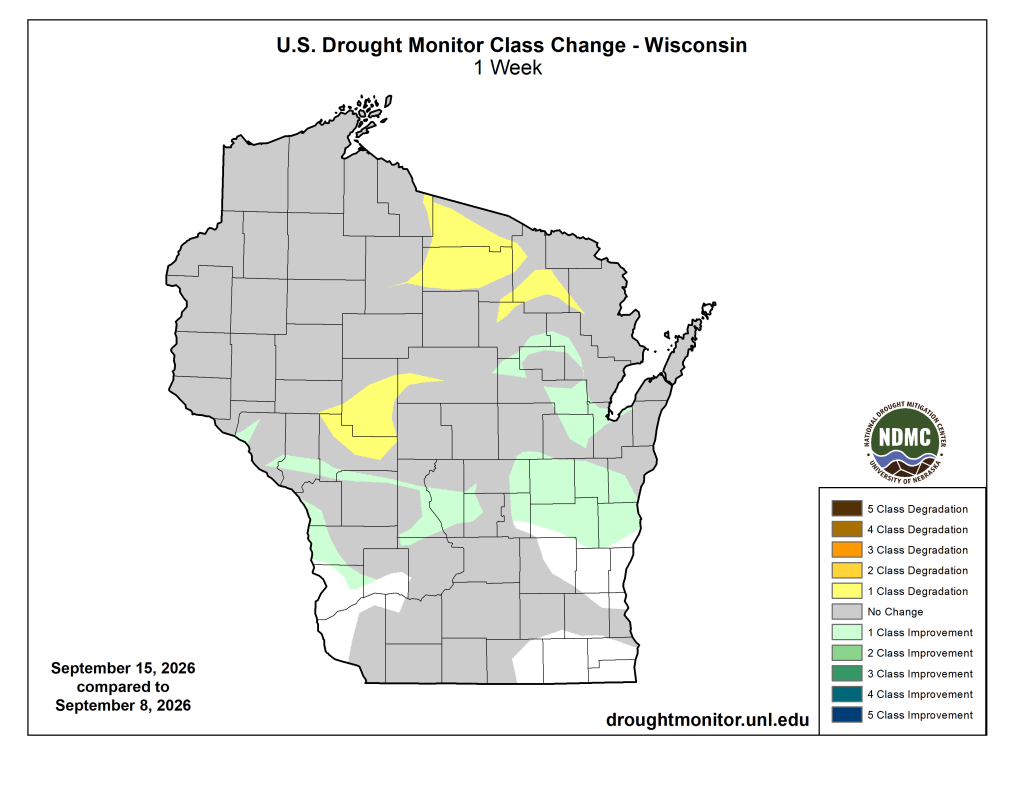
Image Description ↓
A map depicting one-week drought class changes across Wisconsin between September 8, 2026, and September 15, 2026. Most of the state is shaded gray, indicating no change. Patchy light green areas across southern and central Wisconsin represent a 1 class improvement. Small yellow patches in west-central and northern Wisconsin represent a 1 class degradation.
- 1 class improvement in drought conditions for parts of eastern and central WI
- 1 class degradation for other areas in central and northern WI
U.S. Drought Monitor Time Series
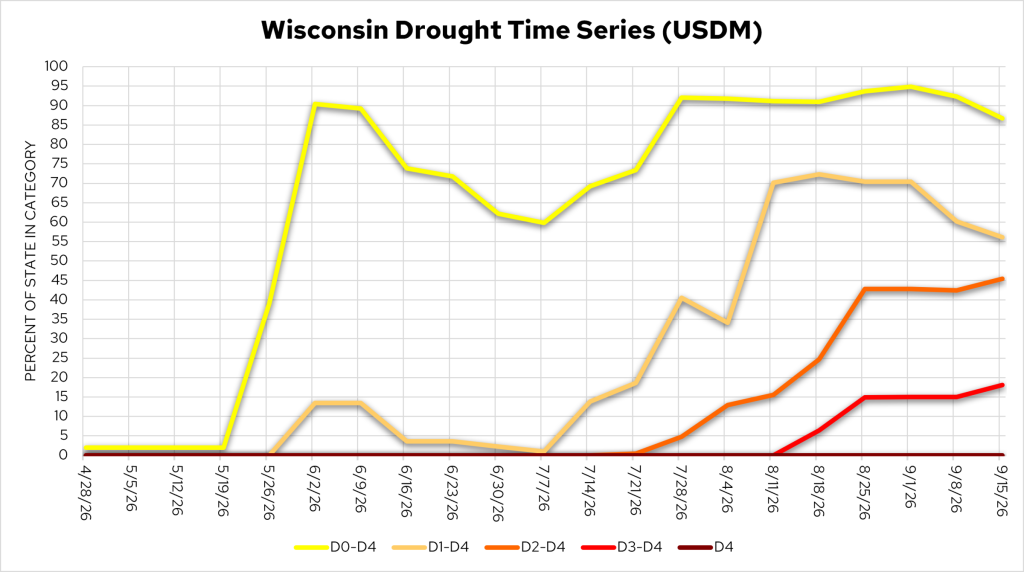
Image Description ↓
A line chart displaying the percentage of Wisconsin affected by varying levels of drought from April 28, 2026, through September 15, 2026, based on U.S. Drought Monitor categories. Line categories include D0-D4 (yellow), D1-D4 (tan), D2-D4 (orange), D3-D4 (red), and D4 (dark brown). Conditions remained below 5 percent across all categories through mid-May, followed by a sharp rise in D0-D4 coverage near 90 percent by early June. In mid-to-late July, D1-D4 and D2-D4 levels increased sharply. By September 15, 2026, D0-D4 coverage was near 87 percent, D1-D4 stood around 56 percent, D2-D4 was around 45 percent, D3-D4 reached nearly 18 percent, and D4 remained at 0 percent.
- D0 coverage = 86.7%; D1 coverage = 56.1%; D2 coverage = 45.4%; D3 coverage = 18.1%
Temperature Trends
7 Day Temperatures
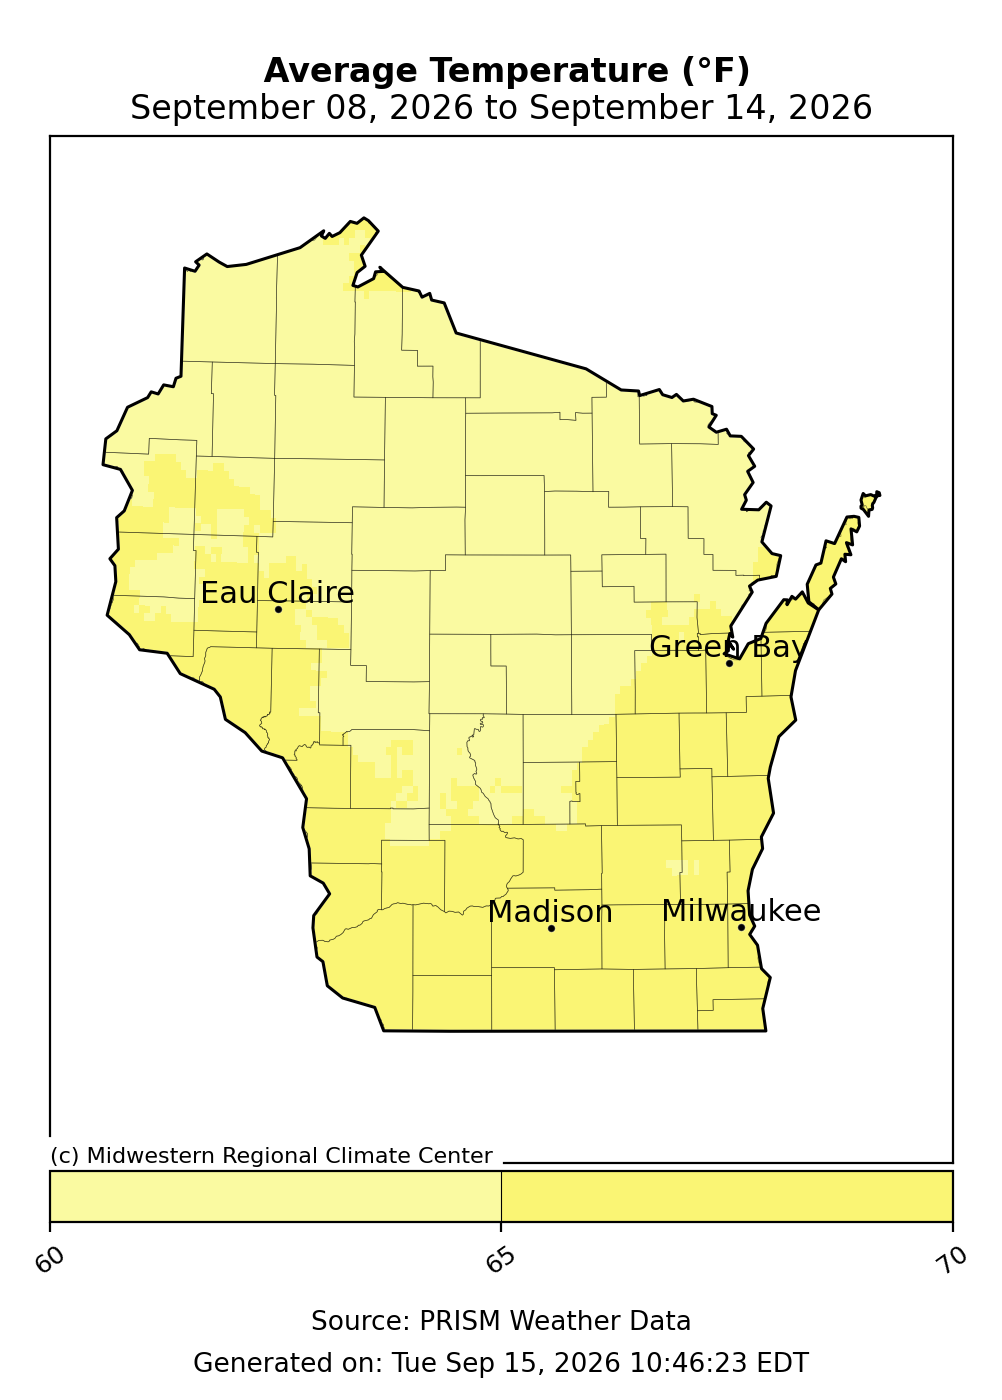
Image Description ↓
The map shows state-wide average temperatures over a 7-day period. Most of Wisconsin recorded average temperatures between 60 and 65 degrees Fahrenheit (light yellow shade). Southeastern and localized western areas registered slightly higher averages between 65 and 70 degrees Fahrenheit (medium yellow shade). Key cities labeled include Eau Claire, Green Bay, Madison, and Milwaukee. Data sourced from PRISM Weather Data by the Midwestern Regional Climate Center.
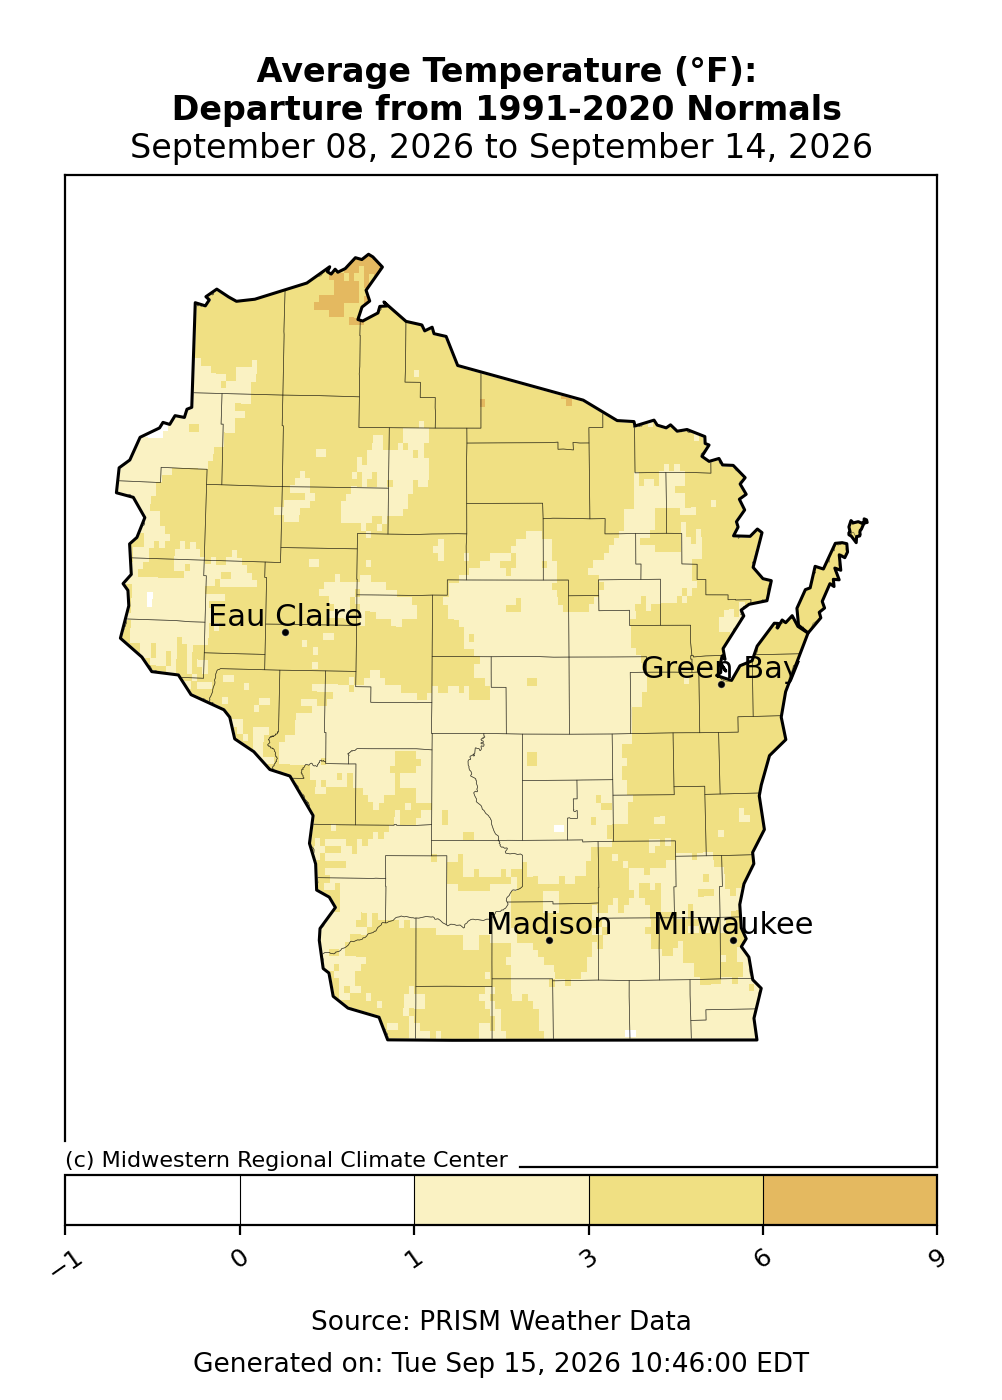
Image Description ↓
The map depicts temperature departures across Wisconsin over a 7-day period. Nearly the entire state experienced temperatures 1 to 6 degrees Fahrenheit above normal (light yellow to medium yellow shades). Select northernmost border areas recorded temperature departures 6 to 9 degrees Fahrenheit above normal (tan shade). Cities marked for reference include Eau Claire, Green Bay, Madison, and Milwaukee. Data sourced from PRISM Weather Data by the Midwestern Regional Climate Center.
- Average temperatures were 65-70°F across southern, eastern, and western Wisconsin. In central and northern counties, temperatures were a bit cooler (low 60s).
- Temperatures were above normal across the state last week. Temperatures were commonly 2-4°F warmer than normal.
- During the night of September 13-14, some northern Wisconet stations reported overnight low temperatures at or below freezing. Use the MRCC freeze date tool to explore when your county’s average first fall freeze occurs.
30 Day Temperatures
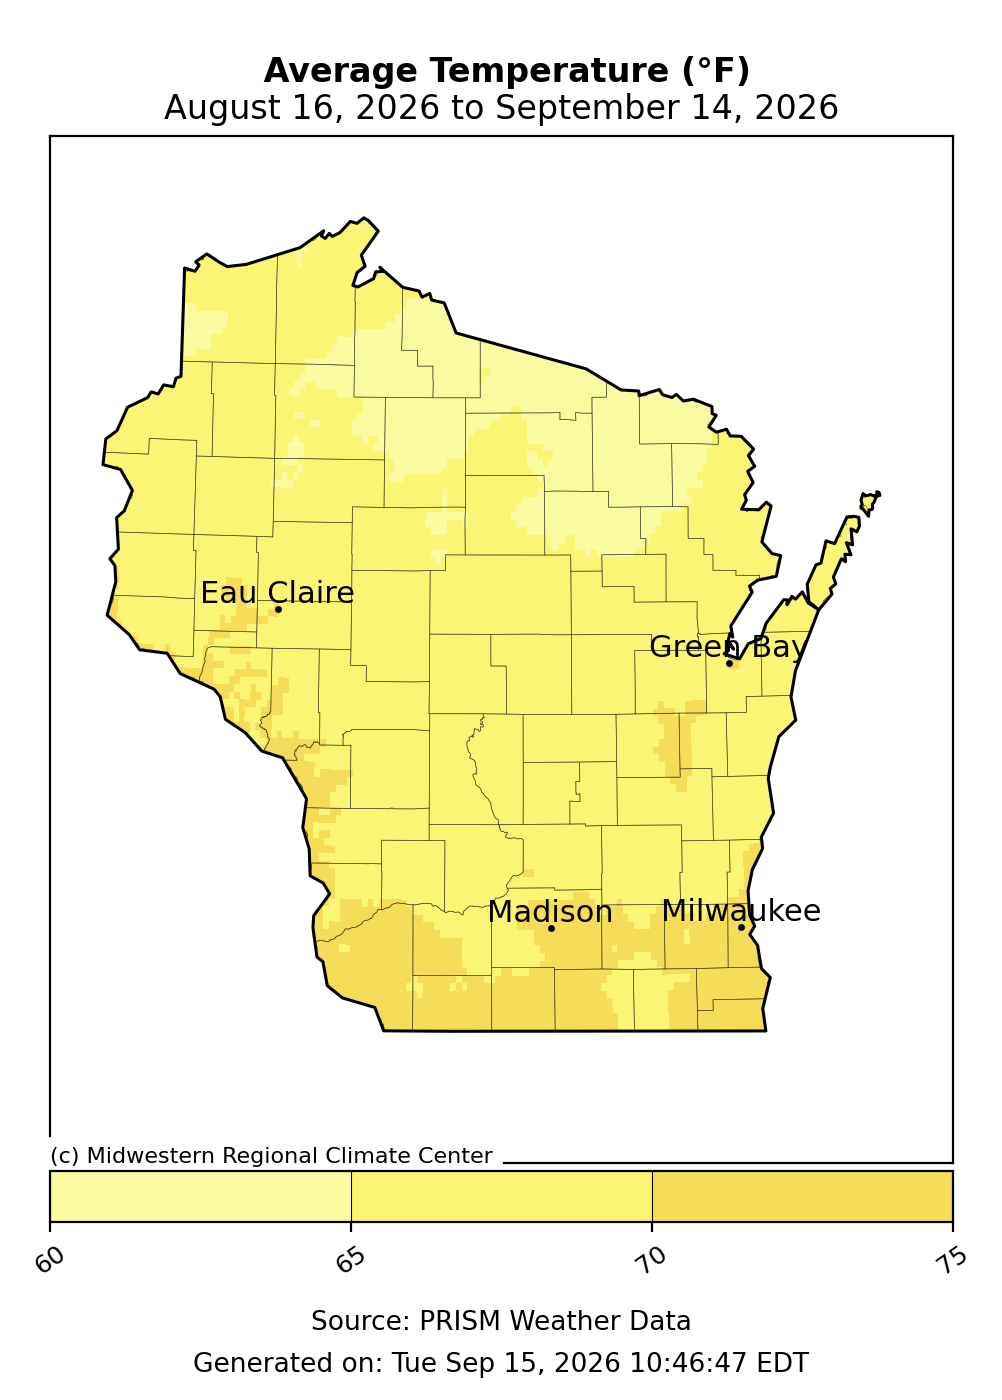
Image Description ↓
The map shows total average temperatures across Wisconsin over a 30-day window. Northern counties registered average temperatures between 60 and 65 degrees Fahrenheit (light yellow shade). Central, southern, and eastern counties recorded higher averages ranging between 65 and 70 degrees Fahrenheit (medium yellow shade). Reference cities marked on the map include Eau Claire, Green Bay, Madison, and Milwaukee. Data sourced from PRISM Weather Data by the Midwestern Regional Climate Center.
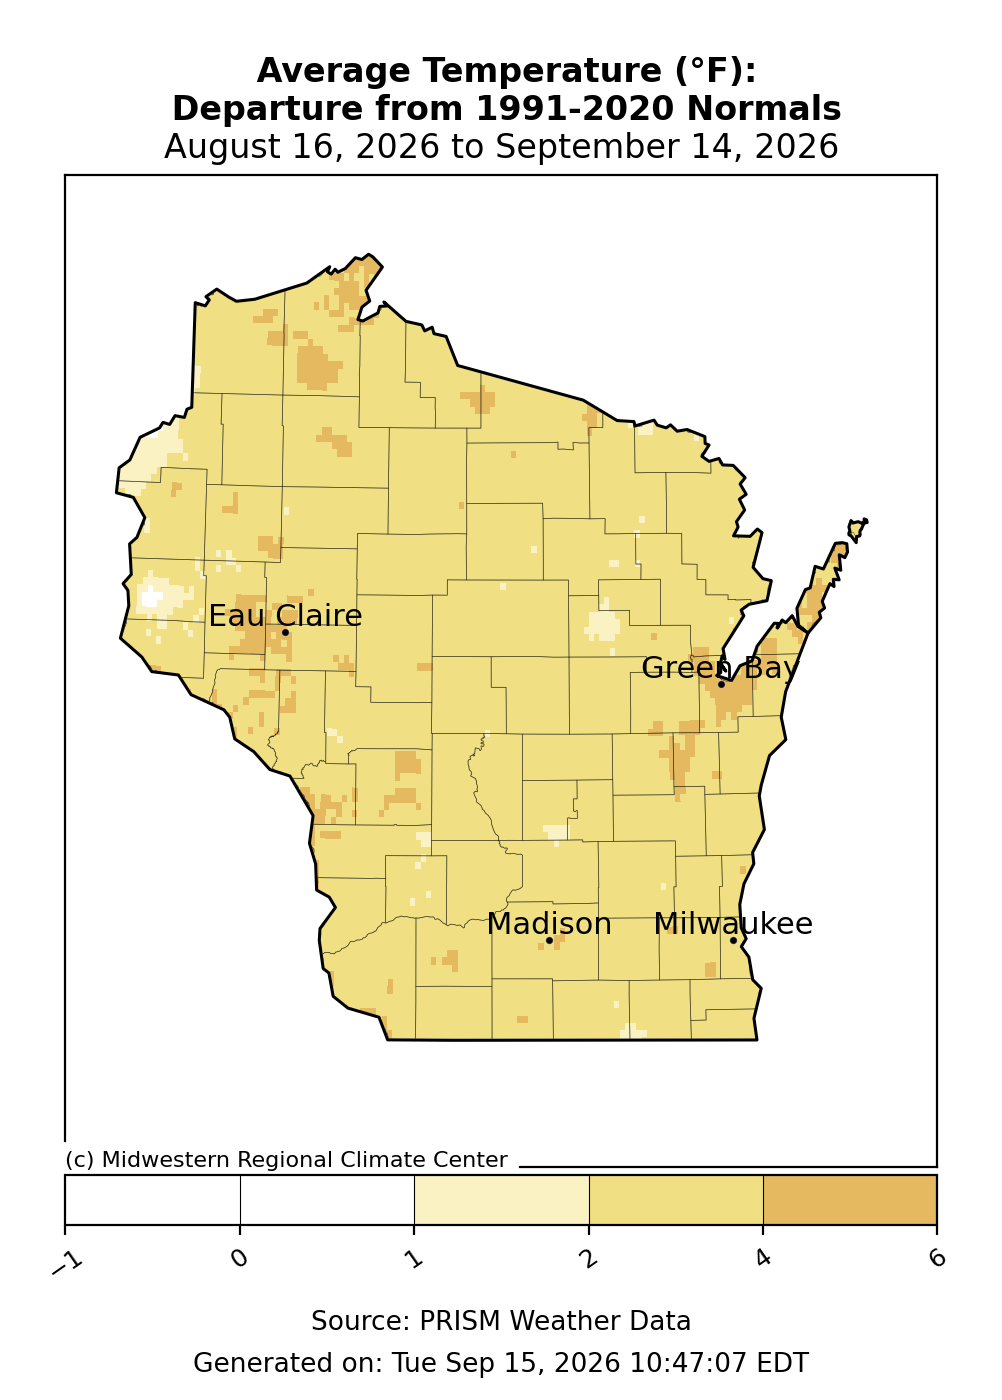
Image Description ↓
The map displays temperature departures across Wisconsin over a 30-day period. The vast majority of the state experienced average temperatures 1 to 4 degrees Fahrenheit above 30-year climate normals (light to medium yellow shades). Small pockets in western, northern, and eastern Wisconsin reached 4 to 6 degrees Fahrenheit above normal (tan shade). Labeled cities include Eau Claire, Green Bay, Madison, and Milwaukee. Data sourced from PRISM Weather Data by the Midwestern Regional Climate Center.
Growing Degree Days (Base 50°F)
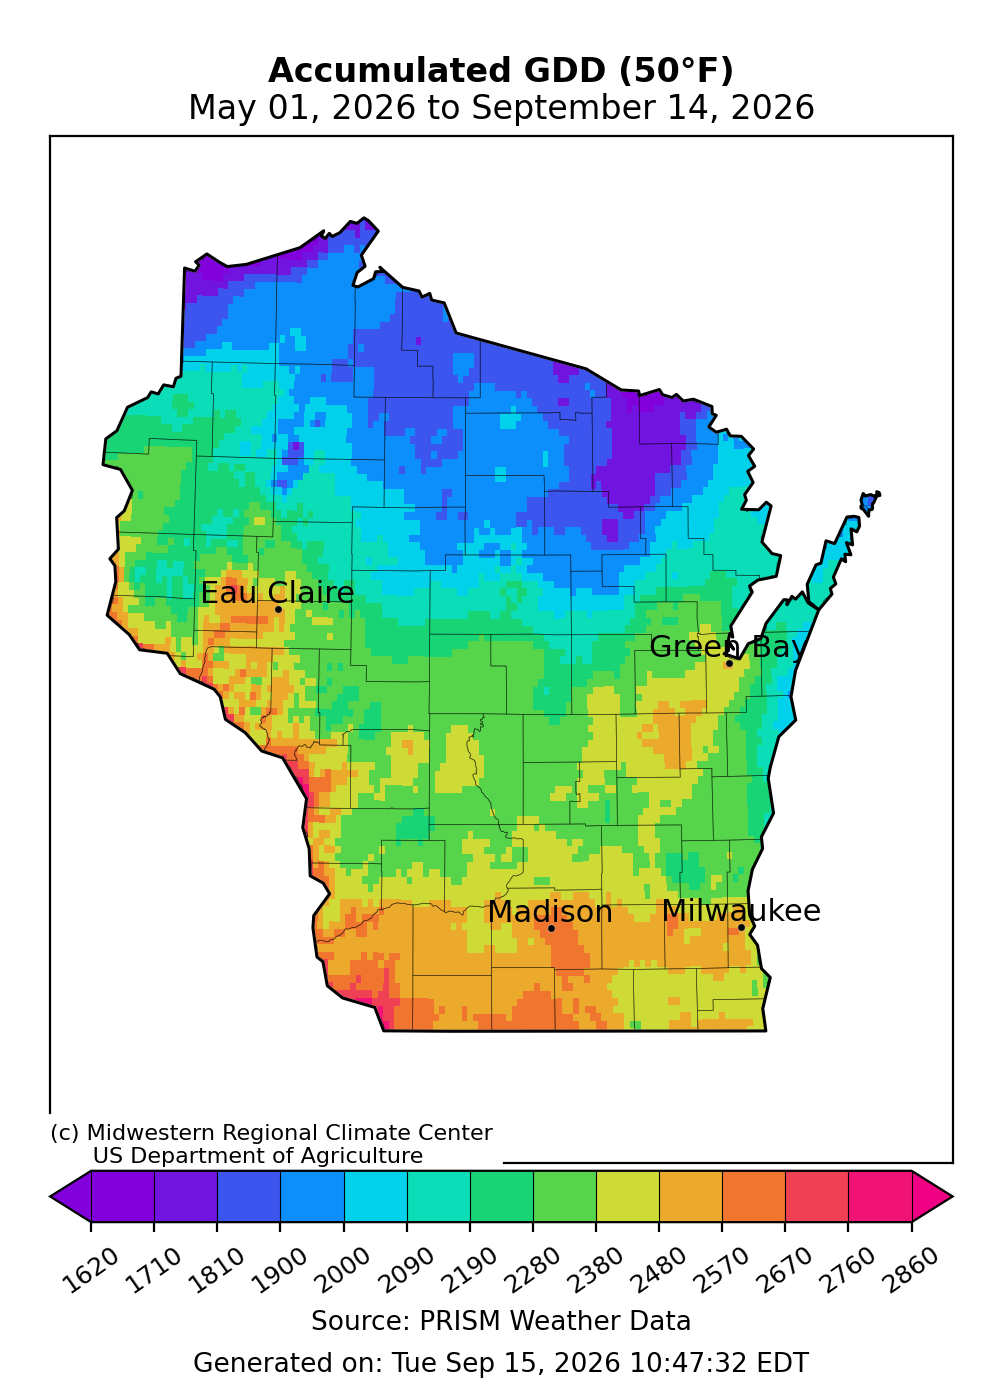
Image Description ↓
The map displays accumulated growing degree days base 50 across Wisconsin from May 1 to September 14, 2026. Far northern counties accumulated the lowest GDD totals, between 1620 and 1900 units (purple to deep blue shades). Central Wisconsin accumulated between 2090 and 2380 units (cyan to yellow-green shades). Southern and southwestern counties recorded the highest accumulations, reaching between 2480 and 2860 units (orange to magenta shades). Labeled cities include Eau Claire, Green Bay, Madison, and Milwaukee. Data sourced from PRISM Weather Data by the Midwestern Regional Climate Center and US Department of Agriculture.
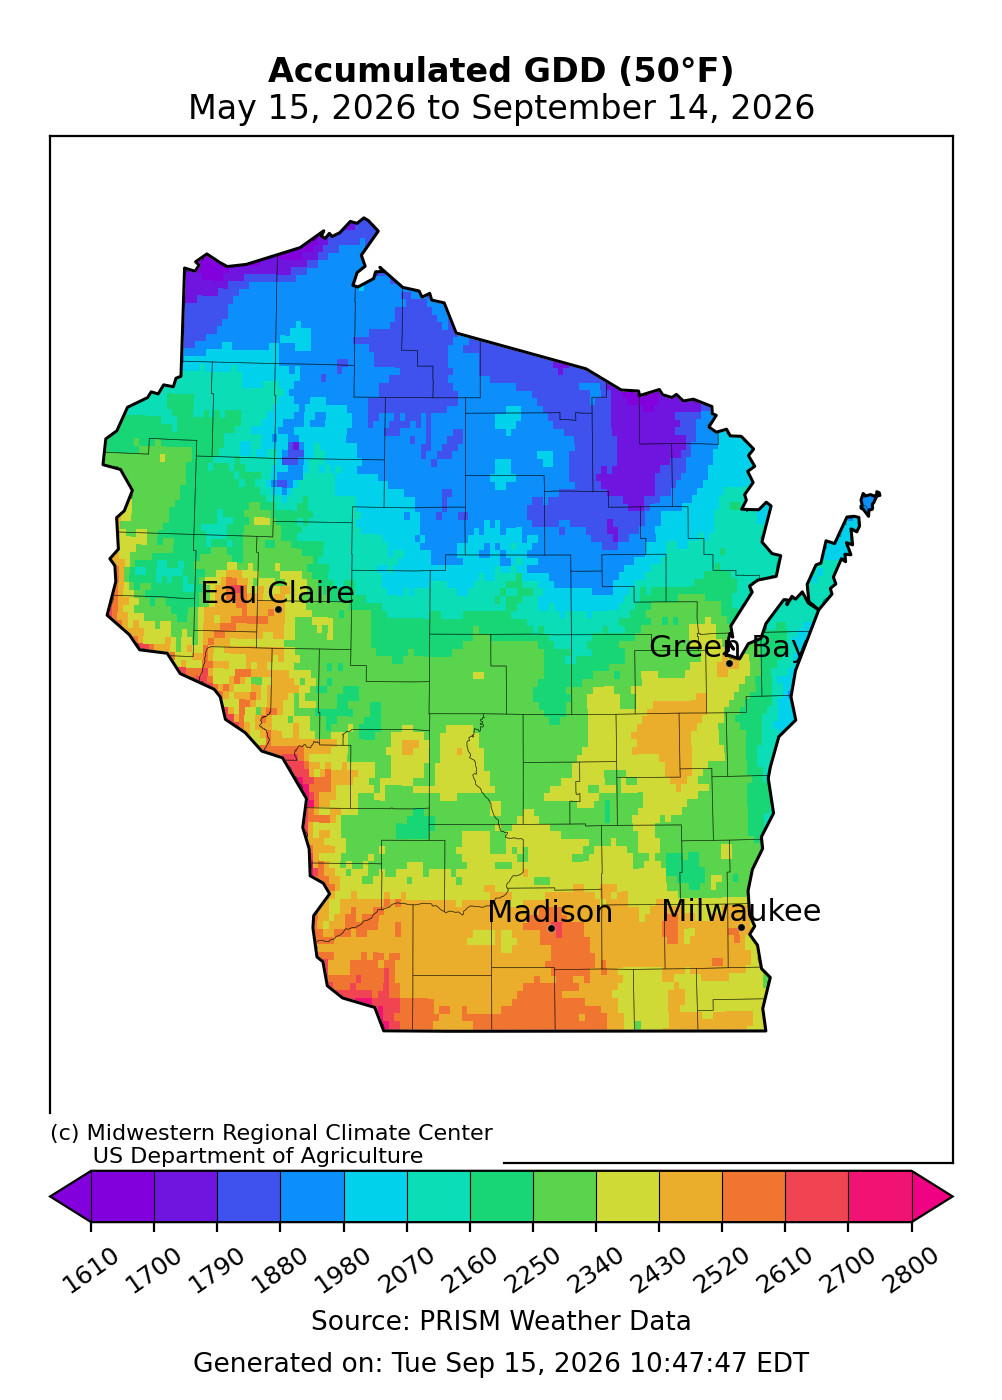
Image Description ↓
The map displays accumulated growing degree days base 50 across Wisconsin for the period from May 15 to September 14, 2026. Northern counties logged lower accumulation totals ranging from 1610 to 1880 units (purple to blue shades). Central regions recorded accumulation between 1980 and 2250 units (teal to yellow-green shades). Southern counties logged higher totals ranging from 2340 to 2800 units (orange to magenta shades). Reference cities marked include Eau Claire, Green Bay, Madison, and Milwaukee. Data sourced from PRISM Weather Data by the Midwestern Regional Climate Center and US Department of Agriculture.
- Starting May 1 – Growing degree day accumulation ranges from 2760 GDD in the far south and west to 1900 GDD in the far north. These values are 110-115% of normal.
- Starting May 15 – Growing degree day accumulation ranges from 2700 GDD in the far south and west to 1880 GDD in the far north. These values are 110-120% of normal.
Crop Progress and Condition
Crop Progress Report for Corn
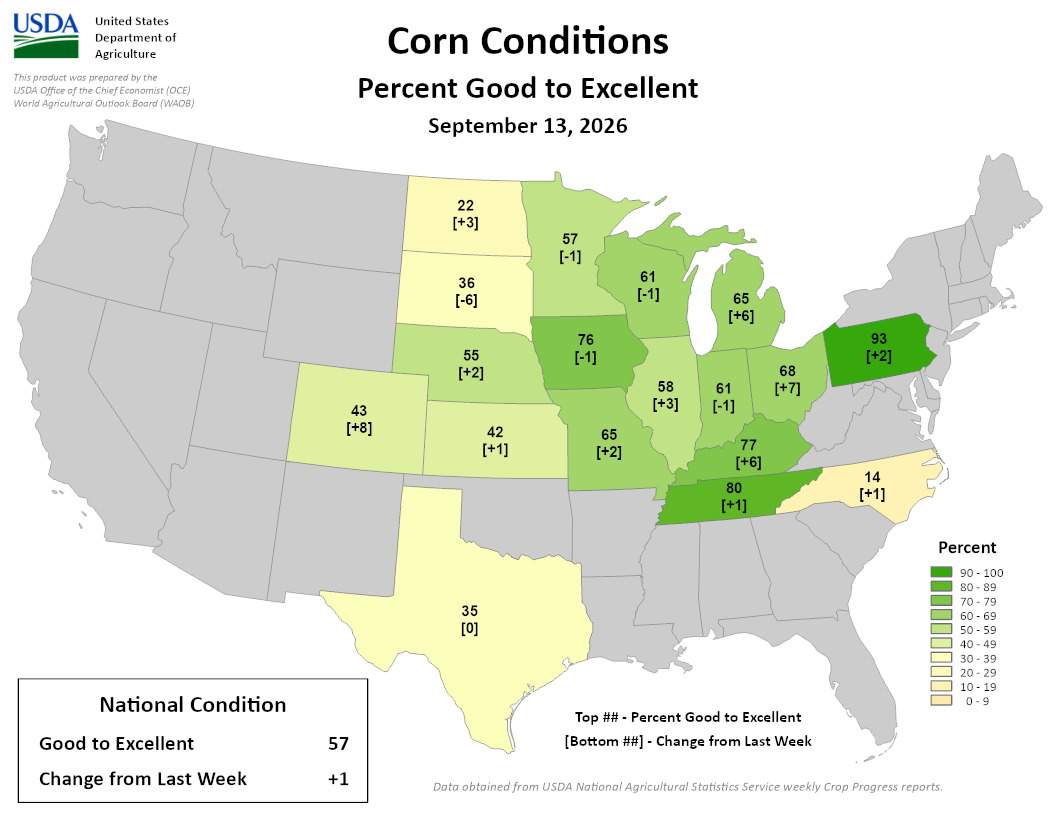
Image Description ↓
A USDA map displaying corn conditions across the United States for the week ending September 13, 2026. Top numbers indicate the percentage of corn rated good to excellent, while bottom numbers in brackets show the change from the previous week. Pennsylvania shows the highest rating at 93 percent (+2 change), while North Carolina shows 14 percent (+1 change). The national condition stands at 57 percent good to excellent, reflecting a +1 percent change from the previous week.
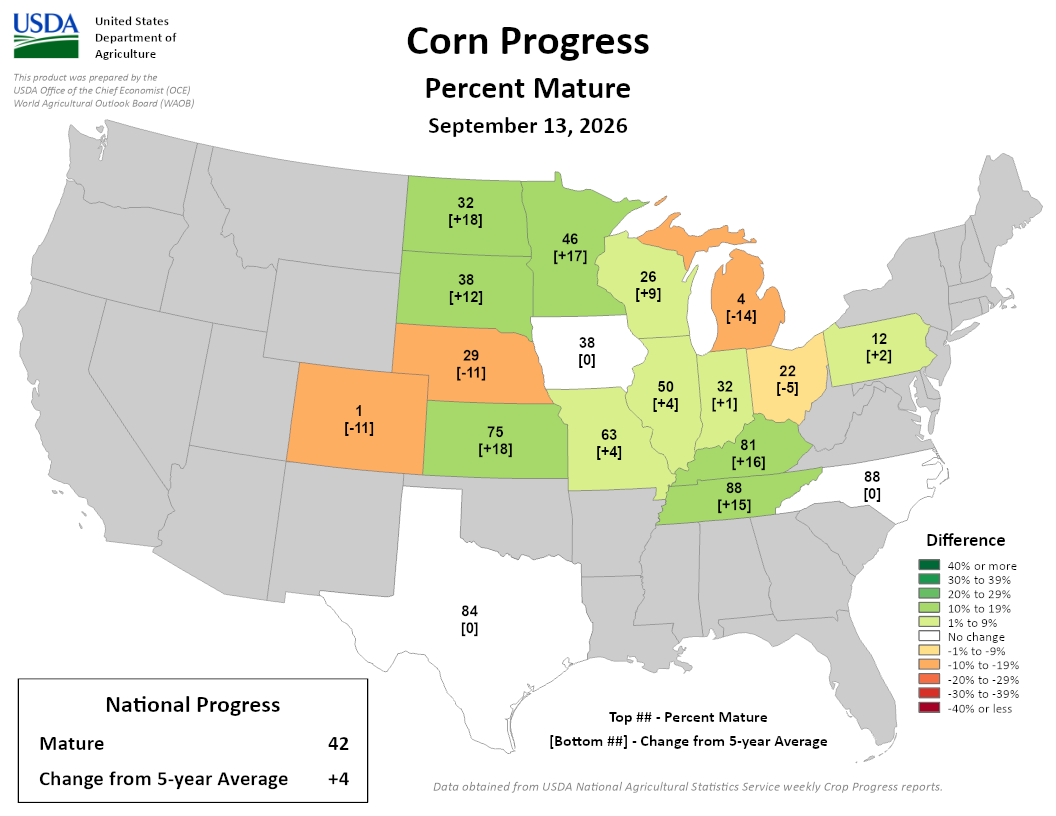
Image Description ↓
A USDA map illustrating corn maturity progress across major corn-producing US states as of September 13, 2026. Each state displays the percentage mature on top and the change from the 5-year average in brackets below. Maturity ranges from 1 percent in Colorado (-11 from 5-year average) to 88 percent in Tennessee (+15) and North Carolina (0). Major Midwestern states include Iowa at 38 percent (0), Illinois at 50 percent (+4), and Indiana at 32 percent (+1). Nationally, corn maturity is at 42 percent, which is +4 percent higher than the 5-year average.
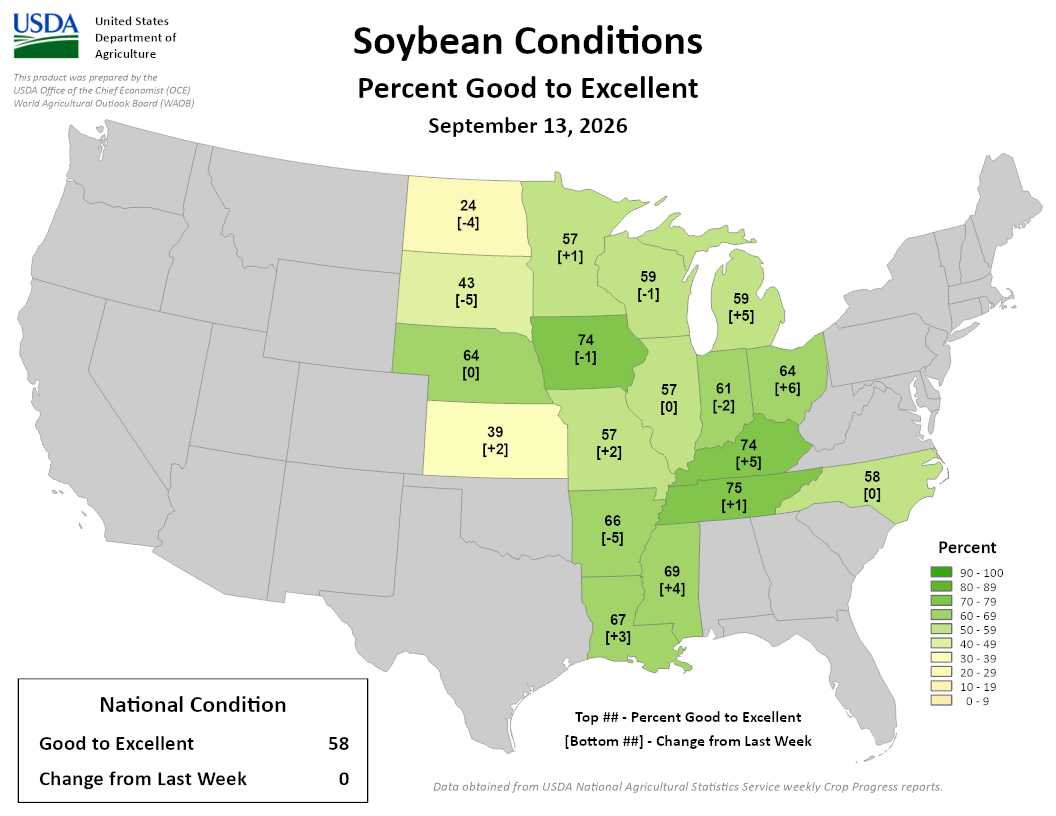
Image Description ↓
A USDA map displaying soybean conditions across key US states as of September 13, 2026. States show the top number as percentage good to excellent and the bottom number in brackets as weekly change. State ratings range from 24 percent in North Dakota (-4 change) to 75 percent in Tennessee (+1 change). Iowa reports 74 percent (-1), Illinois reports 57 percent (0), and Indiana reports 61 percent (-2). The overall national condition is 58 percent good to excellent, with 0 change from the previous week.
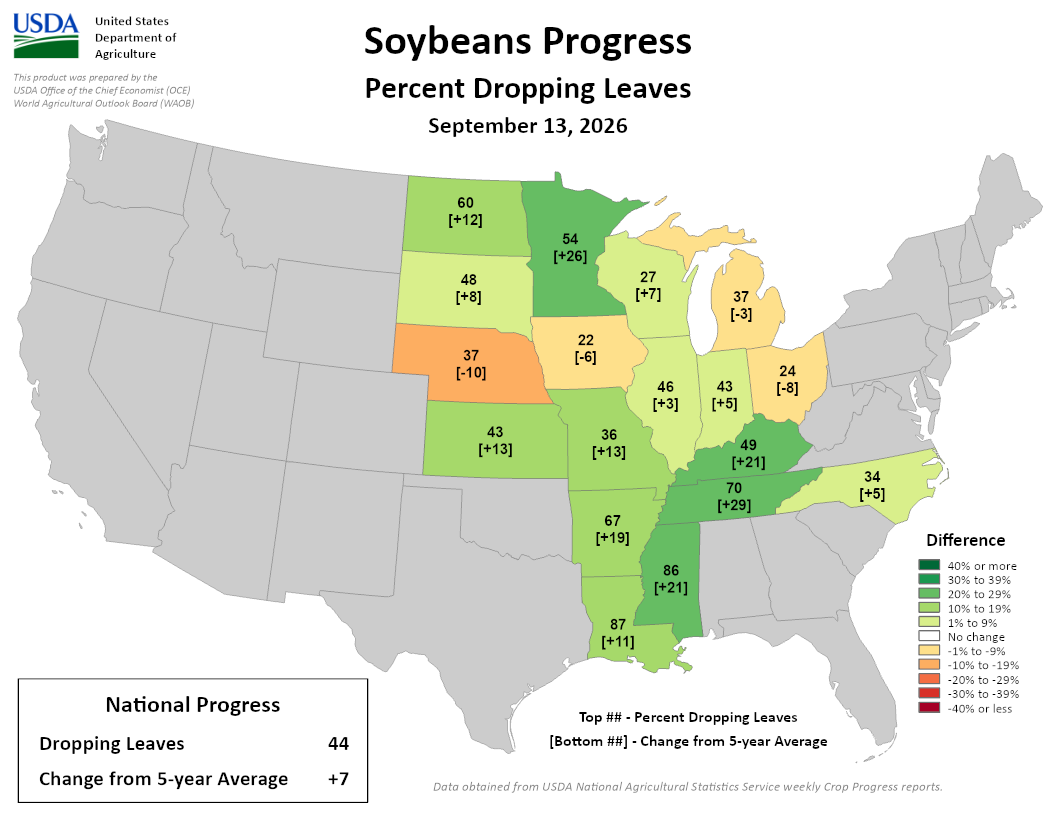
Image Description ↓
A USDA map showing the percentage of soybeans dropping leaves across key states as of September 13, 2026, compared to 5-year averages. Top numbers reflect the percentage dropping leaves, while bottom numbers in brackets reflect the change from the 5-year average. Leaf drop ranges from 22 percent in Iowa (-6 change) to 87 percent in Louisiana (+11 change) and 86 percent in Mississippi (+21 change). Minnesota reports 54 percent (+26), Illinois reports 46 percent (+3), and Indiana reports 43 percent (+5). The national progress total is 44 percent, representing a +7 percent change from the 5-year average.
- Wisconsin had 5.8 days suitable for fieldwork statewide.
- The report notes that corn (for grain) harvest has begun locally, especially in fields that had little rain over the summer.
- 20% of the state’s soybeans are dropping leaves.
- Corn is 97% at dough stage, 73% at dent stage, and 26% at maturity.
- Corn silage harvest is 32% complete.
- Corn and soybean conditions are 61% and 59% good to excellent, respectively. Both are down 1% from last week’s report.
- Pasture and range were rated 43% good to excellent, up 1% from last week.
- Read the full USDA report.
Forecasts and Outlooks
7 Day Precipitation Forecast
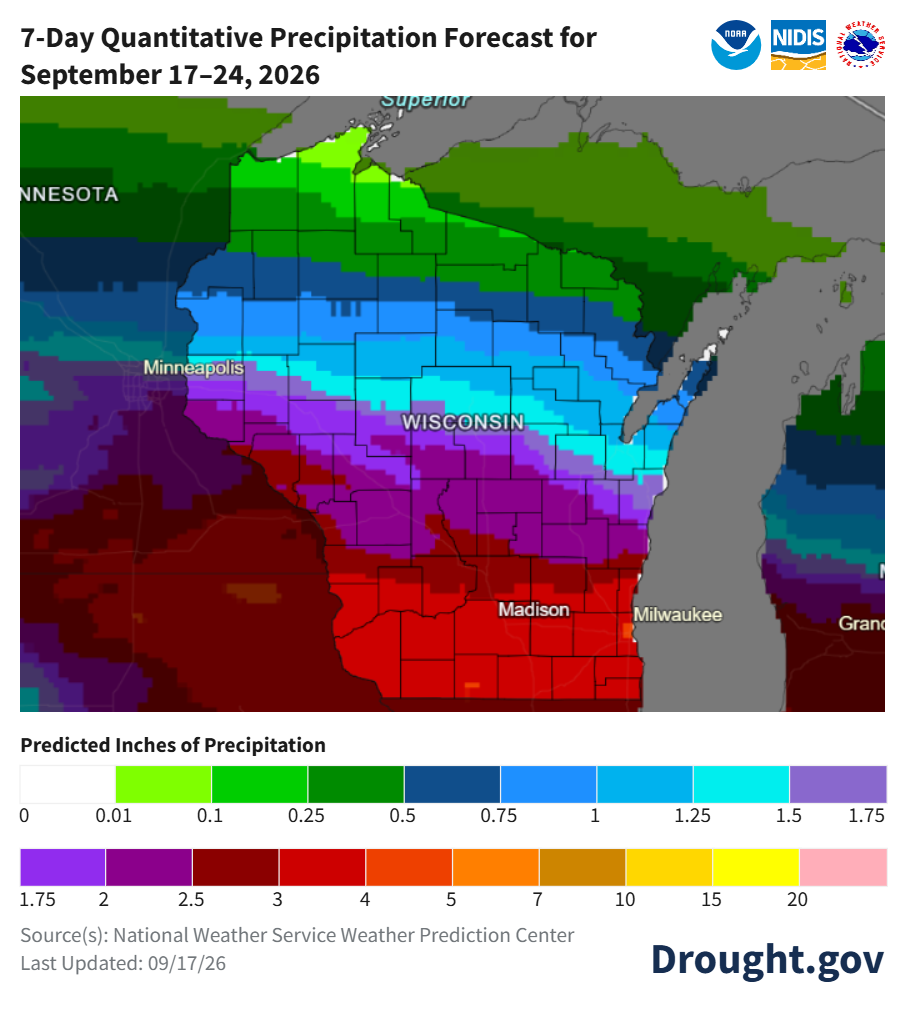
Image Description ↓
A map from Drought.gov showing predicted inches of precipitation across Wisconsin from September 17 through September 24, 2026. Southern Wisconsin around Madison and Milwaukee is forecast to receive 3 to 5 inches of precipitation, indicated by red and dark orange shading. Central regions near Minneapolis and central Wisconsin show amounts between 1.5 and 2.5 inches in purple and cyan shades. Northern regions near Lake Superior show lighter amounts between 0.01 and 0.5 inches in light green and dark green shades.
- When? – In the south, there are chances for rain on every day between Thursday and Tuesday (9/17-9/22). Further north, the best chances are on Thursday, Friday, and Saturday (9-17-9/20).
- Where? – Rain chances are highest in the southern tiers of counties, with lesser chances in central and northern counties. Chances are lowest in the far north.
- Check your local forecast for details on totals and timing.
- Average precip (1991-2020) for this week: 0.84”.
8-14 Day Temperature and Precipitation Outlook
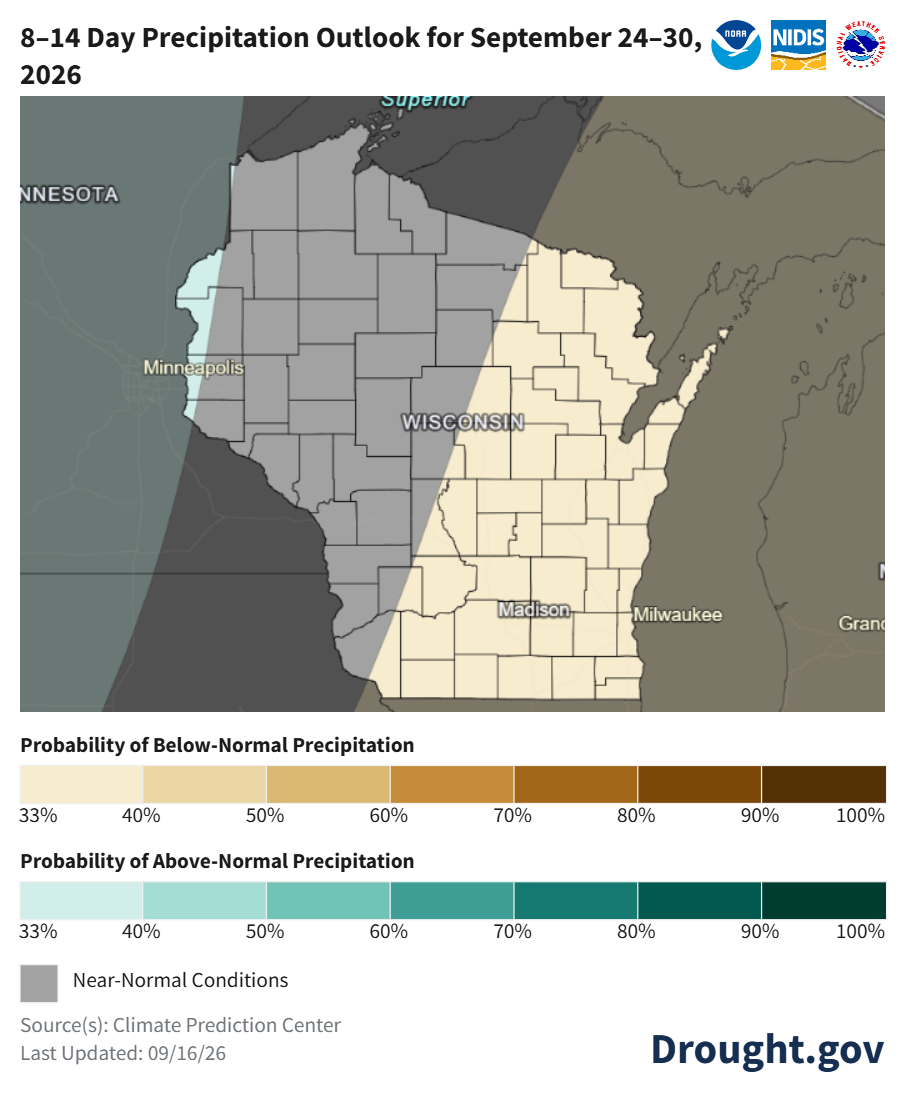
Image Description ↓
An 8-to-14 day precipitation outlook map from Drought.gov for September 24 through September 30, 2026. Eastern and southern Wisconsin, including Madison and Milwaukee, fall into a region with a 33 to 40 percent probability of below-normal precipitation, represented by light tan shading. Western and northwestern portions of the state, including areas near Minneapolis and Lake Superior, are shaded in grey, indicating near-normal conditions.
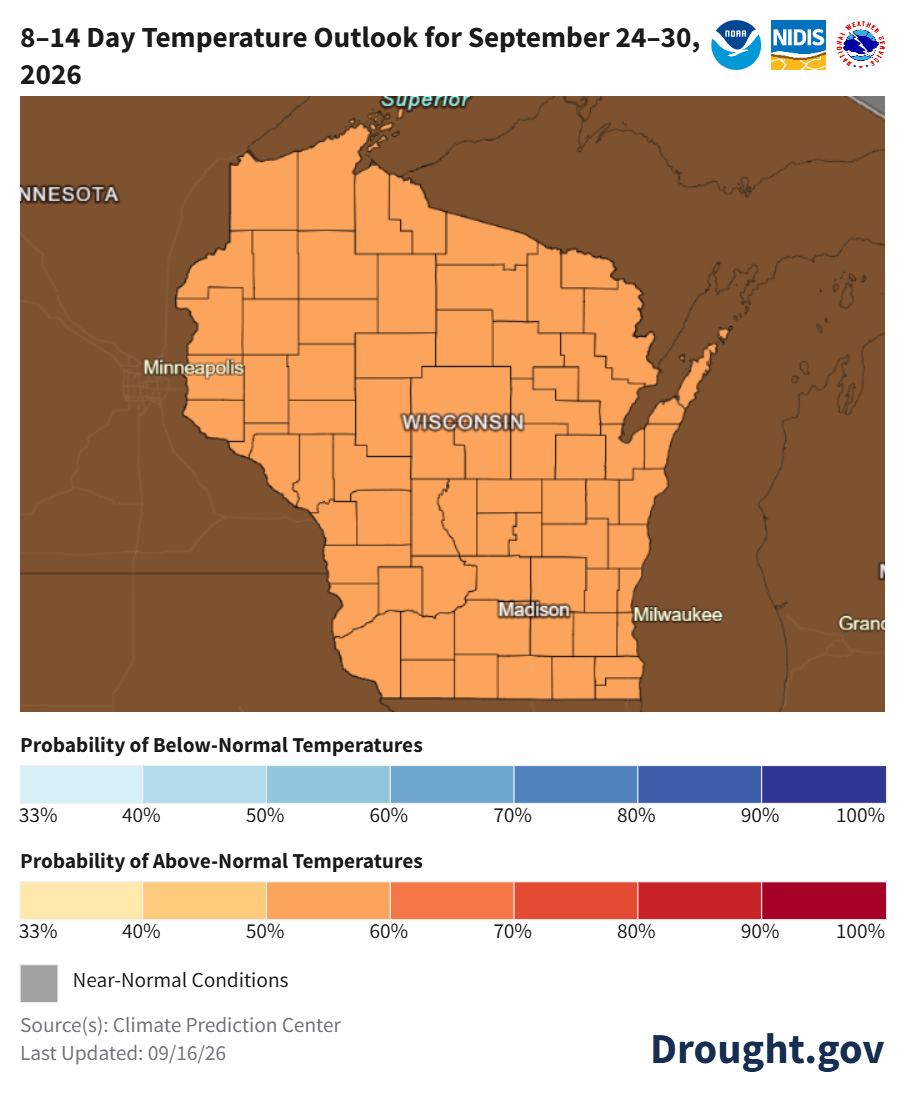
Image Description ↓
An 8-to-14 day temperature outlook map from Drought.gov for September 24 through September 30, 2026. The entire state of Wisconsin, including Madison, Milwaukee, Minneapolis border regions, and Superior, is covered in light orange shading indicating a 50 to 60 percent probability of above-normal temperatures.
- Late September: Temperatures will likely be above normal (50-60% odds) statewide. Precipitation in the eastern counties shows a below-normal lean (33-40% odds), with near-to-above normal leans elsewhere.
- Statewide normals (1991-2020) for September 24-30 are 55.0°F and 0.81”.
30 Day Temperature and Precipitation Outlook
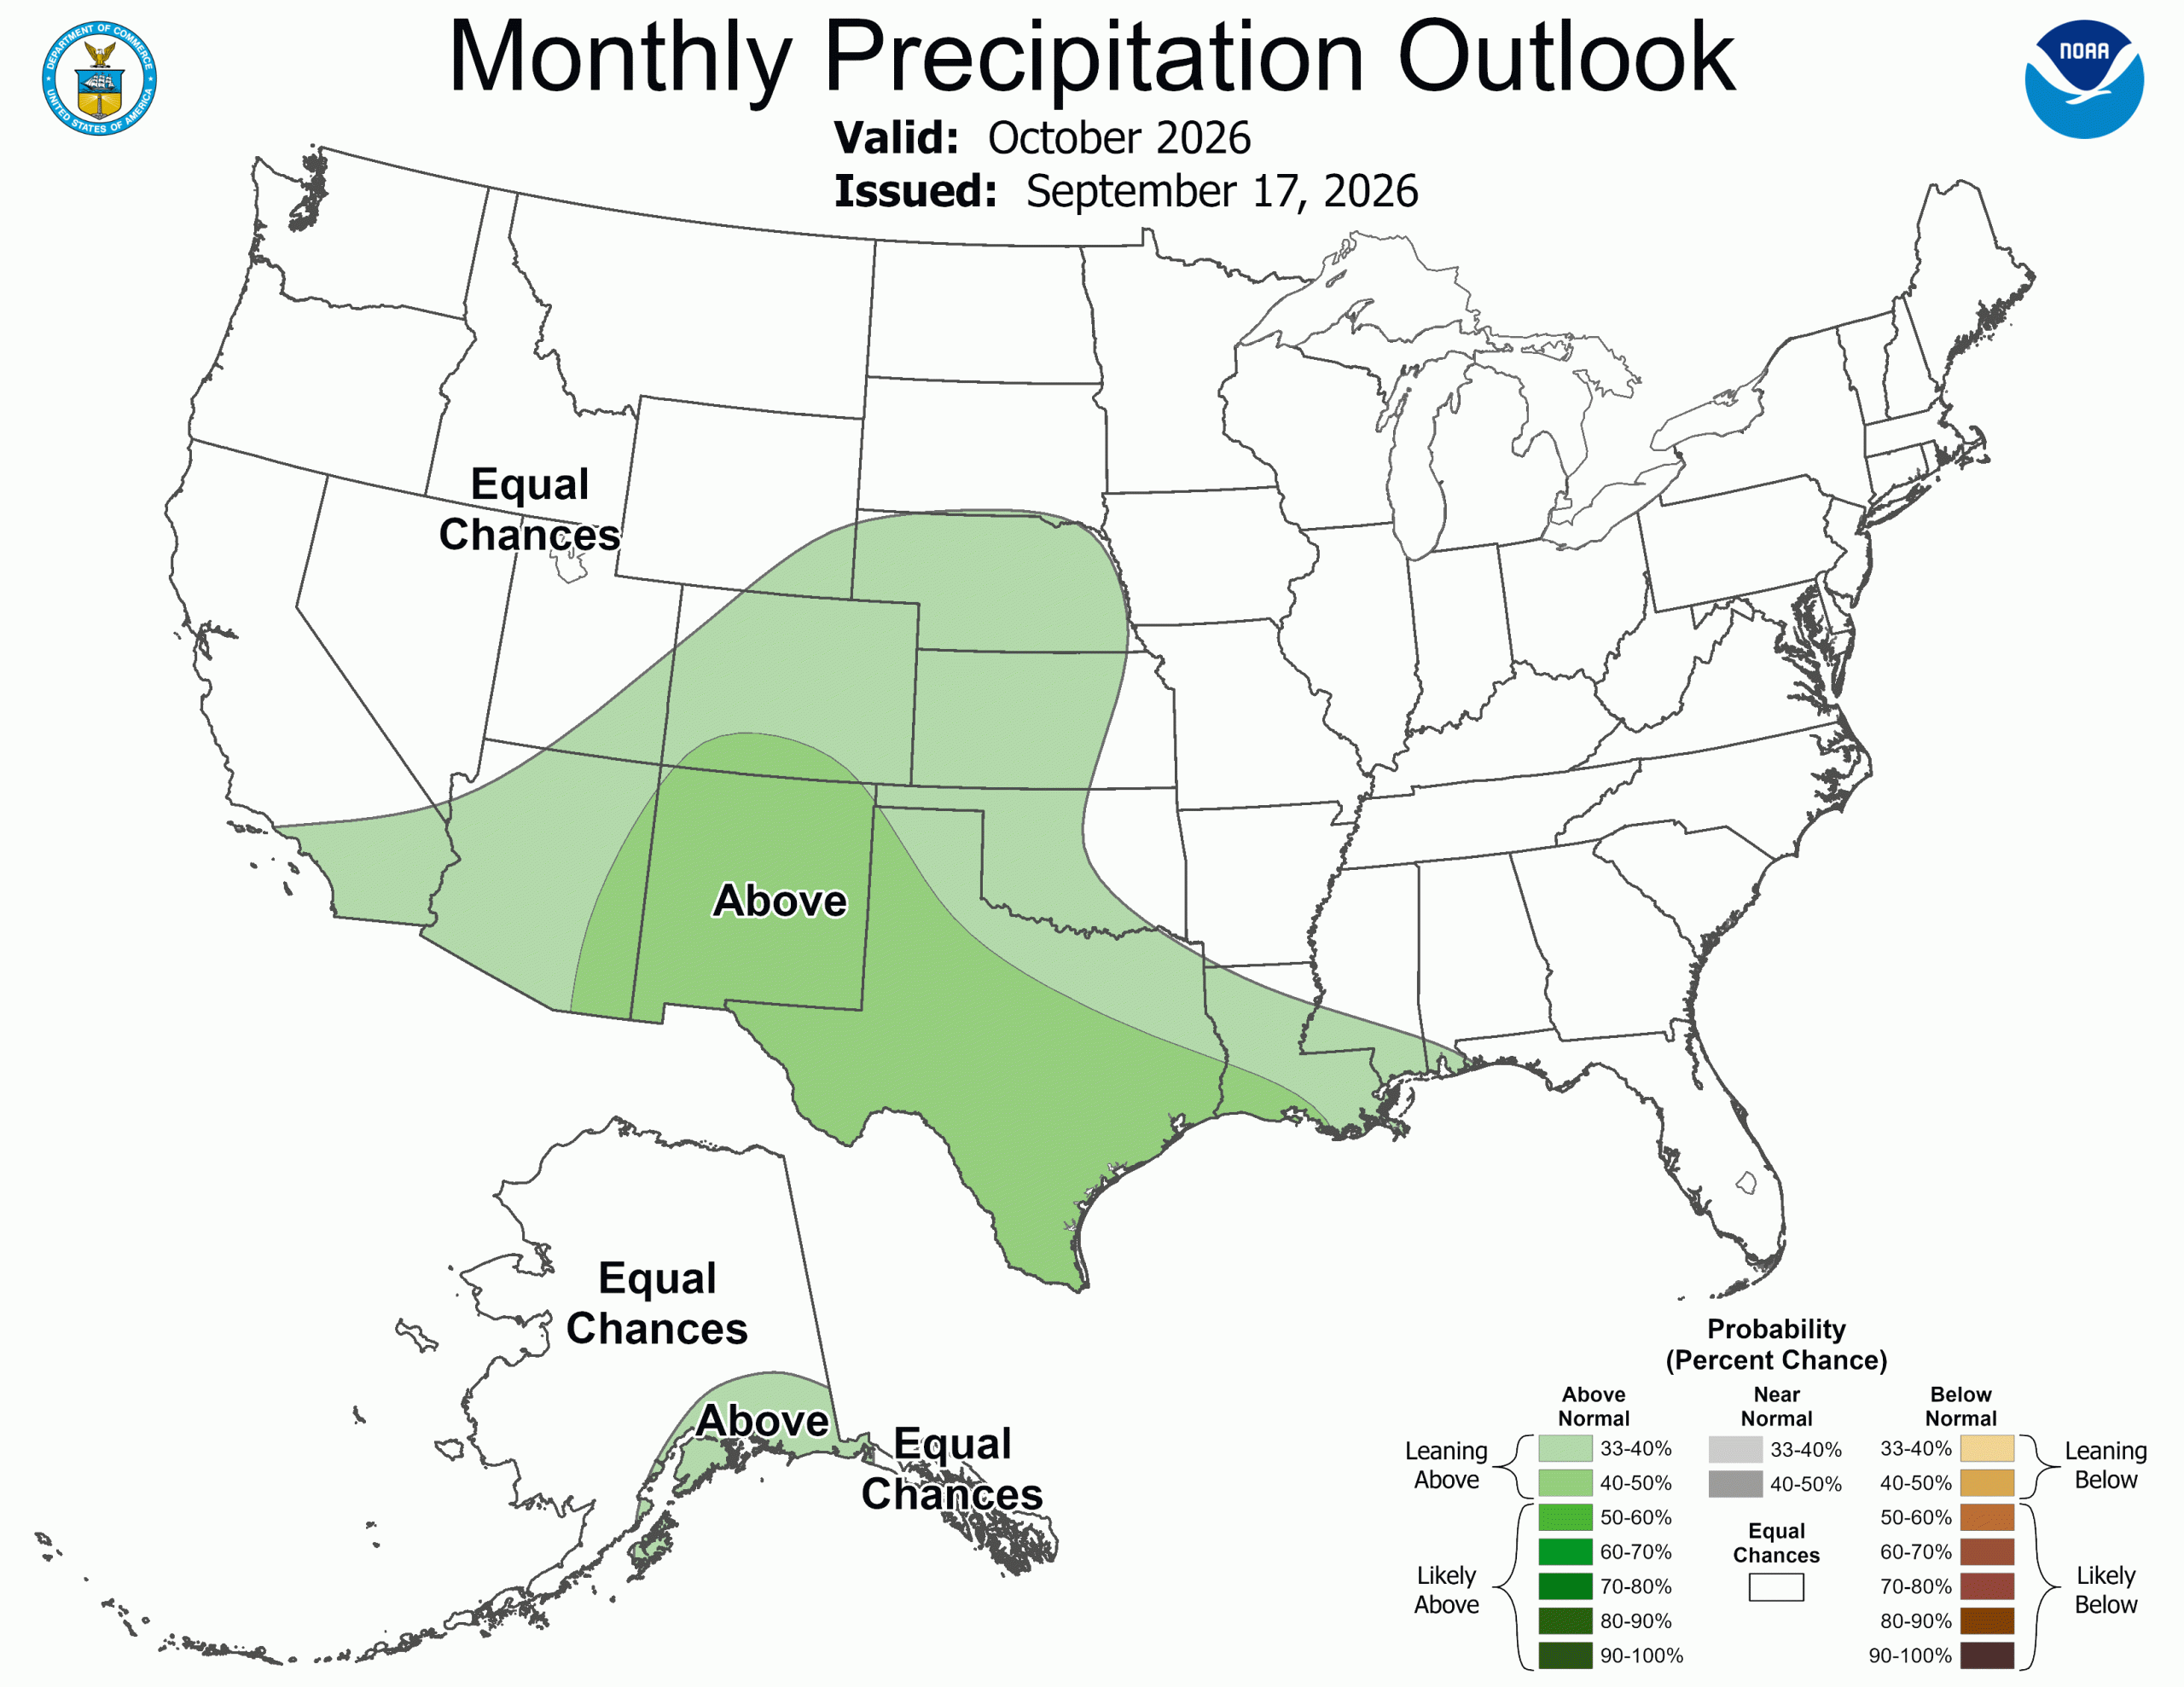
Image Description ↓
A NOAA map showing the monthly precipitation outlook for October 2026 across the United States, issued September 17, 2026. A green band extending from southern California and the Southwest through Texas, Oklahoma, Kansas, and the Gulf Coast shows a 33 to 50 percent probability of leaning above-normal precipitation, with a central area in New Mexico and west Texas reaching 50 to 60 percent probability. Coastal southern Alaska also shows leaning above-normal precipitation. Most of the northern, midwestern, and eastern US is unshaded, indicating equal chances for above, near, or below-normal precipitation.
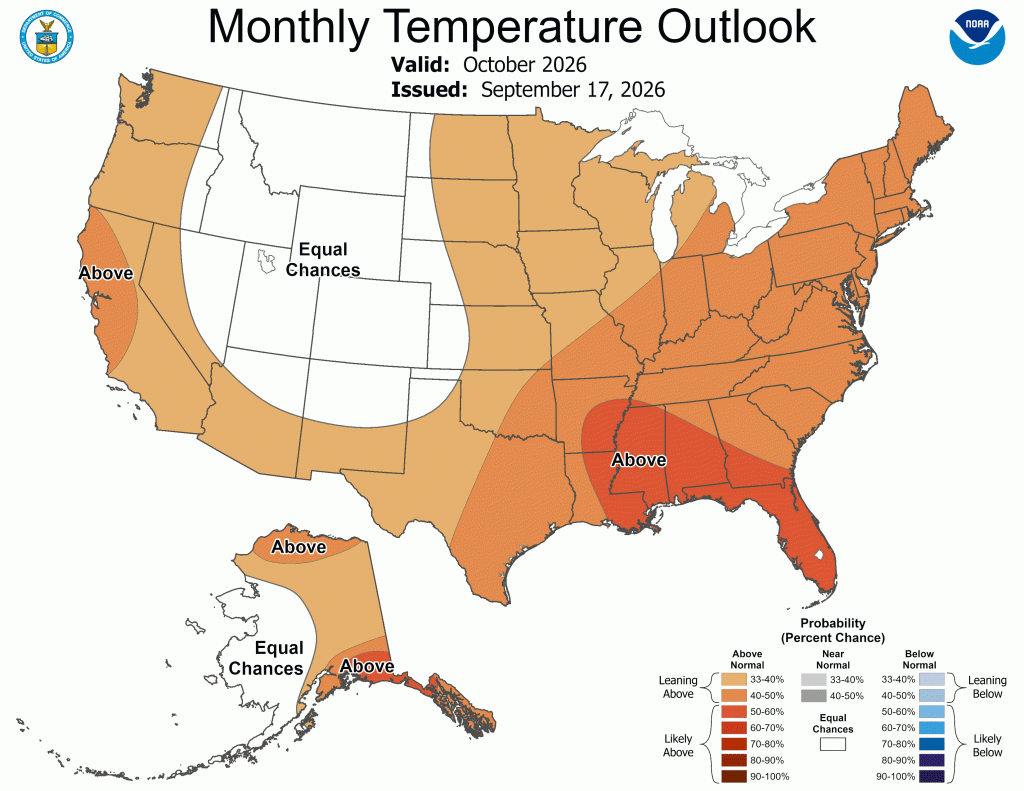
Image Description ↓
A NOAA map showing the monthly temperature outlook for October 2026 across the United States, issued September 17, 2026. Most of the eastern half of the country, the West Coast, and northern Alaska show a 33 to 50 percent probability of leaning above-normal temperatures, highlighted in orange. A darker orange-red area centered over Louisiana, Mississippi, Alabama, and western Florida indicates a 50 to 60 percent probability of above-normal temperatures. A region in the interior West and High Plains, spanning from Idaho and Utah through Wyoming, Colorado, New Mexico, and western Kansas, is unshaded, indicating equal chances.
- October: Across all of Wisconsin, temperatures are showing an above-normal lean (33-40% odds), with precipitation uncertain with “equal chances”.
- Statewide normals (1991-2020) for October 1-31 are 46.8°F and 3.01”.
90 Day Temperature and Precipitation Outlook
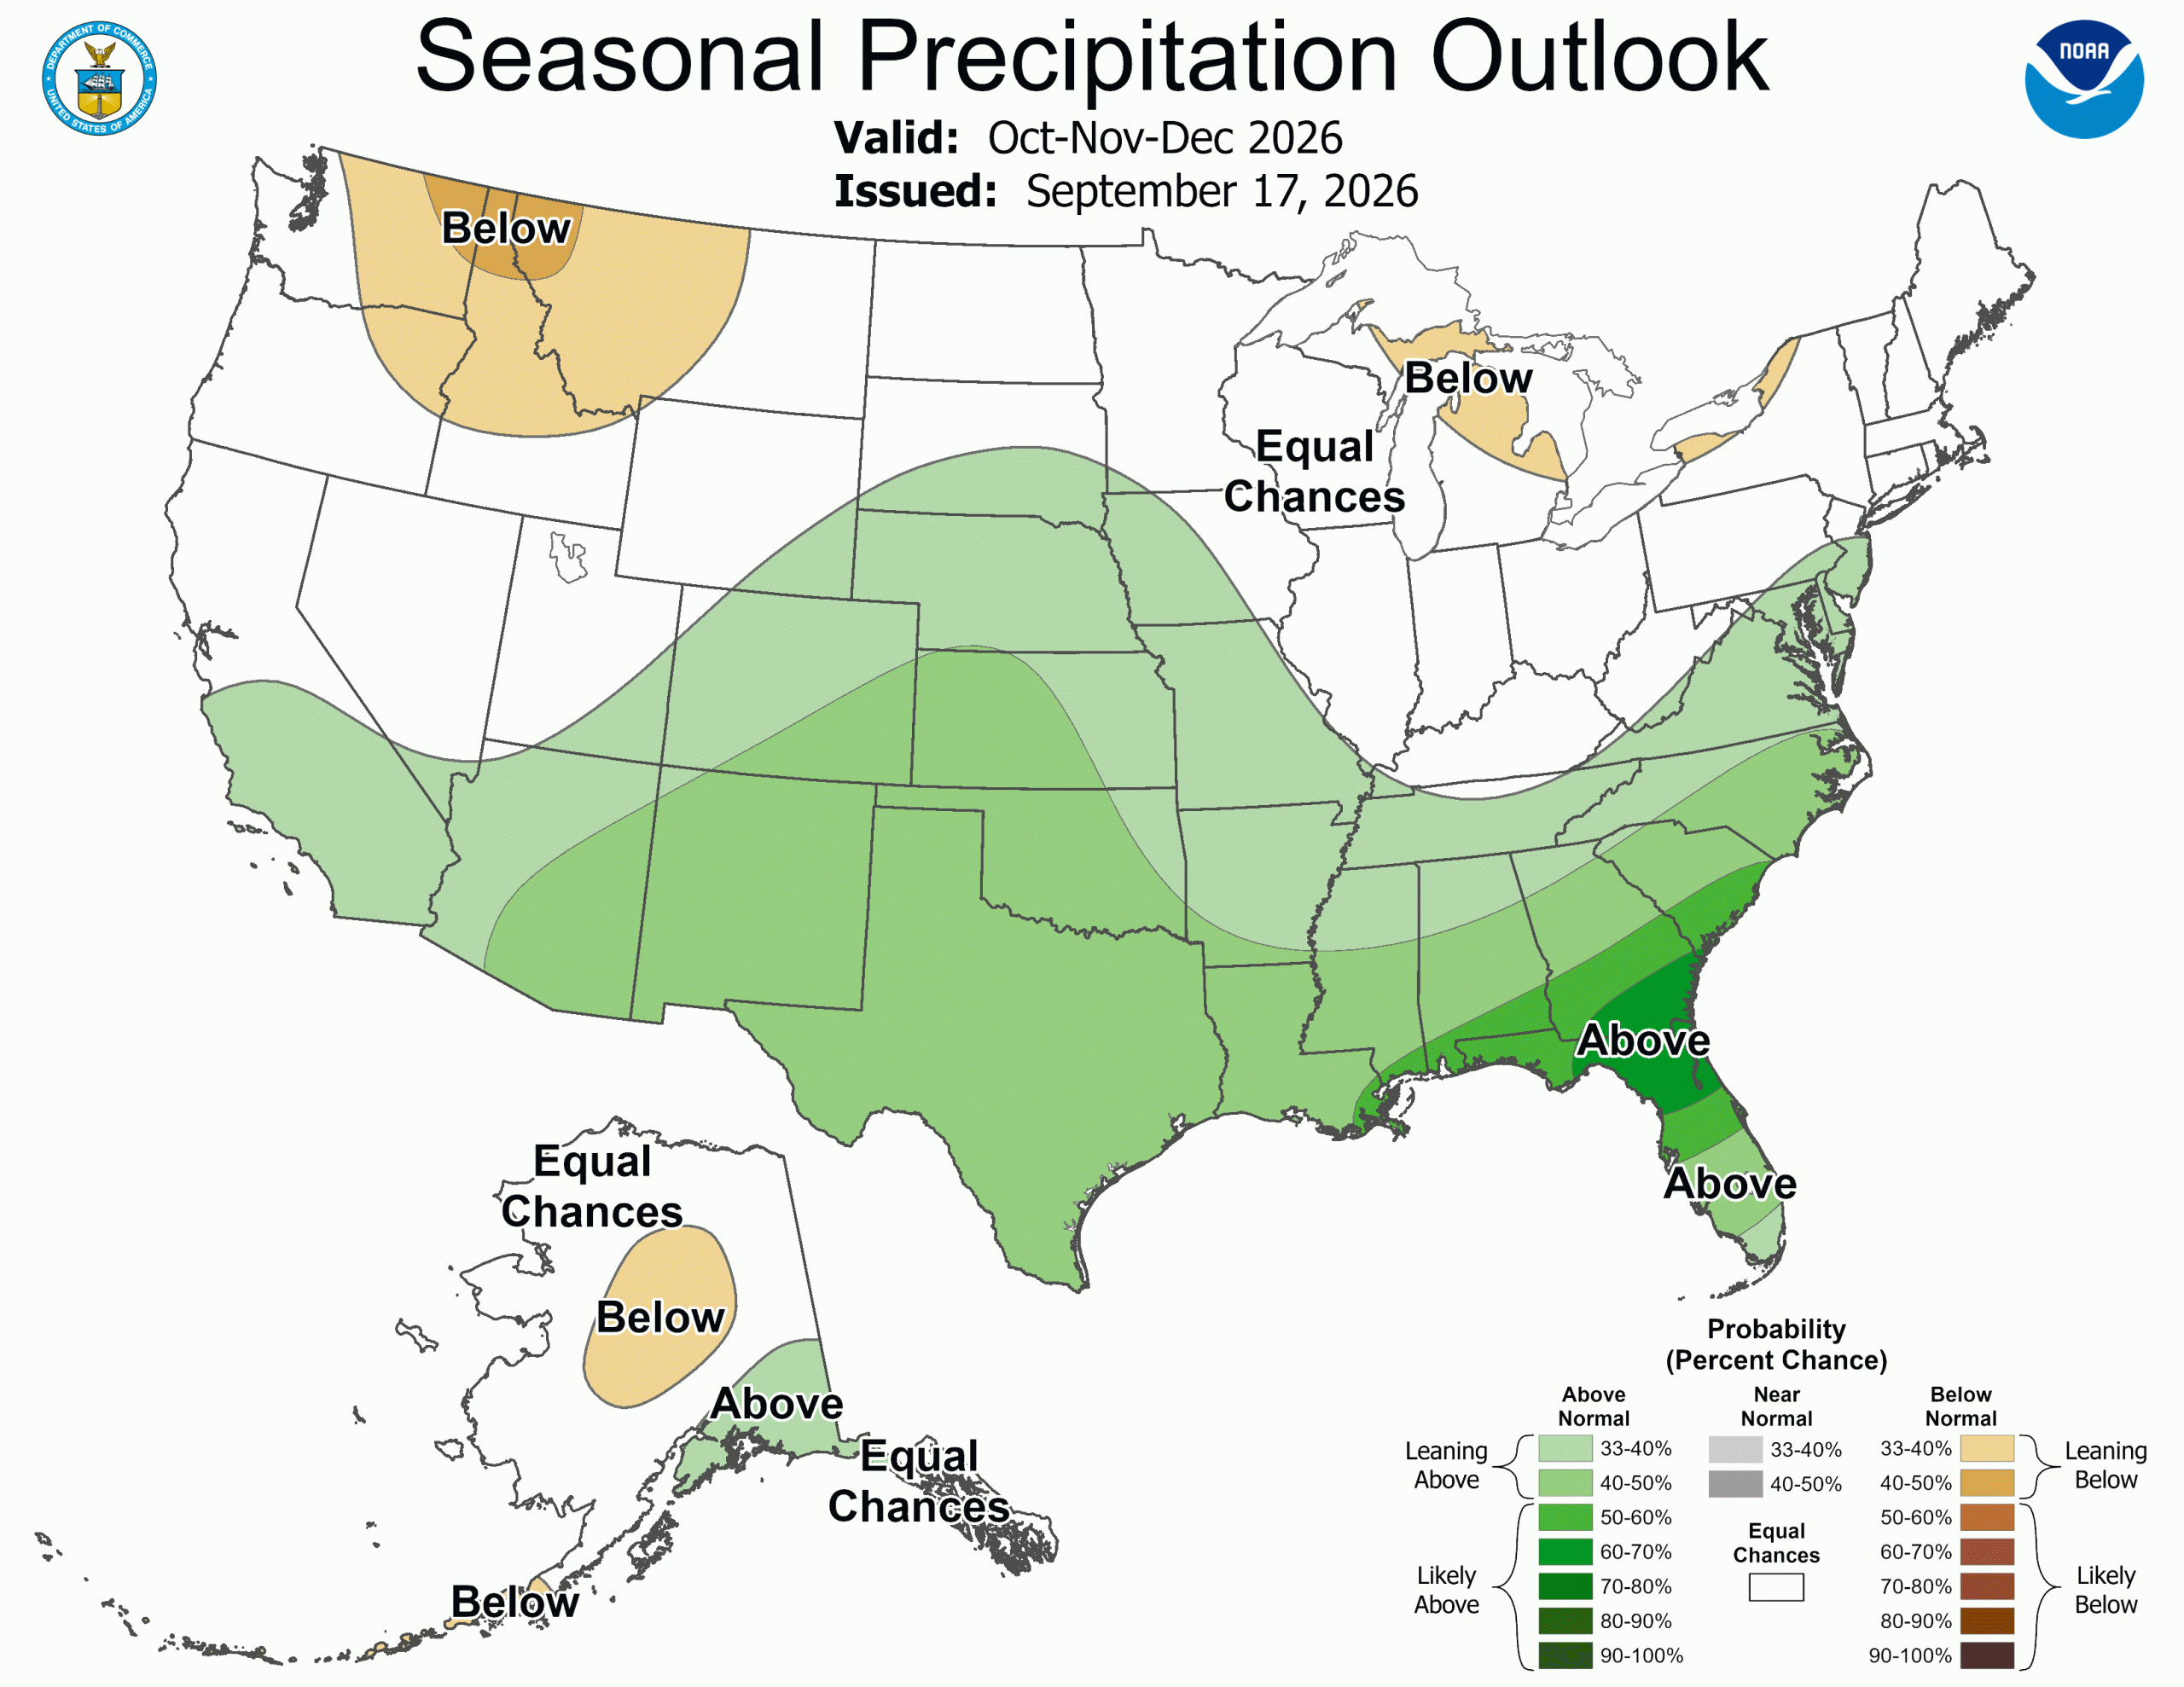
Image Description ↓
A NOAA map showing the seasonal precipitation outlook for the United States valid October through December 2026, issued September 17, 2026. Light green shading across the central US, Great Lakes, and Southeast indicates a 33 to 50 percent probability of leaning above-normal precipitation, with darker green along the Georgia and South Carolina coast indicating a 50 to 60 percent probability. Tan shading across the Pacific Northwest, northern Michigan, and central Alaska indicates leaning below-normal precipitation. The rest of the nation, including parts of the Midwest, Southwest, and Alaska, shows equal chances of above, near, or below-normal precipitation.
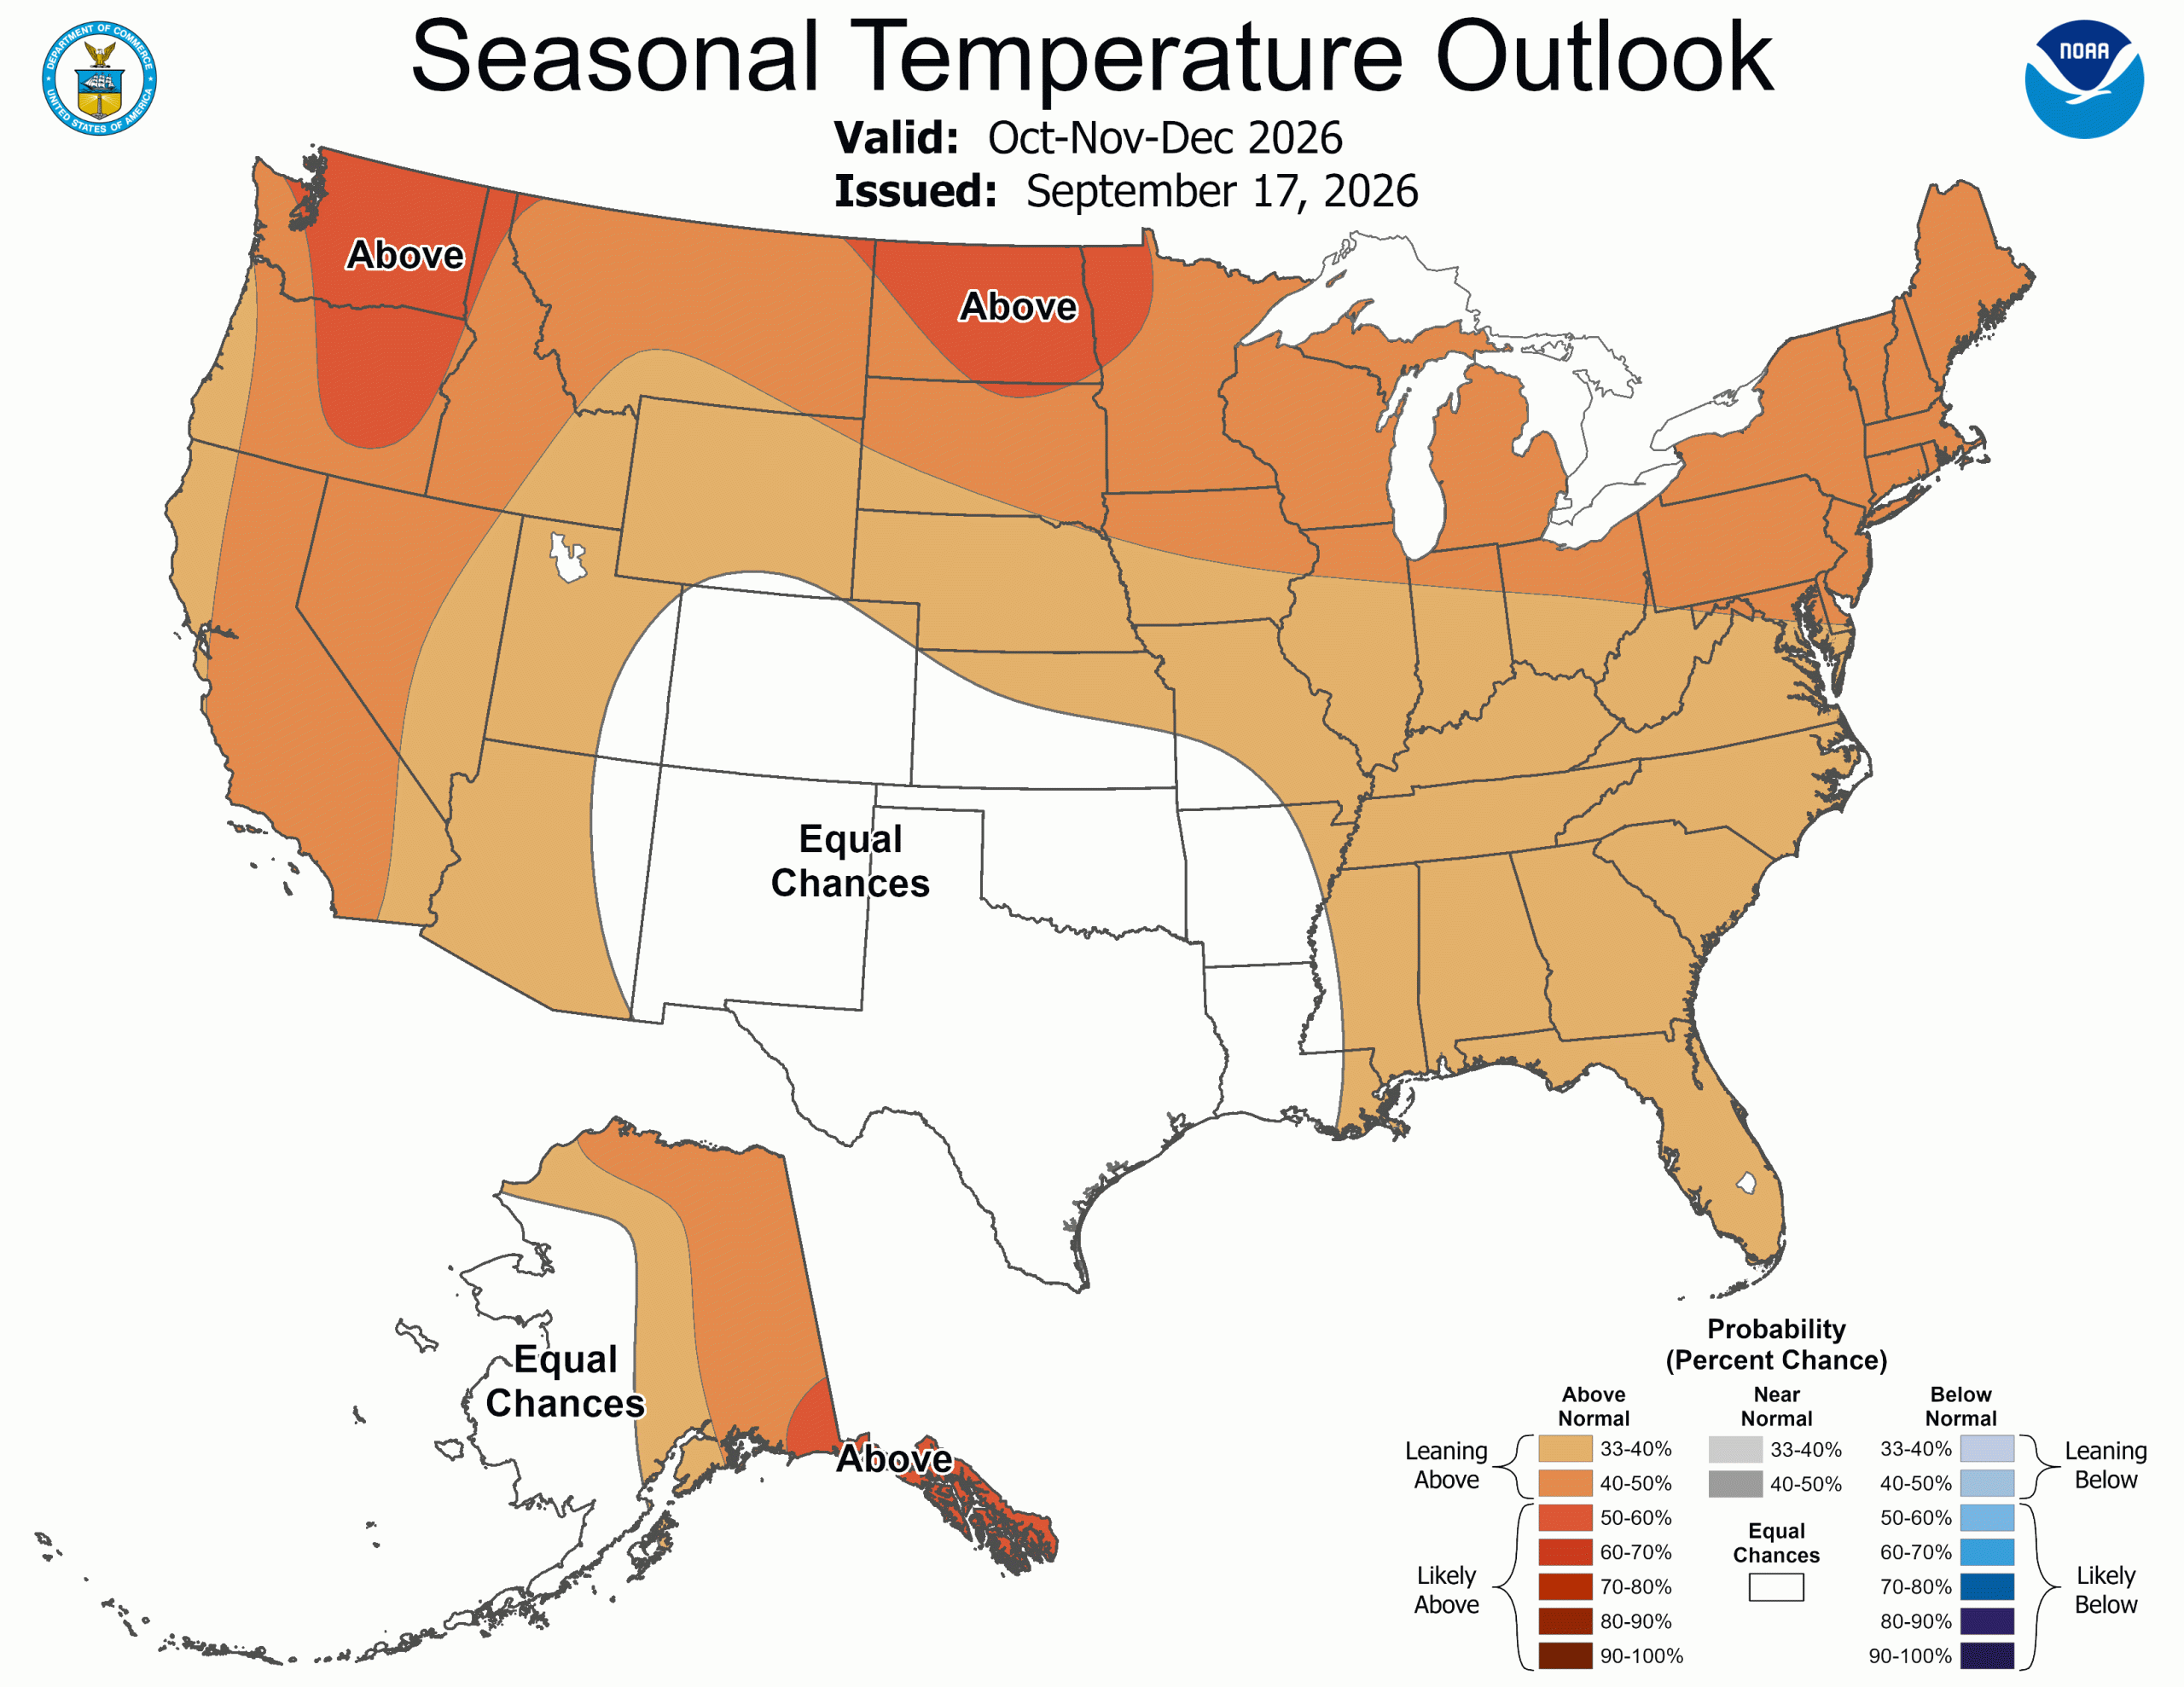
Image Description ↓
A NOAA map showing the seasonal temperature outlook for the United States valid October through December 2026, issued September 17, 2026. Almost the entire continental US and Alaska are shaded in orange shades indicating a 33 to 60 percent probability of leaning above-normal temperatures, with darker orange areas in Washington, Oregon, Montana, North Dakota, and southern Alaska indicating probabilities up to 60 to 70 percent. A white central section covering parts of New Mexico, Colorado, Texas, Kansas, Oklahoma, and Nebraska is designated as equal chances.
- Oct-Dec: Across all of Wisconsin, temperatures are showing an above-normal lean (40-50% odds), with precipitation uncertain with “equal chances”.
- Statewide normals (1991-2020) for Oct-Dec are 33.9°F and 6.52”.
User Survey
Are you a regular user of the Ag Weather Outlook for Wisconsin (AgWOW)? Or maybe you are viewing this page for the first time this week? Either way, we want to hear your feedback on this resource! Please take a few minutes and fill out this survey. Your feedback will help us better serve your ag-weather data needs through AgWOW.
If you have any trouble accessing or filling out the survey, please email Josh Bendorf at jbendorf@wisc.edu. Thank you!