

Overview
Efficient use of nitrogen (N) is essential for crop production, whether the nitrogen source is commercial fertilizer, manure, legumes, or some combination. Assessing different nitrogen rates on a per-field basis is a valuable first step in evaluating your N fertilizer management.
Metrics such as yield, economic return, and pounds of N per bushel of corn (a nitrogen use efficiency metric) can be relatively simple and offer insight into how N is currently being managed and implications for productivity, profitability, and water quality.
This protocol provides an easy and effective entry point for farmers interested in investigating their current nitrogen management and opportunities to improve. Through this assessment, participants will:
- Receive resources, tools, and guidance to support on-farm data collection and sampling.
- Investigate a reduced nitrogen rate in comparison to their current nitrogen rate on their farm.
- Receive an individualized report with yield, economic return, and the difference in pounds of N per bushel of corn (a nitrogen use efficiency metric) in the reduced N rate strips compared to the full N rate strips.
- Learn together with other NOPP participants about strategies to optimize nitrogen management
Projects derived from this protocol are designed to provide insights into field-specific nitrogen needs.
The project requirements described in this protocol align with the research requirements of the DATCP’s Nitrogen Optimization Pilot Program (NOPP) grant Reduced Nitrogen Rate Project Option but can be used independently on your own farm to investigate nitrogen needs. Current funding opportunities for NOPP can be found here.
This protocol was developed by the UW-Madison Department of Soil and Environmental Sciences and Division of Extension.


If you’re applying for a NOPP grant, specific project details can be discussed with UW Nitrogen Management Outreach Specialist (megan.blauwet@wisc.edu).
Project Design
Overview
With the Reduced Nitrogen Rate protocol, you will:
- Investigate nitrogen rate reduction potential by implementing 3 reduced nitrogen strips, which are strips that receive at least 20% less nitrogen than the current rate.
- Track nitrogen throughout the season through N inputs, exports, and soil and plant analyses.
- Calculate difference in yield, economic return, and nitrogen use efficiency of the current rate compared to the reduced rate.
Collaboration
Participants may benefit from collaborating with local partners for assistance in implementing the reduced nitrogen strips and/or collecting samples throughout the season. Consult with your agronomist, local land and water conservation departments, or UW–Madison Extension staff about collaborating on this project prior to applying.
Field Selection
Participants should select fields to monitor. Ideal fields will be relatively uniform, accessible for routine data collection and scouting, and representative of other fields/management histories on the farm. If using a yield monitor to determine yield, fields need to be at least 350 ft long.
Establishing Reduced Nitrogen Strips
A reduced nitrogen strip is a test strip that receives at least 20% less synthetic nitrogen than the current nitrogen rate. Yield from these strips compared to the normal N strips can provide potential opportunities to reduce nitrogen rate without substantial yield loss or verify that your current nitrogen rate has greater economic value. Follow the guidance below on how to establish 3 reduced nitrogen rate strips:
- Select a representative area in the field with a uniform soil type.
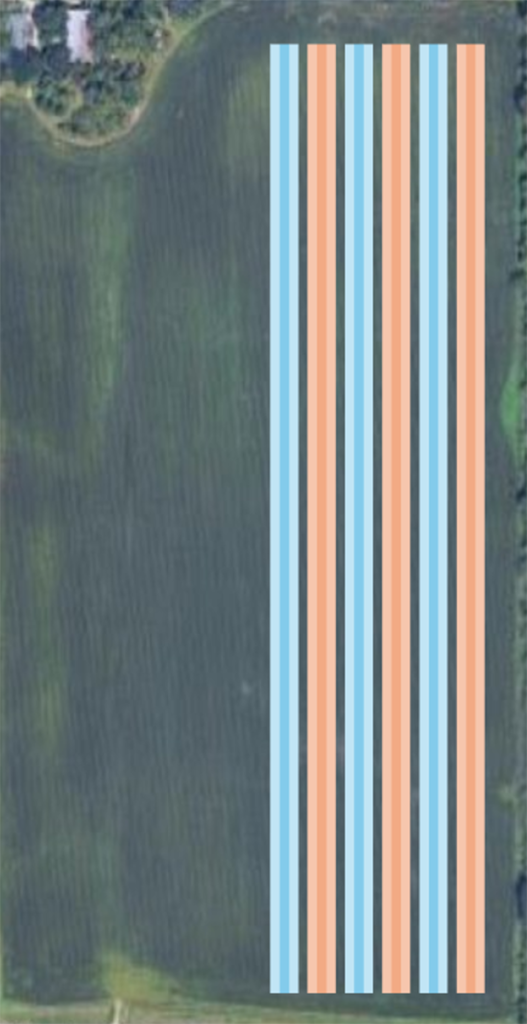
- You will have 3 reduced N rate strips and 3 full N rate strips, which are adjacent strips that receive your current N rate and will serve as a direct comparison to the reduced N strips. See an example below.
- Strip width is dependent on your equipment, including N applicator and harvester widths. It is recommended that strips are at least 3 combine widths and a length of at least 350 feet, but full field strips are recommended for ease of data collection. Note that the longer the length, the easier it will be to obtain accurate yield data.
- If you are equipped to do so, creating a GPS boundary or a prescription for the strips can make it easier to avoid incorrect in-season N applications and obtain yield data from the monitor, if available.
- Additionally, or if you do not have GPS software, flag off the four corners of the strip area using tall stakes and flags so that you can see the plot during in-season applications. This is especially important if you will not be the one applying N.
Reduced Nitrogen Rate Field Setup
Field Example
Legend
|
>350 ft. in length |
|
↑ | | | Buffer |
|
|||||||||||||||||||
Arrows indicate the direction of the combine. Yield data from the middle combine pass is used to provide a buffer between treatments. Design of strips can be adjusted based on field and equipment.
As you consider how best to lay out and mark the test strips, connect with the UW team to receive any assistance.
Data Collection
Required sampling and data collection will provide crucial insights into how nitrogen is entering, cycling and leaving the field being monitored. Participants can investigate additional metrics of interest (see optional data below) as their budget allows. In the data collection information below, “treatment” refers to the “reduced N strips” and “full N strips.”
Required Data and Sampling – All Sites
- Field history and management data (data collection survey will be provided).
- Routine soil (pH, OM, P, K, etc.) sampled across trial area as one composite sample.
- Pre-plant soil nitrate and ammonium at 0-1’ and 1-2’ prior to nitrogen application: 3 samples per field.
- Pre-sidedress soil nitrate and ammonium (or in-season sampling if all N was applied at plant) at 0-1’: 3 samples per field.
- Yield data from a calibrated yield monitor or weigh wagon.
Required Data and Sampling – If Applicable
- Manure analysis (if manure applied during this crop year): 1 sample per application.
- Cover crop sample (if field has cover): 1 composite field sample at time of termination.
- Irrigation nitrogen content (for irrigated fields): 1 sample per field.
Optional Data Collection and Sampling Examples
- Grain nitrogen content (for corn grain fields): 1 sample per treatment.
- Post-harvest soil nitrate and ammonium at 0-1’ and 1-2’: 1 each per treatment.
- Soil nitrate and ammonium sampling the following spring: 0-1’ and 1-2’, 1 each per treatment. This sampling is highly recommended for those interested in investigating potential nitrate leaching risk during the shoulder season following corn
- Cover crop forage quality: 1 composite
- Whole plant nitrogen content (whole-plant silage or stover for grain fields): 1 per treatment just prior to harvest
- Corn silage forage quality: 1 per treatment just prior to harvest
- Leaf tissue samples: 1 per treatment
- Soil health metrics: Recommend 1 per field, prior to nitrogen application. An overview of common soil health metrics can be found here.
Project Timeline
| Timeframe | Activities |
|---|---|
| Winter through spring | Select field(s) you want to monitor Cover crop biomass sampling/analysis (prior to winter kill or termination, if applicable) Manure analysis if manure is being applied |
| Spring (before planting) | If reducing N at plant, flag out/implement reduced N and full N strips with flags, or by using a shapefile Take a routine soil sample Take a pre-plant soil sample for nitrate and ammonium |
| In-Season | If reducing N at sidedress, flag out/implement reduced N and full N strips with flags, or by using a shapefile Pre-sidedress soil sample for nitrate and ammonium Irrigation nitrate (if applicable) Calibrate your yield monitor and review yield monitor data collection instructions (unless using a weigh wagon) |
| Harvest | Harvest |
| Post-Harvest | Submit soil, agronomic, and yield data to NOPP team Receive results (early spring) |
Projects derived from this protocol are designed to provide insights into field-specific nitrogen needs.
The project requirements described in this protocol align with the research requirements of the DATCP’s Nitrogen Optimization Pilot Program (NOPP) grant Reduced Nitrogen Rate Project Option but can be used independently on your own farm to investigate nitrogen needs. Current funding opportunities for NOPP can be found here.
This protocol was developed by the UW-Madison Department of Soil and Environmental Sciences and Division of Extension.