
Weather and climate conditions this week in Wisconsin
Here are this week’s take-home points about the weather. As a reminder, AgWOW reports will be published weekly throughout the growing season. Scroll down for the full report.
Additionally, we’re collecting user feedback. Regardless of whether it’s your first time here or if you are a regular user, we’d love to hear from you!
Key Points
Recent Conditions
- Temperatures were 2-4°F below normal across northern counties. Further south, temperatures were close to normal.
- Precipitation totals last week were low for late May across Wisconsin, with most locations receiving less than 0.25”. The last 30 days have also been drier-than-normal across the state.
Impact
- Soil moisture levels at 4” depth across Wisconet research farm stations were typically near to below last week’s levels, following a relatively dry week for most.
- Satellite-based soil moisture models indicate near-normal moisture levels across most of Wisconsin, with abnormal dryness indicated across southeast and west-central counties.
- The latest drought monitor map indicates a large increase in D0 (abnormally dry) across northwest, west central, and southeast counties. However, Wisconsin remains drought-free.
- Corn, soybean, and oat planting are all nearing completion, according to the latest NASS report.
Outlook
- Rain chances over the next 7 days are very minimal across the state. There could be some light rain in the northwest counties during the middle of next week.
- The outlook for early June indicates elevated chances (50-70% chance) for above-normal temperatures.
- Across most of Wisconsin, temperatures and precipitation for June and summer (Jun-Aug) are uncertain currently with equal chances for above, near, or below normal conditions.
Agronomic, Fruit and Vegetable Considerations
Field Conditions
- Risk of frost is no longer a concern. Warm temperatures this week will boost growing degree days.
- Pay attention to drought stress on sandier grounds with lack of recent precipitation.
Forage Management
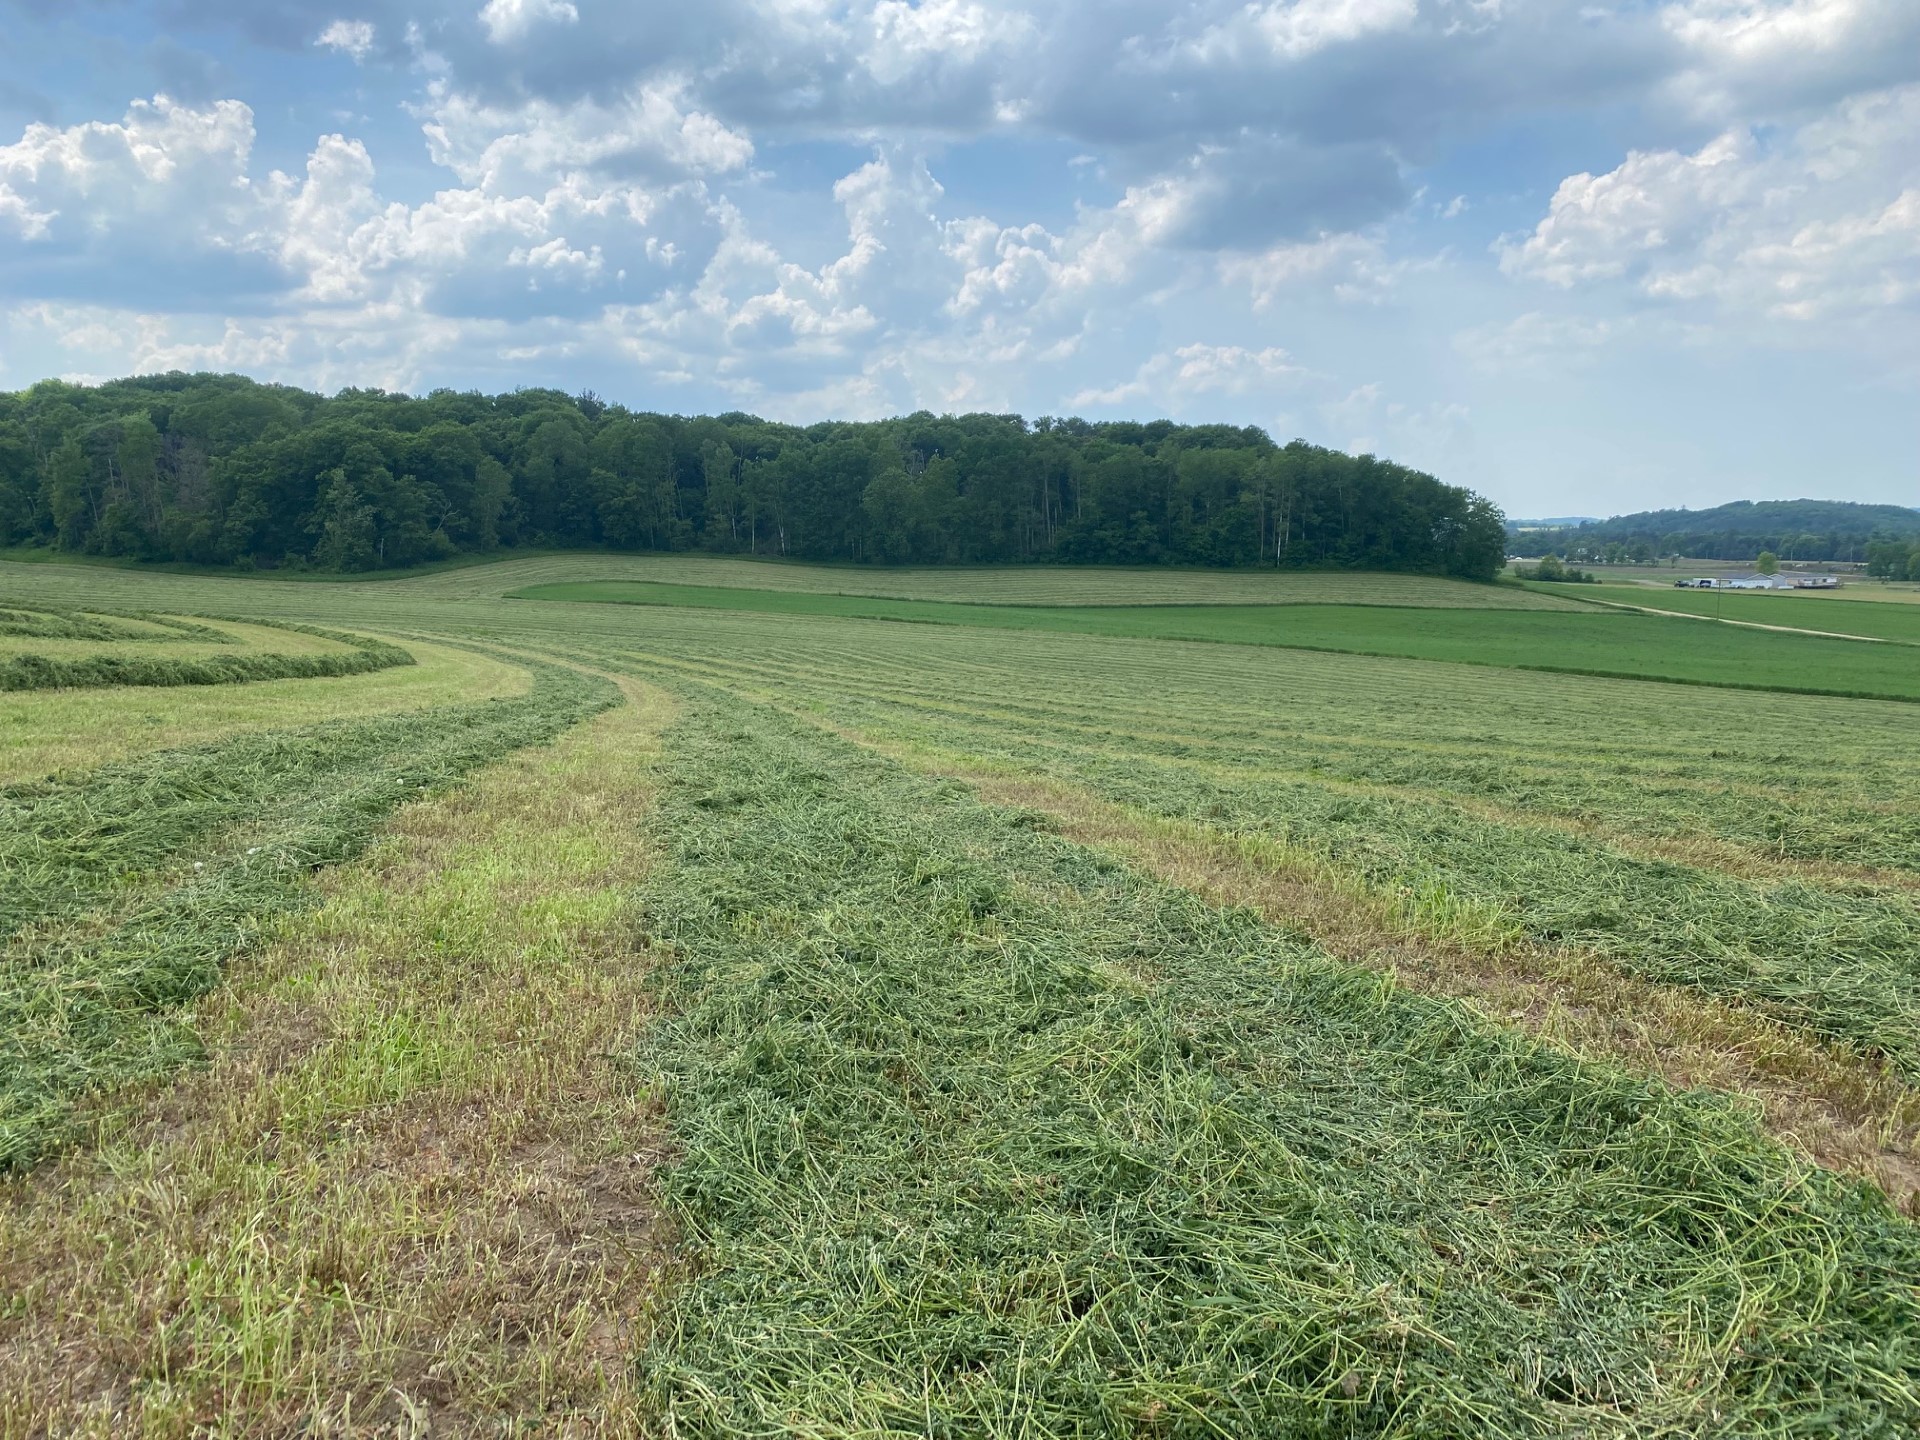
- First crop alfalfa is being harvested in Southern WI. Consider using a PEAQ (Predictive Equations for Alfalfa Quality) stick to estimate relative feed value as you decide when to make the first cut.
- As scissor clips take place throughout the state, find UW and UMN quality data using the Alfalfa Harvest Alert dashboard.
Pest Management
- Start scouting fields on foot to note which weed species are emerging.
- Be observant of black cutworm and true armyworm moths migrating through the state. Check the DATCP Pest Trap Network Maps. It is likely that first generation true armyworm will miss corn crops. The second generation is of most concern. Watch the 2026 True Armyworm Forecast.
- Primary seedling corn damage for black cutworm is in the second half of May. Scout emerging corn for signs of cutworm feeding.
- Hot and dry weather can reduce herbicide efficacy.
- Continue scouting for alfalfa weevil larva. Weevil larvae have the greatest impact (quality and yield) on first and second alfalfa cuts. Be sure to walk fields looking for evidence of this pest. Larvae are present in the southern half of the state. Fields that have been harvested are seeing feeding on second crop regrowth.
- SlugNet is trapping again in 2026! Review weekly trap catches across the state. Observe fields (especially fields with reduced tillage and cover crops) for any signs of slug damage.
Manure Applications
- Reminder of Wisconsin’s NR 151 Runoff Rules with the timing of manure spreading and current runoff levels. Check DATCP Runoff Risk Advisory Forecast.
Small Grains
- Scout small grains for signs of disease. This includes powdery mildew and stripe rust, especially in susceptible varieties. Stripe rust was confirmed in Wisconsin last week. Use the Crop Risk Tool and Fusarium Risk Tool for guidance as Fusarium Head Blight becomes the next disease of concern.
- Staging small grain growth is important for fungicide timing as diseases are emerging. Review growth stages here.
Fruit Considerations
- Wisconsin fruit growers can reference the Midwest Fruit Pest Management Guide for a list of registered products and recommended best practices. View the MFPMG Online.
- Apple growers can reference the NEWA weather station network to monitor disease infection events for apple scab and fire blight. Make sure to keep track of green tip and petal fall dates. Check out your nearest weather station: NEWA Weather Station Network (Cornell).
- Fruit growers impacted by spring freeze damage may reference our recent article on Resources for Fruit Growers Impacted by Spring Freeze Events.
- Codling moth have been captured in Southern WI. Make sure to check traps after warm, calm evenings to establish a biofix date. Biofix occurs when ~5 or more moths are captured in one evening, or captured across consecutive nights. First generation larvae will emerge after ~250 degree-days base 50℉ from the biofix date.
- Keep track of degree-days (base 50℉) from petal fall to determine the end of plum curculio movement into the orchard. Plum curculio will continue movement into the orchard until ~308 degree-days base 50℉ have accumulated from petal fall.
- Grape growers can begin fertilization prior to bloom and should review last year’s petiole analysis to determine nutrient needs. Check out this recent UW Fruit News article on Fertilizing Wine Grapes.
- Grape growers may reference our recent article on Post-Freeze Disease Management.
- Strawberry growers may consider reviewing scouting and management strategies for thrips, tarnished plant bug and mites.
Vegetable Considerations
- 4-inch and 8-inch soil temps are in the low to mid 60s in the early morning in some parts of southern WI while central and northern WI are mid 50s to low 60s. Pumpkins and squash can now be planted in many part of the state with temps above 60°F and now that the danger of frost has passed. For melons, soil temperatures are ideally 70°F, but if you want to plant early, check to make sure soil temperatures do not get below 60°F during the early morning and that air temperature is not forecasted to drop below 50°F. Field tomatoes and peppers can be planted in the coming week in many areas as soil temps are at least 60°F.
- Ensure garlic is receiving adequate moisture, between 1 and 2 inches per week, during bulb formation. For more information on growing garlic, check out this resource from Michigan State.
- Problems of onion thrips have been reported. Onion thrips overwinter in legume fields and as the first alfalfa crop is starting to be harvested, risk of them migrating into your vegetables increases. Scout weekly and pay particular attention to field edges are this pest is more common there early in the season. Scouting tips and management information can be found here and here.
- In addition to onion thrips, alfalfa harvest also means that aster leafhoppers will be on the move. MSU traps and checks infectivity levels in Michigan. Sign up for text alerts here to get an idea of how infectivity levels are changing throughout the season. Aster leafhoppers spread aster yellows which can cause significant damage to a range of crops including garlic, lettuce, carrots, and parsley. Control of aster yellows depends on control of the aster leafhopper. Management options include floating row covers, planting resistant cultivars, and insecticides.
- Start scouting for Colorado potato beetle. Focus on border rows and scan soil surrounding plants to help with early detection as adults will drop from plants as a defense tactic. The highest density is typically in fields adjacent to last year’s crop. Adults will begin laying eggs 7-10 days after initial colonization. Examine the underside of leaves to look for bright yellow to orange eggs that are laid in clusters. Initial perimeter applications may begin in the next week. Check out the latest Vegetable Crop Update for more information.
- Striped cucumber beetles over winter in WI and emerge in mid to late May. Eggs are laid at the base of cucurbit plants. Once larvae hatch, they feed on roots and stems and can cause stunted growth or even kill seedlings. Adults feed on foliage and fruit and can spread bacterial wilt which can cause severe losses in cucumber and muskmelon. It is important to scout and, when necessary, control beetles early in the season to reduce risk of spreading this bacterial wilt. Control measures include dipping seedlings in kaolin clay prior to transplanting, floating row cover or high tunnel insect exclusion screens, and perimeter trap cropping.
- The risk of western flower thrips is now high or very high in southern and central WI although risk is starting to decrease in very southern WI. Risk is increasing in northern WI and peak activity will occur in the next couple of weeks. Early detection is key as control can be very difficult. Iowa State has a few useful videos on scouting: tip on finding thrips and tips on spotting thrips damage on cucumber transplants. One option to reduce risk is dipping plants in a horticultural oil or insecticidal soap right before transplanting. Some other control options include row cover, reflective mulch and weed management as weeds such as chickweed and lambsquarters serve as alternative hosts.
- Damping off of seedlings is caused by Rhizoctonia, Fusarium and Pythium. These pathogens are soil borne and thrive in cool and wet conditions. Seedlings are susceptible for a short time following emergence, but susceptibility declines quickly as the plants grow. Infection leads to lower stem girdling and collapse. Some treatment options include planting as shallowly as agronomically allowable to encourage quick germination, not overwatering, and using fungicides treated seed.
- Risk of crop damage from asparagus beetle larvae is now high or very high for northern WI. When scouting, sample twenty plants from five different areas to determine if you have reached the threshold for treatment. Row cover can be a good option to exclude the beetles if eggs have not already been laid.
- Imported cabbageworm adults, white butterflies with black markings on wingtips, are now active throughout the state. Scout for eggs which are laid as a single egg that are yellow to orange in color. Eggs hatch in about 5 days. Larvae will start hatching soon in southern WI. Young plants can be particularly susceptible to damage. If you plan to use insecticides, be sure to count larvae to get the most accurate idea of infestation level. Treatment thresholds can be found here. Time application to larval hatch as they are most susceptible when small.
- Start scouting for diamondback moths which overwinter in WI as adults. Adults fly at night so can be hard to detect. When scouting, look for eggs on the underside of leaves. Eggs are flat and cream colored and can either be laid singly or in a cluster. They will hatch within about a week of being laid. Floating row covers work well to protect small plantings and a parasitic wasp, Diadegma insulare, can do a good job of keeping this pest in check. Young transplants are more susceptible to damage so the threshold for management is when 10% of plants are affected.
- Swede midge is another brassica pest. They feed on growing points leading to distortion and scarring on leaves. Depending on when infestation occurs, they can also lead to uneven or even complete loss of a head or crown. While there are pheromone traps for swede midge, they can be difficult to use as it is hard to distinguish from other flies. They can be difficult to detect because larvae hide in growth points but an indicator can be a wet growing tip due to burst cells from larvae feeding. Some control options include insect netting, avoiding the use of brassica cover crops, and removing brassica weeds that can serve as alternative hosts.
- Onion maggot adult flight peaks are occurring now in NW WI around Hayward, Rhinelander and Crivitz. Use the Vegetable Disease and Insect Forecasting Network to see the risk in your area. Preventative soil insecticide applications are recommended for the first generation larvae if damage to the last year’s crop was over 5-10%. For small plantings of onions, row cover can be effective if adults are not yet active in your area.
- Risk from the first generation of adult seed corn maggots is now decreasing in northern WI- take advantage of the decreasing risk to plant. In southern WI, the second generation activity is now at peak. If possible, delay planting crops including beets, green beans, and pumpkins during peak emergence. If you cannot delay planting, promote faster germination by planting seeds as shallowly as agronomically possible. More management options can be found here. Check risk for your specific area using the Vegetable Disease and Insect Forecasting Network.
- Cabbage maggot peak egg laying is now occurring across the state with the exception of along Lake Superior. Cabbage maggots overwinter as larvae in the top several inches of soil. When the adults emerge, they are attracted to freshly tilled fields with decaying organic matter. They thrive in wet and cool conditions. Treatment is primarily preventative. When possible, till in cover crops 2 to 3 weeks before planting to reduce attractiveness. If possible, delay planting to avoid peak emergence. Floating row covers are also a good option during peak activity.
- Black cutworm moths are migrating into WI. Check the DATCP trap catch maps for counts in your area. Black cutworm larvae feed on newly emerged crops and prefer direct seeded crops over transplants. Many crops are susceptible to damage including beets, carrots, cucumber, leafy greens, sweet corn and squash. Management options include weed management as females prefer to lay eggs in weedy areas and avoiding the use of green manure in areas where cutworms tend to be a problem. For chemical control to be effective, early detection is key. If chemical treatment is necessary, begin treating at the first signs of cutting and repeat every 7 days until 1000 degree days are reached.
Dive deeper into each report section by clicking a topic below.
Precipitation Trends
7 Day Precipitation
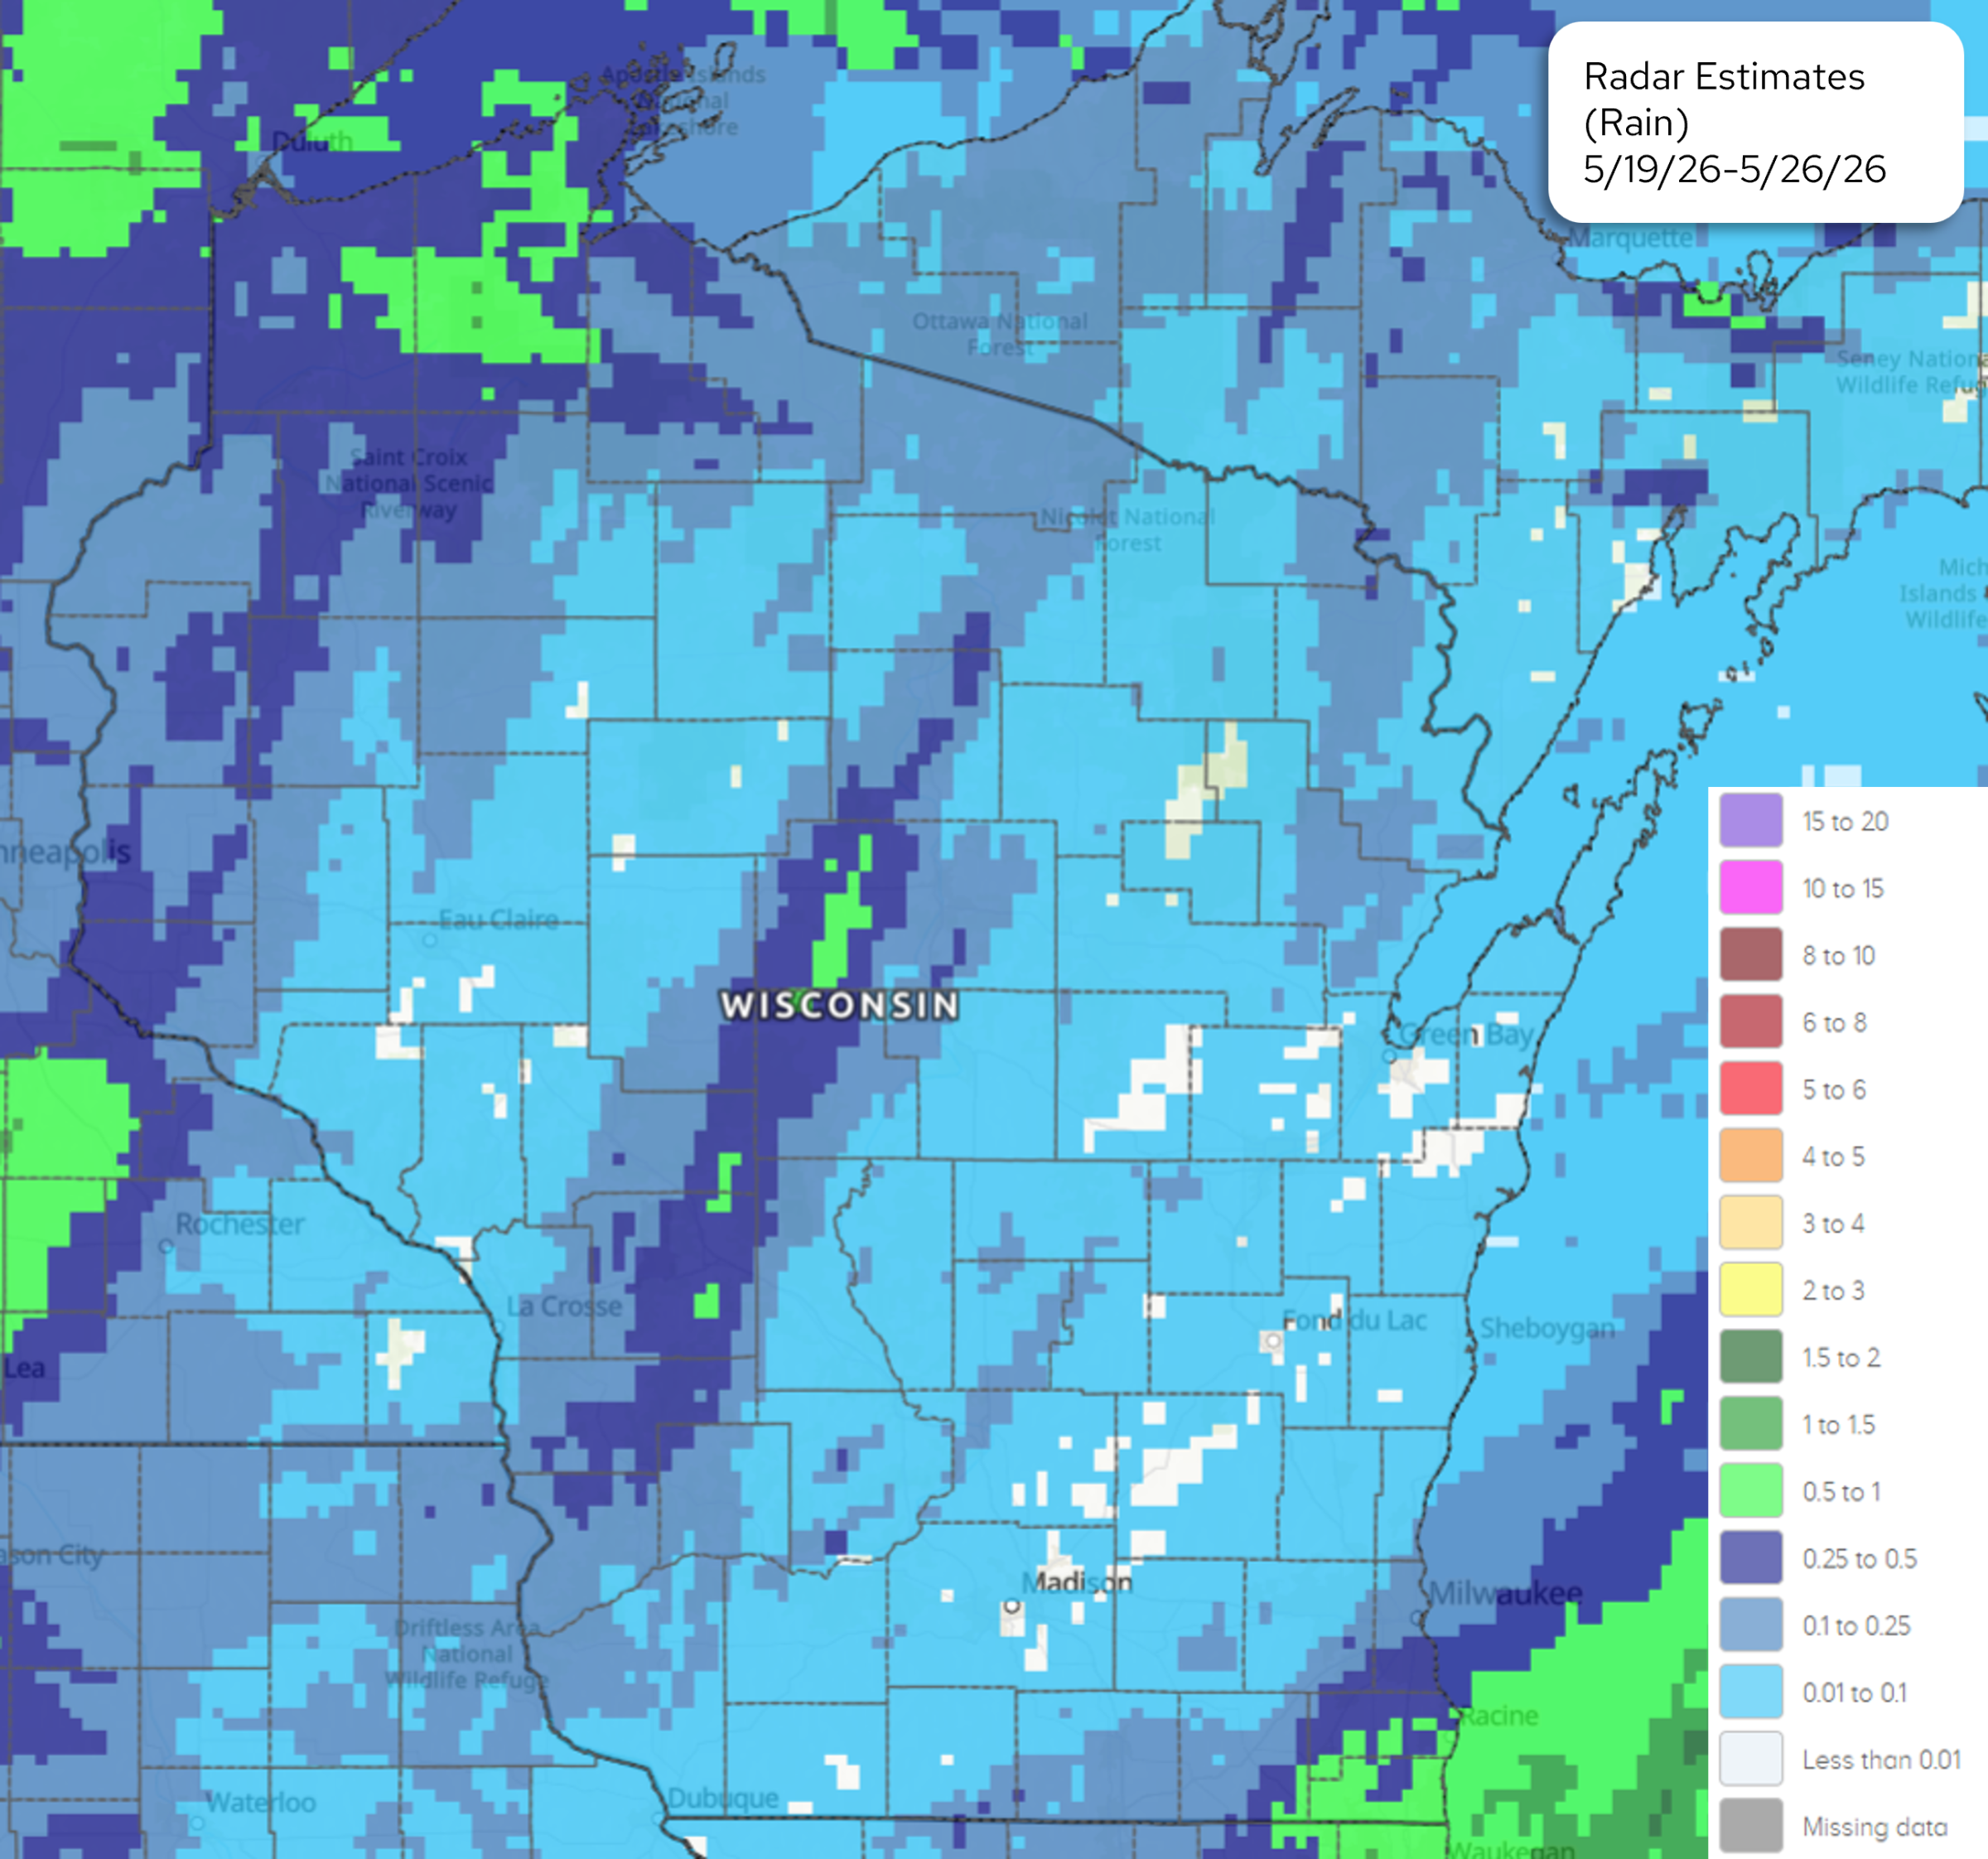
Image Description ↓
7-day cumulative radar rainfall estimate map centered on Wisconsin and surrounding states. A color-coded legend in the lower right shows rainfall amounts in inches ranging from less than 0.01 (white) to 15–20 inches (purple). Most of Wisconsin shows light blue tones (0.01–0.25 inches). A north-to-south band of darker navy blue through central Wisconsin indicates higher totals of 0.25–0.5 inches. A narrow streak of dark green near that band suggests localized totals of 1.5–2 inches. The Madison area appears light blue at 0.01–0.1 inches. Bright green patches in northwestern Minnesota and along Iowa’s western border indicate 0.5–1 inch. White areas scattered across southern Wisconsin indicate less than 0.01 inches received. No areas in Wisconsin reach the higher rainfall thresholds (3 inches or above).
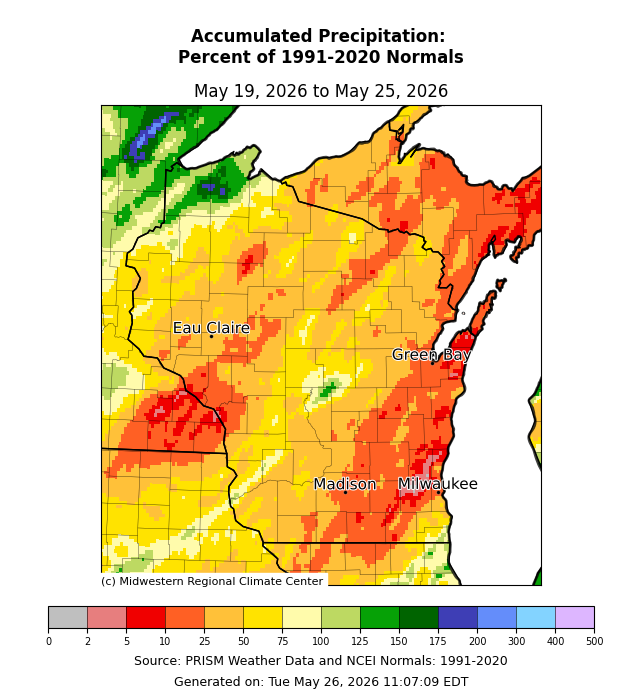
Image Description ↓
Choropleth map from the Midwestern Regional Climate Center showing accumulated precipitation as a percent of 1991–2020 normals for Wisconsin and surrounding areas, May 19–25, 2026. The majority of Wisconsin — including the Madison, Milwaukee, and Green Bay areas — is covered in orange and red, indicating precipitation at 25–75% of normal (below average). A band of yellow (75–100% of normal) runs through parts of central Wisconsin. The far northwestern corner of the state and adjacent Minnesota show green and blue tones, indicating 150–300%+ of normal precipitation. A small patch of green appears near central Wisconsin south of Green Bay. The color scale ranges from 0 (gray) to 500% (purple). Source: PRISM Weather Data and NCEI Normals, generated May 26, 2026.
- Last week was relatively dry for late May across Wisconsin, with most locations receiving less than 0.25” (50% of normal or less).
- Localized areas of 0.5 to 1” of rain were observed across portions of southeast, northwest, and central Wisconsin.
30 Day Precipitation Total and Departure from Normals
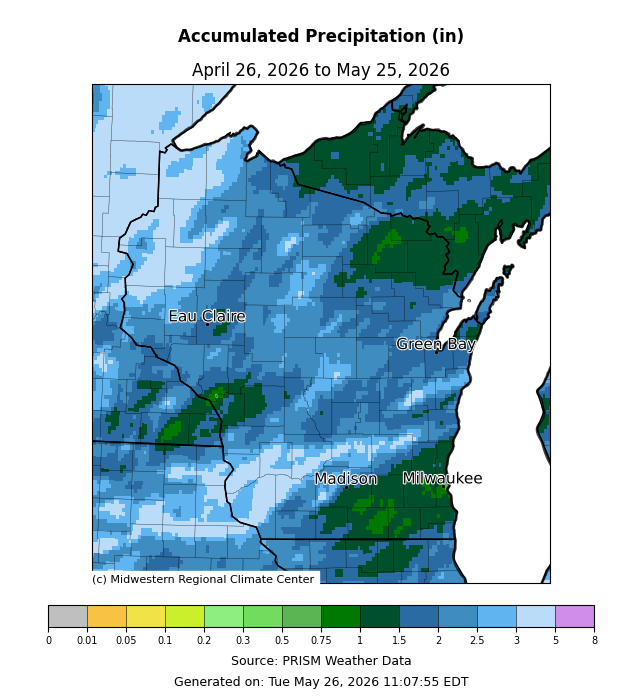
Image Description ↓
PRISM precipitation map of Wisconsin and Upper Michigan, April 26–May 25, 2026. Most of Wisconsin received 1–3 inches (light blue). Heavier totals of 3–5+ inches (dark green) appear in the Upper Peninsula, Green Bay area, a band southwest of Eau Claire, and scattered areas along the Illinois border. Madison received approximately 1–2 inches.
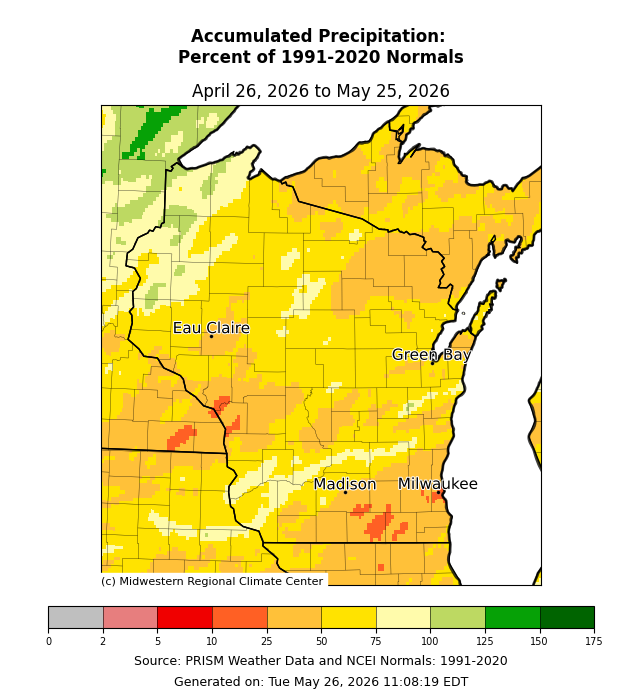
Image Description ↓
Choropleth map from the Midwestern Regional Climate Center showing accumulated precipitation as a percent of 1991–2020 normals across Wisconsin and neighboring states for April 26–May 25, 2026. Most of Wisconsin is yellow to orange, indicating 25–75% of normal precipitation. Darker orange and red patches near central Wisconsin and south of Madison indicate areas receiving as little as 5–25% of normal. A white streak runs diagonally across southern Wisconsin, suggesting near-zero precipitation in a narrow corridor. Northwestern Minnesota and far northern Wisconsin show light yellow to green, indicating closer to or above normal precipitation (75–125%). The map uses PRISM weather data sourced from NCEI. Generated May 26, 2026.
- The last 30 days have been drier than normal across the state, with most locations receiving totals that were 25-75% of normal (2.5” or less).
- Totals in parts of the northwest and southwest were nearer to normal (3-5”).
- In the southeast and northeast corners of the state, precipitation totals were 1.5” or less (50% or less of normal).
90 Day Precipitation Total and Percent of Normals
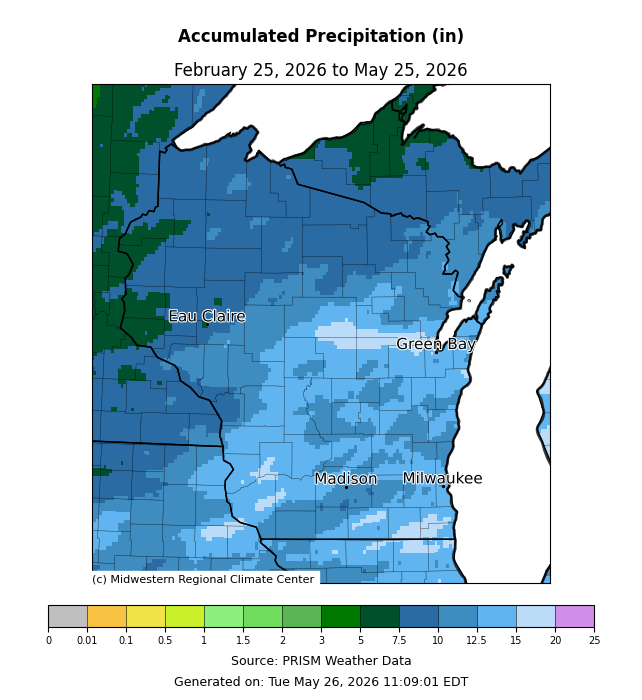
Image Description ↓
Choropleth map of Wisconsin showing PRISM-sourced accumulated precipitation from February 25 to May 25, 2026, generated May 26, 2026. The color scale ranges from 0 to 25 inches. Most of Wisconsin falls in the 5–10 inch range (medium blue). Northwestern Wisconsin and areas near Eau Claire show higher totals of 12.5–20 inches (dark green to teal). The Madison and Milwaukee regions show moderate accumulation of approximately 5–7.5 inches. A lighter blue band runs through central Wisconsin indicating slightly lower totals around 3–5 inches. Source: Midwestern Regional Climate Center.
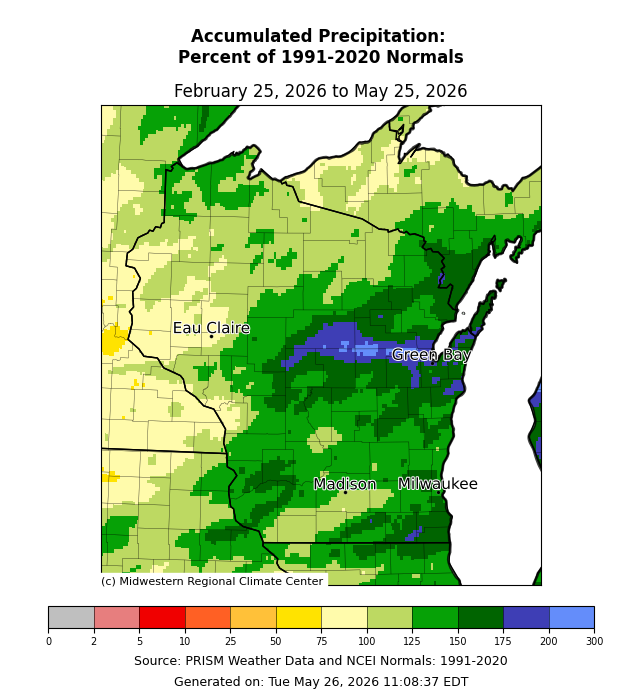
Image Description ↓
Choropleth map from the Midwestern Regional Climate Center showing accumulated precipitation as a percent of 1991–2020 normals for February 25 to May 26, 2026, covering Wisconsin and neighboring states. Most of Wisconsin is dark green to blue, indicating 125–200%+ of normal precipitation. A large blue area (200–300% of normal) is centered around Green Bay and extends south toward Madison and Milwaukee. Central and northern Wisconsin show 125–175% of normal (dark green). Western Wisconsin near Eau Claire and into Minnesota transitions to light green and yellow-green, indicating near-normal to slightly below-normal precipitation (75–110%). A small yellow area near the western border indicates 50–75% of normal. The color scale runs from gray (0%) through red, yellow, green, and blue to dark blue (300%). Source: PRISM Weather Data and NCEI Normals, 1991–2020.
- Totals of 15” or more were observed in portions of southwest, southeast, and northeast counties. These totals were 150% of normal or greater.
- The entire state received precipitation totals that were at or above normal. Most locations received at least 10” of precipitation (rain plus melted snow).
- Precipitation totals were lowest in the northwest, along the St. Croix River (5-7.5”).
2026 Precipitation
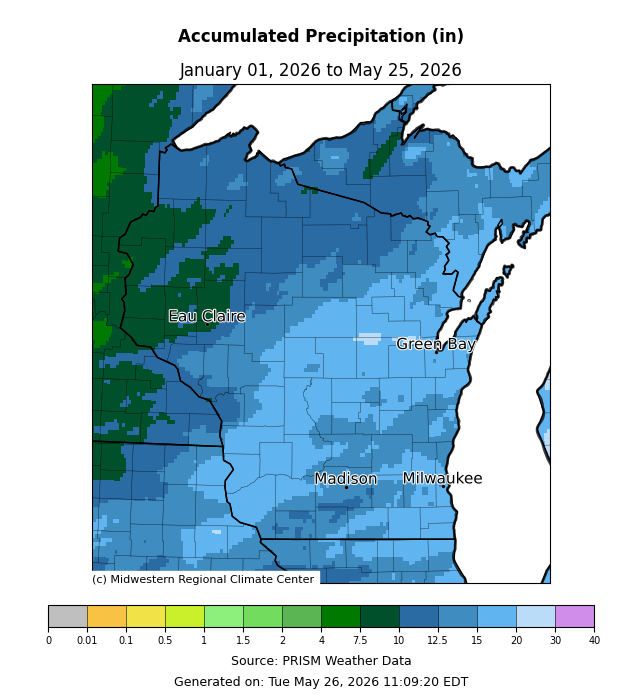
Image Description ↓
Map of Wisconsin showing accumulated precipitation (inches) from January 1 to May 25, 2026, per PRISM Weather Data. Northwestern Wisconsin and the western border region received the highest precipitation (10–20+ inches, shown in dark green). The rest of Wisconsin — including Madison, Milwaukee, and Green Bay — received roughly 5–10 inches (light blue). A color scale runs from 0 to 40 inches. Generated May 26, 2026.
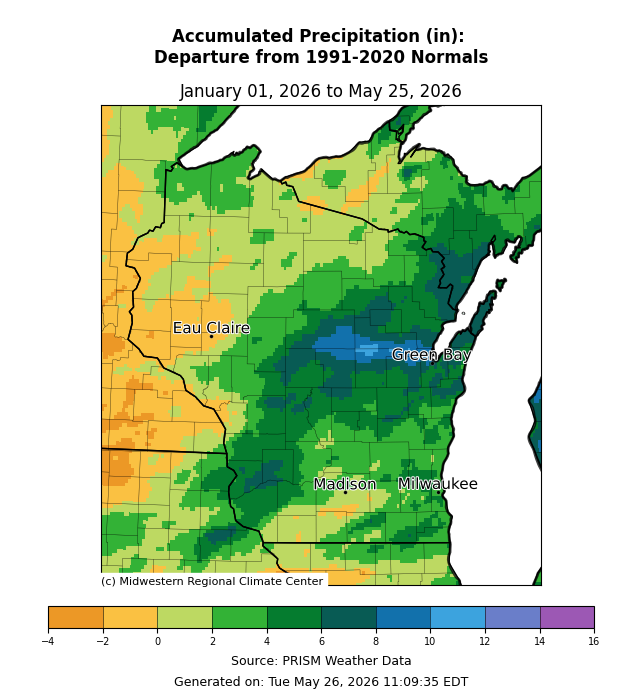
Image Description ↓
Map of Wisconsin and surrounding region showing accumulated precipitation departure from 1991–2020 normals, January 1–May 25, 2026. Eastern and central Wisconsin (including Green Bay and Madison areas) show surpluses of +6 to +14 inches (green to blue). Western Wisconsin and Minnesota show deficits of −2 to −4 inches (orange). Source: PRISM Weather Data via Midwestern Regional Climate Center.
Soil Moisture and Temperature Trends
Soil Moisture Models
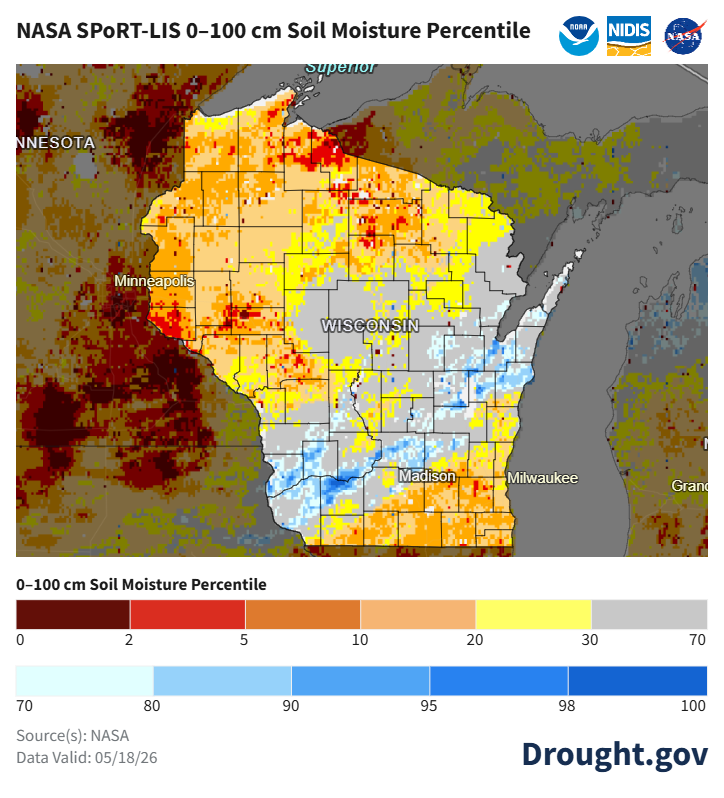
Image Description ↓
NASA SPoRT-LIS 0–100 cm Soil Moisture Percentile map dated May 18, 2026, sourced from Drought.gov (NOAA, NIDIS, NASA). The map shows Wisconsin and surrounding states color-coded by soil moisture percentile. Northern Wisconsin displays yellow to orange tones (percentiles 20–30), indicating below-normal moisture. Northwestern Minnesota shows dark red (percentile 0–2), indicating extreme dryness. South-central and southeastern Wisconsin, including the Madison and Milwaukee areas, shows light blue to white (percentiles 70–90), indicating above-normal to wet conditions. A two-row color scale ranges from dark red (0) through orange, yellow, and gray (70), then continues in blues from light (70) to dark (100).
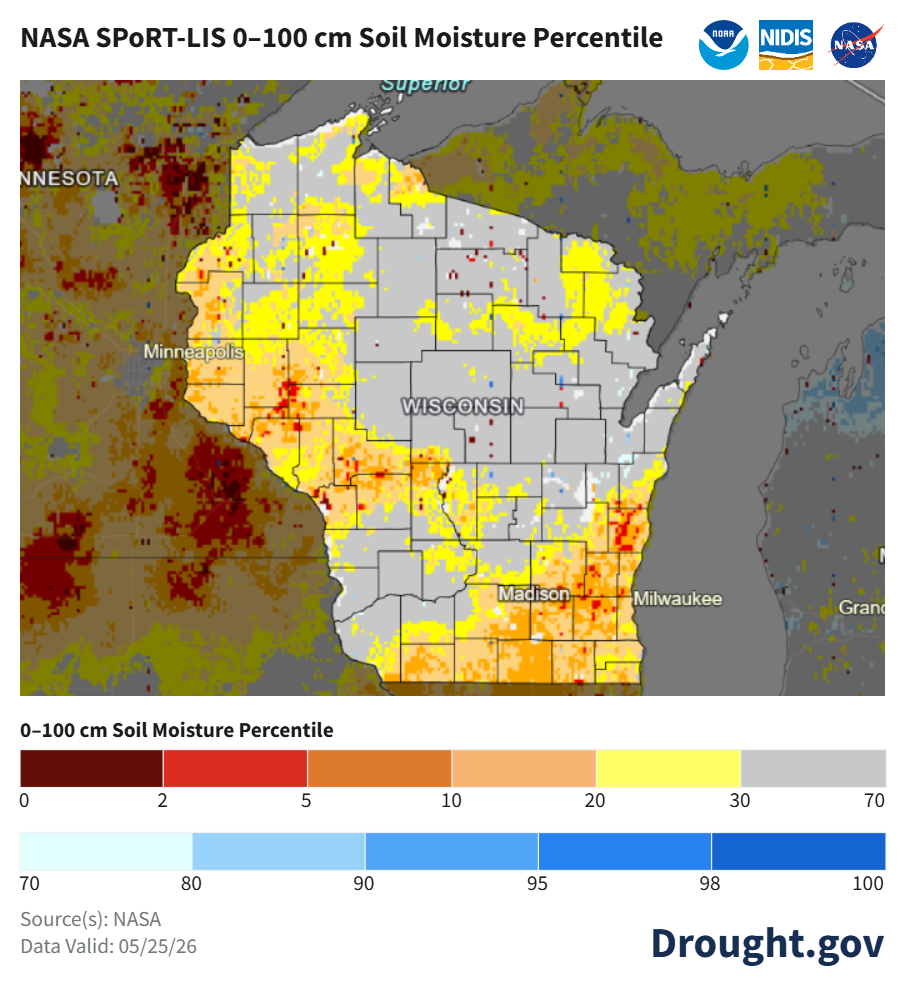
Image Description ↓
NASA SPoRT-LIS map of 0–100 cm soil moisture percentiles for Wisconsin and surrounding region, valid 05/25/26. Most of Wisconsin falls in the 10–30th percentile range (yellow to light orange), indicating drier-than-normal conditions. Southern Wisconsin near Madison and Milwaukee shows more severe dryness, with large areas at the 5–10th percentile (orange) and scattered pixels at the 2–5th percentile (red-orange). North-central and northeast Wisconsin appear closer to normal (gray, 30–70th percentile). Minnesota to the west shows extreme dryness, with widespread 0–2nd percentile readings (dark red/maroon). The Great Lakes region to the east shows near-normal to above-normal moisture (light blue to white, 70–90th percentile). A color scale ranges from dark red (0) through orange, yellow, and gray (30–70) to dark blue (100).
- Current soil moisture levels at 4” depth across Wisconet research farm stations are typically near to below last week’s levels, following a relatively dry week for most.
- Satellite-based soil moisture estimates indicate that most soils in the state have near normal moisture in the top 1 meter. Dryness in the north has been reduced.
- Abnormal dryness is indicated across the southeast and west-central counties.
- Notes on how to interpret the maps:
- Red areas = top 5 driest in 100 years.
- Dark red areas = top 2 driest in 100 years.
- Dark blue areas = top 2 wettest in 100 years.
Wisconet Soil Moisture
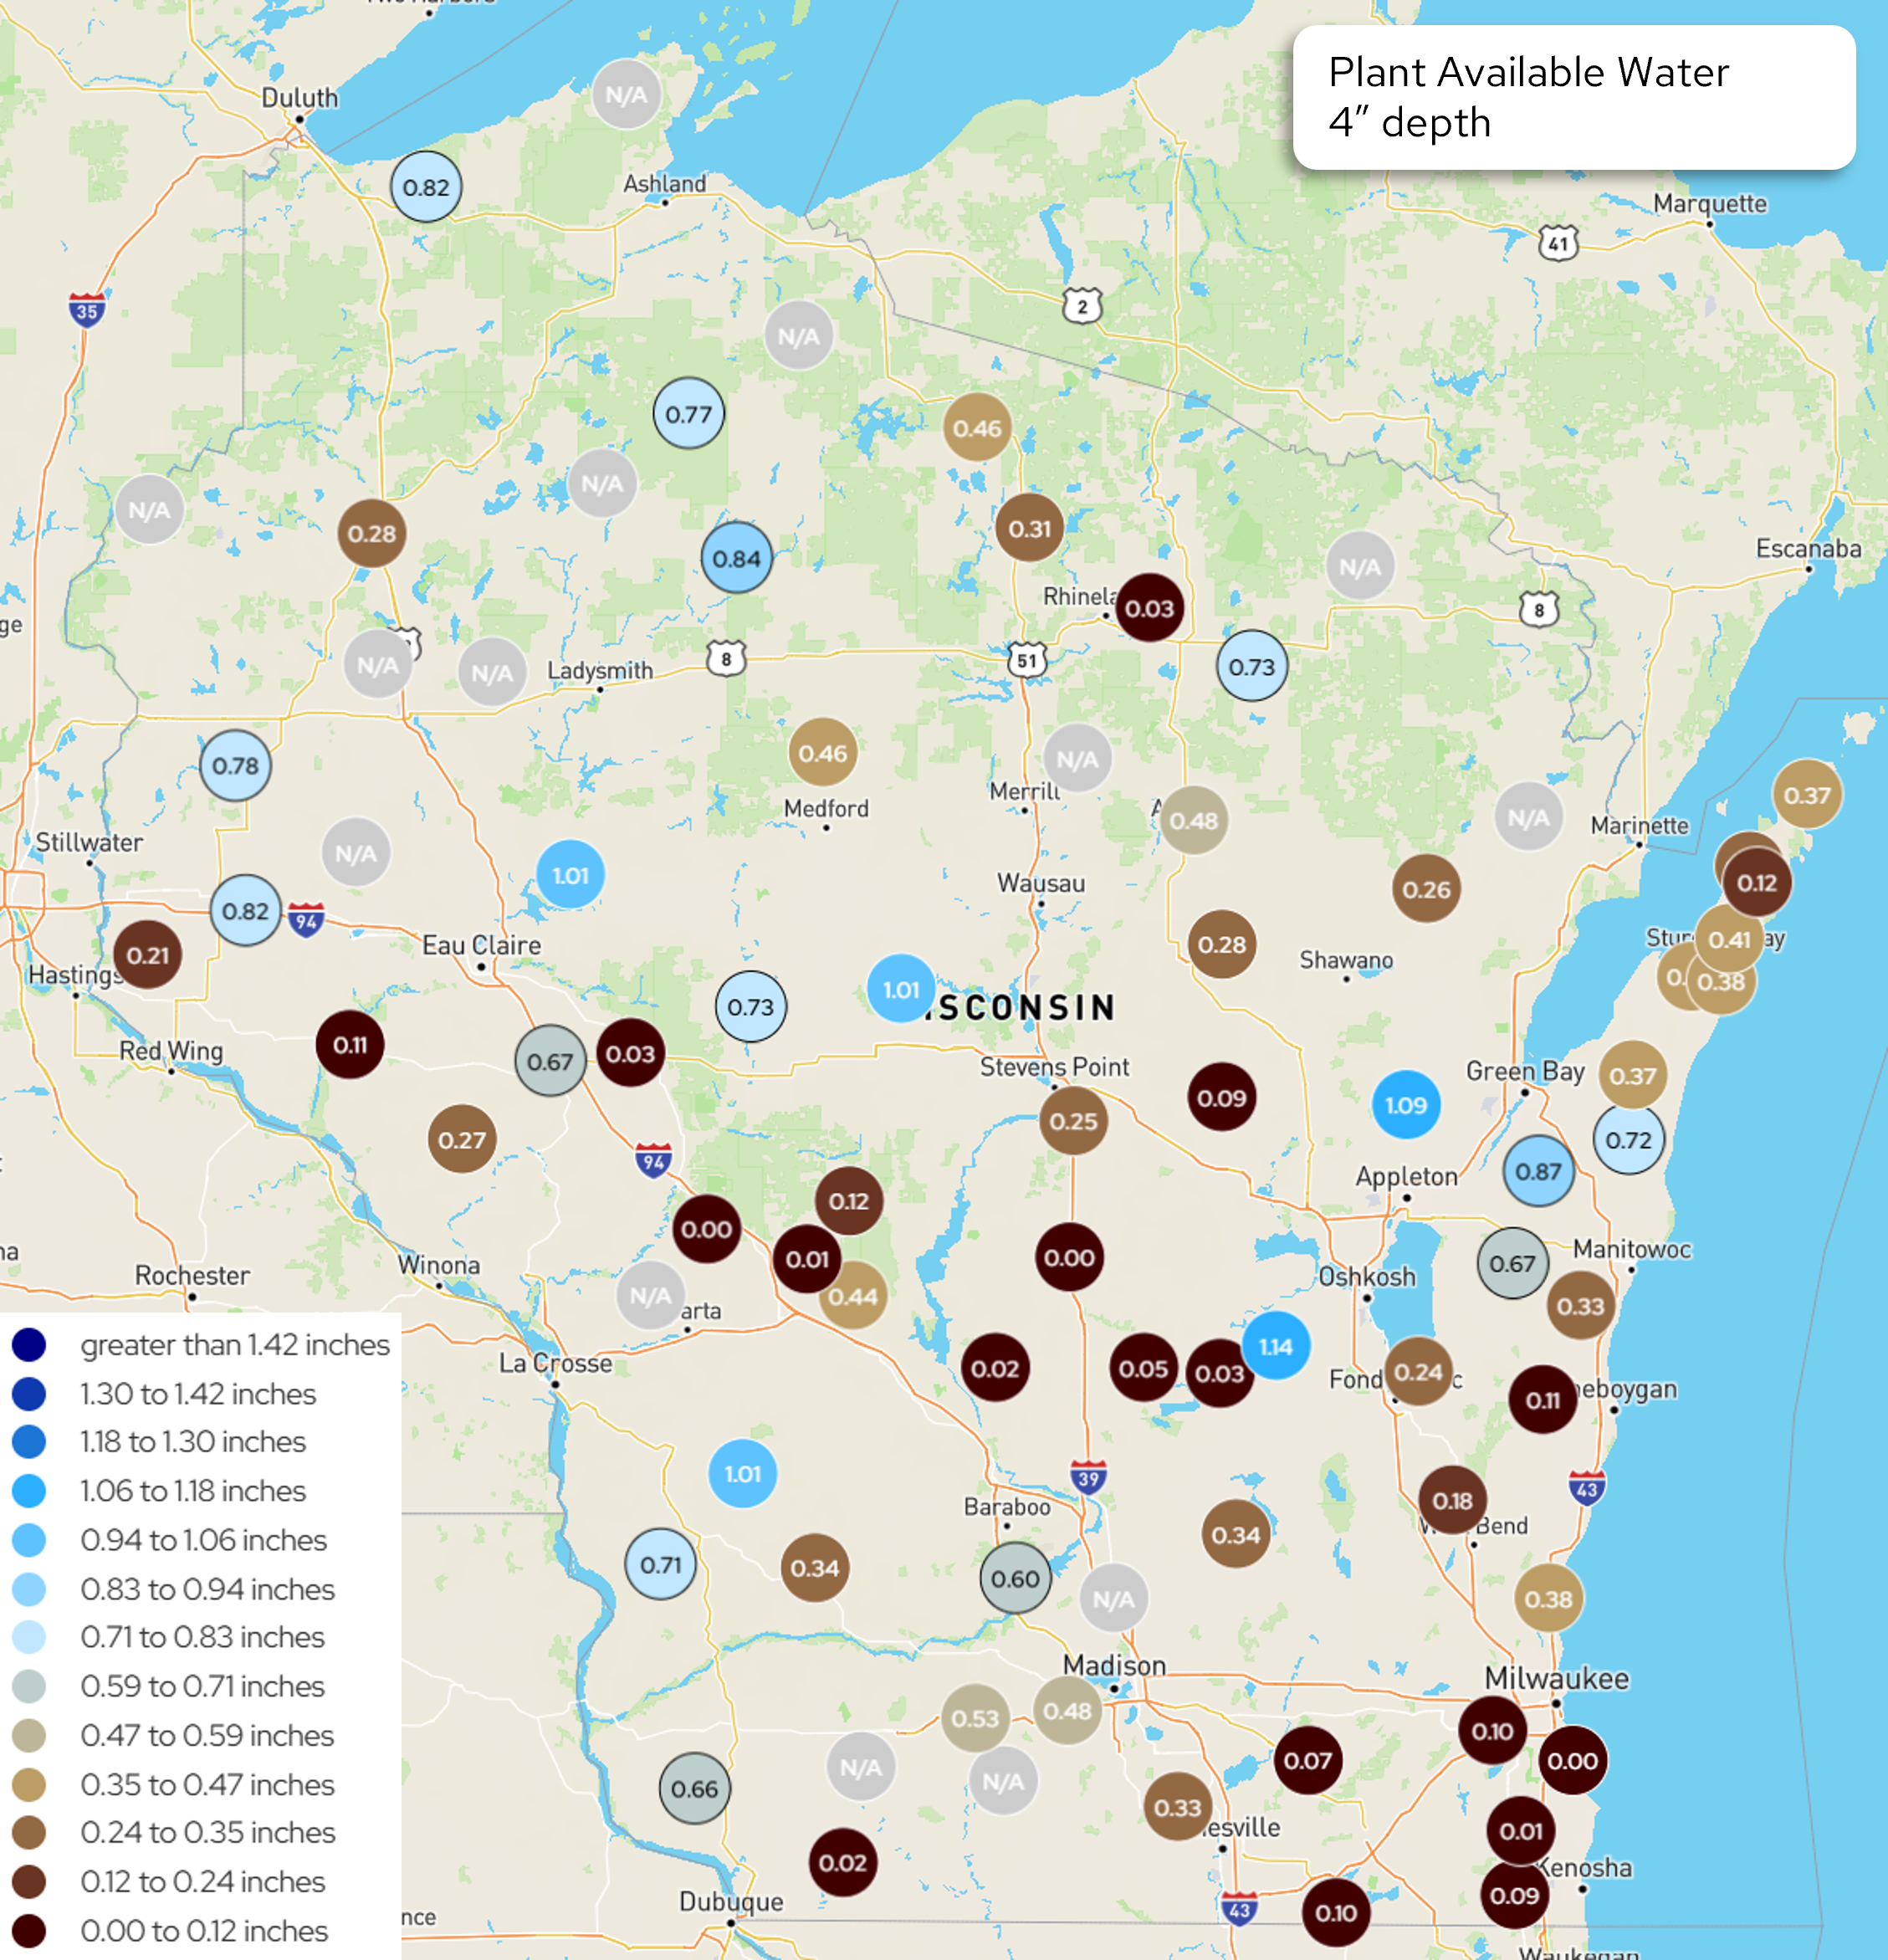
Image Description ↓
Map of Wisconsin and border regions showing plant available water at 4-inch soil depth. Color-coded circles at monitoring stations display numeric values in inches. The legend ranges from dark navy (greater than 1.42 inches) through blues, grays, tans, and browns to near-black (0.00 to 0.12 inches). The majority of stations display dark brown or near-black markers with values between 0.00 and 0.24 inches, concentrated across central, southern, and eastern Wisconsin, including sites near Madison, Milwaukee, Stevens Point, and Appleton. Higher moisture values (light blue markers, 0.94–1.18 inches) appear in isolated locations including near Eau Claire (1.01), central Wisconsin (1.01, 1.01), Green Bay area (1.09), and Fond du Lac area (1.14). Several stations are marked N/A, primarily in northern and western Wisconsin. The map indicates widespread critically low soil moisture across most of the state.
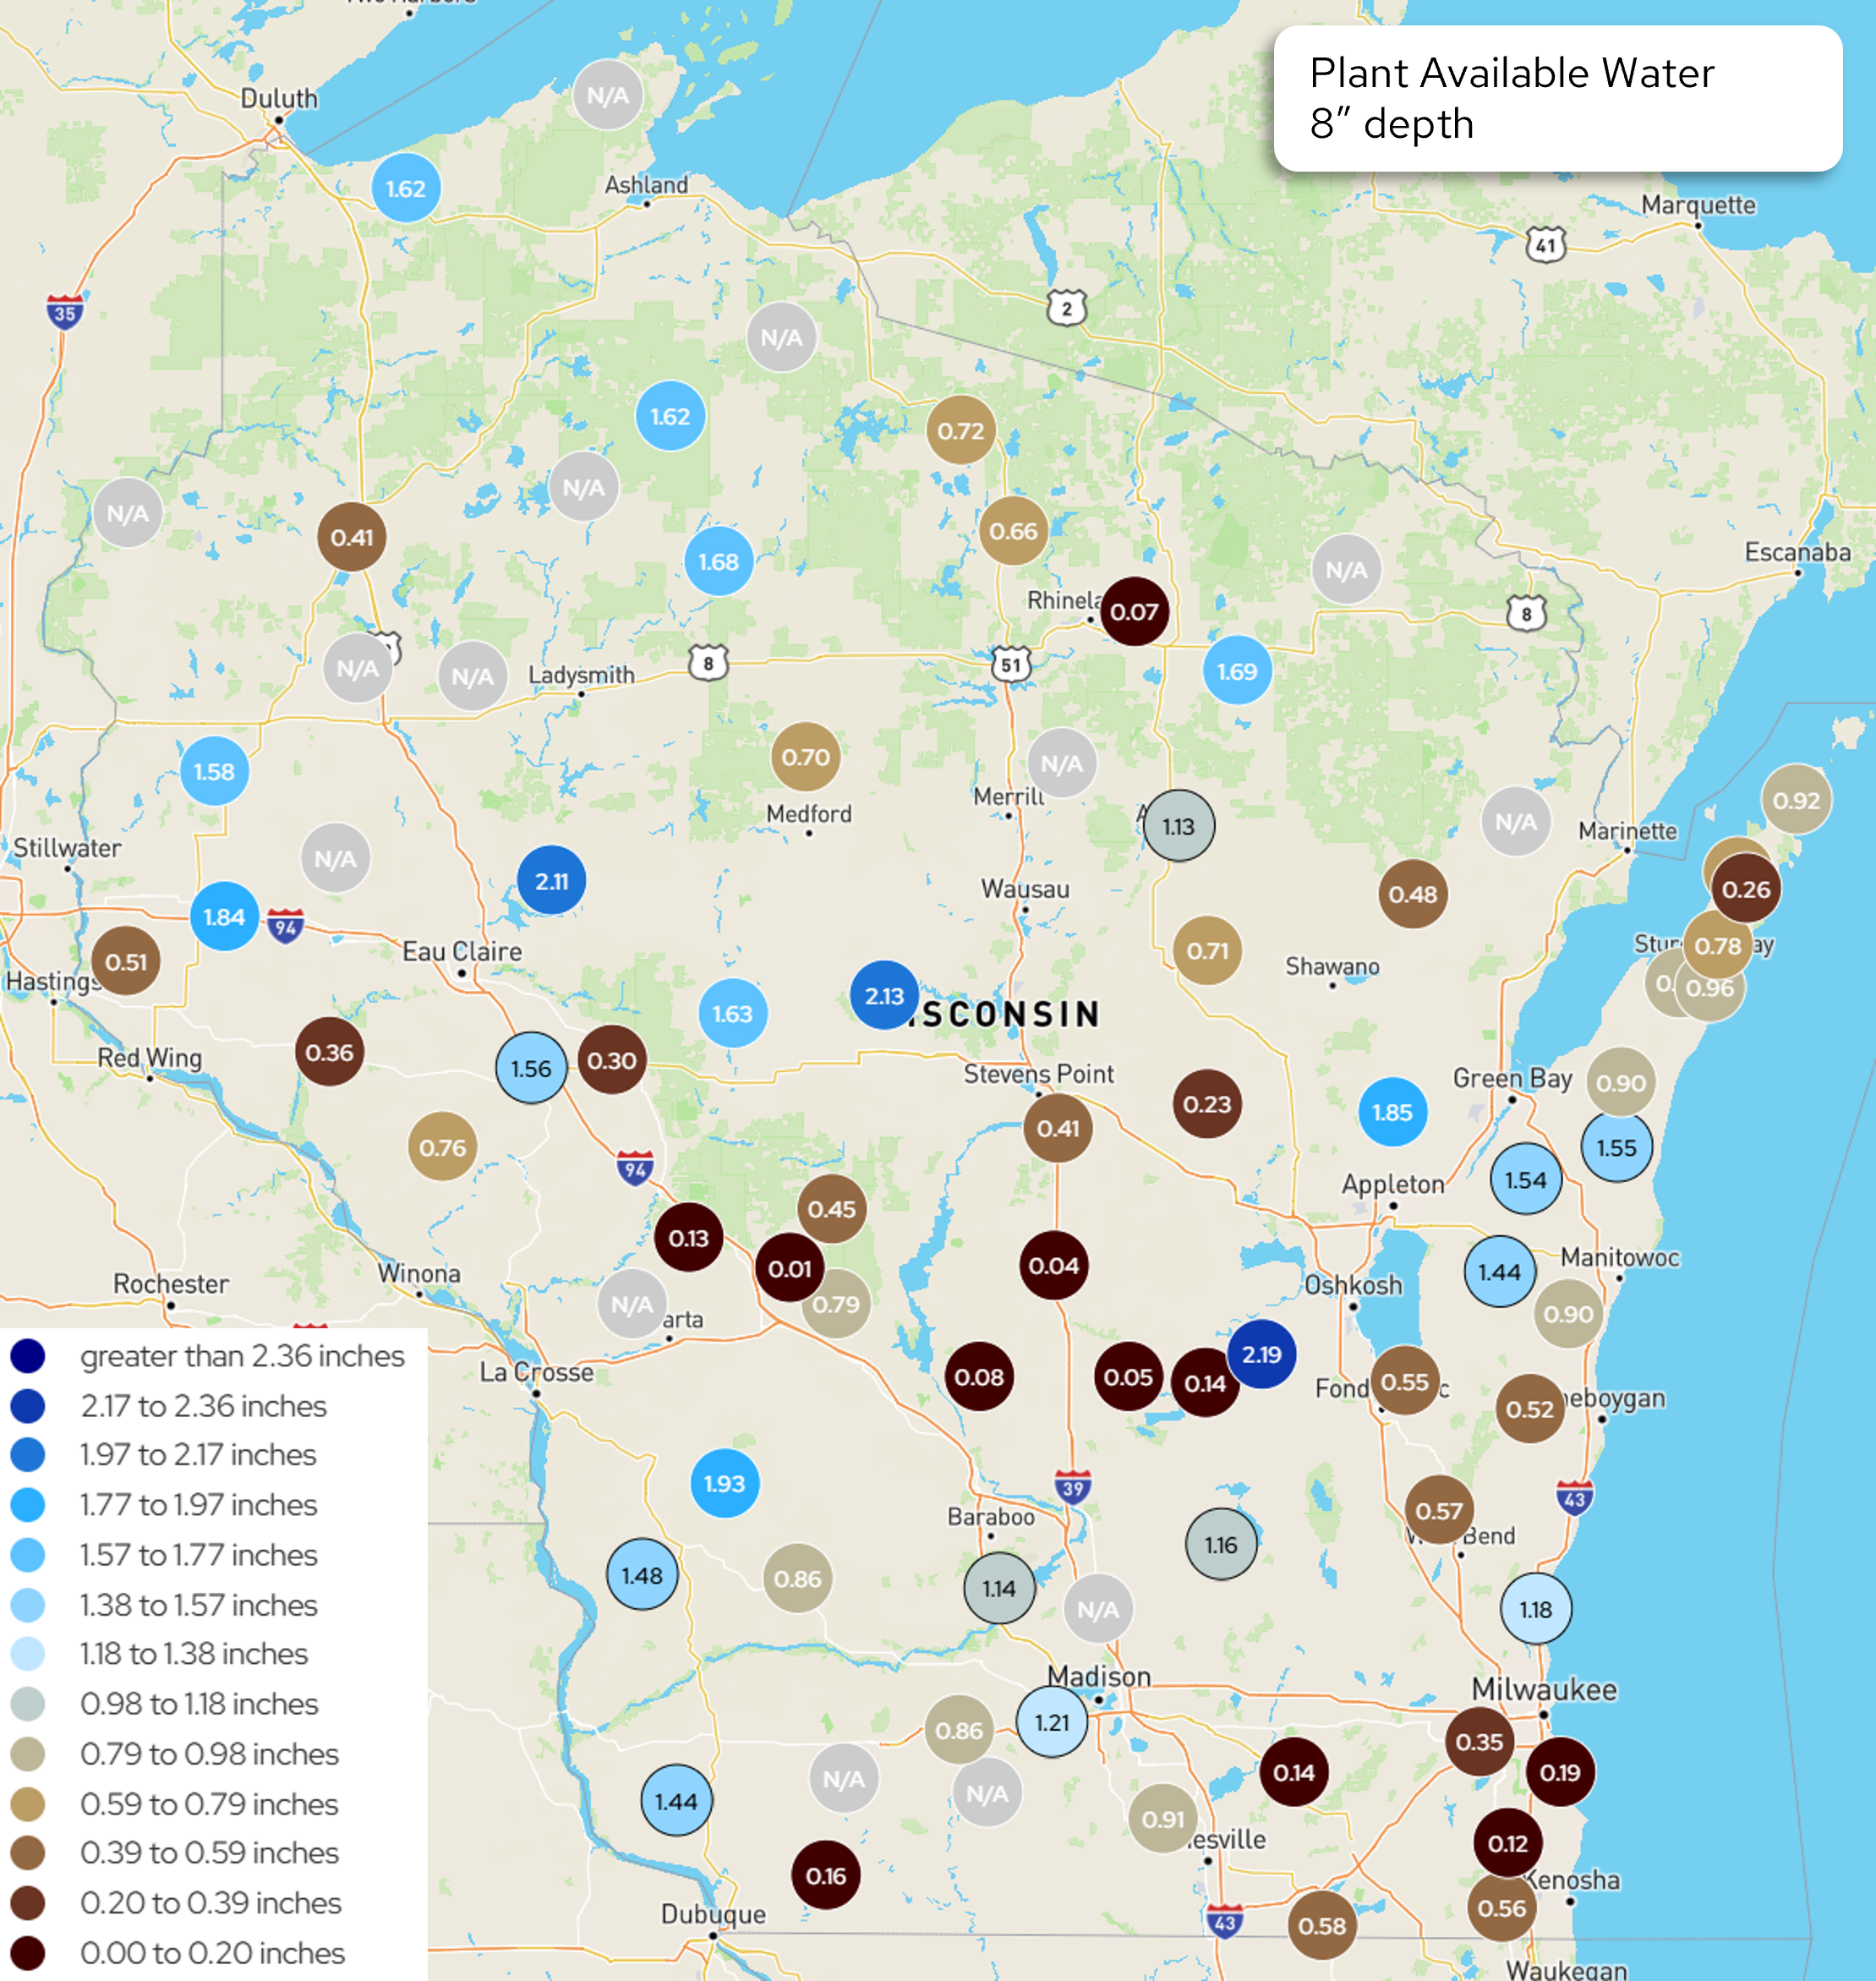
Image Description ↓
A map of Wisconsin showing plant available water readings at 8-inch soil depth across monitoring stations statewide. Each station is represented by a colored circle displaying a numeric value in inches. Colors range from dark maroon (0.00–0.20 inches) through brown, tan, gray, and multiple shades of blue up to dark navy (greater than 2.36 inches), indicating increasing moisture levels.
Notable readings include high values in the west-central region (2.11, 2.13 near Eau Claire/Stevens Point) and a 2.19 near Fond du Lac. Very low values (0.01–0.07) appear in south-central and north-central areas. Several stations display “N/A” indicating no data. The eastern lakeshore and far northwest show moderate values. A legend in the lower left identifies 14 color categories. The map covers Wisconsin and adjacent border areas of Minnesota, Iowa, Illinois, and Michigan’s Upper Peninsula.
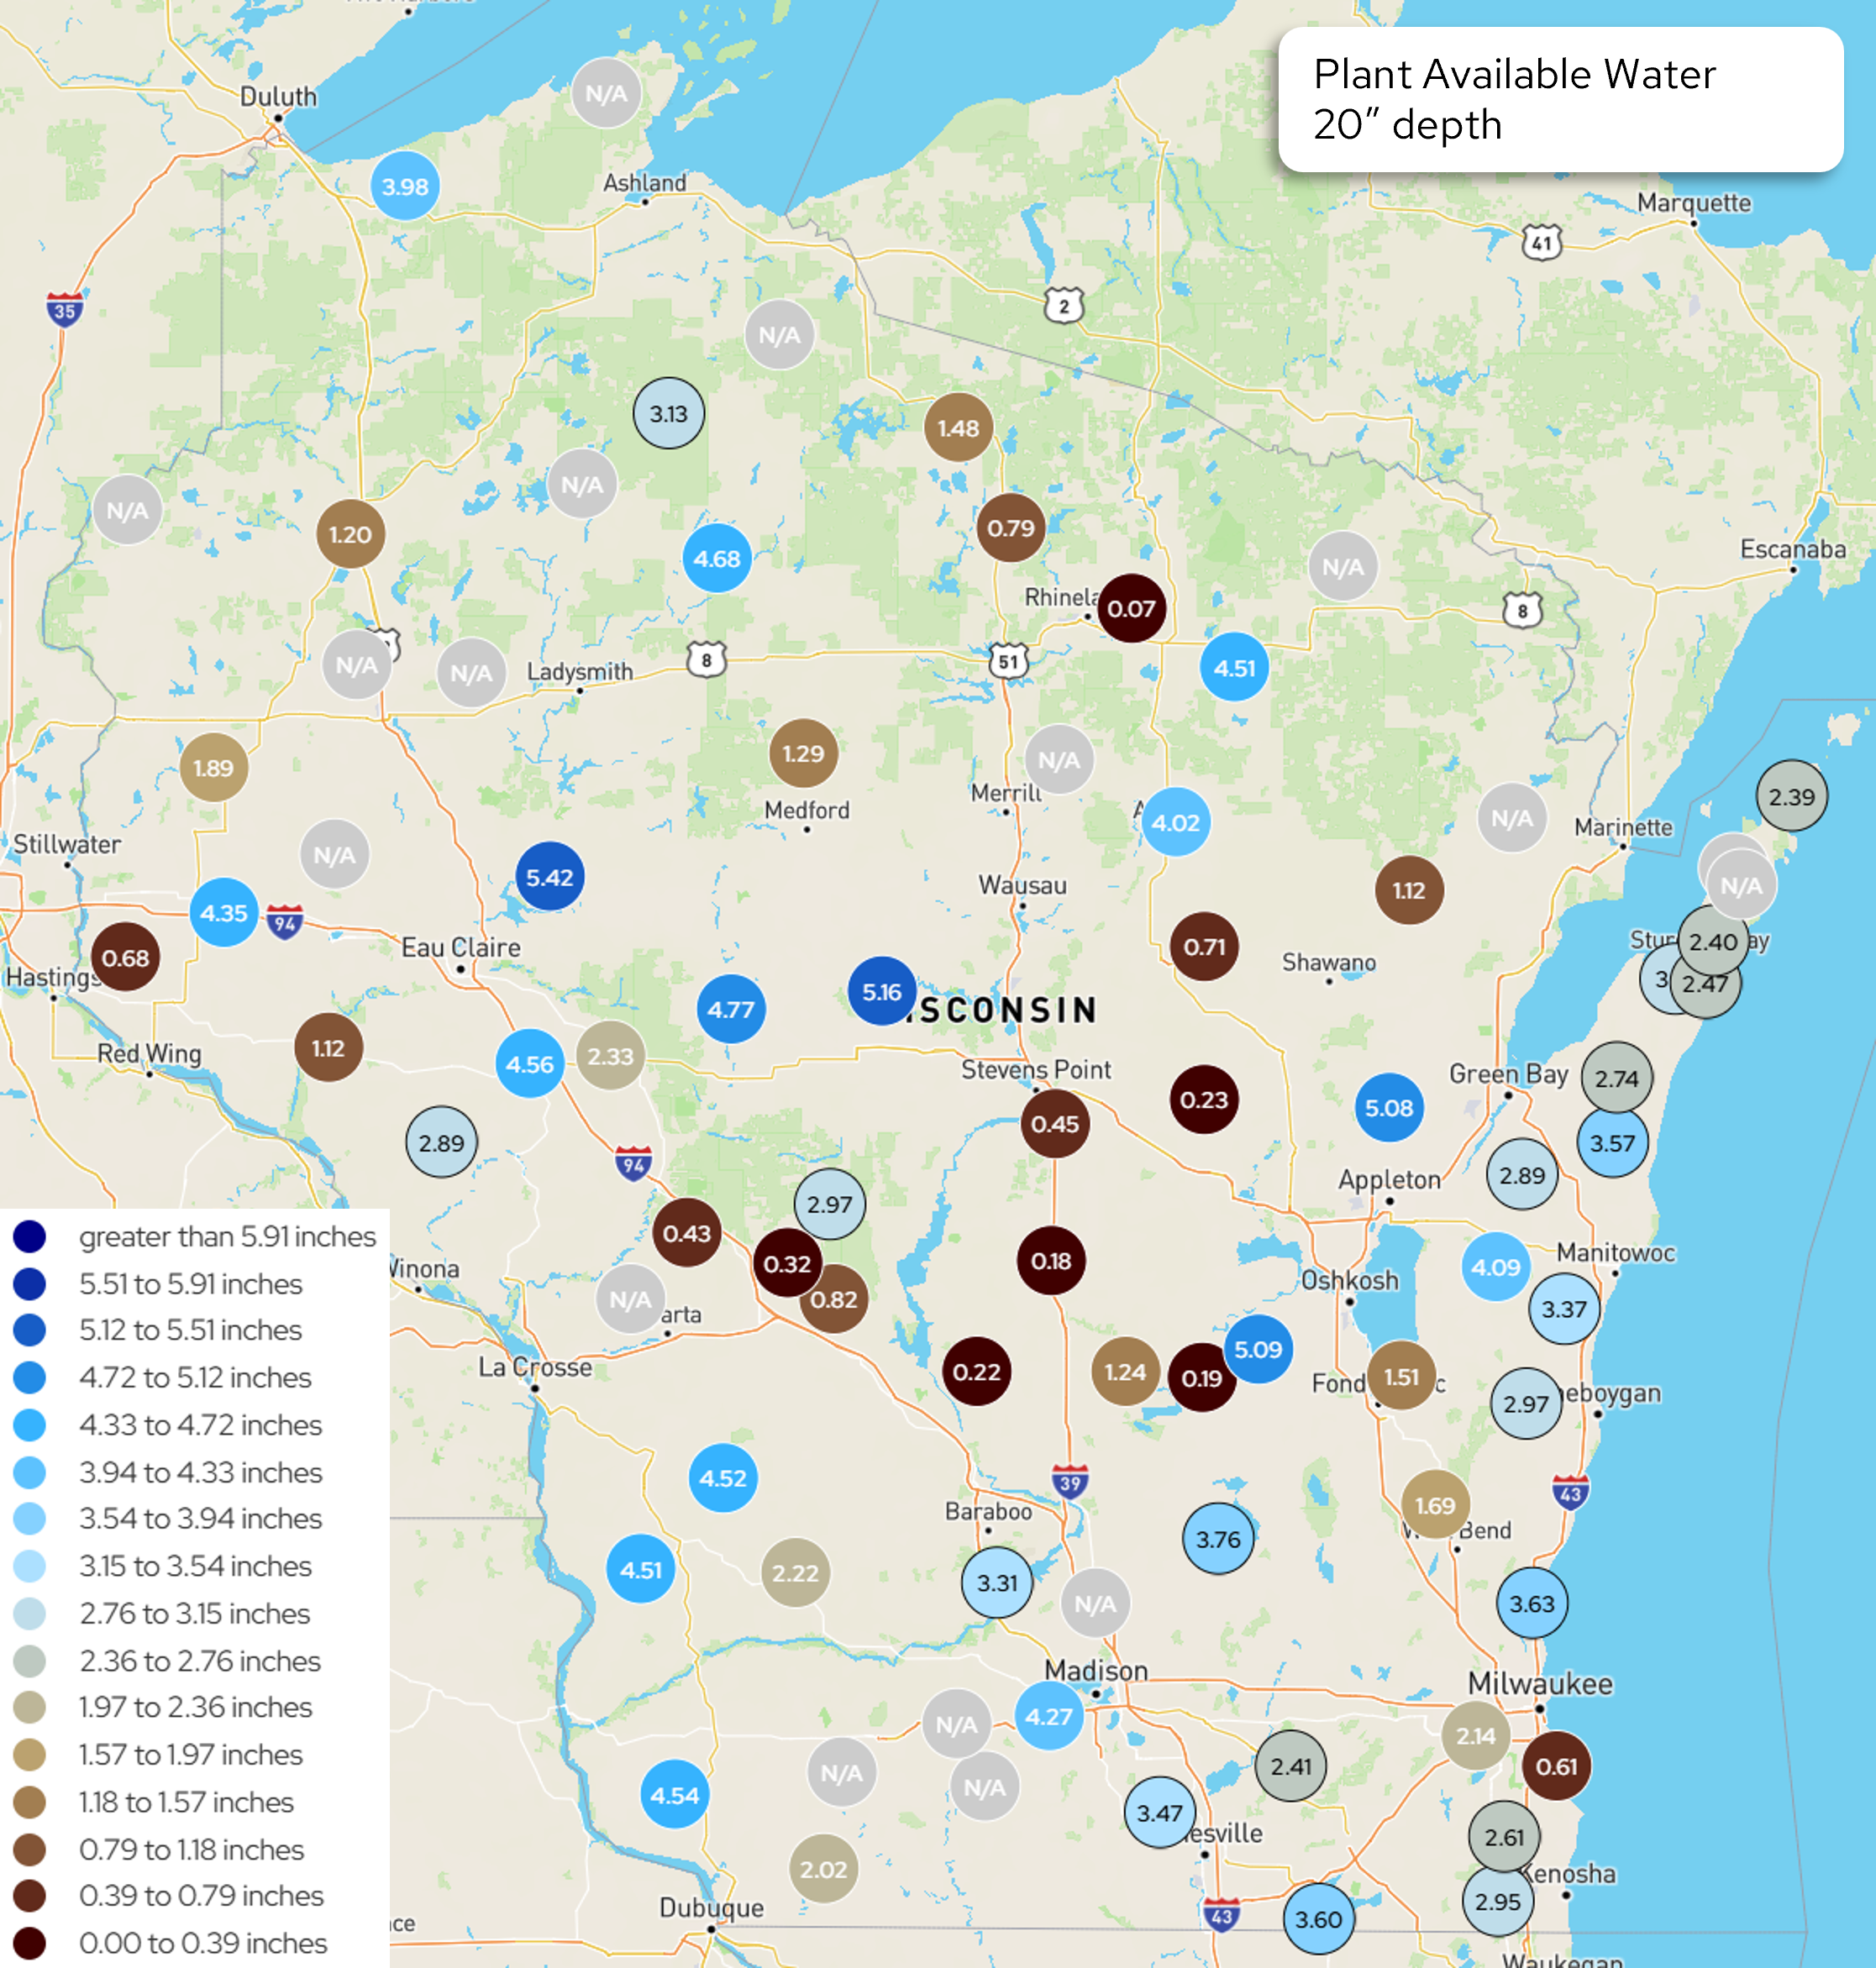
Image Description ↓
A color-coded dot map of Wisconsin and surrounding border areas showing plant available water measurements at 20 inches soil depth. Dots range from near-black red (0.00–0.39 inches) through brown, tan, gray, and progressively darker blues (greater than 5.91 inches). Values span roughly 0.07 to 5.42 inches across the state. The lowest values (dark red/maroon, under 0.79 inches) cluster in central Wisconsin near Wausau, Stevens Point, and the Wisconsin Dells corridor. The highest values (medium to dark blue, 4.33 inches and above) appear in the northwest near Eau Claire, central areas near Medford, and scattered western locations. Several sites are marked N/A, predominantly in the northwest and northeast. A 17-category color legend appears in the lower left. All dot values are labeled numerically.
- The maps show the daily average Wisconet plant available water (inches) on May 25th.
- The table shows total precipitation and changes in plant available water from May 18th (Start) to May 25th (End).
- What is plant available water? To learn more, read this article from UW Extension Ag Water Quality on plant available water. There is also a webinar from UW Extension on soil water management that you can watch.
- Example: Imagine that you have 4 inches of soil in the bottom of a bucket. In that soil, there are 1.5 inches of plant available water. Therefore, if you removed the soil and left only the water available for plant roots to take up, you would have 1.5 inches of water in the bottom of the bucket.
- The wilting point is when plant available water is at 0 inches, and the plant can no longer access water at that depth in the soil.
| Research Farm | County | Total Precipitation (in.) | 4″ Start | 4″ End | 8″ Start | 8″ End | 20″ Start | 20″ End |
|---|---|---|---|---|---|---|---|---|
| Arlington | Columbia | 0.13 | 1.05 | 0.82 | 2.04 | 1.68 | 5.09 | 4.86 |
| Black River Falls | Jackson | 0.10 | 0.01 | 0.00 | 0.12 | 0.13 | 0.42 | 0.43 |
| Dairy Forage ARS | Sauk | 0.41 | 0.61 | 0.60 | 0.99 | 1.14 | 3.23 | 3.31 |
| Hancock | Waushara | 0.50 | 0.06 | 0.00 | 0.11 | 0.04 | 0.11 | 0.18 |
| Kemp | Oneida | 0.27 | 0.30 | 0.31 | 0.60 | 0.66 | 0.65 | 0.79 |
| Lancaster | Grant | 0.41 | 0.78 | 0.66 | 1.45 | 1.44 | 4.55 | 4.54 |
| Marshfield | Marathon | 0.63 | 0.81 | 1.01 | 1.92 | 2.13 | 4.95 | 5.16 |
| O.J. Noer (Turfgrass) | Dane | 0.22 | 0.34 | 0.48 | 0.92 | 1.21 | 3.98 | 4.27 |
| Peninsular | Door | 0.04 | 0.56 | 0.41 | 1.00 | 0.78 | 2.56 | 2.40 |
| Rhinelander | Oneida | 0.14 | 0.01 | 0.03 | 0.05 | 0.07 | 0.05 | 0.07 |
| Spooner | Washburn | 0.21 | 0.02 | 0.28 | 0.13 | 0.41 | 0.98 | 1.20 |
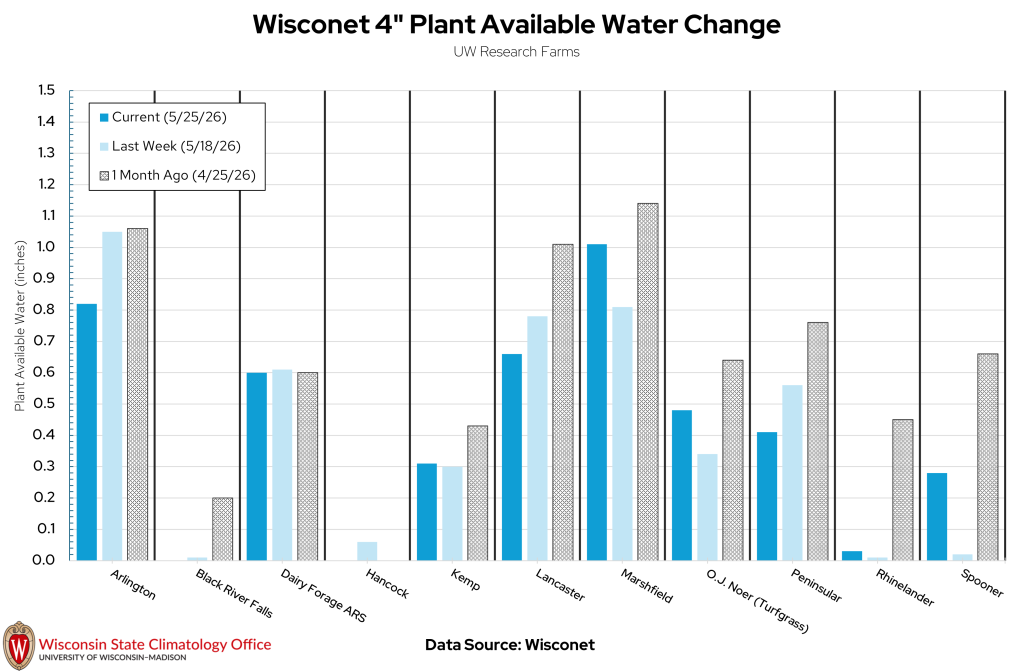
| Research Farm | Current 4″ Soil Moisture | Last Week’s 4″ Soil Moisture | 1 Month Ago 4″ Soil Moisture |
|---|---|---|---|
| Arlington | 0.82 | 1.05 | 1.06 |
| Black River Falls | 0.00 | 0.01 | 0.20 |
| Dairy Forage ARS | 0.60 | 0.61 | 0.60 |
| Hancock | 0.00 | 0.06 | 0.00 |
| Kemp | 0.31 | 0.30 | 0.43 |
| Lancaster | 0.66 | 0.78 | 1.01 |
| Marshfield | 1.01 | 0.81 | 1.14 |
| O.J. Noer (Turfgrass) | 0.48 | 0.34 | 0.64 |
| Peninsular | 0.41 | 0.56 | 0.76 |
| Rhinelander | 0.03 | 0.01 | 0.45 |
| Spooner | 0.28 | 0.02 | 0.66 |
USDA Soil Moisture Reports
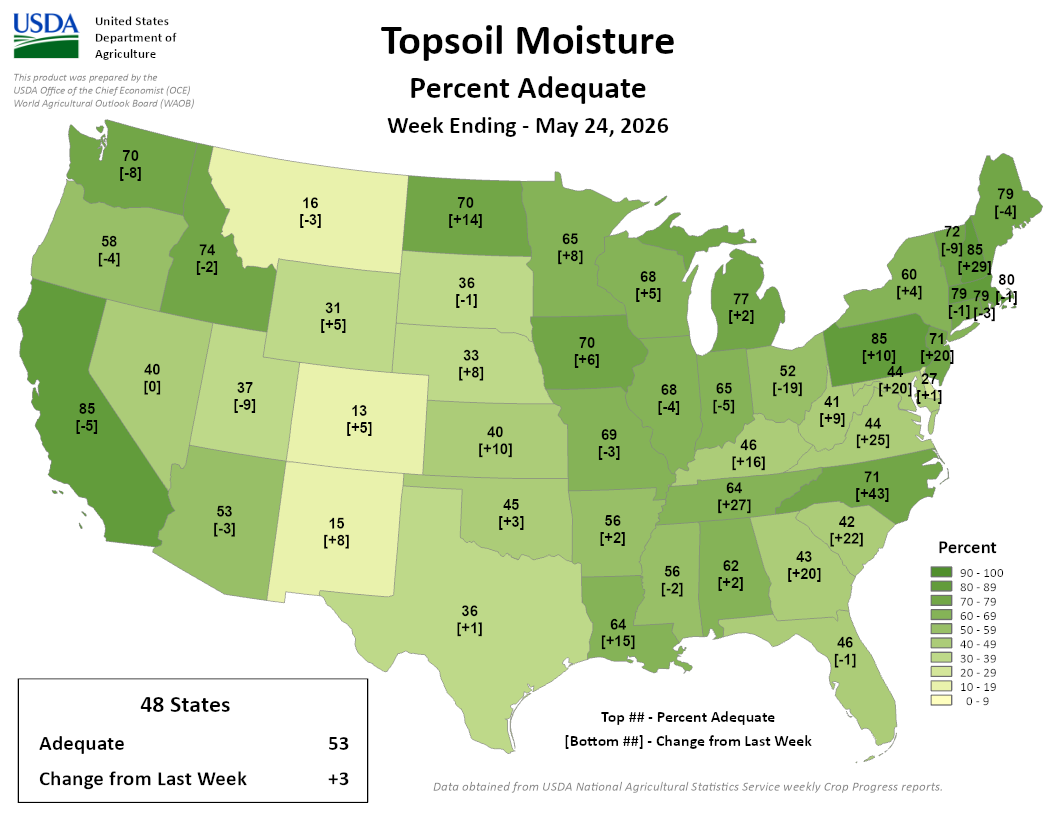
Image Description ↓
USDA choropleth map of contiguous 48-state topsoil moisture, percent adequate, for the week ending May 24, 2026. National average is 53% adequate, up 3 points from the prior week. Each state displays two values: percent adequate (top) and change from last week in brackets (bottom).
Color scale ranges from cream/white (0–9%) through light to dark green (90–100%). Notable regional patterns:
Driest areas (light green/cream, under 20%): Wyoming 13% [+5], New Mexico 15% [+8], Nebraska 33% [+8].
Moderate moisture (40–60%): Nevada 40% [0], Montana 37% [−9], Kansas 40% [+10], Texas 36% [+1].
Most moisture (70%+): North Dakota 70% [+14], Iowa 70% [+6], California 85% [−5], Oregon 74% [−2], Tennessee/Carolinas region 85% [+10], Virginia 71% [+43].
Largest week-over-week gains: Virginia +43, South Carolina +27, North Carolina +25, Louisiana +15.
Largest declines: Kentucky −19, Montana −9, Washington −8.
Data source: USDA National Agricultural Statistics Service weekly Crop Progress reports.
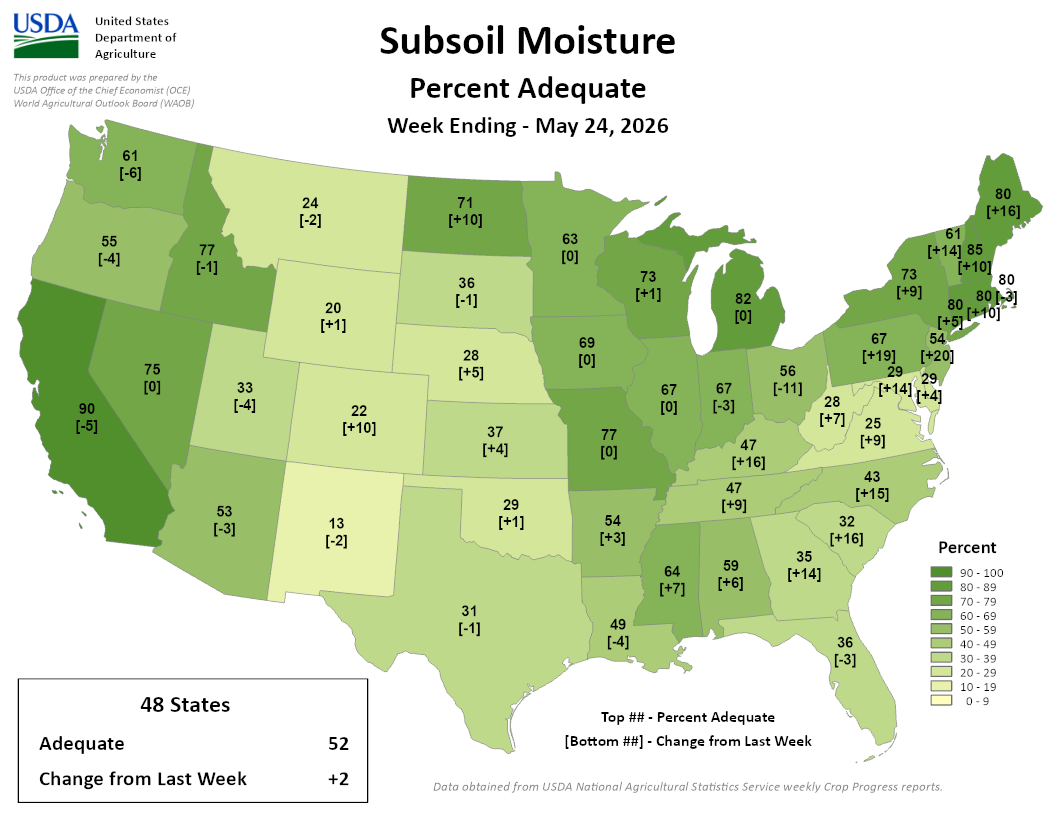
Image Description ↓
Choropleth map of the contiguous US showing subsoil moisture percent adequate by state, with week-over-week change in brackets. Color scale ranges from cream (0–9%) to dark green (90–100%).
Notable values by region:
- West: California 90% [−5], Nevada 75% [0], Oregon 77% [−1], Washington 61% [−6]
- Plains/Mountain: Colorado 22% [+10], Kansas 37% [+4], Nebraska 28% [+5], Wyoming 20% [+1], Montana 24% [−2], New Mexico 13% [−2]
- Midwest: Michigan 82% [0], Wisconsin 73% [+1], Illinois 77% [0], Iowa 69% [0], Minnesota 63% [0]
- South: Texas 49% [−4], Louisiana 64% [+7], Mississippi 59% [+6], Alabama 35% [+14], Florida 36% [−3]
- Northeast/Mid-Atlantic: Maine 80% [+16], Pennsylvania 73% [+9], Virginia 67% [+19], New Jersey 80% [+5]
Data source: USDA National Agricultural Statistics Service weekly Crop Progress reports.
- 68% and 73% of agricultural soils in the state are reported as having adequate topsoil and subsoil moisture, respectively. These values have increased from last week.
- 15% and 17% of agricultural soils in the state are reported as having surplus topsoil and subsoil moisture, respectively. These values have decreased from last week.
Wisconet Soil Temperature
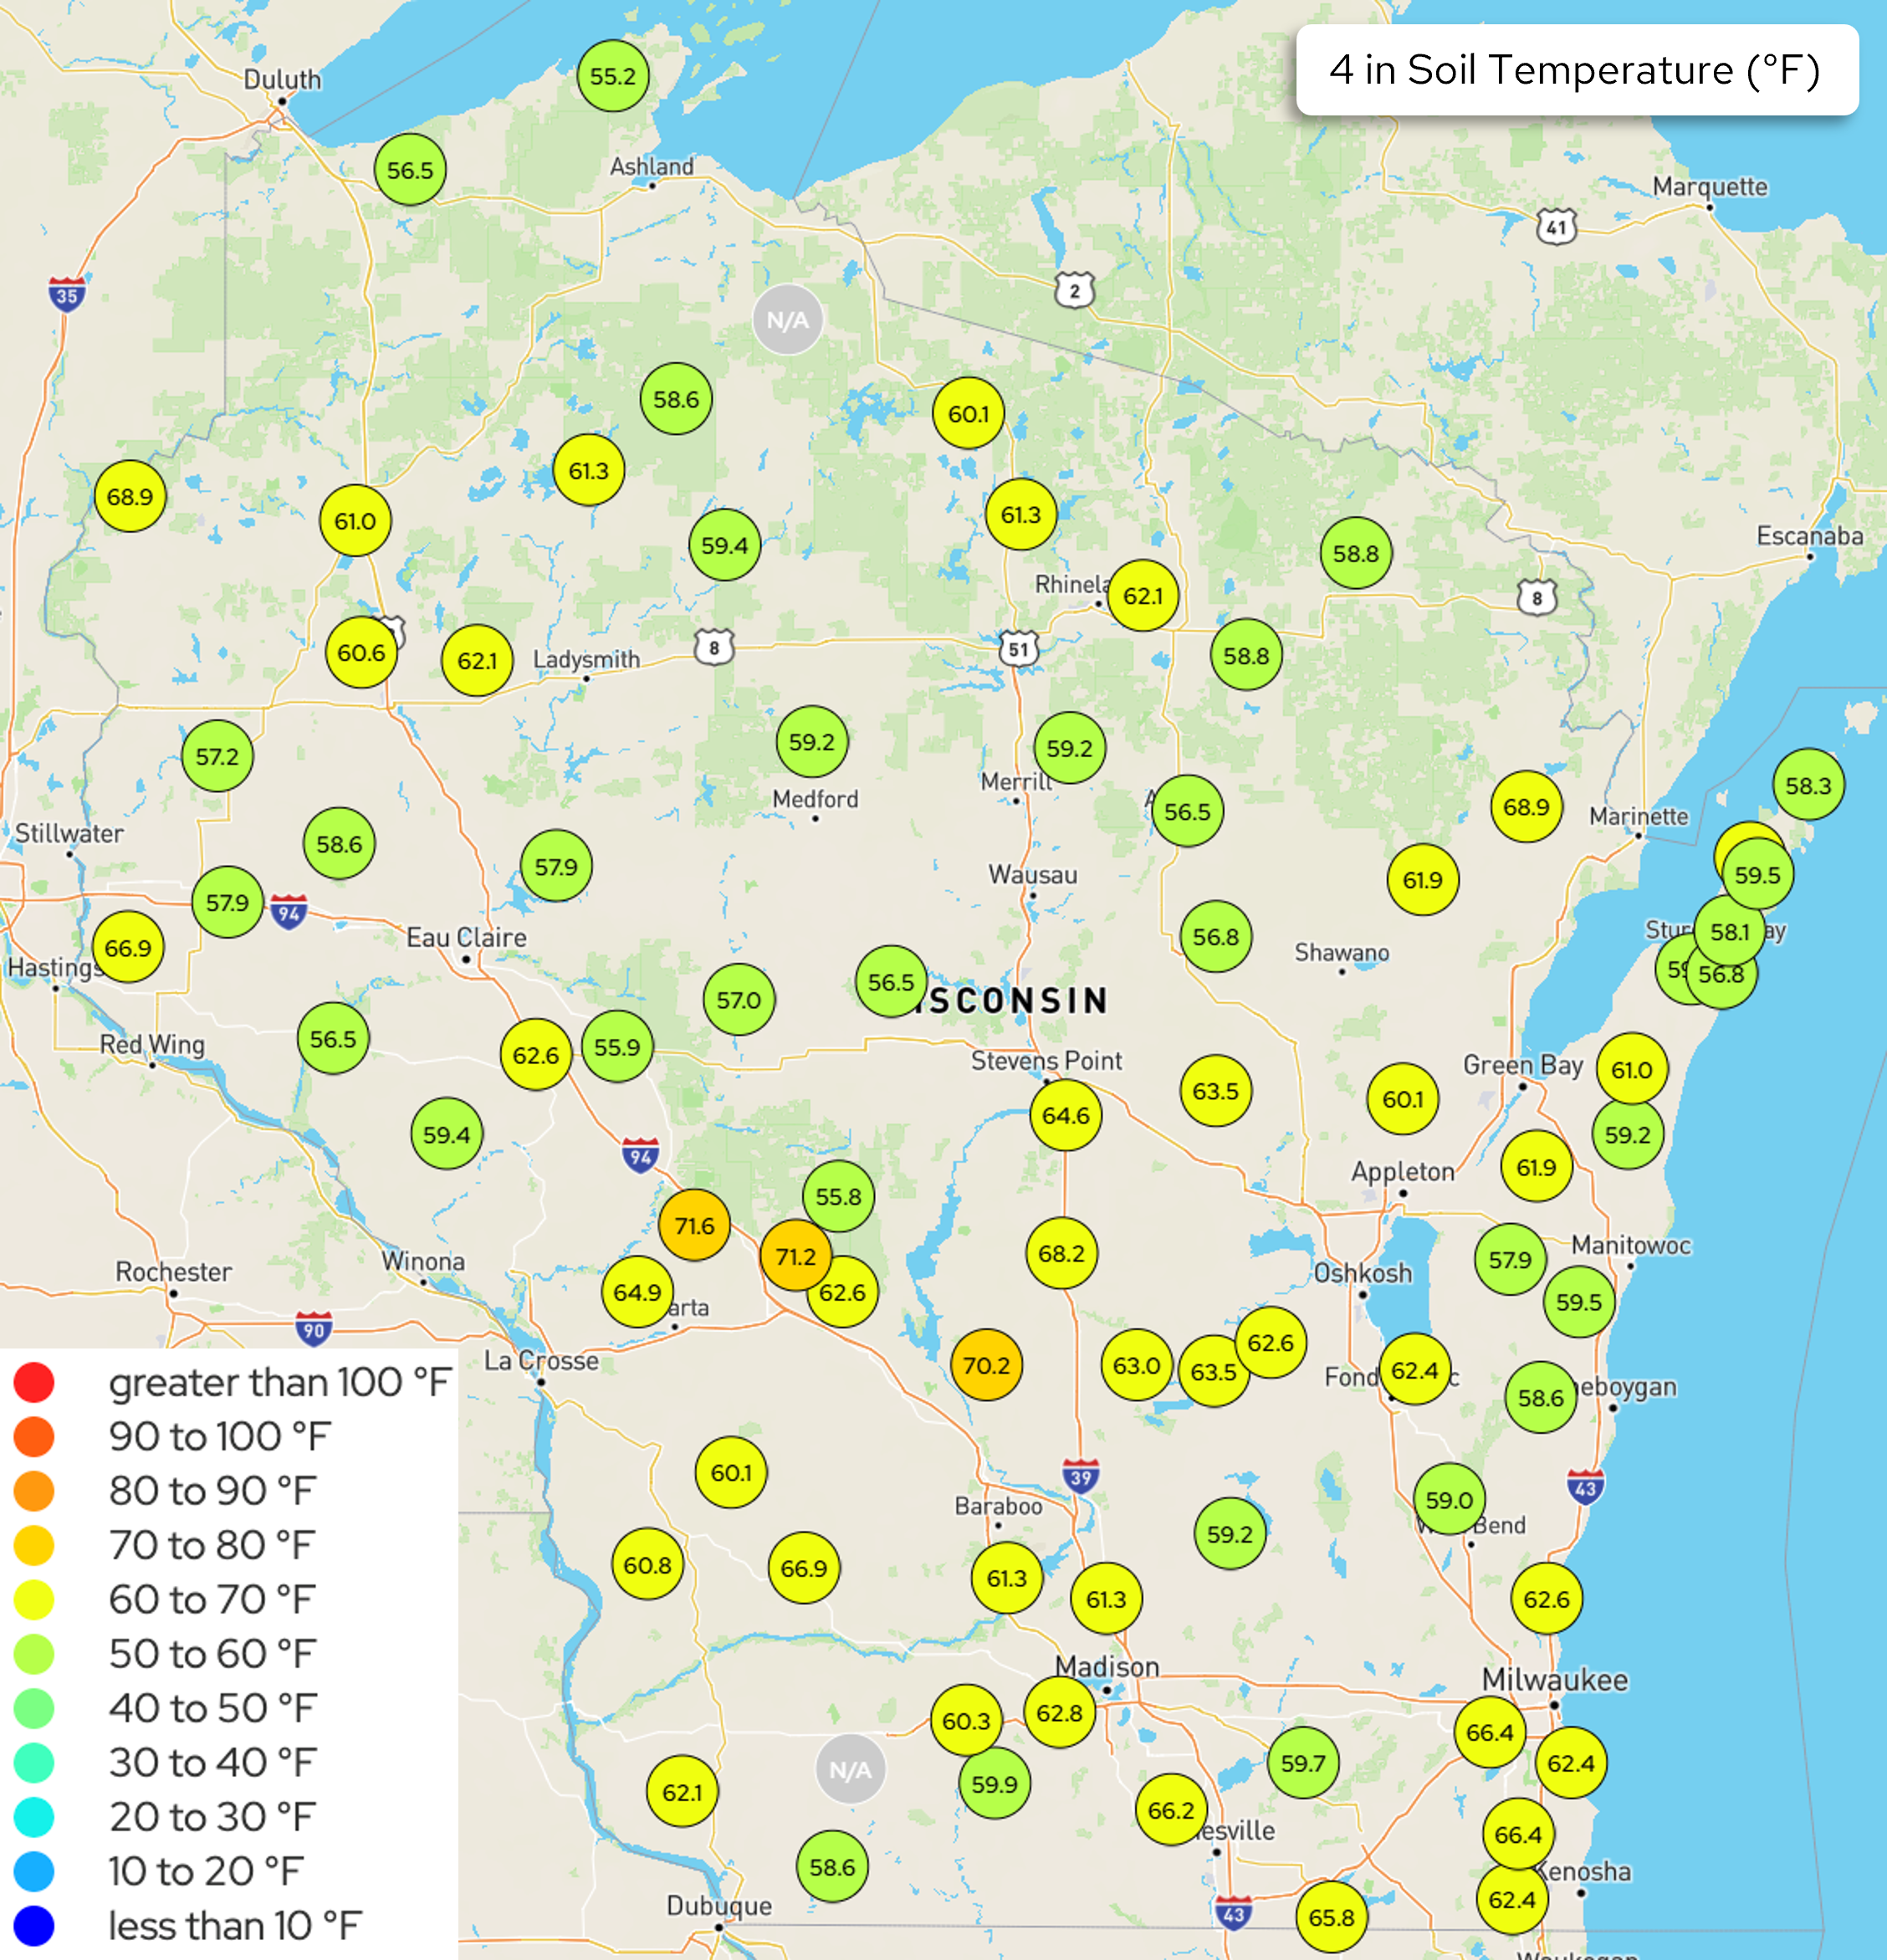
Image Description ↓
A color-coded map of Wisconsin displaying 4-inch soil temperatures in degrees Fahrenheit from weather station locations. The majority of readings fall in the 60–70°F range (yellow markers), with a cluster of green markers (50–60°F) in northern and central regions. Two orange markers near La Crosse in the southwest show the highest readings at 71.2°F and 71.6°F. A station near the Illinois border reads 70.2°F. Northern stations near Duluth/Ashland range from 55–62°F. The legend lists temperature bands from “less than 10°F” (dark blue) through “greater than 100°F” (red); no red, dark orange, or blue markers appear on this map. Two gray “N/A” markers indicate stations with unavailable data. Most values statewide range from approximately 56°F to 69°F.
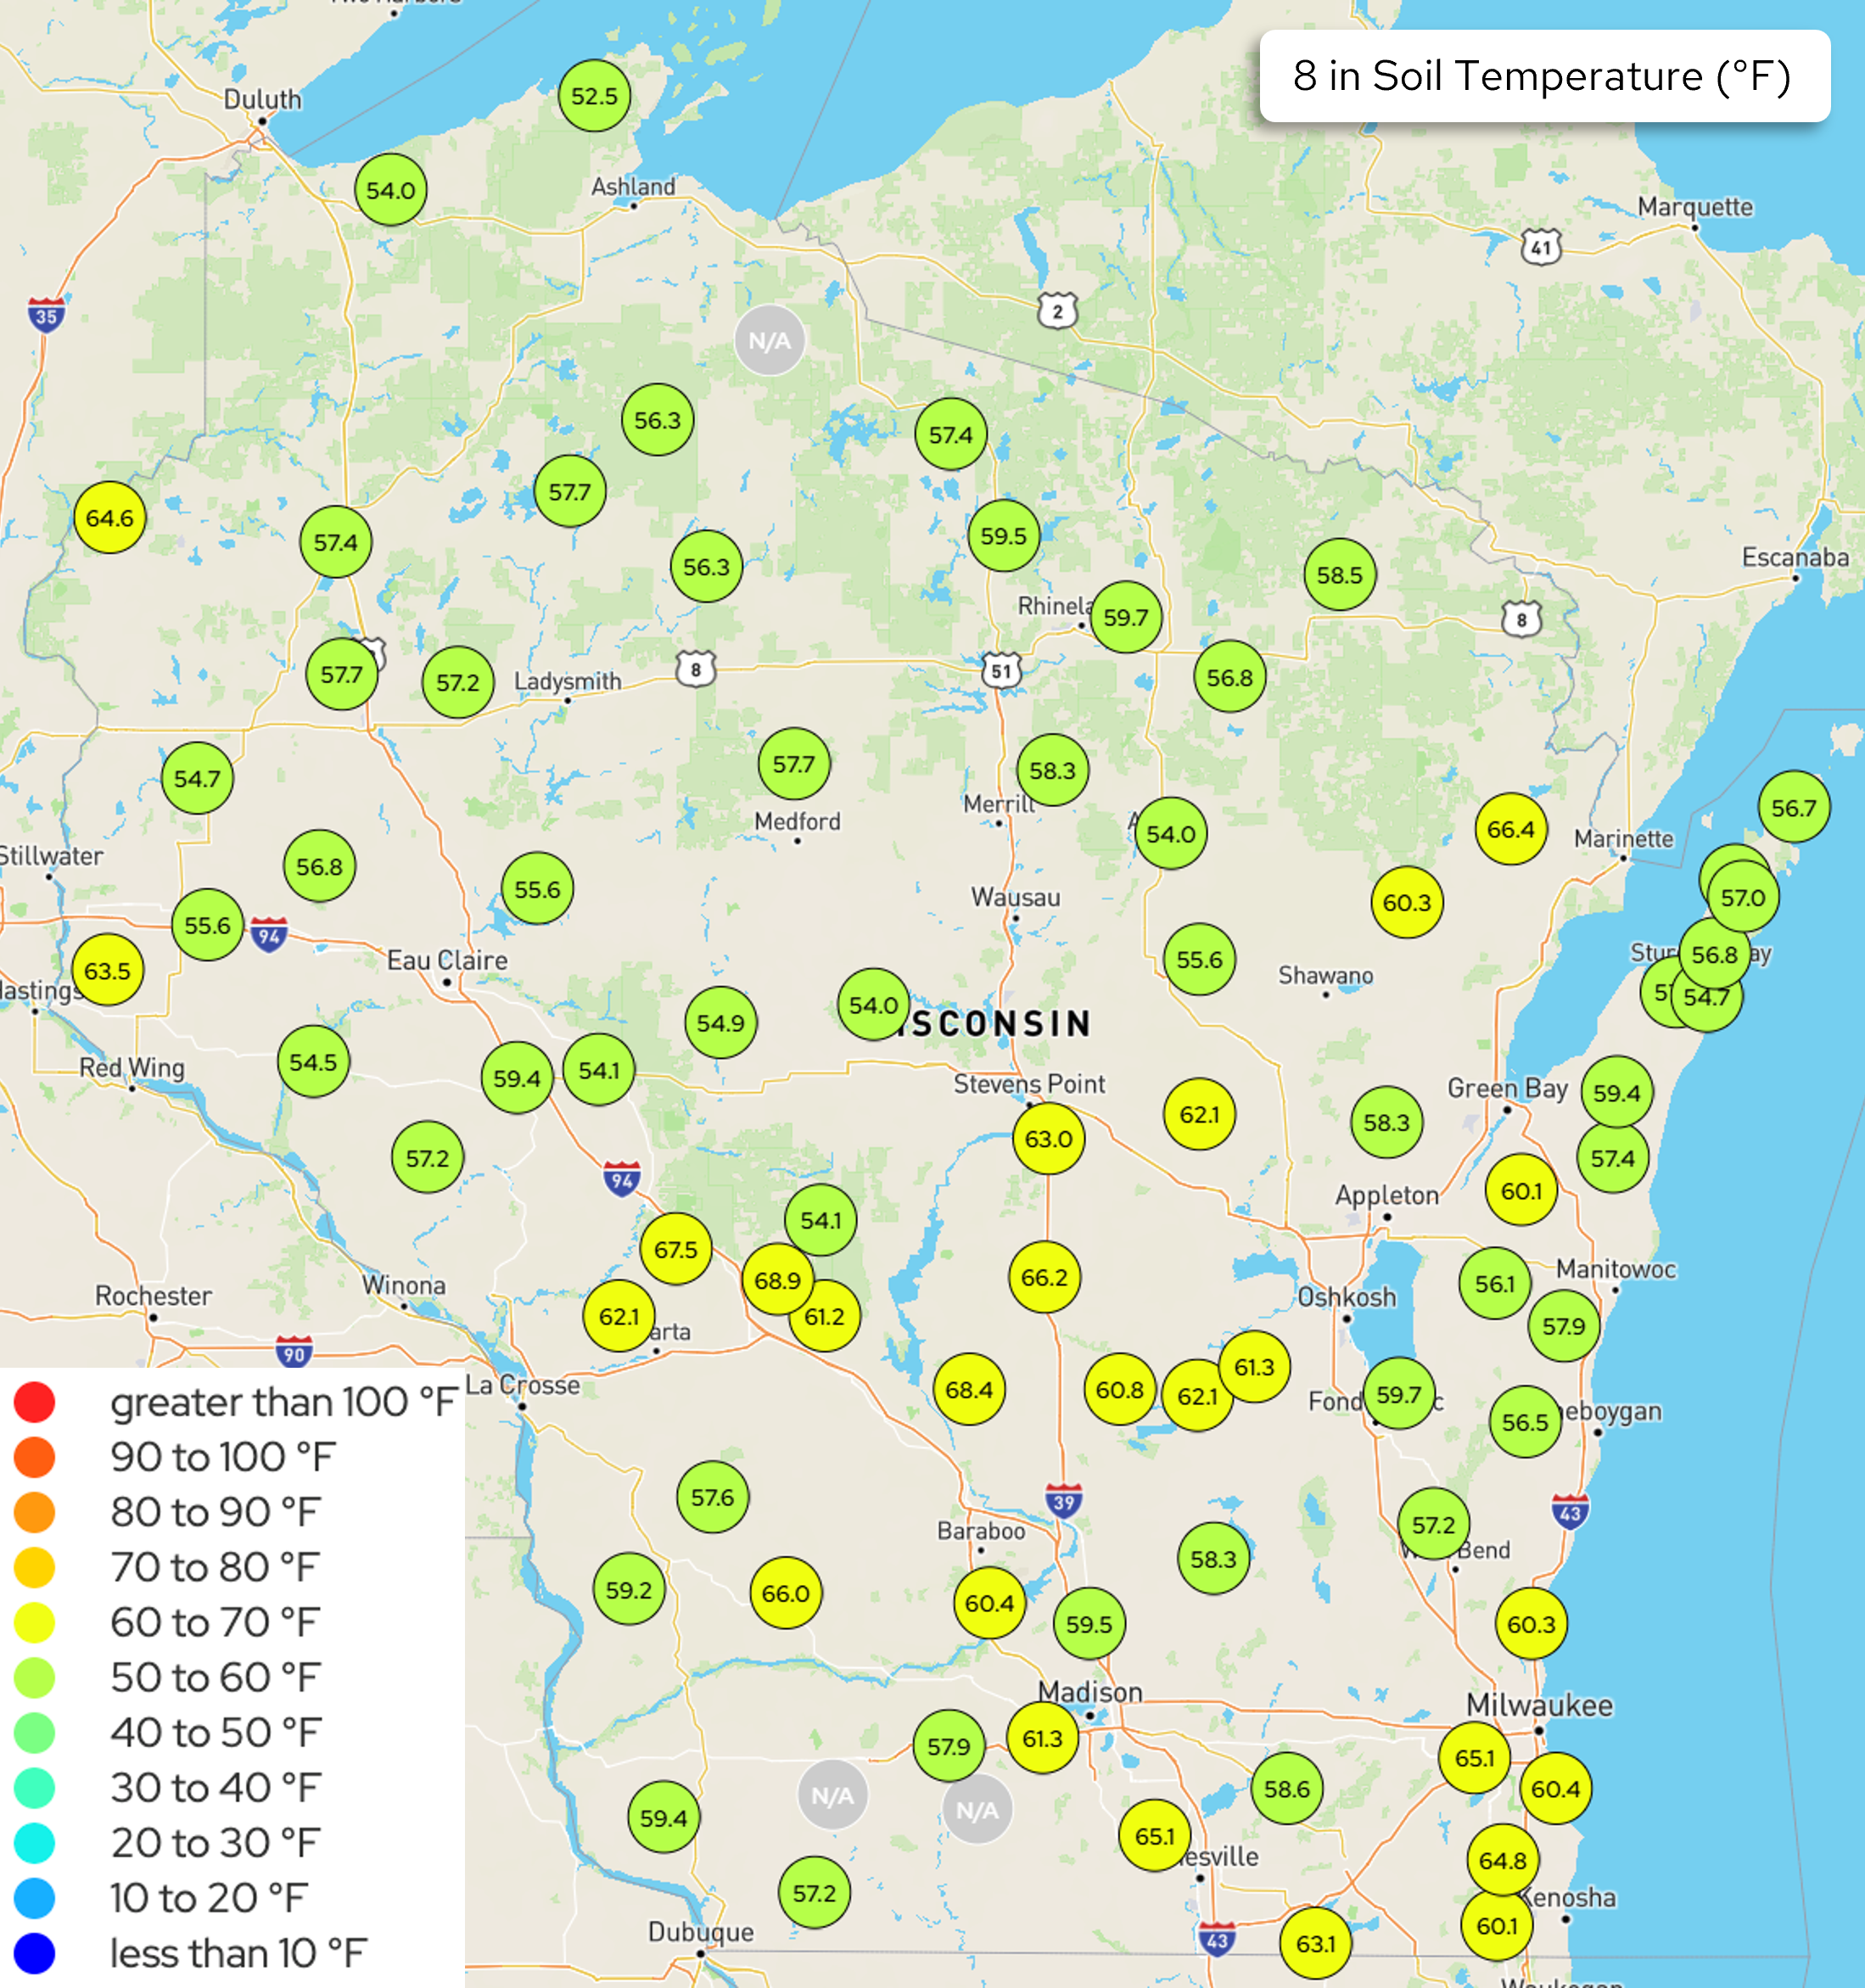
Image Description ↓
A color-coded map of Wisconsin showing 8-inch depth soil temperatures from weather station monitoring sites. Temperatures range from the upper 50s°F in the north to the upper 60s°F in parts of central and southern Wisconsin. Most northern stations show green markers (50–60°F); central and southern stations show yellow-green to yellow markers (60–70°F). Notable readings include 68.9°F near La Crosse, 68.4°F in central Wisconsin, 67.5°F west-central, and 66.4°F near Marinette. Madison-area stations read approximately 61–65°F. A color legend ranges from less than 10°F (dark blue) to greater than 100°F (red). Several stations are marked N/A.
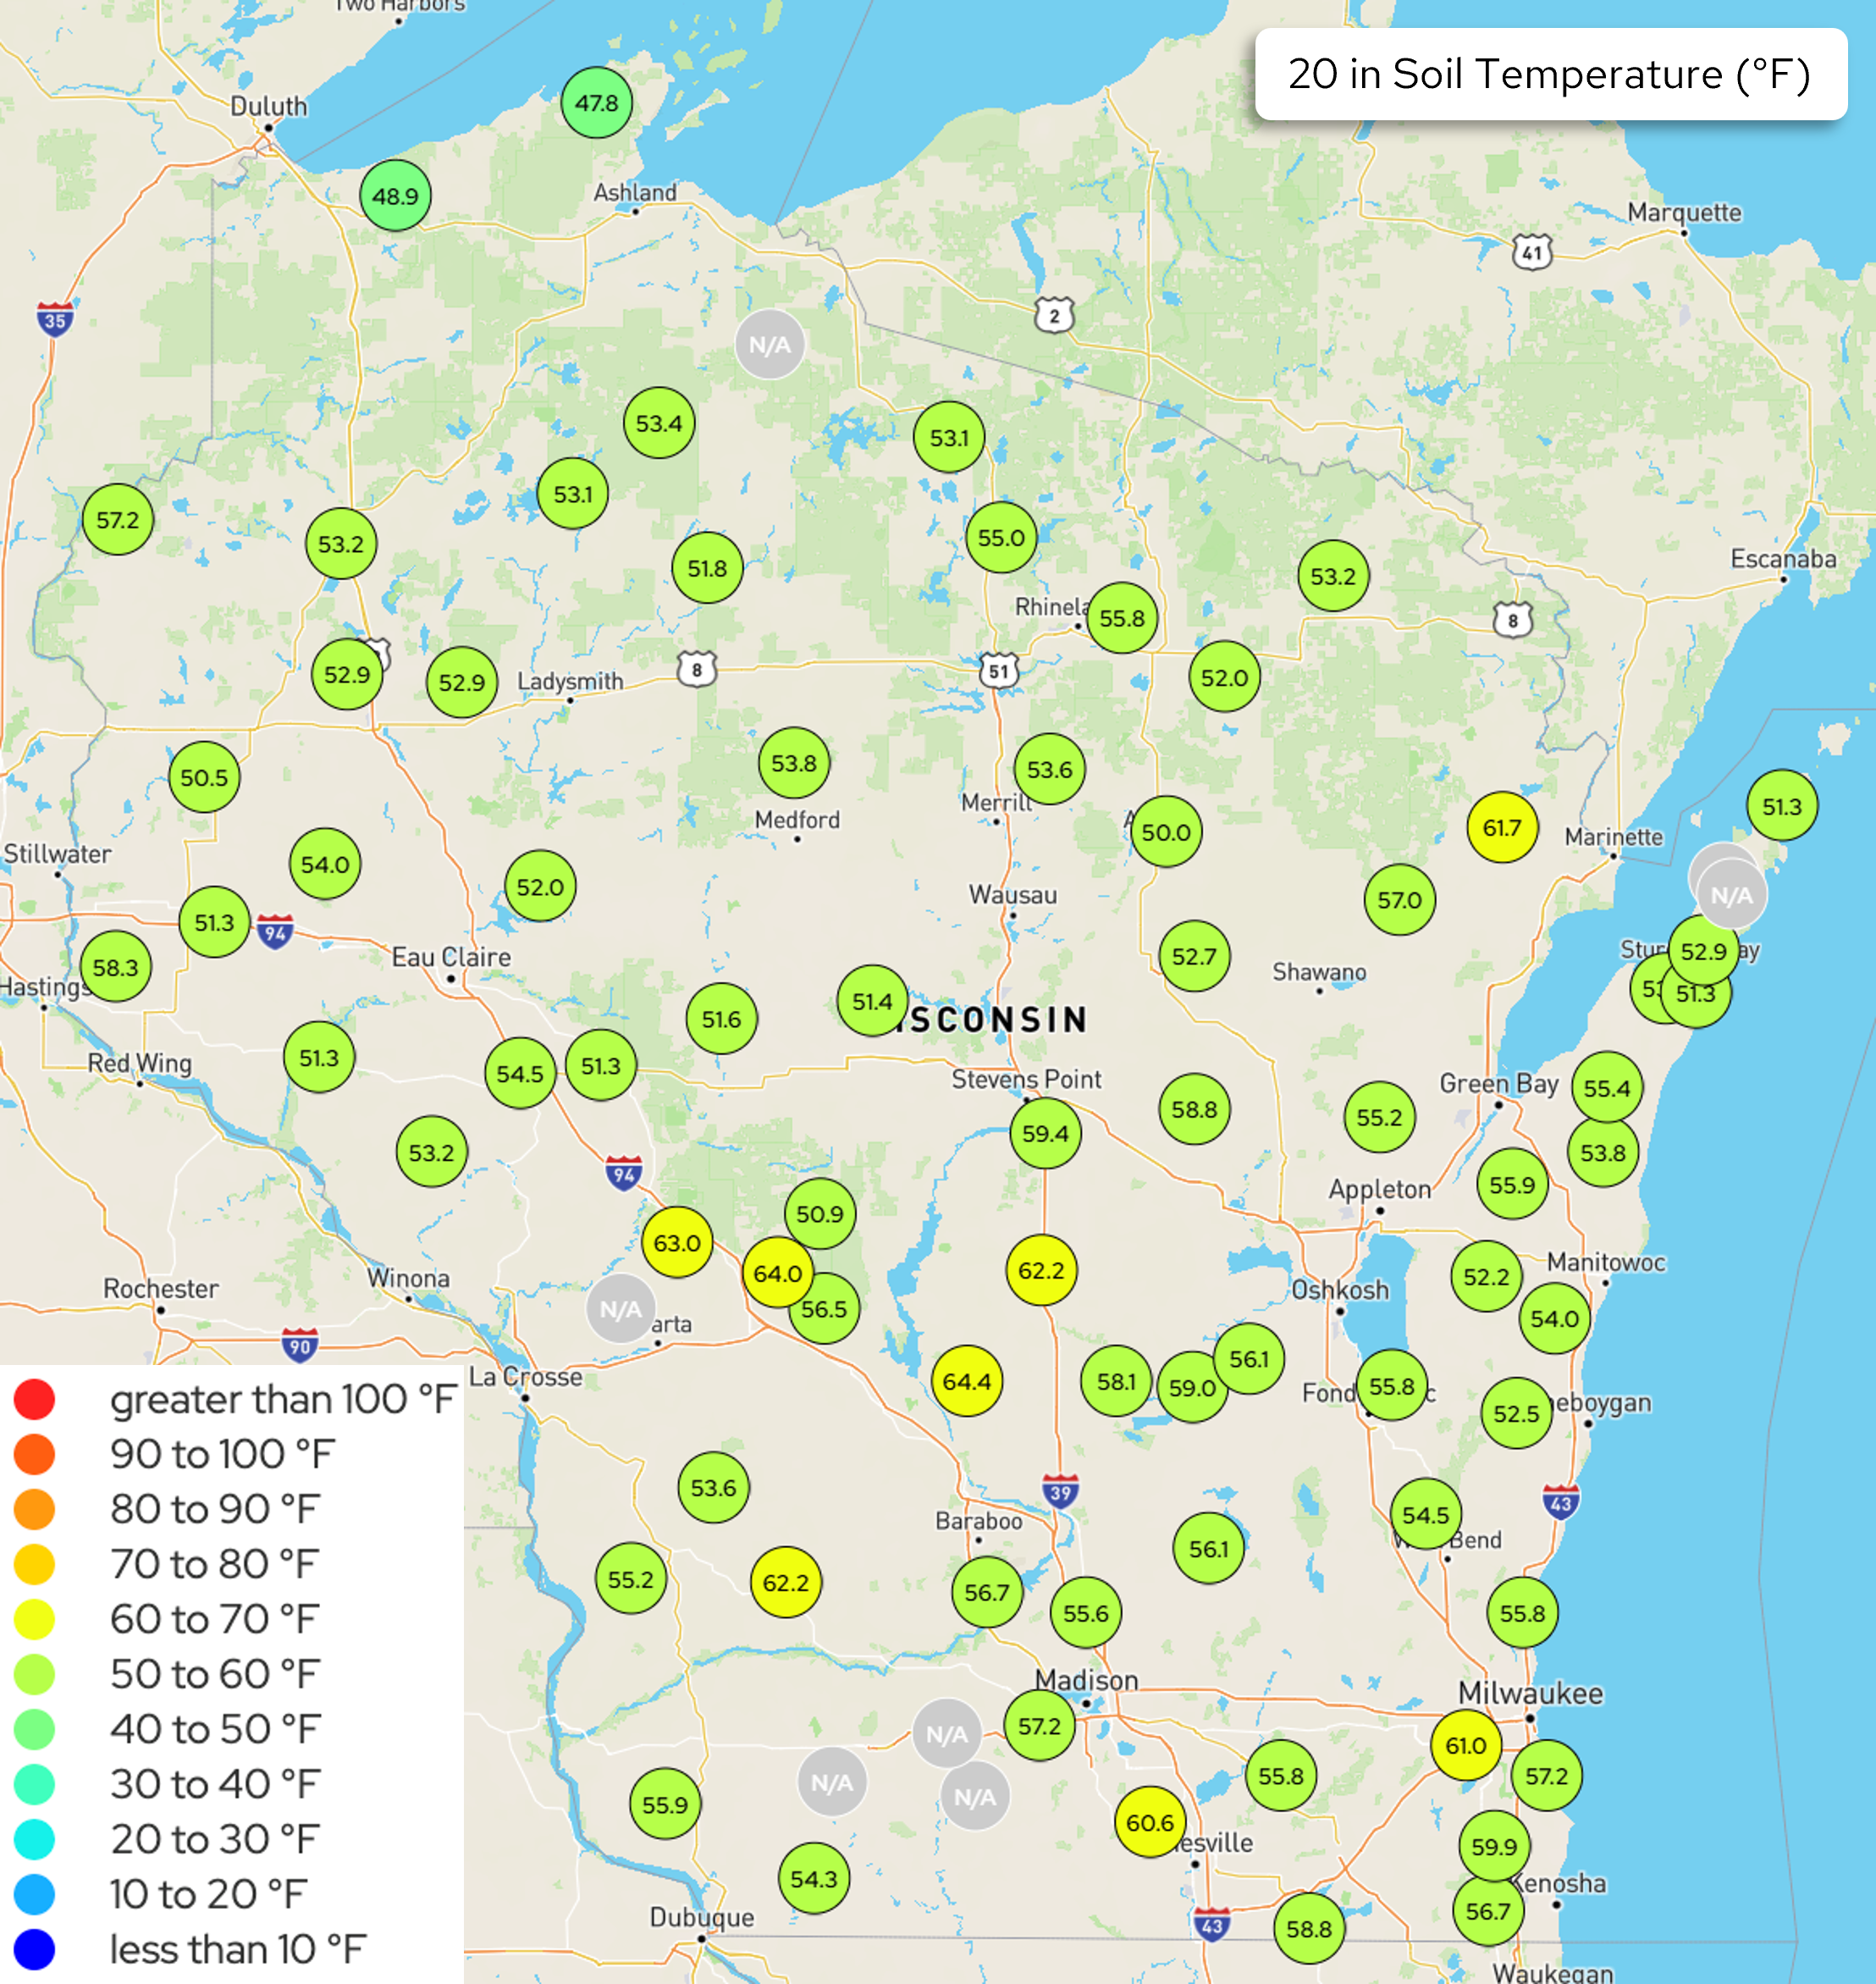
Image Description ↓
Map of Wisconsin showing 20-inch depth soil temperatures at weather station locations, labeled in degrees Fahrenheit. Color-coded markers indicate temperature ranges per the legend. Northern stations read 47–55°F (light green, 50–60°F range). Central Wisconsin stations range from 50–59°F. South-central and southwestern stations show warmer readings of 60–64°F (yellow, 60–70°F range), with isolated readings up to 64.4°F near Baraboo and 63°F near La Crosse. Eastern stations along Lake Michigan range from 52–61°F. Madison-area stations show 55–61°F. A few stations are marked N/A. No stations exceed 70°F.
- The maps show Wisconet soil temperature conditions on May 25th
U.S. Drought Monitor
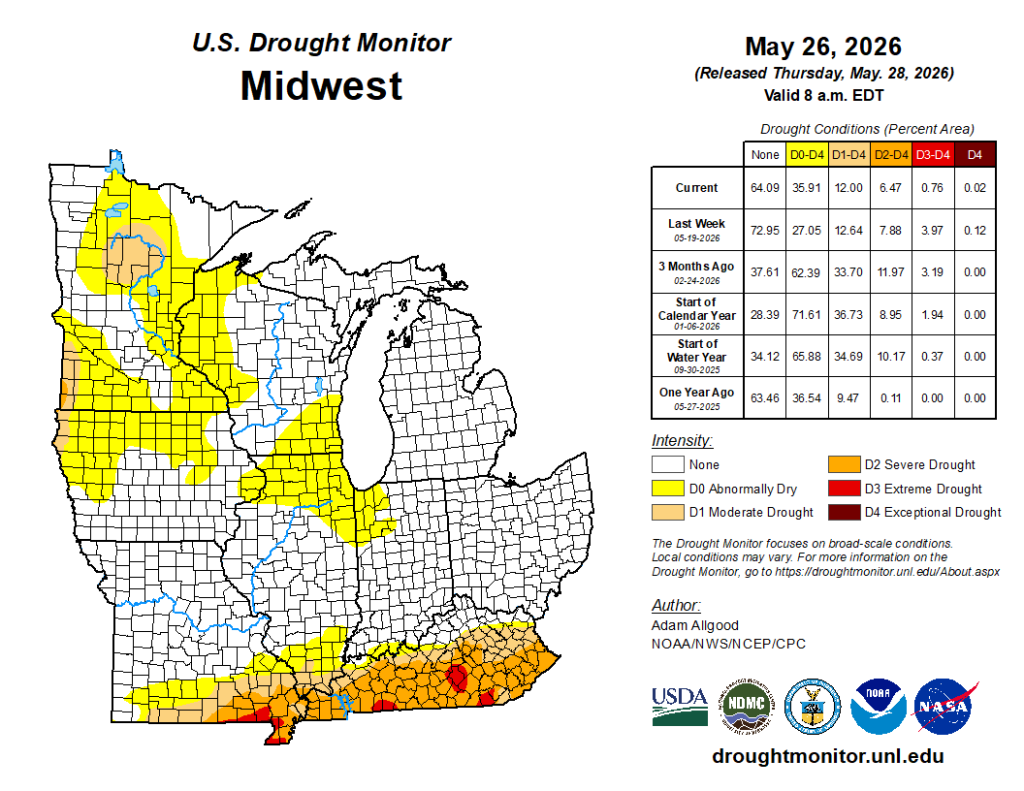
Image Description ↓
Color-coded county-level drought map of the 12-state Midwest region dated May 26, 2026, released by NOAA/USDA. The majority of the region (64%) shows no drought. Abnormally dry to moderate drought conditions (D0–D1) are concentrated in northern Minnesota and Wisconsin, and scattered areas of Iowa, Nebraska, and Kansas. Severe to extreme drought (D2–D3) appears in southern Missouri, Arkansas border counties, and isolated areas of Kentucky, with a small pocket of D3 extreme drought near the Arkansas/Missouri border. A data table shows current drought coverage: 35.91% in some drought (D0–D4), 12% at D1 or worse, 6.47% at D2 or worse, 0.76% at D3–D4, and 0.02% at exceptional drought (D4). Compared to last week, overall drought conditions have improved. Intensity legend ranges from None (white) through D0 Abnormally Dry (yellow), D1 Moderate (tan), D2 Severe (orange), D3 Extreme (red), to D4 Exceptional Drought (dark brown).
Compared to last week:
- Midwest: Coverage of D1-D4 drought decreased slightly from last week, but D0 (abnormally dry) coverage increased by about 9%. D0 coverage increased across Wisconsin and neighboring states.
- 88.0% of the Midwest region is drought free (~12.0% in D1-D4).
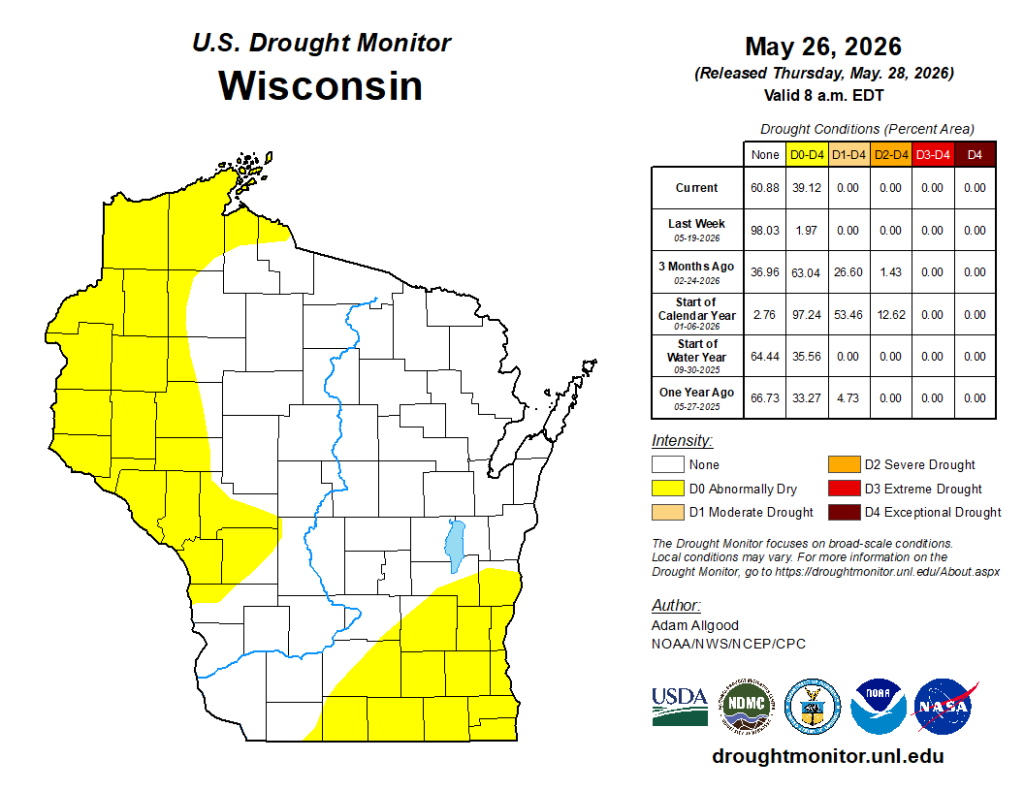
Image Description ↓
U.S. Drought Monitor map of Wisconsin dated May 26, 2026 (released May 28, 2026). The map shows D0 Abnormally Dry conditions (yellow) covering approximately 39.12% of the state, primarily along the western border and portions of southern Wisconsin. The remaining 60.88% shows no drought conditions. No D1–D4 drought conditions are currently present. Source: droughtmonitor.unl.edu. Author: Adam Allgood, NOAA/NWS/NCEP/CPC.
- Wisconsin: D0 coverage increased from 2% to 39%, encompassing counties in northwest, west central, and southeast Wisconsin.
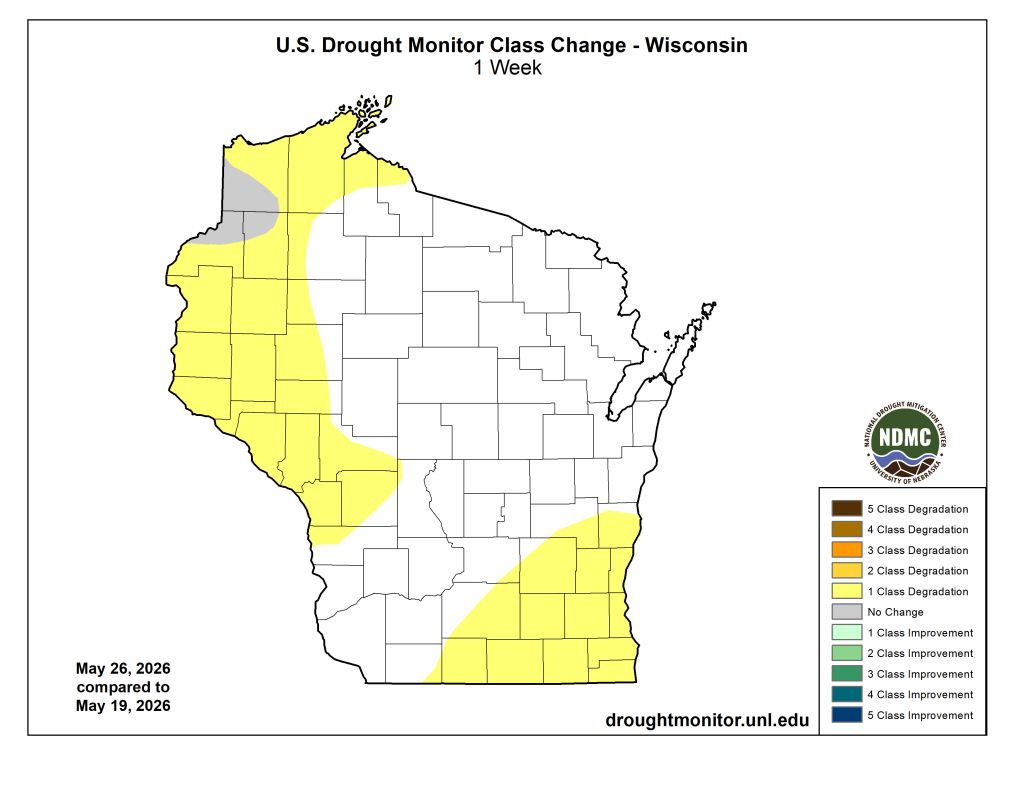
Image Description ↓
U.S. Drought Monitor Class Change map for Wisconsin comparing May 19 to May 26, 2026, published by the National Drought Mitigation Center at the University of Nebraska. The map shows drought condition changes by county using a color scale ranging from 5-class degradation (dark brown) to 5-class improvement (dark blue). Most of the state shows no change (white). The western third of the state shows 1-class degradation (light yellow), extending from the northwestern counties down through the west-central region and into the southwest. A smaller area in the far northwest shows no change (gray). The southeastern corner of the state also shows 1-class degradation. No improvement or severe degradation is indicated anywhere in the state.
- Some areas of the state are now in D0 (abnormally dry)
U.S. Drought Monitor Time Series
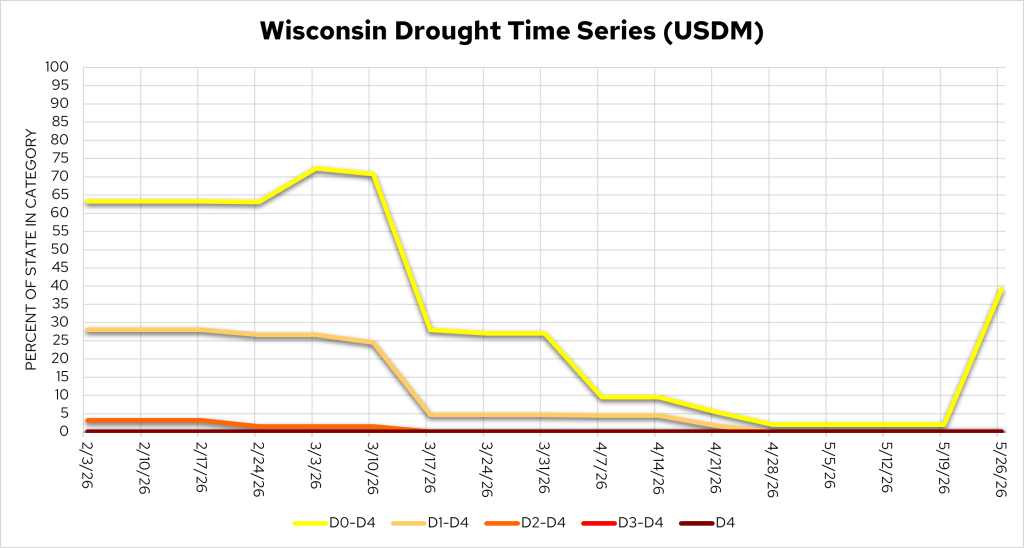
Image Description ↓
Line chart tracking the percent of Wisconsin in five USDM drought categories weekly from 2/3/26 to 5/26/26. The D0–D4 line (yellow) begins near 63%, peaks around 72% in early March, then drops sharply to roughly 27% by 3/17, continues declining to near 0% by late April, then surges to approximately 39% by 5/26. The D1–D4 line (tan/peach) follows a similar but lower trajectory, starting near 28%, dropping to near 0% by late April, with a slight uptick at the end. The D2–D4 line (orange) remains low throughout, under 5%, and trends to 0% by May. The D3–D4 (red) and D4 (dark red/maroon) lines remain near 0% for the entire period.
- D0 coverage increased by 37%, but the state remains drought free.
Temperature Trends
7 Day Temperatures
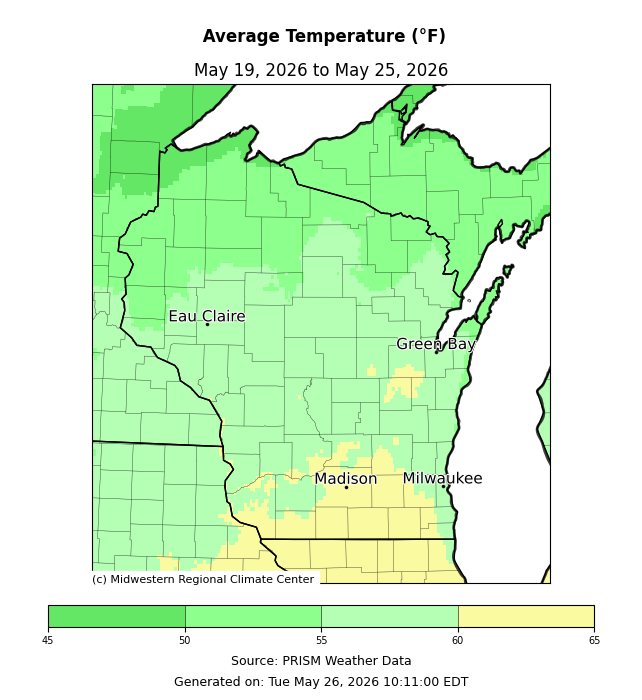
Image Description ↓
Map of Wisconsin showing average temperatures (°F) May 19–25, 2026. Northern Wisconsin averaged 45–52°F (dark green). Central Wisconsin averaged 52–57°F (medium green). Southern Wisconsin, including Madison and Milwaukee, averaged 57–65°F (light green to yellow). The warmest areas (60–65°F, yellow) appear along the Illinois border. Cities labeled: Eau Claire, Green Bay, Madison, Milwaukee. Source: PRISM Weather Data via Midwestern Regional Climate Center.
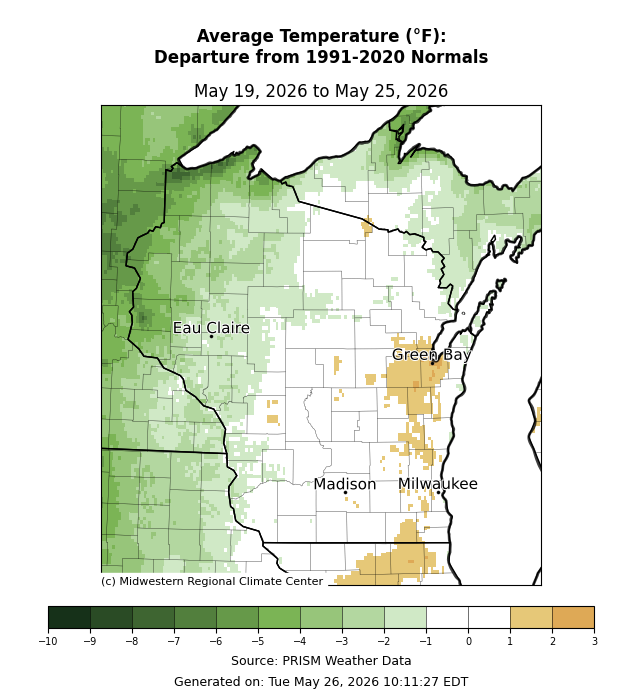
Image Description ↓
Map of Wisconsin and Upper Michigan showing average temperature departure from 1991–2020 normals, May 19–25, 2026. Most of the region is 1–6°F below normal (light to dark green). The Milwaukee–Green Bay corridor and far southeast Wisconsin show 1–3°F above normal (tan/brown). Central and western Wisconsin are near to slightly below normal. Source: PRISM Weather Data.
- Average temperatures ranged from 60-65°F in the south to 45-50°F along Lake Superior.
- Temperatures were 2-4°F below normal across northern counties. Further south, temperatures were close to normal.
30 Day Temperatures
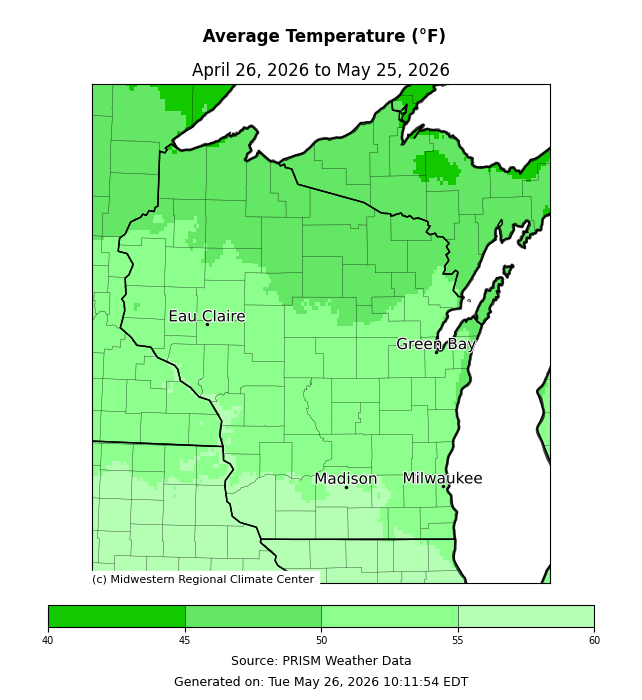
Image Description ↓
Choropleth map of Wisconsin and adjacent Minnesota counties showing average temperatures from April 26 to May 25, 2026, sourced from PRISM Weather Data. The color scale ranges from dark green (40°F) to light yellow-green (60°F). The majority of Wisconsin falls in the 50–55°F range (medium green). Northern Wisconsin and far northern Minnesota trend cooler at 45–50°F. Southern Wisconsin near Madison and Milwaukee trends slightly warmer at 55–58°F. A small area in the Upper Peninsula of Michigan (northeast corner) shows a darker green patch indicating cooler temps around 45–48°F. Cities labeled: Eau Claire, Green Bay, Madison, Milwaukee. Map generated May 26, 2026 by the Midwestern Regional Climate Center.
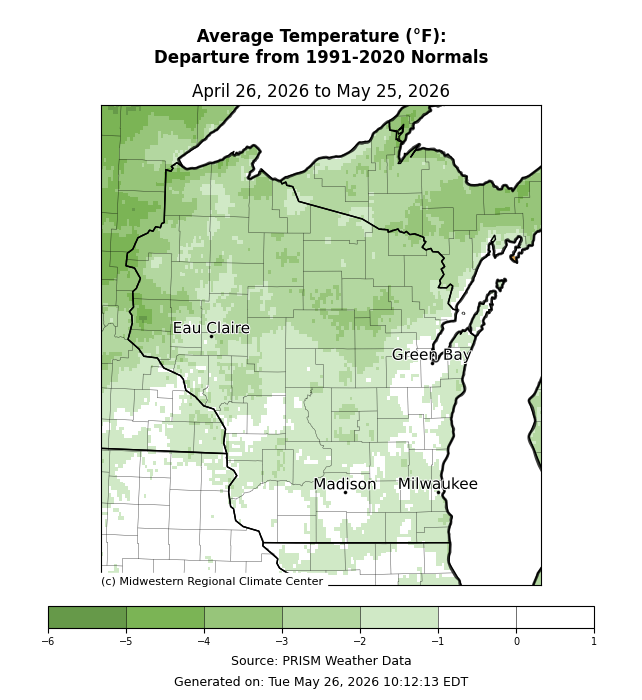
Image Description ↓
Choropleth map of Wisconsin from the Midwestern Regional Climate Center showing average temperature departure from 1991–2020 normals for the 30-day period April 26 to May 25, 2026. The color scale ranges from −6°F (dark green) to +1°F (white). Nearly the entire state falls between −1°F and −3°F below normal, shown in light to medium green. Northern Wisconsin shows slightly cooler departures of −3°F to −4°F in some counties. Southern Wisconsin, including areas near Madison and Milwaukee, shows patches near 0°F departure (near-white). No areas exceed +1°F above normal. Cities labeled: Eau Claire, Green Bay, Madison, Milwaukee. Data source: PRISM Weather Data. Generated May 26, 2026.
Growing Degree Days (Base 50°F)
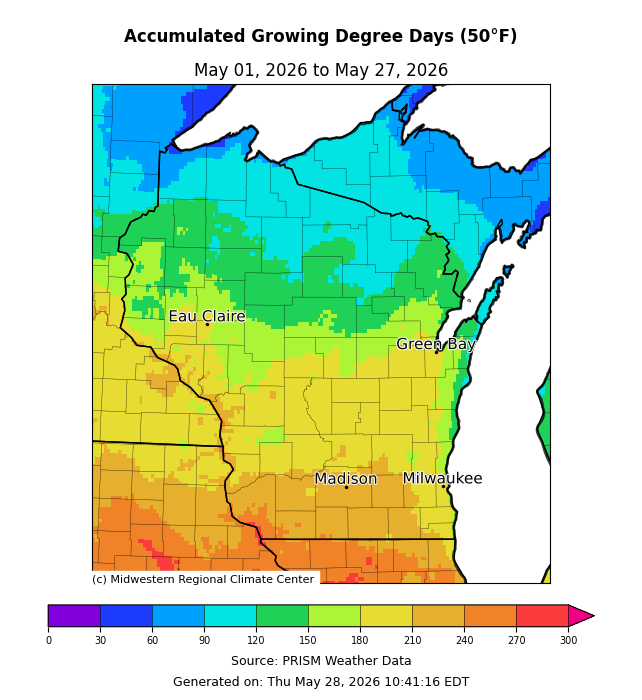
Image Description ↓
Choropleth map of Wisconsin and surrounding Midwest region showing accumulated growing degree days (base 50°F) from May 1–27, 2026, sourced from PRISM Weather Data via the Midwestern Regional Climate Center. A color scale from 0 (purple) to 300+ (pink/magenta) indicates GDD accumulation. Southern Wisconsin near Madison and Milwaukee shows moderate accumulation in the yellow-green range (approximately 150–210 GDD). Central and northern Wisconsin, including Green Bay and Eau Claire, shows lower accumulation in the cyan-to-green range (approximately 60–150 GDD). The northernmost areas of Wisconsin and the Upper Peninsula of Michigan show the least accumulation, appearing teal to blue (0–60 GDD). Iowa and Illinois to the south show the highest accumulation, in the orange-to-pink range (240–300+ GDD). Merton, Wisconsin (southeast-central area) falls within approximately 150–180 GDD based on its map position.
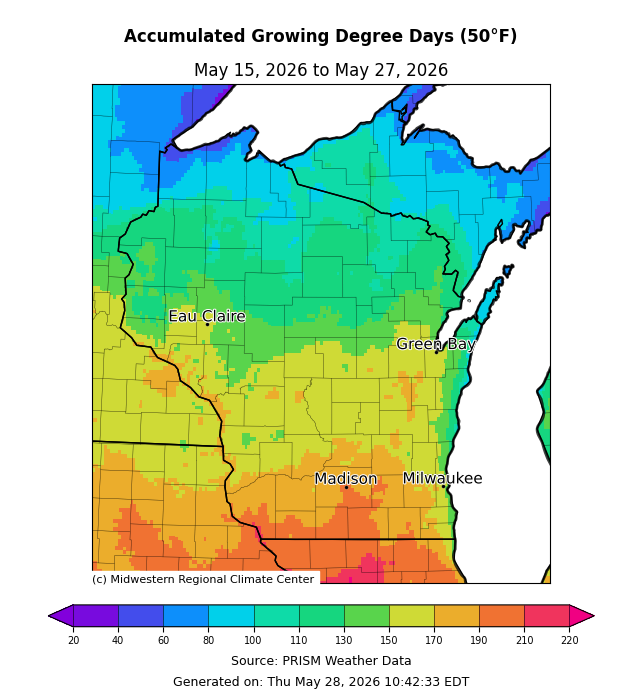
Image Description ↓
Map of accumulated growing degree days (base 50°F) across Wisconsin and neighboring states, May 15–27, 2026. Southern Wisconsin shows 150–220+ GDD (orange/red). Central Wisconsin, including the Madison and Milwaukee areas, ranges from roughly 100–170 GDD (yellow/green). The Green Bay and Eau Claire areas show approximately 80–130 GDD (green/teal). Northern Wisconsin has the lowest accumulation at 20–80 GDD (blue/purple). Data sourced from PRISM Weather Data; generated May 28, 2026.
- Starting May 1 – Growing degree day accumulation ranges from 240 GDD in the far south to 90 GDD in the far north. These values are 80-100% of normal.
- Starting May 15 – Growing degree day accumulation ranges from 210 GDD in the far south to 80 GDD in the far north. These values are 125-140% of normal.
Crop Progress and Condition
Crop Progress Report for Wisconsin for the Week Ending on May 29th
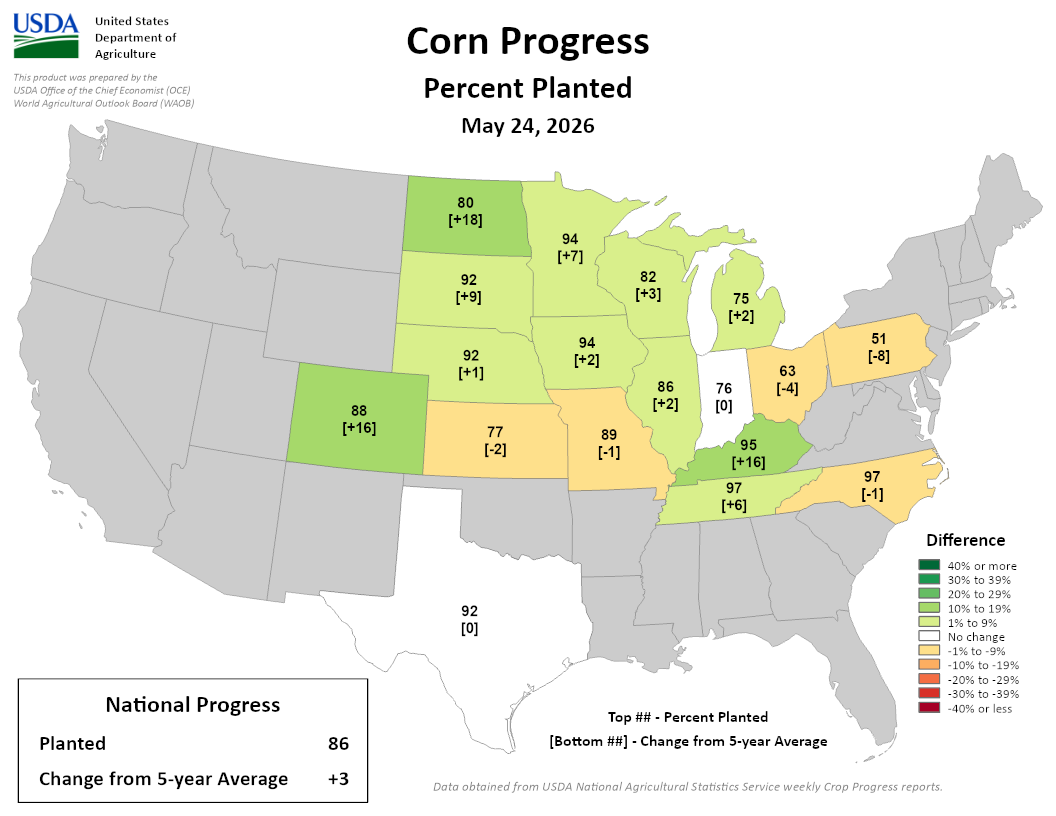
Image Description ↓
Choropleth map of U.S. corn-planting progress as of May 24, 2026, from USDA NASS. States are color-coded by change from the 5-year average, ranging from dark green (40%+ above) to dark red (40%+ below).
State data (Percent Planted [Change from 5-year Average]):
- North Dakota: 80% [+18]
- South Dakota: 92% [+9]
- Nebraska: 92% [+1]
- Colorado: 88% [+16]
- Kansas: 77% [−2]
- Minnesota: 94% [+7]
- Iowa: 94% [+2]
- Missouri: 89% [−1]
- Wisconsin: 82% [+3]
- Illinois: 86% [+2]
- Michigan: 75% [+2]
- Indiana: 76% [0]
- Ohio: 63% [−4]
- Kentucky: 95% [+16]
- Tennessee: 97% [+6]
- Pennsylvania: 51% [−8]
- North Carolina: 97% [−1]
- Texas: 92% [0]
National Progress: 86% planted, +3 from 5-year average.
Most Corn Belt states are at or above average. Notable leaders above average: North Dakota (+18), Colorado (+16), Kentucky (+16). Pennsylvania is the furthest below average (−8).
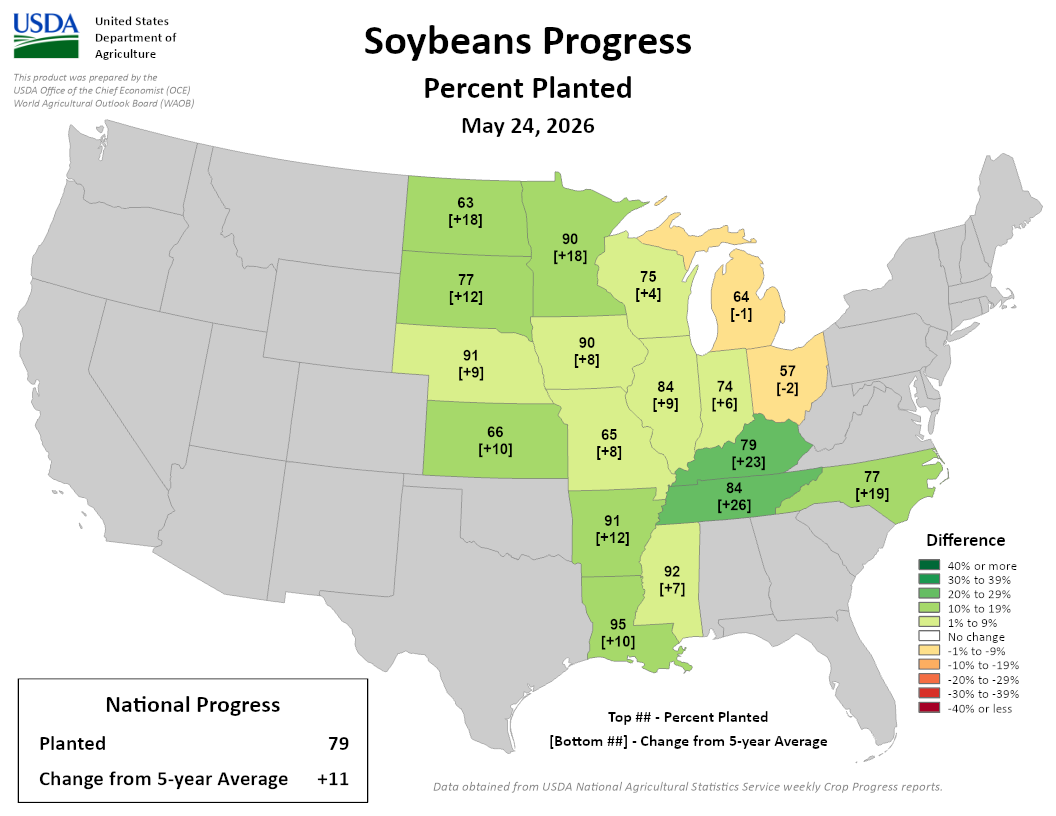
Image Description ↓
USDA choropleth map titled “Soybeans Progress — Percent Planted, May 24, 2026,” produced by the USDA Office of the Chief Economist. Each state displays two values: percent planted (top) and change from 5-year average in brackets (bottom).
State data:
- North Dakota: 63%, +18
- South Dakota: 77%, +12
- Nebraska: 91%, +9
- Kansas: 66%, +10
- Minnesota: 90%, +18
- Iowa: 90%, +8
- Missouri: 65%, +8
- Wisconsin: 75%, +4
- Illinois: 84%, +9
- Indiana: 74%, +6
- Michigan: 64%, −1
- Ohio: 57%, −2
- Kentucky: 79%, +23
- Tennessee: 84%, +26
- North Carolina: 77%, +19
- Arkansas: 91%, +12
- Mississippi: 92%, +7
- Louisiana: 95%, +10
Color legend (difference from 5-year average): Dark green = +40% or more; medium greens indicate +10–39%; light green = +1–9%; white = no change; yellow/orange = −1–19% below average; red shades = −20% or greater below average. Most states appear in green tones, indicating above-average planting progress. Michigan and Ohio are shaded orange, reflecting slight below-average progress.
National Progress box: Planted: 79%; Change from 5-year average: +11.
- Wisconsin had 5.4 days suitable for fieldwork statewide.
- Corn planting is at 82% complete, up from 20% last week. Corn is 37% emerged.
- Soybean planting is at 75% complete, up from 21% last week. Soybeans are 27% emerged.
- Oat planting is 85% complete, with emergence at 56% complete.
- Pasture and range were rated 59% good to excellent, up 2 percentage points from last week.
- Winter wheat was rated 65% good to excellent, up 3 percentage points from last week. Winter wheat is 11% headed.
- The first cutting of alfalfa is 13% complete.
- Read the full USDA report.
Forecasts and Outlooks
7 Day Precipitation Forecast
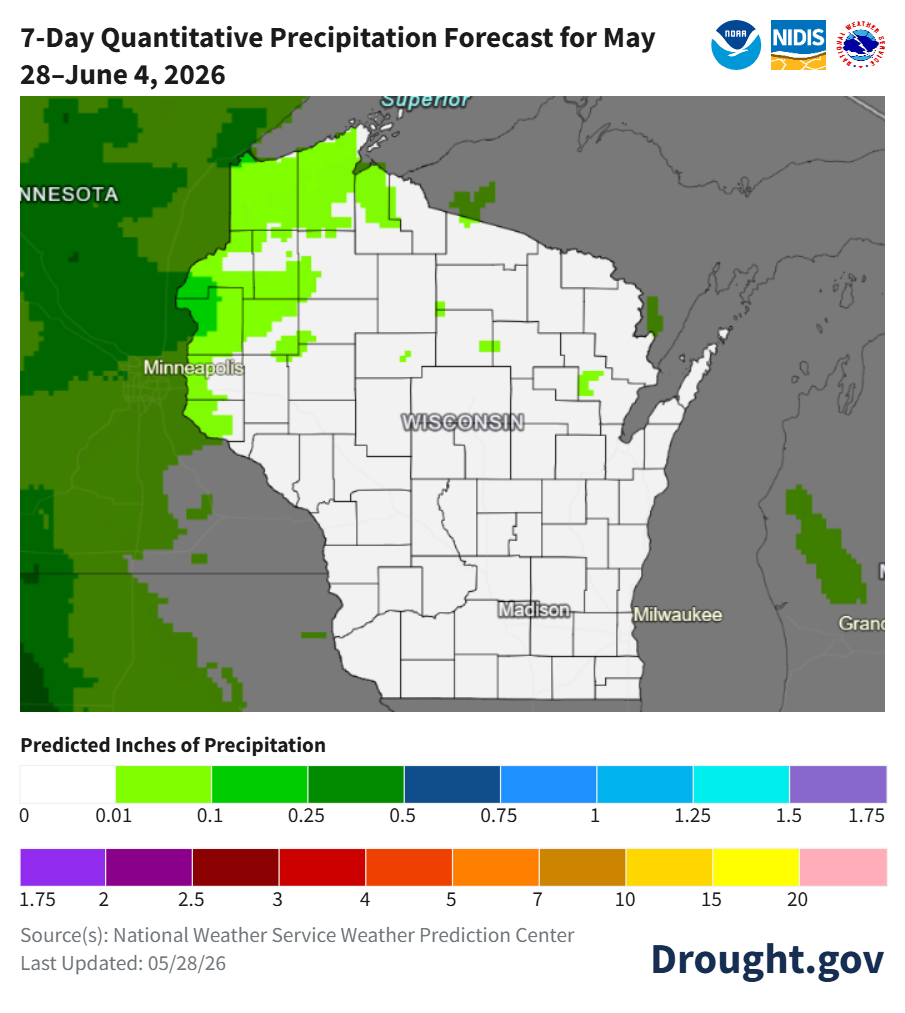
Image Description ↓
NOAA/NIDIS quantitative precipitation forecast map (last updated 05/28/26) covering the upper Midwest. Wisconsin is largely white (0 inches predicted), with scattered light green areas in the far northern counties indicating 0.01–0.25 inches of precipitation. A small patch of light green also appears along the Lake Michigan shoreline in eastern Wisconsin. Minnesota, shown to the west, displays extensive bright and dark green coverage indicating 0.1–0.5+ inches, with the heaviest totals in the northwest corner. The color scale runs from white (0″) through greens (0.01–0.5″), blues (0.5–1.25″), cyans (1.25–1.75″), purples and reds (1.75–4″), oranges and yellows (5–20″). Madison and Milwaukee are labeled within Wisconsin’s largely dry interior. Source: National Weather Service Weather Prediction Center.
- When? – Rain chances are minimal next week, but the best chances are on Wednesday and Thursday (6/3-6/4).
- Where? – Light precipitation is most likely in the northwest. For most, little to no precipitation is forecasted.
- Check your local forecast for details on totals and timing.
- Average precip (1991-2020) for this week: 1.01”.
8-14 Day Temperature and Precipitation Outlook
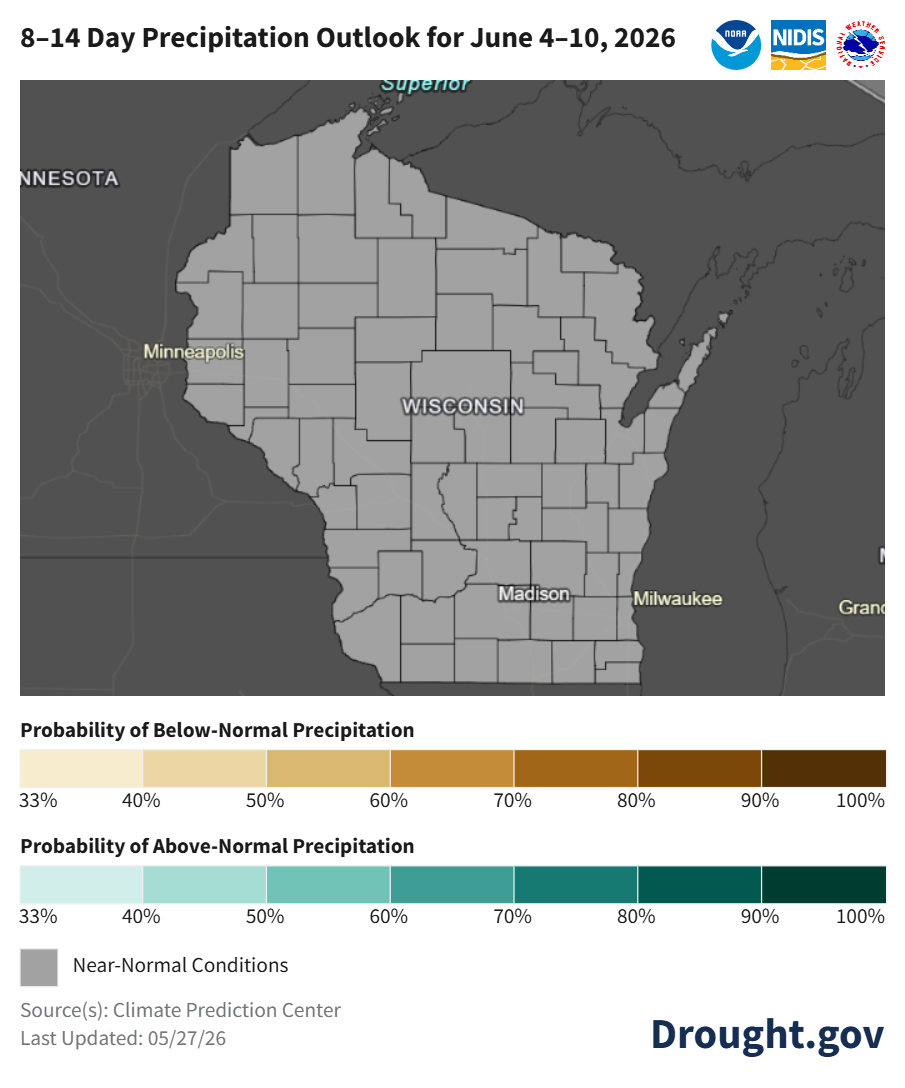
Image Description ↓
NOAA/NIDIS Climate Prediction Center map of Wisconsin showing county-level precipitation probability for June 4–10, 2026. All counties are shaded gray, indicating near-normal precipitation conditions statewide. No areas show elevated probability of below-normal (brown) or above-normal (teal) precipitation. Map last updated 05/27/26. Source: Drought.gov.
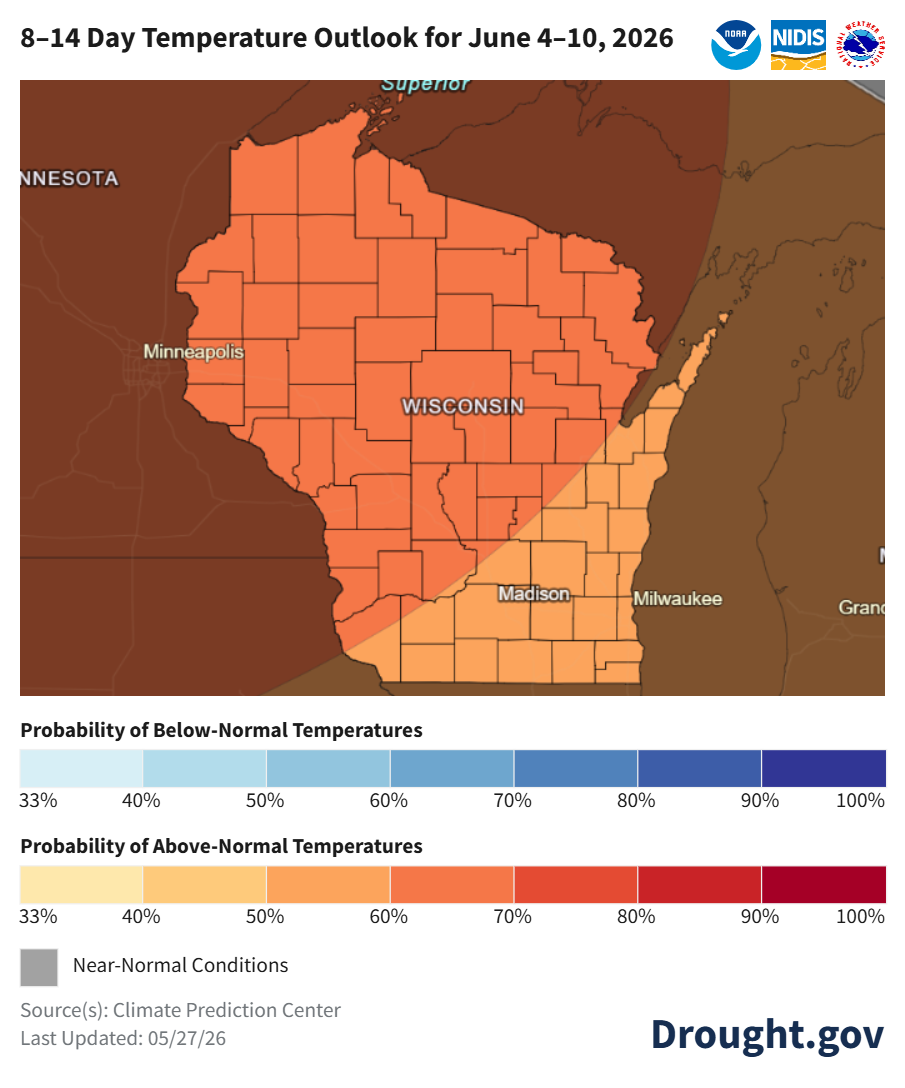
Image Description ↓
A color-coded map from NOAA’s Climate Prediction Center (via Drought.gov, updated 05/27/26) showing temperature probabilities for Wisconsin and surrounding region. Northern and central Wisconsin show 60–70% probability of above-normal temperatures (medium orange). Southwestern Wisconsin shows 70–80% probability (darker orange). Southeastern Wisconsin, including the Madison and Milwaukee areas, shows 40–50% probability of above-normal temperatures (light orange/peach). Minnesota and areas west of Wisconsin show 80–100% probability of above-normal temperatures (dark brown/red). A color scale is provided: blue tones indicate probability of below-normal temperatures (33–100%); orange-to-red tones indicate probability of above-normal temperatures (33–100%); gray indicates near-normal conditions.
- Early June: Temperatures are leaning strongly (60-70% chance) towards above normal for most. Further south and east, the odds are slightly less (50-60%). Precipitation is leading towards near normal statewide.
- Statewide normals (1991-2020) for June 4-10 are 62.9°F and 1.12”.
30 Day Temperature and Precipitation Outlook
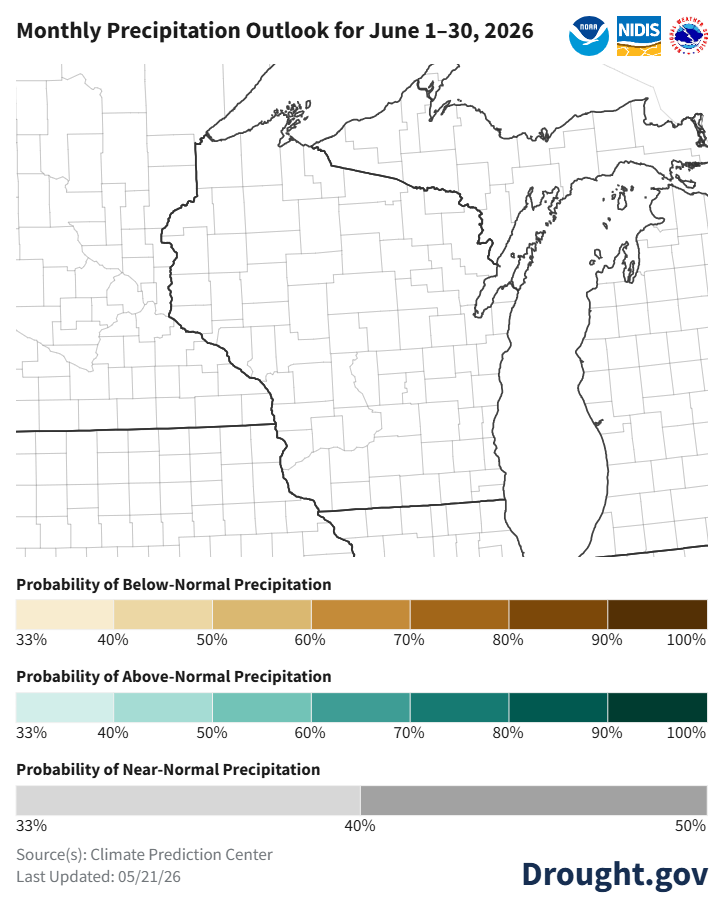
Image Description ↓
NOAA/NIDIS Climate Prediction Center map dated 05/21/26 showing the Monthly Precipitation Outlook for June 1–30, 2026, covering Wisconsin, Michigan, Minnesota, Illinois, Indiana, Ohio, and surrounding Great Lakes states. The entire mapped region is uncolored (white), indicating equal chances of below-, near-, or above-normal precipitation with no dominant signal. The legend shows three scales: Probability of Below-Normal Precipitation (tan to dark brown, 33–100%), Probability of Above-Normal Precipitation (light to dark teal, 33–100%), and Probability of Near-Normal Precipitation (light to medium gray, 33–50%). No counties on the map are shaded in any color. Source: Drought.gov.
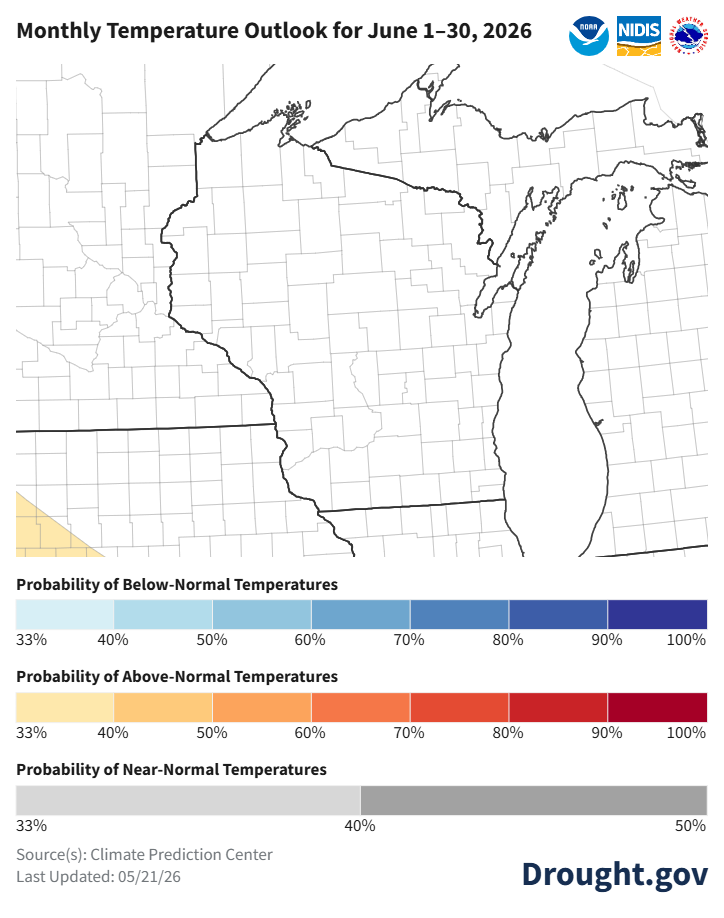
Image Description ↓
NOAA/NIDIS Monthly Temperature Outlook map for June 1–30, 2026, covering the upper Midwest. Nearly all of Wisconsin, Michigan, Minnesota, and surrounding states show no color fill, indicating equal chances of below-, near-, or above-normal temperatures. A small area in the far southwest corner (parts of southwestern Iowa/northwestern Missouri) is shaded light yellow, indicating a 33–40% probability of above-normal temperatures. Source: Climate Prediction Center. Last Updated: 05/21/26.
- June: Temperatures and precipitation are uncertain currently with equal chances for above, near, or below normal conditions.
- Statewide normals (1991-2020) for June 1-30 are 65.1°F and 4.69”.
90 Day Temperature and Precipitation Outlook
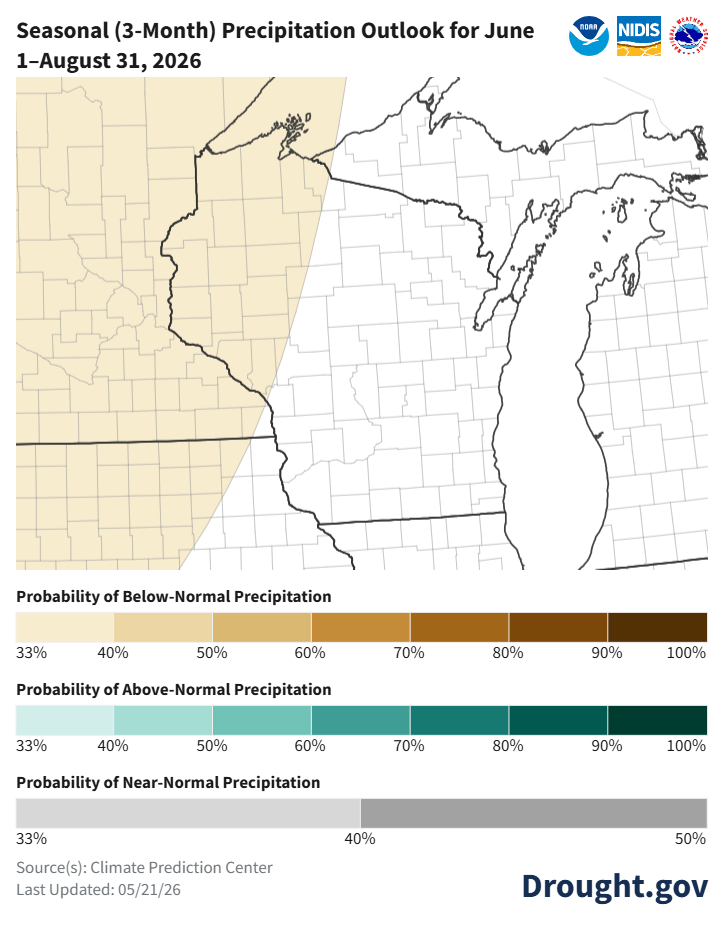
Image Description ↓
NOAA/NIDIS Climate Prediction Center map covering the Great Lakes region. The western portion of the map — encompassing most of Wisconsin west of a diagonal line running roughly northeast to southwest, plus portions of Minnesota, Iowa, and Illinois — is shaded in light tan/beige, indicating a 33–40% probability of below-normal precipitation from June 1 through August 31, 2026. The eastern portion of the map, including Michigan, the Upper Peninsula, and eastern Wisconsin, is unshaded (white), indicating equal chances of above-, near-, or below-normal precipitation. No areas show elevated probability of above-normal precipitation. Three color-scale legends are shown: brown tones for below-normal (33–100%), teal tones for above-normal (33–100%), and gray for near-normal (33–50%). Source: Climate Prediction Center. Last updated 05/21/26.
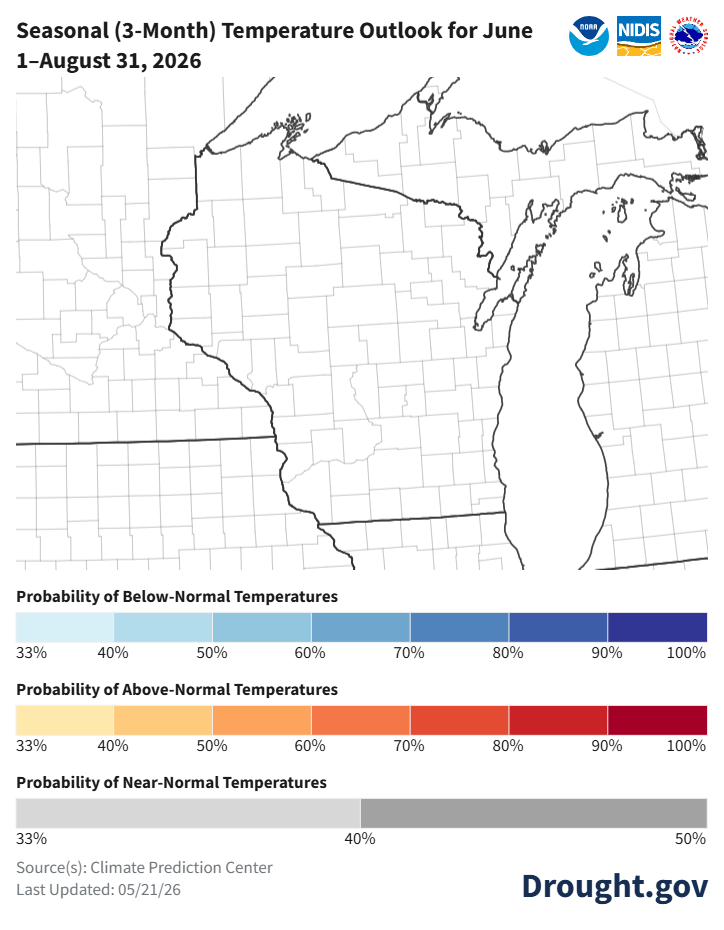
Image Description ↓
A NOAA/NIDIS Climate Prediction Center map showing the 3-month seasonal temperature outlook for the upper Midwest (Wisconsin and surrounding states) for June 1 through August 31, 2026. The map region appears unshaded (white/blank), indicating equal chances or near-normal temperature probabilities — no strong tilt toward above- or below-normal temperatures is indicated for this area. Three color-scale legends appear below the map: below-normal temperatures (light to dark blue, 33%–100%), above-normal temperatures (light peach to dark red, 33%–100%), and near-normal temperatures (light to dark gray, 33%–50%). Source: Climate Prediction Center. Last updated 05/21/26.
- June-August: Temperatures and precipitation are uncertain currently with equal chances for above, near, or below normal conditions. The exception is northwest Wisconsin, which shows a slight lean (33-40% chance) towards below normal precipitation.
- Statewide normals (1991-2020) for June-August are 67.2°F and 12.63”.
User Survey
Are you a regular user of the Ag Weather Outlook for Wisconsin (AgWOW)? Or maybe you are viewing these slides for the first time this week? Either way, we want to hear your feedback on this resource! Please take a few minutes and fill out this survey. Your feedback will help us better serve your ag-weather data needs through AgWOW.
If you have any trouble accessing or filling out the survey, please email Josh Bendorf at jbendorf@wisc.edu. Thank you!