
Weather and climate conditions this week in Wisconsin
Here are this week’s take-home points about the weather. As a reminder, AgWOW reports will be published weekly throughout the growing season. Scroll down for the full report.
Additionally, we’re collecting user feedback. Regardless of whether it’s your first time here or if you are a regular user, we’d love to hear from you!
Key Points
One Month Conditions
- Temperatures remained cooler-than-normal last week, with many locations reporting average temperatures of 4-8°F below normal.
- Most of Wisconsin received no precipitation last week. Totals were highest in the northwest, but those totals were below normal for this time of year (0.25” or less).
Impact
- Soil moisture levels at the 4” depth across UW research farm stations (Wisconet) decreased from last week due to little to no rainfall.
- Satellite-based soil moisture models indicate widespread drier-than-normal conditions the 0-100cm soil profile, a decrease from near-normal conditions last week. The latest USDA NASS report indicates that most of the topsoil in the state has adequate moisture.
- Corn and soybean planting made large strides from last week’s report, thanks to over 6 days that were suitable for fieldwork.
- Wisconsin remains drought-free with no changes in drought coverage or severity in the state compared to last week.
Outlook
- The next few days look active for rainfall with multiple chances for precipitation between Friday (5/15) and Tuesday (5/20).
- Probabilities of overnight lows at or below 32°F are low in far northern counties early next week.
- Late May temperatures are leaning towards near normal statewide, with a weaker lean in the northeast. Precipitation is leaning towards near normal statewide.
- Outlooks for late spring into summer (May-July) indicate uncertainty about temperatures and precipitation, showing equal chances for above-, near-, or below-normal conditions.
Agronomic, Fruit and Vegetable Considerations
Field Conditions
- Avoid trafficking fields in wet conditions to prevent compaction and rutting.
- Keep livestock out of critical and sensitive areas with soft, muddy ground, see this article on the value of keeping cattle clean.
- 2-4″ soil temperatures are warming with increased temperatures, especially in the southern half of the state. Soil temperatures should be consistently at 50 degrees F to reduce the risk of imbibitional chilling and soil-borne pathogens. Planting is underway in Southern WI.
- With continuing potential for frost/freeze conditions, mostly in the northern portion of WI, monitor planted corn and soybean closely. Corn’s growing point remains underground through the V5 stage; however, exposed leaf tissue can be damaged, slowing early development and reducing uniformity. Soybean plants at the cotyledon stage are more resilient to cold temperatures. Conduct stand counts to determine population. See the corn and soybean replant guides.
Forage Management
- Cool temperatures over the past week slowed alfalfa growth. Growth is expected to rebound over the next week with an increase in temperatures. Consider using a PEAQ (Predictive Equations for Alfalfa Quality) stick to estimate relative feed value as you decide when to make the first cut.
- As scissor clips begin throughout the state, find UW and UMN quality data using the Alfalfa Harvest Alert dashboard.
Pest Management
- Start scouting fields on foot to note which early weed species are emerging.
- Be observant of black cutworm and true armyworm moths migrating through the state. Check the DATCP Pest Trap Network Maps.
- Primary seedling corn damage for black cutworm is in the second half of May. Scout emerging corn for signs of cutworm feeding.
- Ensure temperatures are conducive to herbicide applications. Pre-emergent herbicides require moisture for activation.
- Monitor insect degree days. Start scouting for alfalfa weevil at 300 DD. Weevil larvae have the greatest impact (quality and yield) on first and second alfalfa cuts. Be sure to walk fields looking for evidence of this pest.
- SlugNet is trapping again in 2026! Review weekly trap catches across the state. Observe fields (especially fields with reduced tillage and cover crops) for any signs of slug damage.
Manure Applications
- Reminder of Wisconsin’s NR 151 Runoff Rules with the timing of manure spreading and current runoff levels. Check DATCP Runoff Risk Advisory Forecast.
Small Grains
- Assess winter grain stands. Scout for early signs of disease.
- Avoid fertilizer applications in wet and cool conditions. Nitrogen loss is greater in wet conditions. Review small grain fertility. Feekes 5 is the stage where fertilizer and herbicide applications should take place. Review growth stages here.
Fruit Considerations
- Grape growers can begin fertilization prior to bloom, and should review last year’s petiole analysis to determine nutrient needs. Check out this recent UW Fruit News article on Fertilizing Wine Grapes.
- Keep track of degree-days (base 50℉) from petal fall to determine the end of plum curculio movement into the orchard. Plum curculio will continue movement into the orchard until ~308 degree-days base 50℉ have accumulated from petal fall.
- Codling moth have been captured in Southern WI. Make sure to check traps after warm, calm evenings to establish a biofix date. Biofix occurs when ~5 or more moths are captured in one evening, or captured across consecutive nights. First generation larvae will emerge after ~250 degree-days base 50℉ from the biofix date.
- Apple growers can reference the NEWA weather station network to monitor disease infection events. Make sure to keep track of green tip and petal fall dates. Check out your nearest weather station: NEWA Weather Station Network (Cornell).
- Growers may consider visually scouting for mites and aphids. Use a hand lens to ID mites and check the undersides of leaves for aphids. Watch for curled, wrinkled, bronzed or stunted leaves.
- Growers may consider visually scouting for lepidopteran larvae feeding on young leaf material and/or hanging pheromone monitoring traps.
- Growers with historic populations of plum curculio or tarnished plant bug may consider monitoring orchard perimeters and/or hanging monitoring traps.
- Wisconsin fruit growers can reference the Midwest Fruit Pest Management Guide for a list of registered products and recommended best practices. View the MFPMG Online or order a hard copy here: MFPMG Hard Copy.
Vegetable Considerations
- Soil temps remain in the 50s for the majority of southern and central WI, while soil temps in many areas in northern WI remain in the mid to upper 40s. For pumpkin and squash wait until soil temps are at least 60°F and danger of frost has passed. For melons, soil temperatures are ideally 70°F, but if you want to plant early, check to make sure soil temperatures do not get below 60°F during the early morning and that air temperature is not forecasted to drop below 50°F. For crops like tomatoes and peppers in the field, wait until soil temps are at least 60°F but ideally 65-70°F.
- Damping off of seedlings is caused by Rhizoctonia, Fusarium and Pythium. These pathogens are soil borne and thrive in cool and wet conditions. Seedlings are susceptible for a short time following emergence, but susceptibility declines quickly as the plants grow. Infection leads to lower stem girdling and collapse. Some treatment options include planting as shallowly as agronomically allowable to encourage quick germination, not overwatering, and using fungicides treated seed.
- The risk of western flower thrips is now high or very high in southern WI and risk will be increasing in central WI over the next week. Early detection is key as control can be very difficult. Iowa State has a few useful videos on scouting: tip on finding thrips and tips on spotting thrips damage on cucumber transplants. One option to reduce risk is dipping plants in a horticultural oil or insecticidal soap right before transplanting. Some other control options include row cover, reflective mulch and weed management as weeds such as chickweed and lambsquarters serve as alternative hosts.
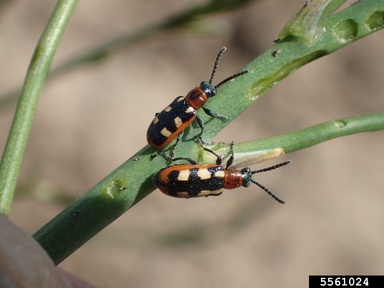
- Risk of crop damage from asparagus beetle larvae is very high for central and NW WI. Spooner, Rice Lake, and Tomahawk are now at medium risk and as temperatures are expected to warm up over the next week risk will continue to increase for northern areas. Risk is now low in southwest and south central WI as peak larva activity has passed. When scouting, sample twenty plants from five different areas to determine if you have reached the threshold for treatment. Row cover can be a good option to exclude the beetles if eggs have not already been laid.
- Imported cabbageworm adults, white butterflies with black markings on wingtips, are now active in southern and central WI. Start scouting for eggs which are laid as a single egg that are yellow to orange in color. Young plants can be particularly susceptible to damage so either use insect netting to exclude adults if they are not yet active in your area or time insecticide spray to larval hatch.
- Start scouting for diamondback moths which overwinter in WI as adults. Adults fly at night so can be hard to detect. When scouting, look for eggs on the underside of leaves. Eggs are flat and cream colored and can either be laid singly or in a cluster. They will hatch within about a week of being laid. Floating row covers work well to protect small plantings and a parasitic wasp, Diadegma insulare, can do a good job of keeping this pest in check. Young transplants are more susceptible to damage so the threshold for management is when 10% of plants are affected.
- Swede midge is another brassica pest. They feed on growing points leading to distortion and scarring on leaves. Depending on when infestation occurs, they can also lead to uneven or even complete loss of a head or crown. While there are pheromone traps for swede midge, they can be difficult to use as it is hard to distinguish from other flies. They can be difficult to detect because larvae hide in growth points but an indicator can be a wet growing tip due to burst cells from larvae feeding. Some control options include insect netting, avoiding the use of brassica cover crops, and removing brassica weeds that can serve as alternative hosts.
- Onion maggot risk is now very high in SE counties along Lake Michigan and in central WI around Eau Claire and Stevens Point as enough growing degree days have accumulated for peak adult flight activity. Use the Vegetable Disease and Insect Forecasting Network to see the risk in your area. Preventative soil insecticide applications are recommended for the first generation larvae if damage to the last year’s crop was over 5-10%. For small plantings of onions, row cover can be effective if adults are not yet active in your area.
- Risk from the first generation of adult seed corn maggots is now high or very high in northern WI. Risk is decreasing for central WI and low or very low for southern WI with the exception of cities close to Lake Michigan. One way to reduce risk is increasing the rate at which plants germinate and grow. A few ways to do that is waiting to plant until soil temps are at least 50°F before planting susceptible crops and planting seeds as shallowly as agronomically possible. More management options can be found here. Soil temps above 70°F put an end to egg laying for seed corn maggot.
- Cabbage maggot risk is also high or very high in southern WI extending up to Eau Claire, Stevens Point and Oshkosh. Cabbage maggots overwinter as larvae in the top several inches of soil. When the adults emerge, they are attracted to freshly tilled fields with decaying organic matter. They thrive in wet and cool conditions. When possible, till in cover crops 2 to 3 weeks before planting to reduce attractiveness and similar to seed corn maggot management, wait to plant until soils temps are above 50°F for faster germination.
- Black cutworm moths are starting to migrate into WI with an influx of moths that arrived May7-13 reported by DATCP. Check DATCP trap catch maps for counts in your area. Black cutworm larvae feed on newly emerged crops and prefer direct seeded crops over transplants. Many crops are susceptible to damage including beets, carrots, cucumber, leafy greens, sweet corn and squash. Management options include weed management as females prefer to lay eggs in weedy areas and avoiding the use of green manure in areas where cutworms tend to be a problem. For chemical control to be effective, early detection is key. If chemical treatment is necessary, begin treating at the first signs of cutting and repeat every 7 days until 1000 degree days are reached.
- Start scouting for Colorado potato beetle as potato plants emerge. Focus on border rows and scan soil surrounding plants to help with early detection as adults will drop from plants as a defense tactic. Also, examine the underside of leaves to look for bright yellow to orange eggs that are laid in clusters.
- The deadline for disposing of potato cull piles is May 20th. This includes waste piles of harvested potatoes, seed cutting slivers, and storage remnants. Find more details in the Vegetable Crop Update newsletter.
Dive deeper into each report section by clicking a topic below.
Precipitation Trends
7 Day Precipitation
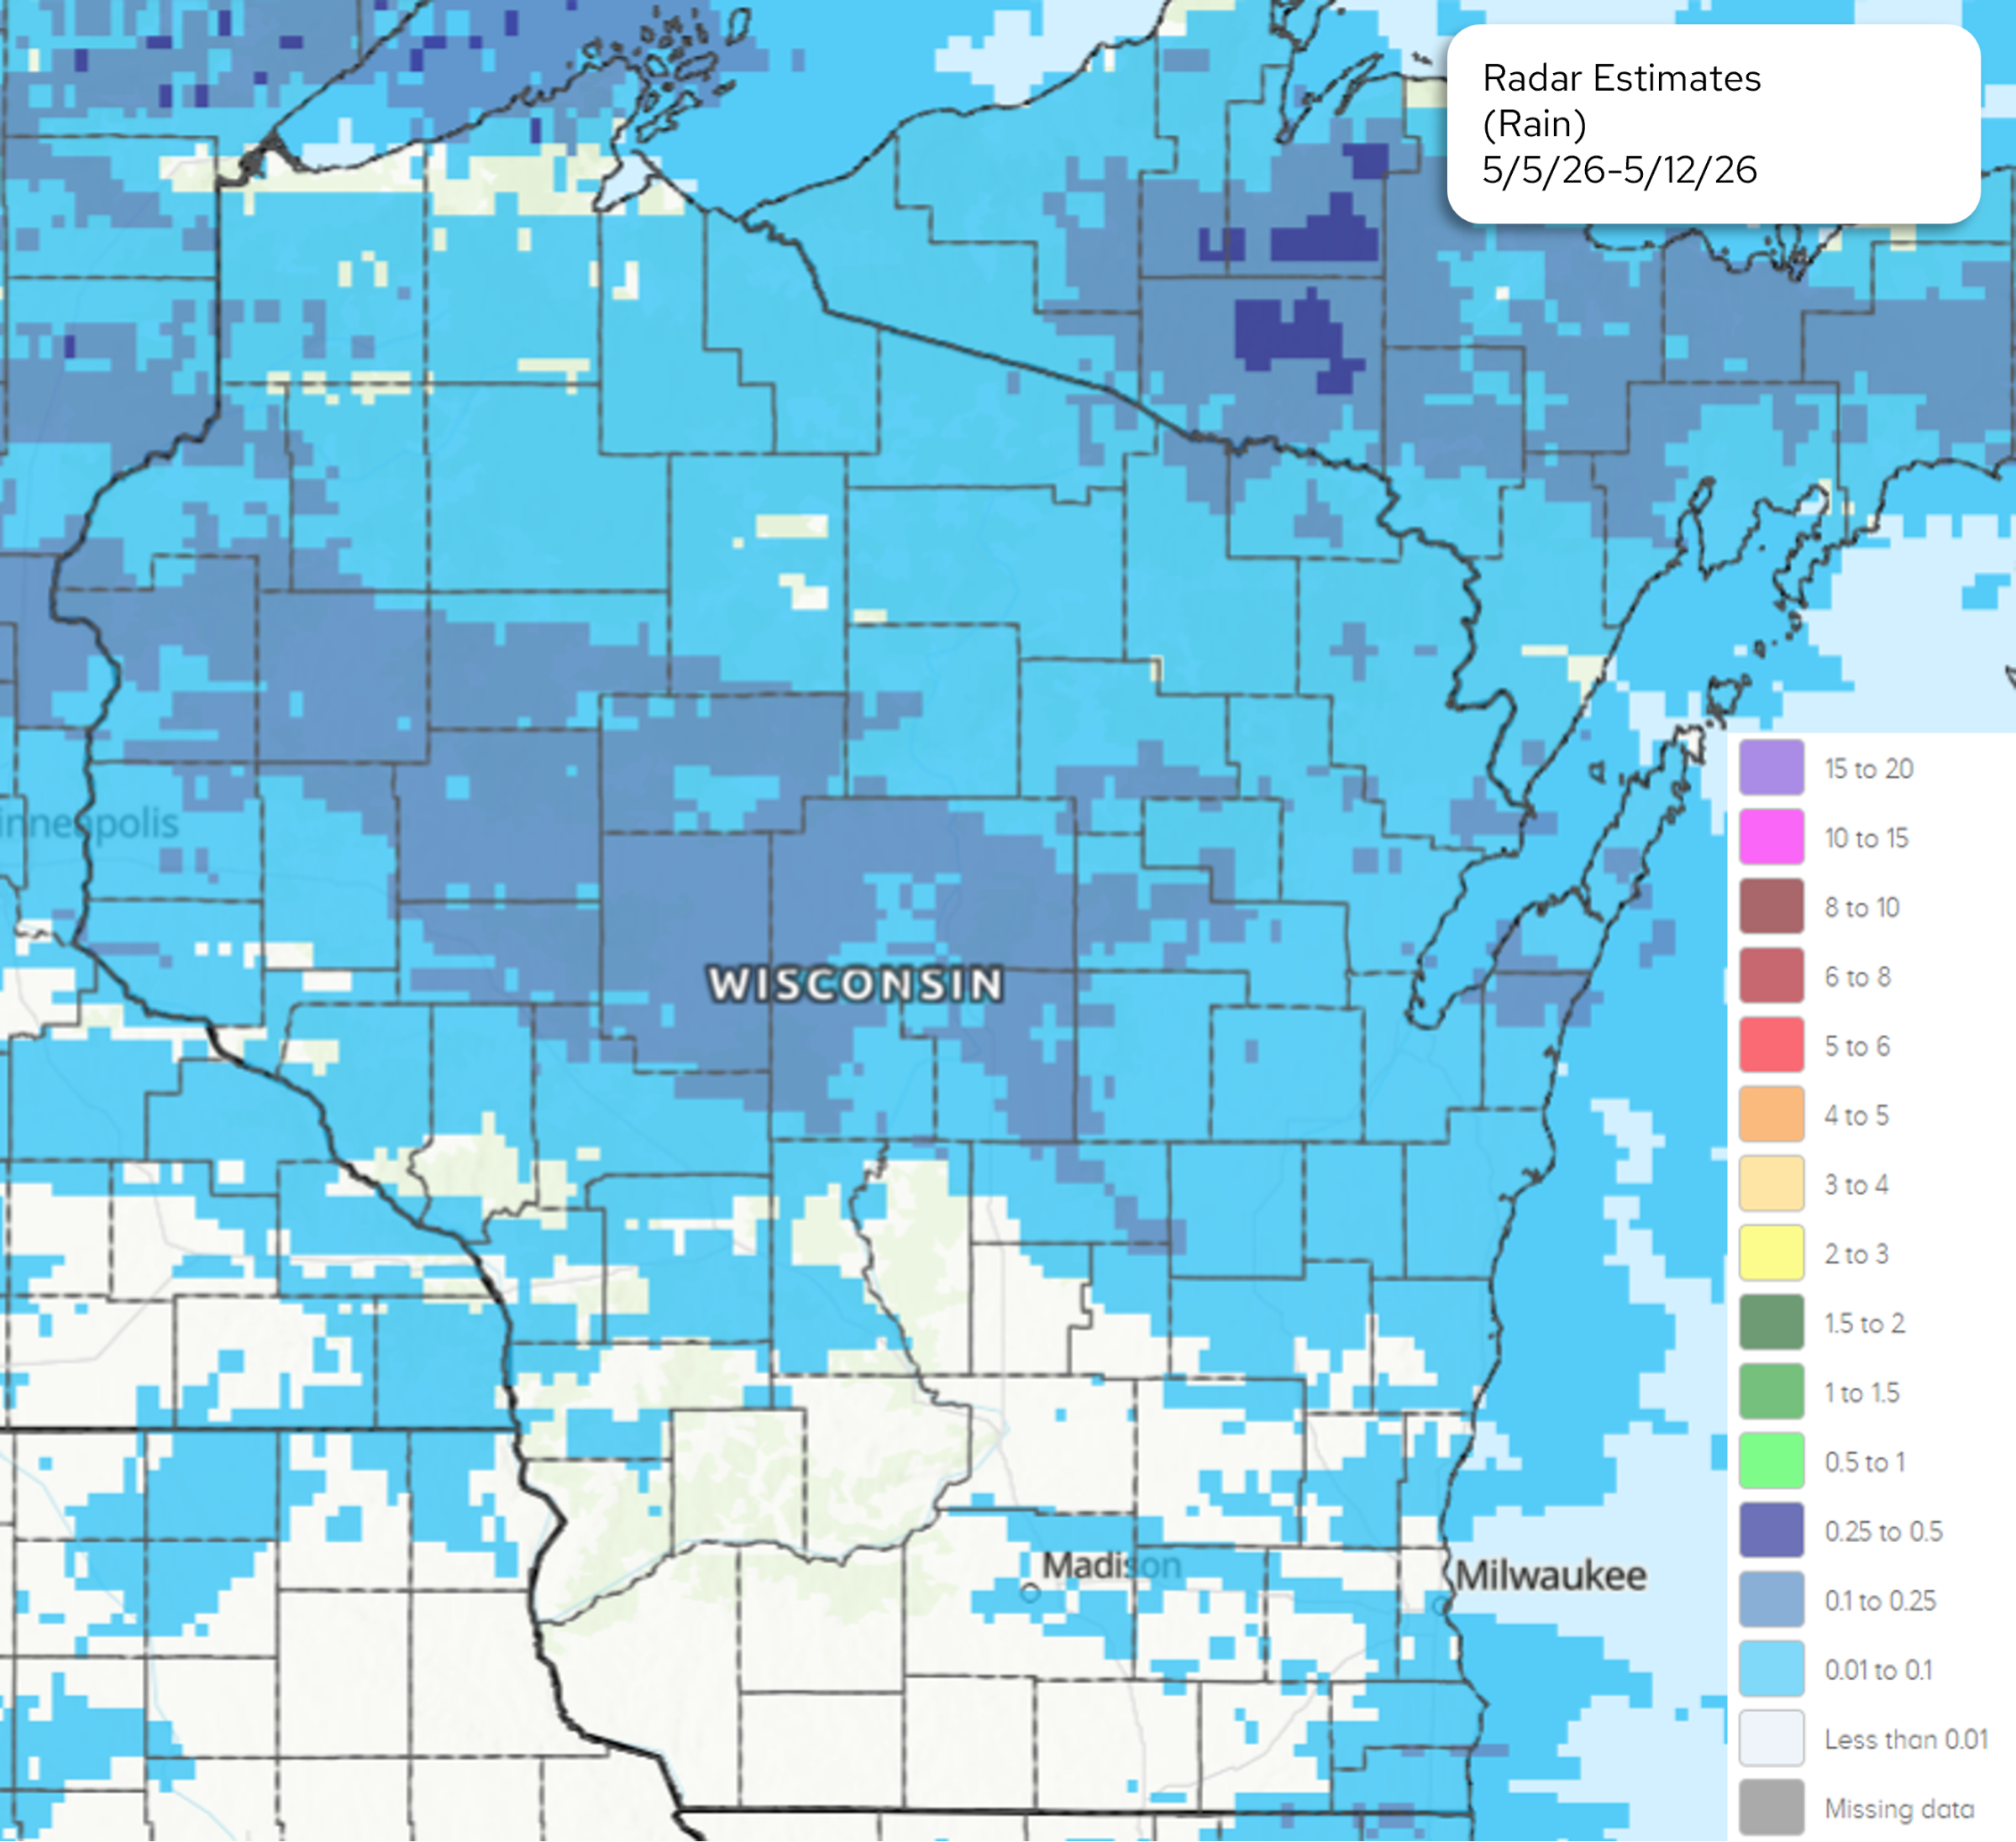
Image Description ↓
NOAA 7-day radar rainfall estimates map covering Wisconsin and surrounding states from May 5–12, 2026. Most of Wisconsin shows 0.1 to 0.25 inches (medium blue) to 0.25 to 0.5 inches (dark blue/indigo) of rainfall. Northern Wisconsin and the Lake Superior region received heavier precipitation, with areas of 0.5 to 1 inch and isolated pockets of 1 to 1.5 inches shown in darker purple-blue tones. The Madison and Milwaukee areas in southern Wisconsin show lighter totals, primarily 0.01 to 0.1 inches (light blue) or less than 0.01 inches (white/cream). Minnesota to the west shows a mix of light and moderate rainfall. The color legend on the right ranges from less than 0.01 inches (white) up to 15–20 inches (purple), with all values in inches.
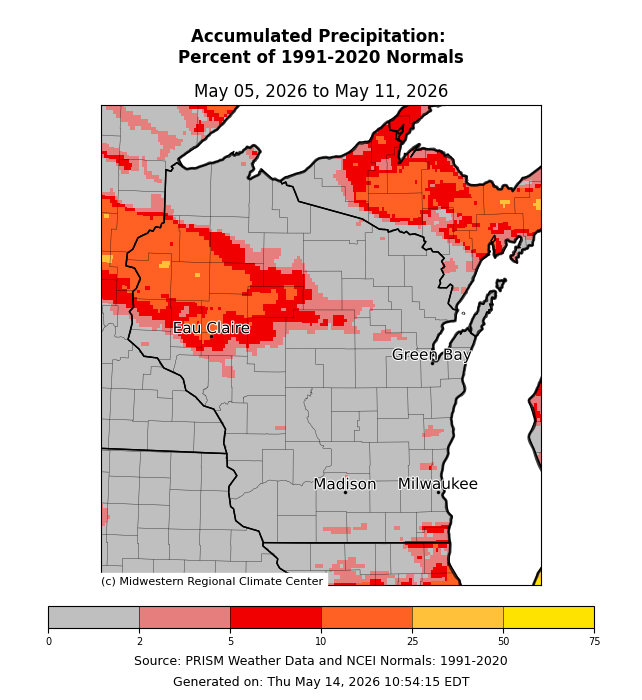
Image Description ↓
Map of Wisconsin and surrounding region showing accumulated precipitation as percent of 1991–2020 normals, May 5–11, 2026. Much of central and western Wisconsin — particularly around Eau Claire — received 25–75%+ of normal precipitation (shown in deep red/orange). Madison and Milwaukee areas are near or below normal (gray). The Upper Peninsula of Michigan and far northern Wisconsin show pockets of above-normal precipitation. Color scale ranges from 0 (gray) to 75+ percent (yellow). Source: PRISM Weather Data and NCEI Normals. Generated May 14, 2026.
- Most of the state received less than 0.1” last week.
- The southern counties were the driest, with some receiving no precipitation.
- The northwest and north-central counties was where precipitation totals were highest, with some locations receiving up to 0.25”. However, these totals are well below normal for this time of year (25% or less for most).
30 Day Precipitation Total and Departure from Normals
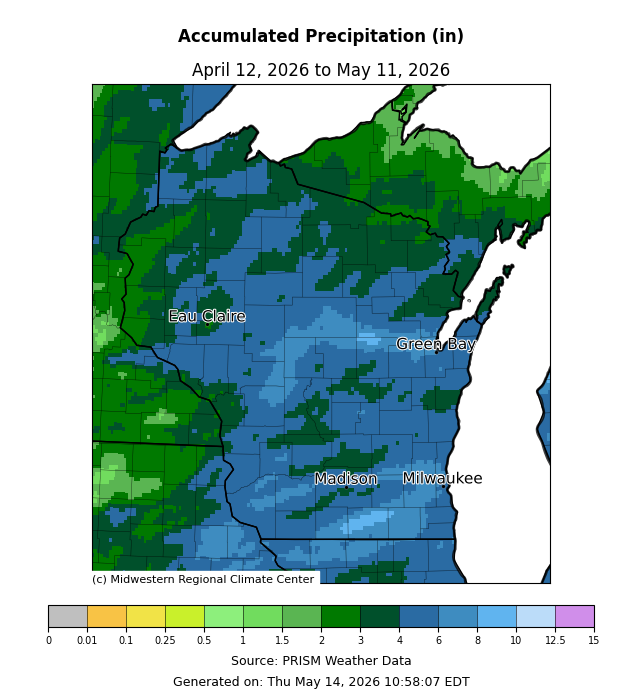
Image Description ↓
Choropleth map of accumulated precipitation across Wisconsin and neighboring states for the 30-day period April 12 to May 11, 2026, sourced from PRISM Weather Data via the Midwestern Regional Climate Center. The majority of central and southern Wisconsin — including the Madison and Milwaukee areas — shows 4–6 inches of precipitation (medium blue). Northern Wisconsin and the Upper Peninsula region show 6–8 inches (darker blue-green) with pockets of 8–10 inches near Lake Superior. The Eau Claire area and western Wisconsin show lighter green tones indicating 2–4 inches. A few isolated areas in the far northwest show orange or light green, suggesting 0.5–1.5 inches. The color scale runs from 0 (gray) to 15 inches (purple). Map generated May 14, 2026 at 10:58 EDT.
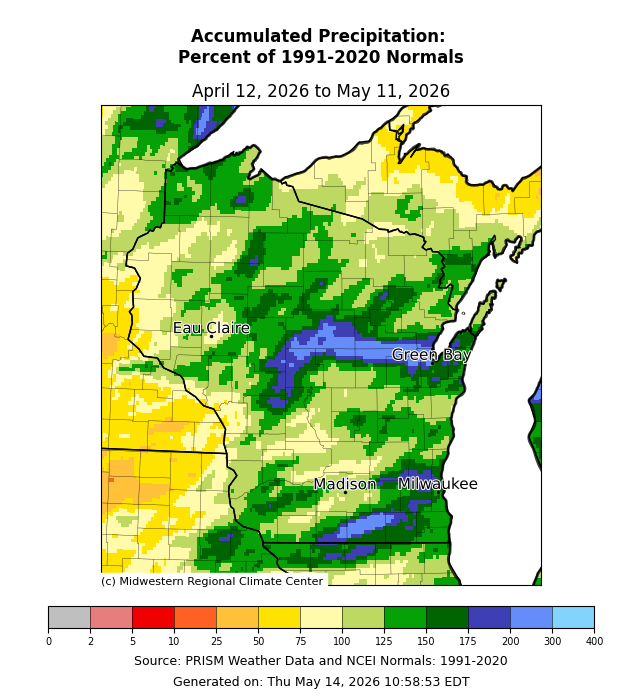
Image Description ↓
Map of Wisconsin and Minnesota showing accumulated precipitation as a percent of 1991–2020 normals, April 12–May 11, 2026. Most of Wisconsin received 100–175% of normal precipitation (shown in green), with areas near central Wisconsin, the Lake Michigan shoreline south of Green Bay, and patches near Milwaukee reaching 175–300%+ (blue). Southern Minnesota and western Wisconsin show below-normal precipitation (yellow to orange, 25–75%). The map uses PRISM weather data. Source: Midwestern Regional Climate Center, generated May 14, 2026.
- Totals of 3-6” were common across most of Wisconsin, excluding portions of the far north and northwest. These 30-day totals were at or above normal for most, with localized areas of 175-300% of normal.
- Along the Upper Peninsula border and St. Croix River, totals were slightly below normal (2-3”; 75-100% of normal).
90 Day Precipitation Total and Percent of Normals
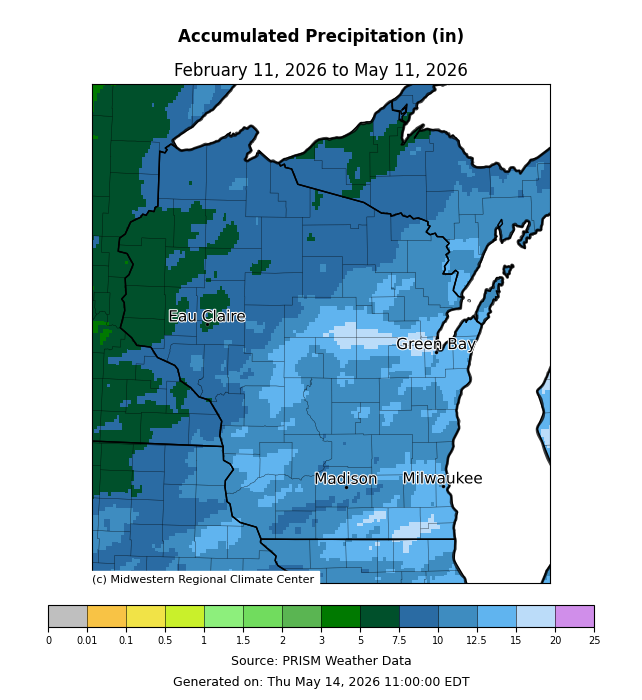
Image Description ↓
Map of accumulated precipitation (inches) across Wisconsin and neighboring states, February 11–May 11, 2026, based on PRISM weather data. Most of Wisconsin received 7.5–12.5 inches (medium to darker blue). A notably drier zone of 5–7.5 inches (light blue) stretches across central Wisconsin between Eau Claire and Green Bay. Northwestern Wisconsin and adjacent Minnesota show the highest totals, 12.5–20+ inches, appearing in dark green. Southern Wisconsin near Madison and Milwaukee falls in the 7.5–10 inch range. Generated May 14, 2026. Source: Midwestern Regional Climate Center.
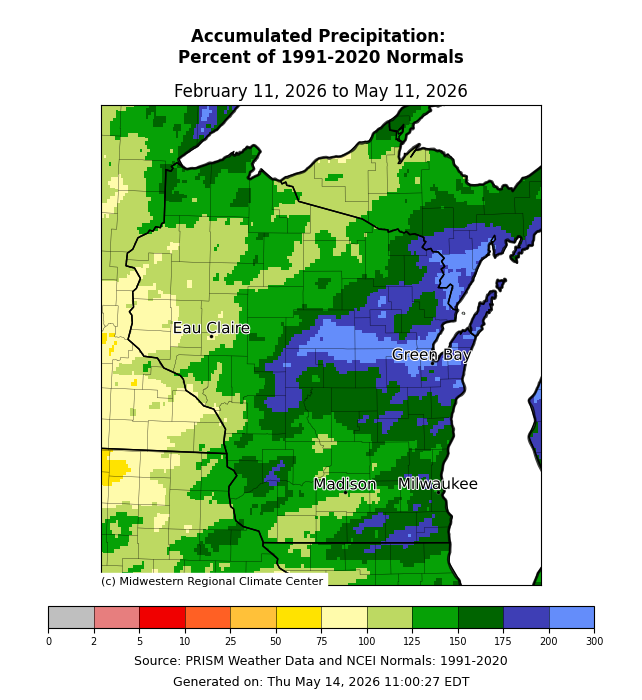
Image Description ↓
PRISM-sourced map from the Midwestern Regional Climate Center showing accumulated precipitation as a percent of 1991–2020 normals for February 11 to May 11, 2026. The color scale ranges from 0% (gray) through red and yellow (below normal), green (near normal, 75–125%), to blue and dark blue (above normal, up to 300%).
Western Wisconsin and Minnesota show below-normal precipitation (yellow/light green, roughly 50–75%). Central Wisconsin near Madison appears near-normal to slightly above (green, ~100–125%). Eastern Wisconsin — including the Green Bay area and the Lake Michigan shoreline — shows strongly above-normal precipitation (blue to dark blue, 150–200%+). Northern Wisconsin and the Upper Peninsula of Michigan are predominantly green (near-normal), with some blue patches along the northern shore. The map was generated May 14, 2026.
- The highest precipitation totals were in east central and far southeastern counties (15” or more). A large portion of the state received over 10”.
- Precipitation totals were lowest in the northwest and far north (5-7.5”).
- The entire state received precipitation totals that were at or above normal. In the southeastern, central, and northeastern counties, 90-day totals were commonly at or above 150% of normal.
2026 Precipitation
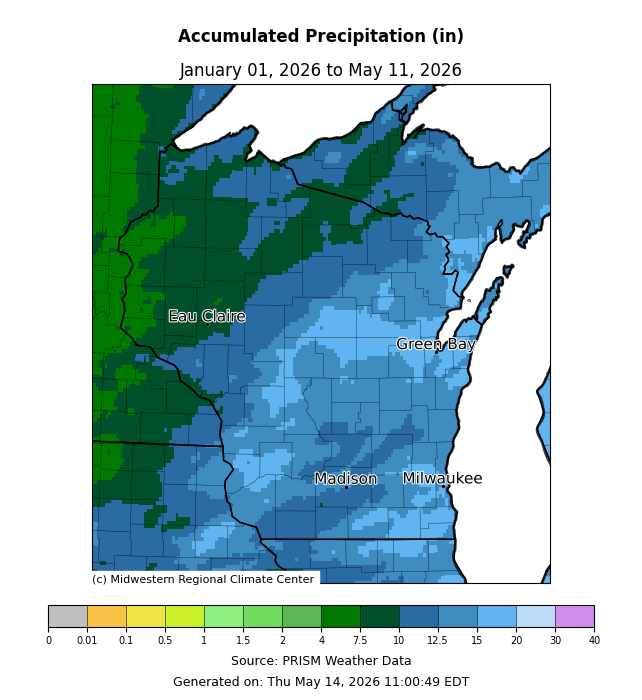
Image Description ↓
A color-coded map from the Midwestern Regional Climate Center (PRISM data) showing accumulated precipitation in inches across Wisconsin and parts of Minnesota and Michigan’s Upper Peninsula, from January 1 to May 11, 2026. Western Minnesota and the Minnesota–Wisconsin border region show the highest precipitation (dark green, roughly 10–15+ inches). Central and eastern Wisconsin, including Madison, Milwaukee, and Green Bay, show moderate accumulation (light blue, roughly 4–10 inches). The Upper Peninsula of Michigan and far northeastern Wisconsin appear in lighter blue tones, indicating lower totals (around 4–7.5 inches). The color scale runs from 0 (gray) to 40 inches (purple). Source: PRISM Weather Data, generated May 14, 2026.
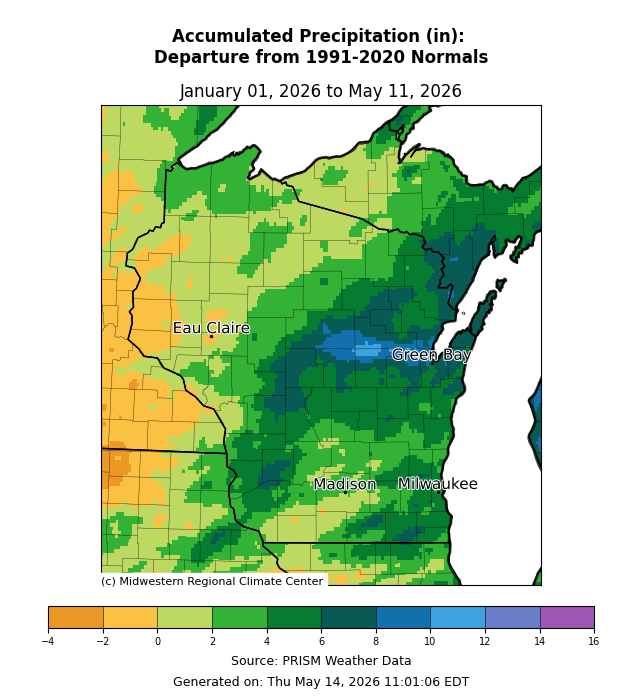
Image Description ↓
Map of accumulated precipitation departure from 1991–2020 normals, January 1–May 11, 2026, across Wisconsin and neighboring states. Most of Wisconsin shows above-normal precipitation (green to dark blue), with the greatest surplus of 10–14+ inches centered near Green Bay and extending toward Milwaukee and Madison. Western Wisconsin and Minnesota show near-normal to slightly below-normal precipitation (yellow/orange). A color scale ranges from −4 inches (orange) to +16 inches (purple). Source: PRISM Weather Data, Midwestern Regional Climate Center.
Soil Moisture and Temperature Trends
Soil Moisture Models
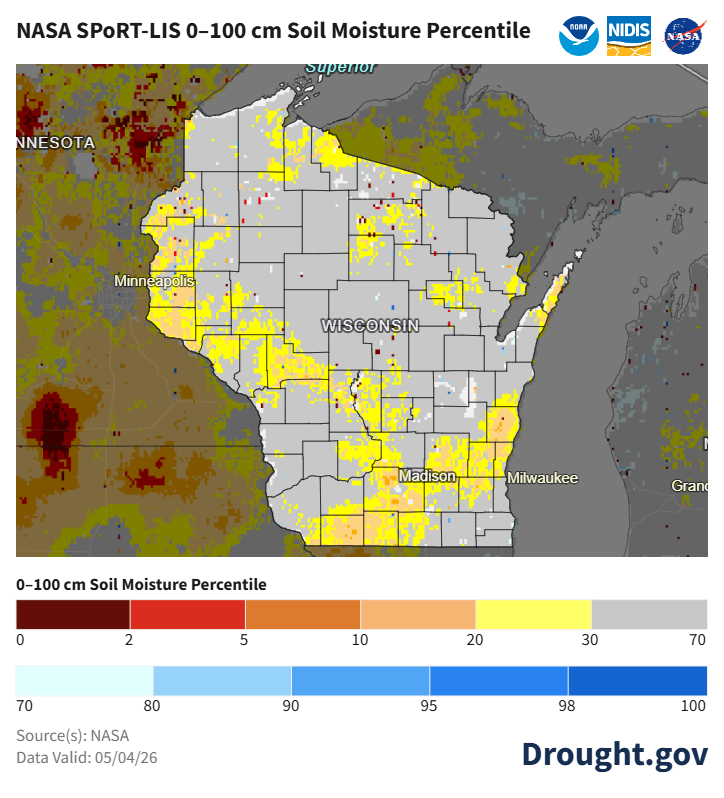
Image Description ↓
NASA SPoRT-LIS 0–100 cm Soil Moisture Percentile map dated May 4, 2026, covering Wisconsin and neighboring states. Wisconsin is predominantly gray (percentile 70+), indicating near-normal to above-normal soil moisture across most of the state. Yellow areas (percentile 20–30) appear along the western border, southern counties near Madison and Milwaukee, and scattered patches in the north, indicating below-normal moisture. A small number of orange pixels (percentile 5–10) are visible in the southwest corner of the state. By contrast, Minnesota to the west shows severe drought conditions, with extensive dark red and brown areas indicating soil moisture at the 0–5th percentile. The color scale ranges from dark red (0) through orange, yellow, and gray (70), then light blue through dark blue (100). Source: NASA/Drought.gov.
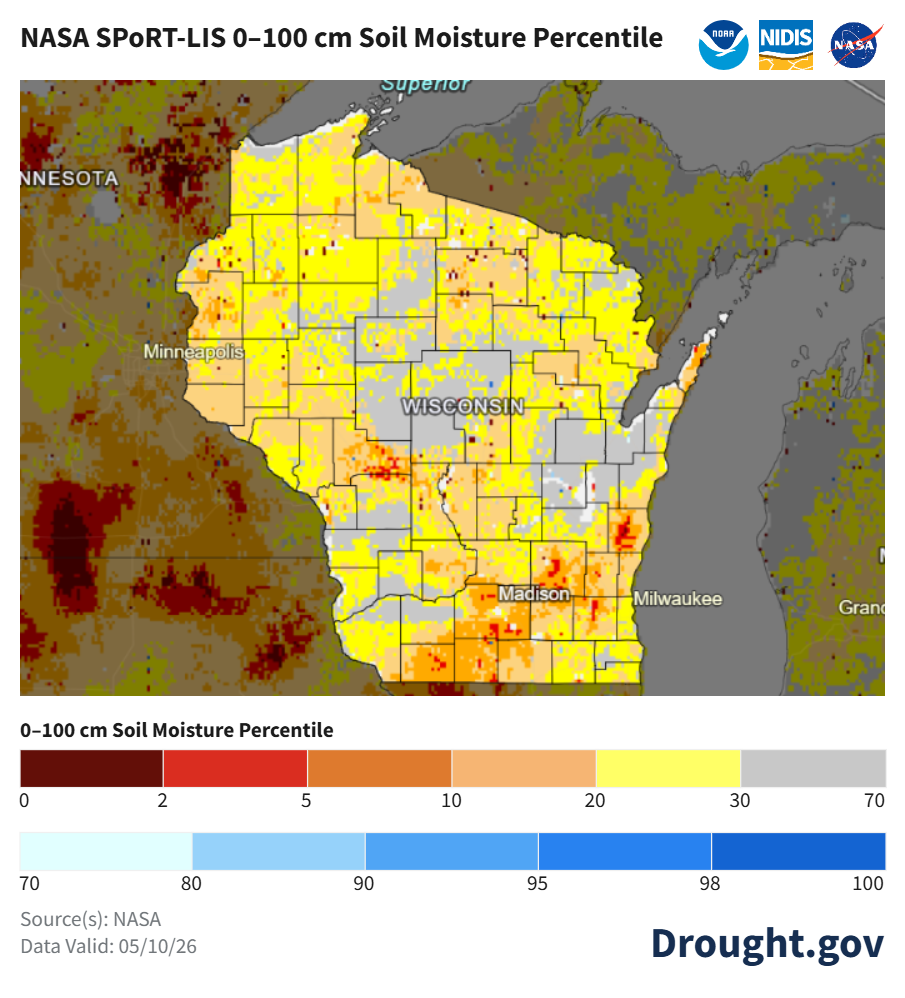
Image Description ↓
NASA SPoRT-LIS 0–100 cm Soil Moisture Percentile map valid May 10, 2026, showing Wisconsin and surrounding region. The color scale ranges from dark red (percentile 0–2, extremely dry) through orange, tan, and yellow (up to percentile 30), then gray (30–70), and blues (70–100, extremely wet). Most of Wisconsin falls in the yellow to orange range (roughly 10th–20th percentile), indicating below-normal soil moisture. Southern Wisconsin near Madison shows scattered orange and dark red patches, indicating areas at the 2nd–10th percentile — severely to exceptionally dry. Central Wisconsin has some gray areas reflecting near-normal moisture. Northwestern Wisconsin trends drier with orange tones. Minnesota to the west shows extensive dark red and brown, indicating extreme to exceptional drought. The Lake Superior shoreline and parts of northeastern Wisconsin appear in gray or light tones near normal. Produced by NOAA, NIDIS, and NASA; sourced from Drought.gov.
- Soil moisture at 4” depth decreased across Wisconet research farm stations compared to last week, following a relatively dry week across the state.
- Satellite-based soil moisture estimates indicate that soils in the state dried out over the past week, following a week with little to no rain.
- Most of the soils in the state are indicated as drier than normal in the top 100 cm.
- Notes on how to interpret the maps:
- Red areas = top 5 driest in 100 years.
- Dark red areas = top 2 driest in 100 years.
- Dark blue areas = top 2 wettest in 100 years.
Wisconet Soil Moisture
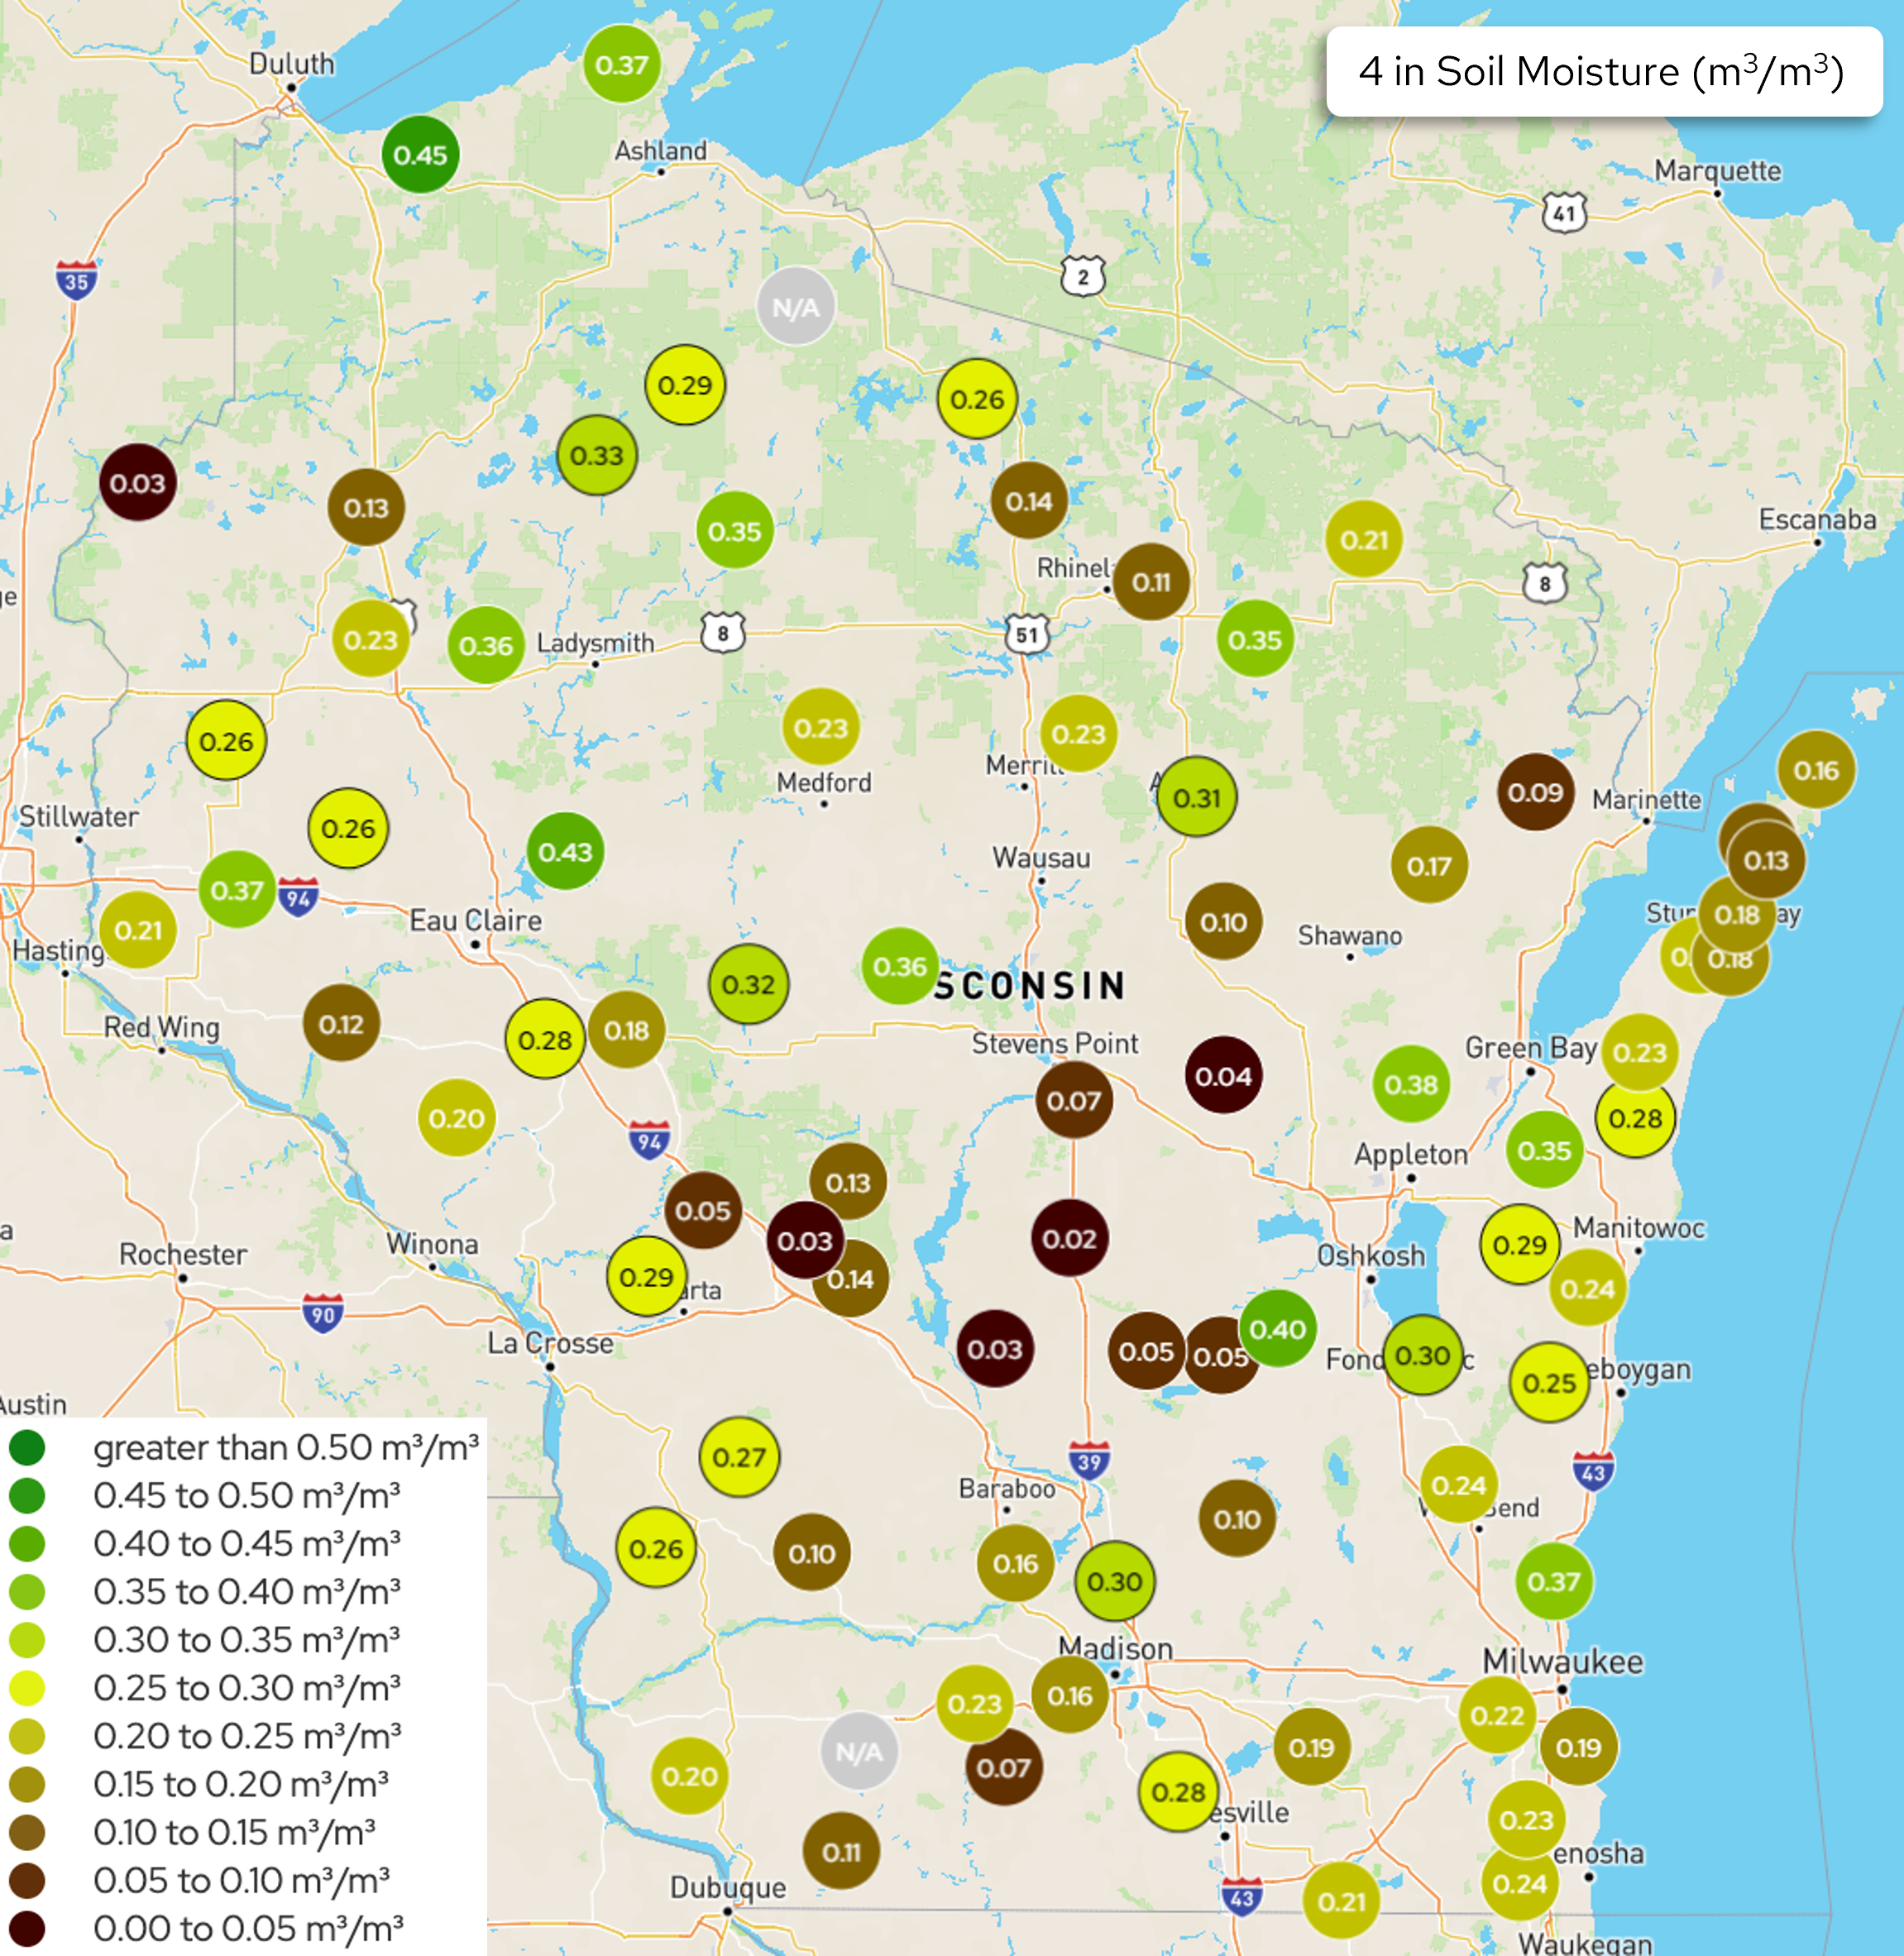
Image Description ↓
A color-coded map showing 4-inch depth soil moisture levels (m³/m³) across Wisconsin and surrounding areas. Circular markers display numeric readings at sensor locations, colored by moisture range:
- Dark red/maroon (0.00–0.10): Dry conditions, clustered in central and south-central Wisconsin, with values as low as 0.02–0.05
- Olive/dark yellow (0.10–0.25): Moderate-dry readings scattered statewide, including values of 0.10–0.20
- Yellow-green (0.25–0.35): Moderate moisture across much of western and eastern Wisconsin, with many readings in the 0.26–0.35 range
- Bright green (0.35–0.45): Wetter conditions in northern Wisconsin and some eastern locations (0.35–0.43)
- Dark green (0.45–0.50+): Highest moisture near Lake Superior (Duluth/Ashland area), with readings of 0.45 and 0.37
Two markers are labeled N/A. The map spans from Dubuque, Iowa in the south to Duluth, Minnesota in the north.
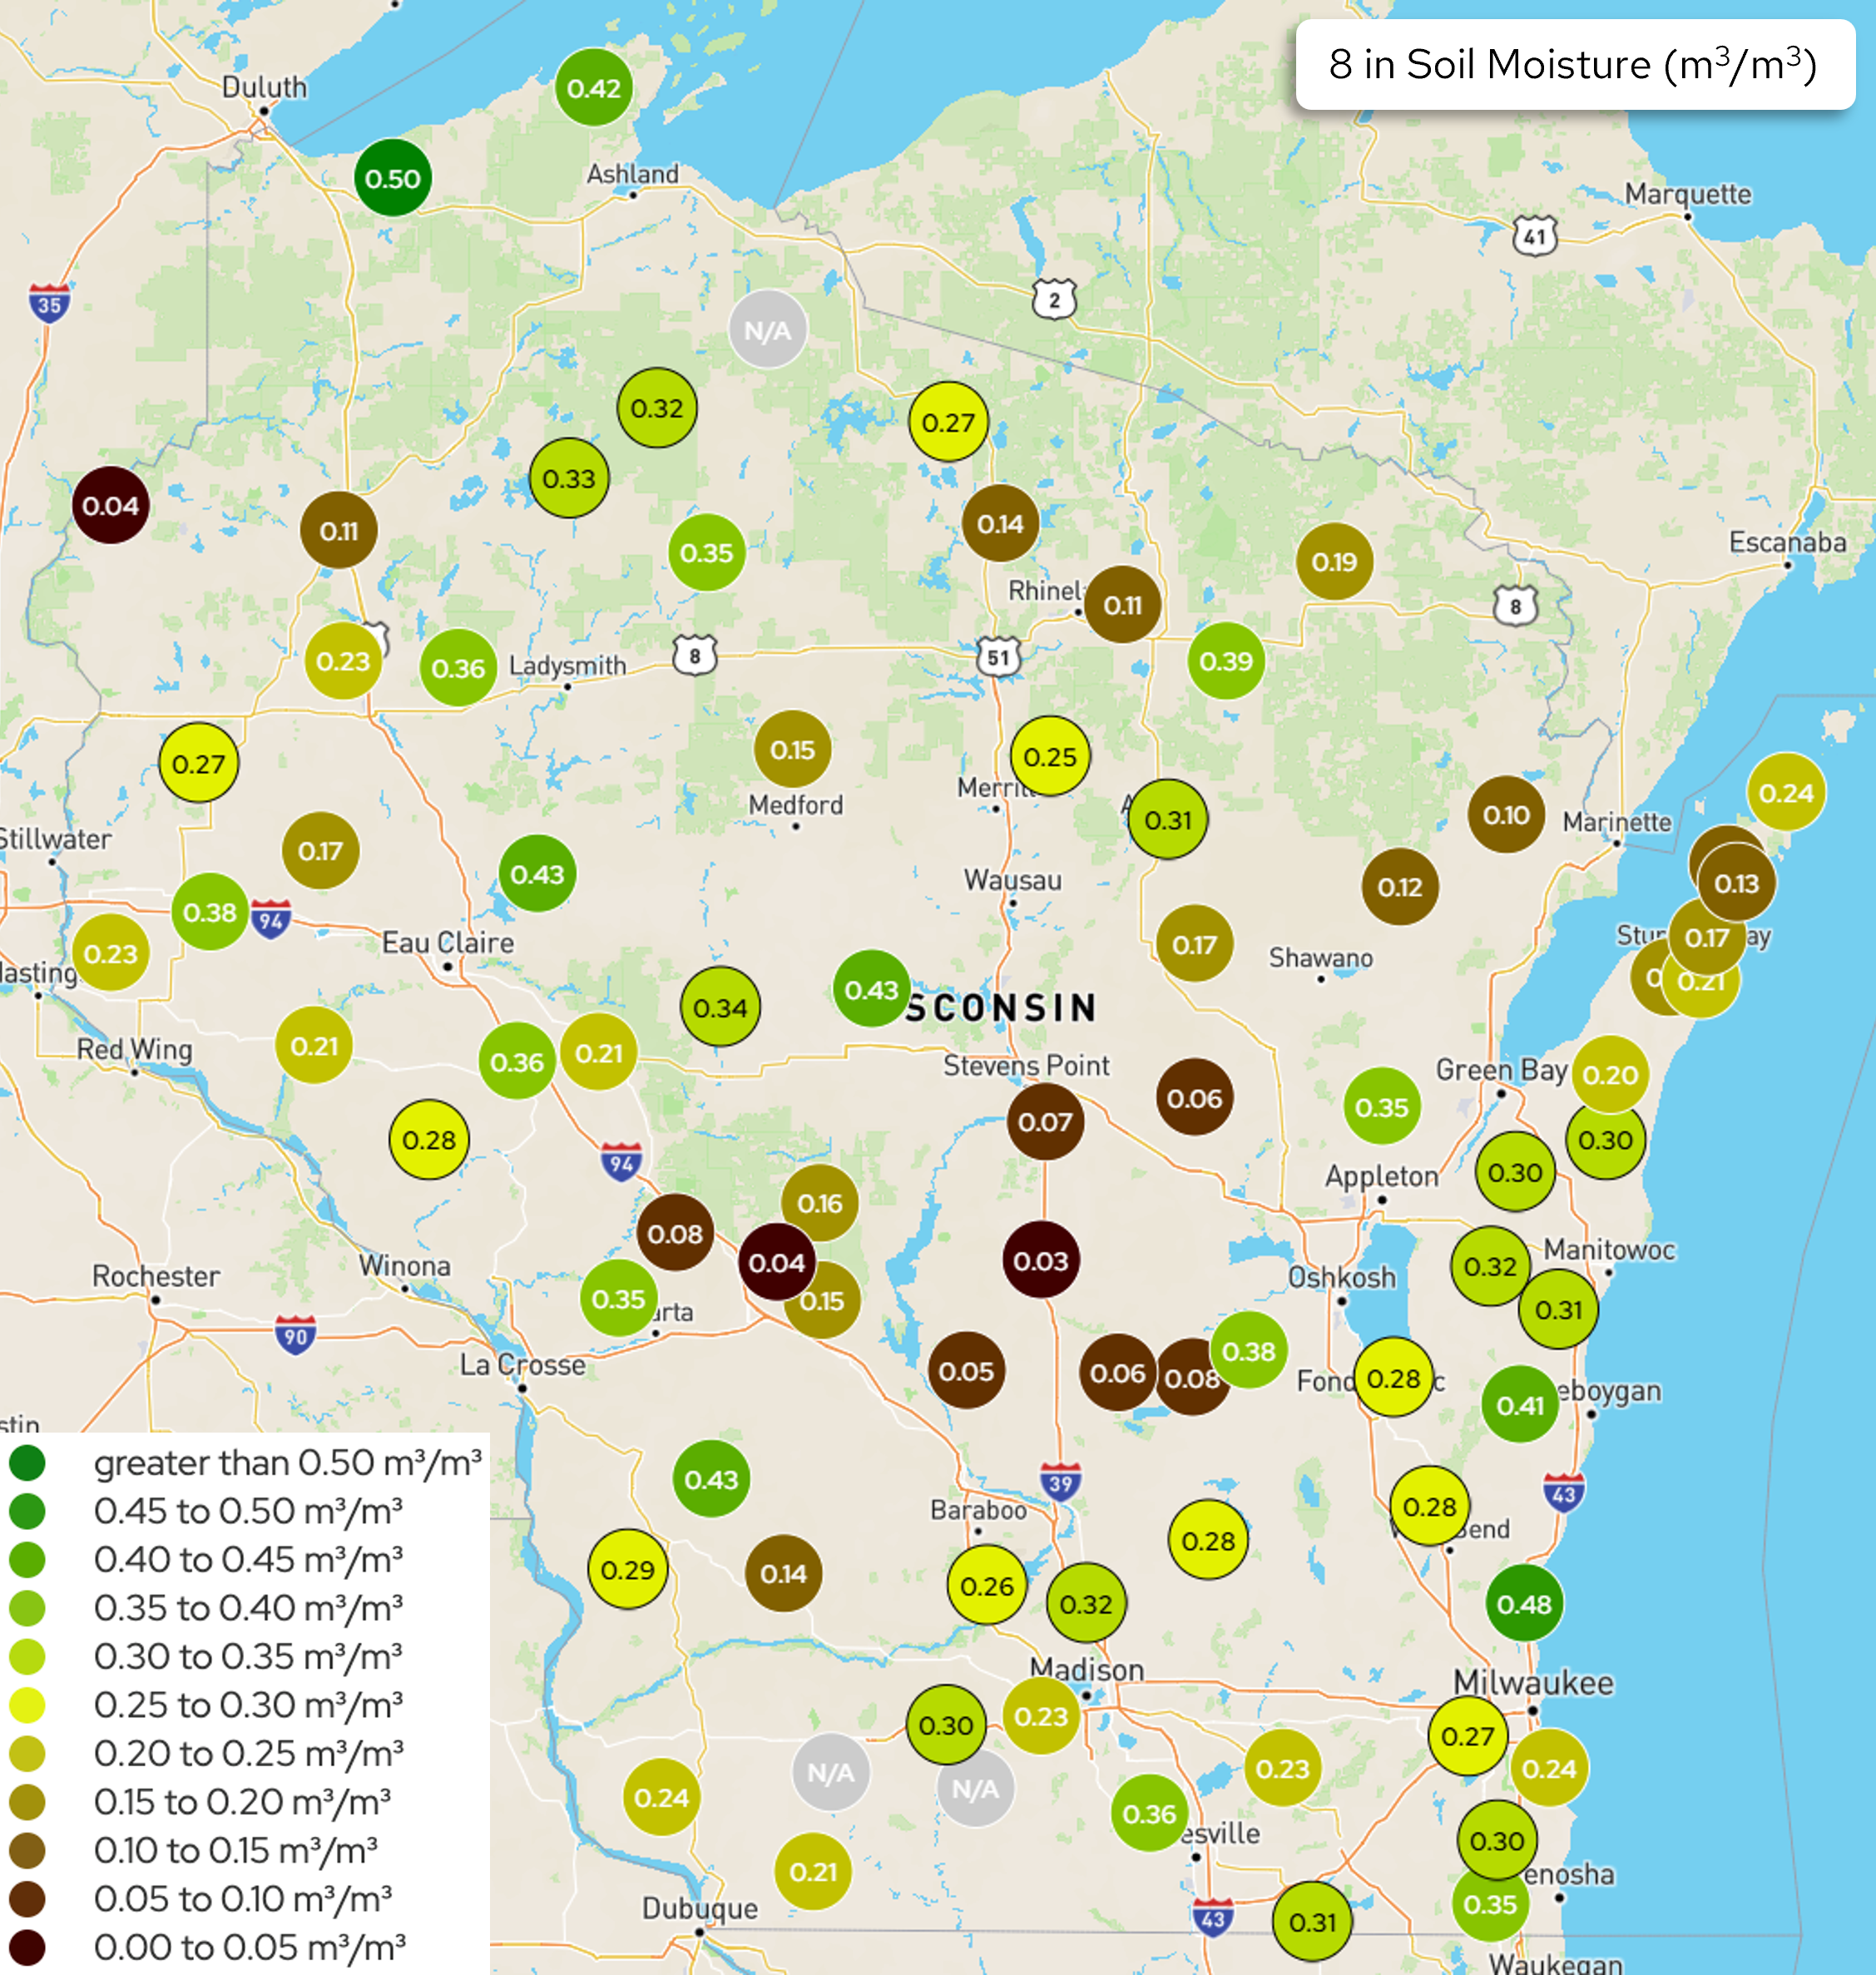
Image Description ↓
A color-coded dot map of Wisconsin displaying soil moisture measurements at 8 inches depth, measured in cubic meters per cubic meter (m³/m³). Dots are colored on an 11-level scale from dark red (0.00–0.05) through browns, yellows, and greens to dark green (greater than 0.50).
Regional patterns: Northern Wisconsin stations show higher moisture, with values of 0.42 and 0.50 near Ashland and 0.32–0.36 in the Ladysmith area. Central Wisconsin is mixed, with moderate readings of 0.25–0.43 near Wausau and Stevens Point alongside low readings of 0.03–0.08 in the south-central region near Baraboo and La Crosse. Eastern Wisconsin near Green Bay, Appleton, and Sheboygan shows moderate values of 0.20–0.41. Southern Wisconsin near Madison shows a range of 0.23–0.36, with isolated low readings of 0.03–0.08 in the south-central area. Two stations are marked N/A (north-central and south-central Wisconsin). The lowest recorded value is 0.03 (south-central); the highest is 0.50 (northwest near Ashland).
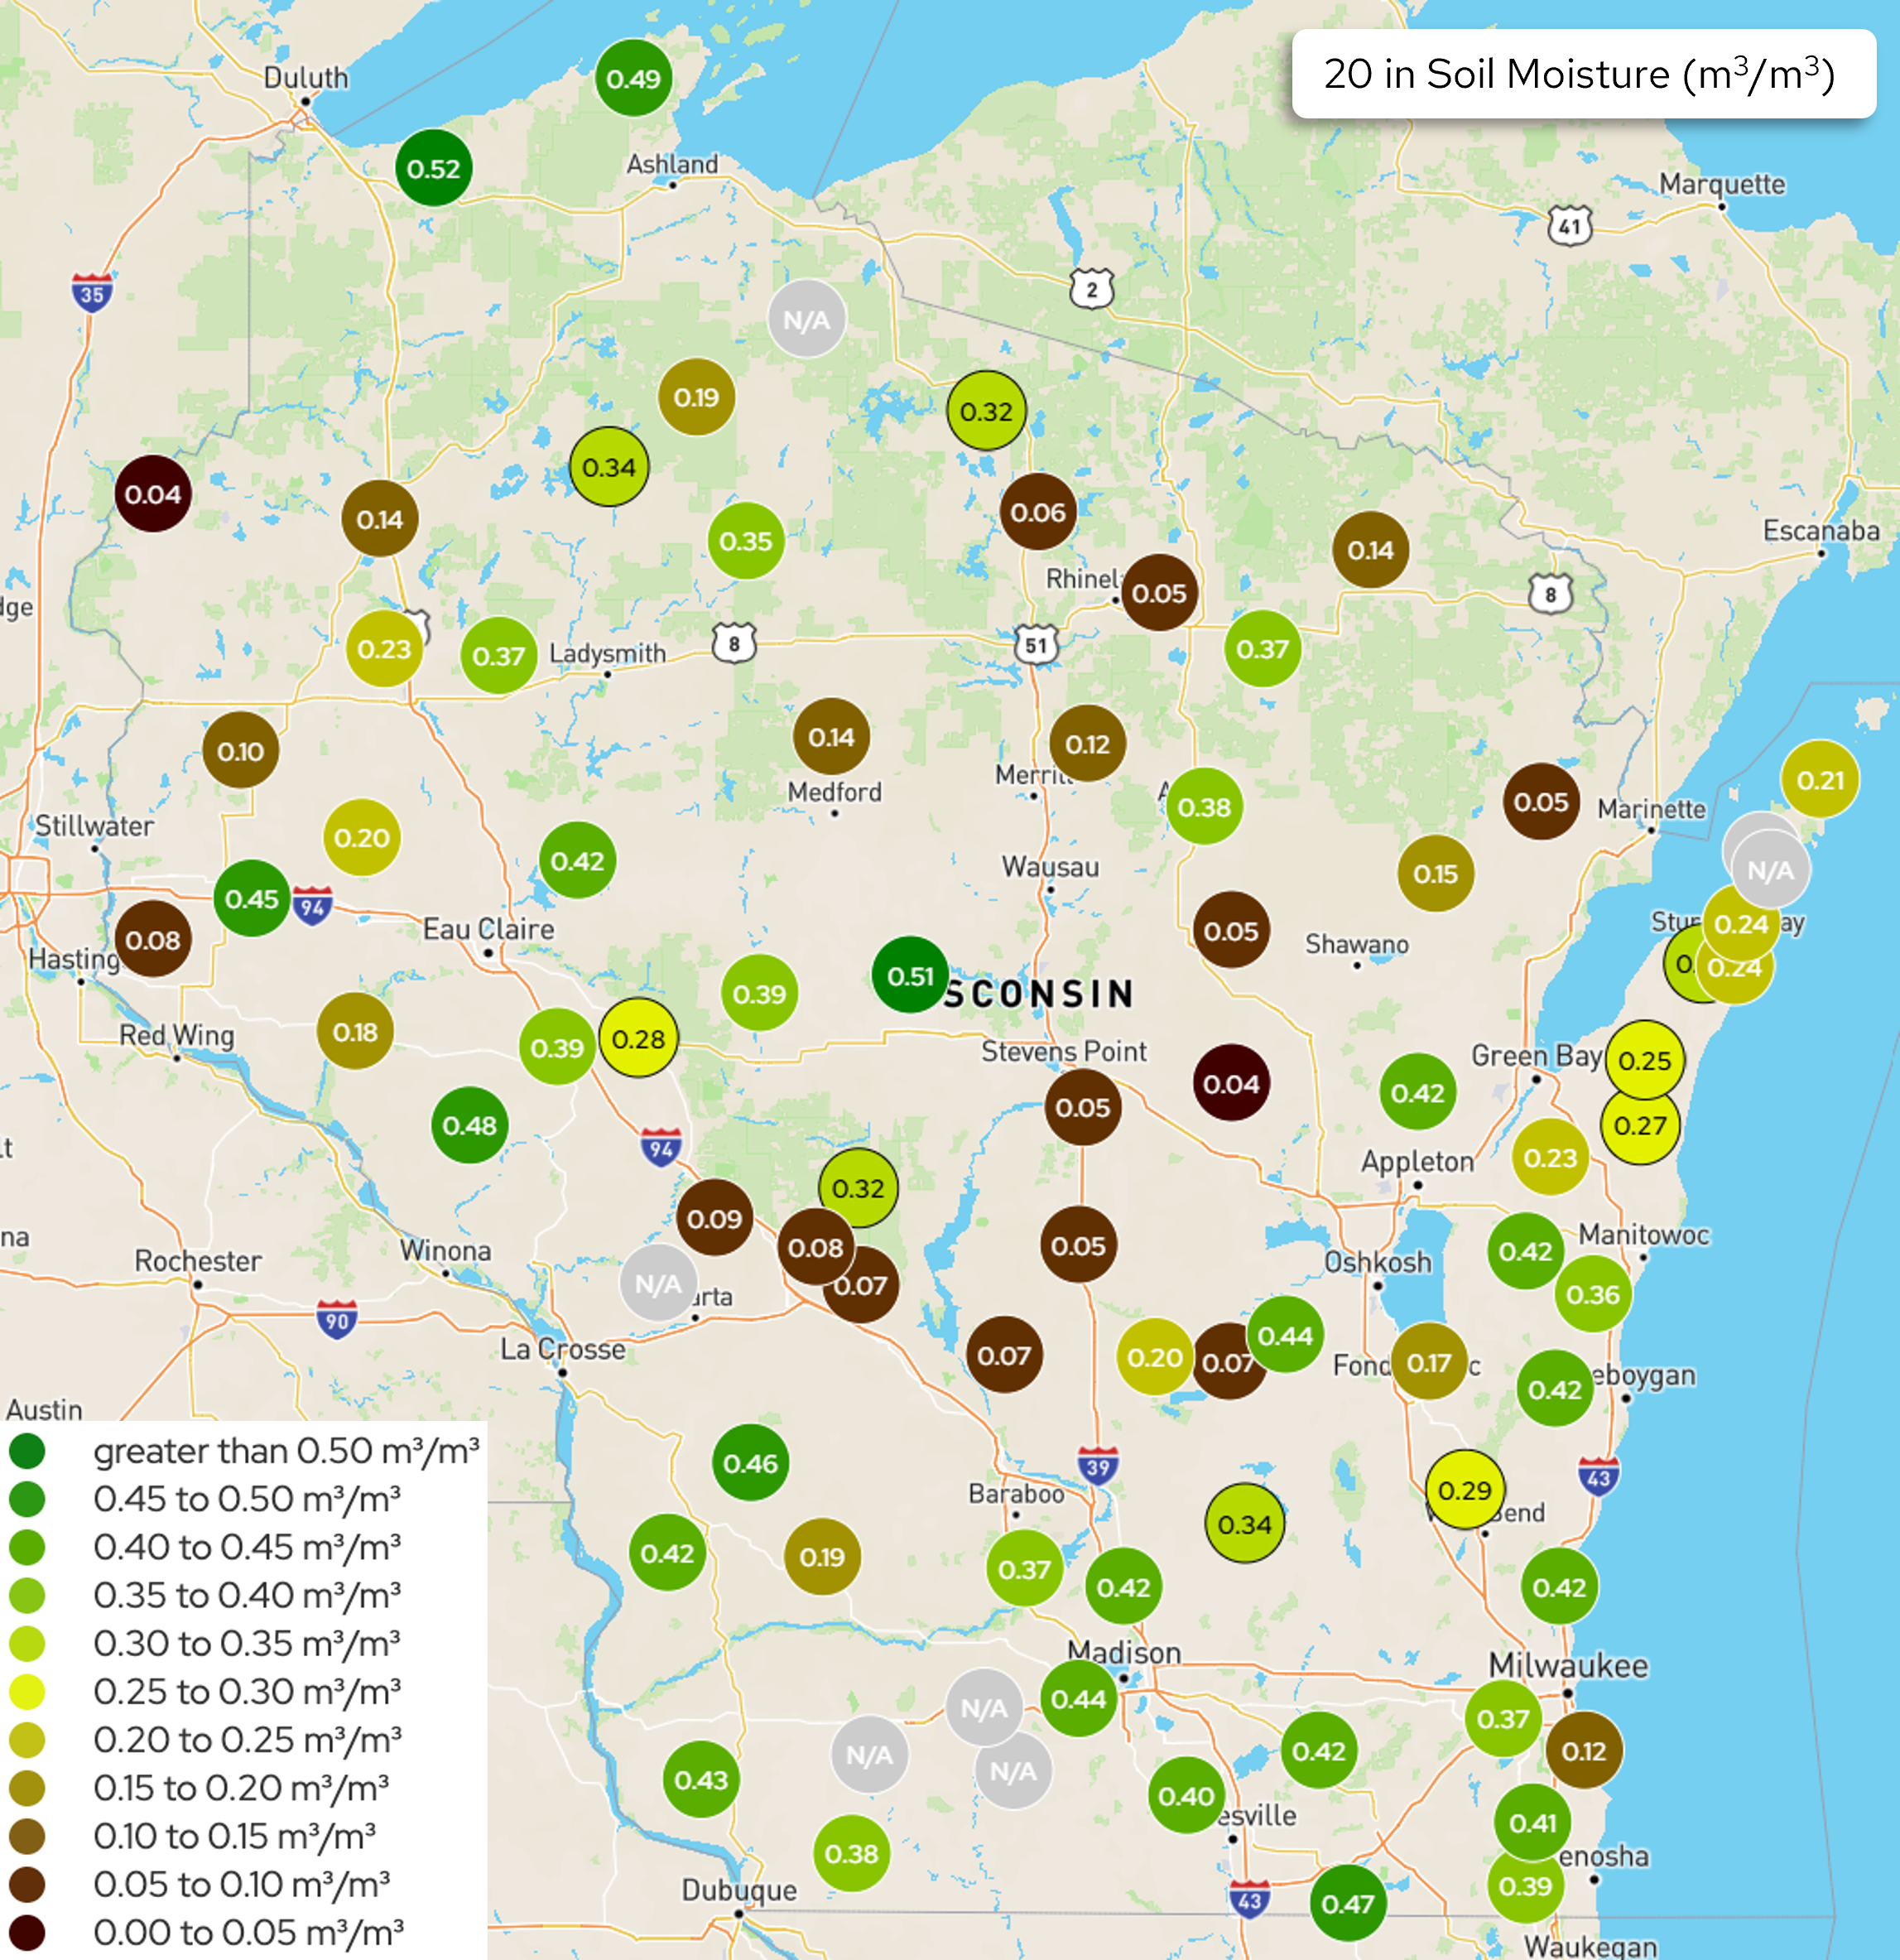
Image Description ↓
A color-coded map of Wisconsin displaying volumetric soil moisture readings at 20-inch depth from a sensor network. Circular markers at station locations show measured values in m³/m³, colored by 11 ranges from dark red (0.00–0.05) through shades of brown and olive to bright yellow-green (0.25–0.35) and dark green (greater than 0.50). Notable readings include 0.52 near Ashland in the northwest (dark green, highest visible value) and 0.51 near Stevens Point in central Wisconsin. Values across the state are highly variable: northern stations trend wetter (0.32–0.52), central and western stations show mid-range values (0.18–0.48), and several central and southern stations show very dry conditions (0.04–0.09). A few stations display “N/A” in gray, indicating missing data. The legend appears in the lower left; the title box appears in the upper right.
- The maps show Wisconet soil moisture conditions on May 11th @ 2:00 pm.
- The table shows total precipitation and changes in soil moisture from May 4th (Start) to May 10th (End).
- Units of map & change values are {Volume of water}/{Volume of soil}.
| Research Farm | County | Total Precipitation (in.) | 4″ Start | 4″ End | 8″ Start | 8″ End | 20″ Start | 20″ End |
|---|---|---|---|---|---|---|---|---|
| Arlington | Columbia | 0.00 | 0.38 | 0.31 | 0.37 | 0.33 | 0.43 | 0.42 |
| Black River Falls | Jackson | 0.00 | 0.08 | 0.06 | 0.10 | 0.09 | 0.15 | 0.10 |
| Dairy Forage ARS | Sauk | 0.00 | 0.21 | 0.17 | 0.31 | 0.27 | 0.38 | 0.37 |
| Hancock | Waushara | 0.00 | 0.05 | 0.02 | 0.06 | 0.04 | 0.05 | 0.05 |
| Kemp | Oneida | 0.00 | 0.17 | 0.14 | 0.16 | 0.14 | 0.07 | 0.06 |
| Lancaster | Grant | 0.00 | 0.27 | 0.22 | 0.32 | 0.26 | 0.45 | 0.44 |
| Marshfield | Marathon | 0.00 | 0.41 | 0.37 | 0.46 | 0.44 | 0.52 | 0.51 |
| O.J. Noer (Turfgrass) | Dane | 0.00 | 0.27 | 0.18 | 0.33 | 0.25 | 0.45 | 0.44 |
| Peninsular | Door | 0.00 | 0.22 | 0.19 | 0.20 | 0.17 | 0.26 | 0.24 |
| Rhinelander | Oneida | 0.00 | 0.16 | 0.12 | 0.14 | 0.11 | 0.05 | 0.05 |
| Spooner | Washburn | 0.08 | 0.22 | 0.15 | 0.15 | 0.12 | 0.15 | 0.14 |
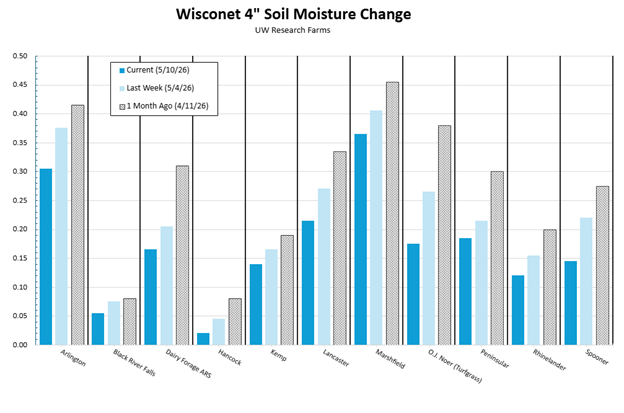
| Research Farm | Current 4″ Soil Moisture | Last Week’s 4″ Soil Moisture | 1 Month Ago 4″ Soil Moisture |
|---|---|---|---|
| Arlington | 0.31 | 0.38 | 0.42 |
| Black River Falls | 0.06 | 0.08 | 0.08 |
| Dairy Forage ARS | 0.17 | 0.21 | 0.31 |
| Hancock | 0.02 | 0.05 | 0.08 |
| Kemp | 0.14 | 0.17 | 0.19 |
| Lancaster | 0.22 | 0.27 | 0.34 |
| Marshfield | 0.37 | 0.41 | 0.46 |
| O.J. Noer (Turfgrass) | 0.18 | 0.27 | 0.38 |
| Peninsular | 0.19 | 0.22 | 0.30 |
| Rhinelander | 0.12 | 0.16 | 0.20 |
| Spooner | 0.15 | 0.22 | 0.28 |
USDA Soil Moisture Reports
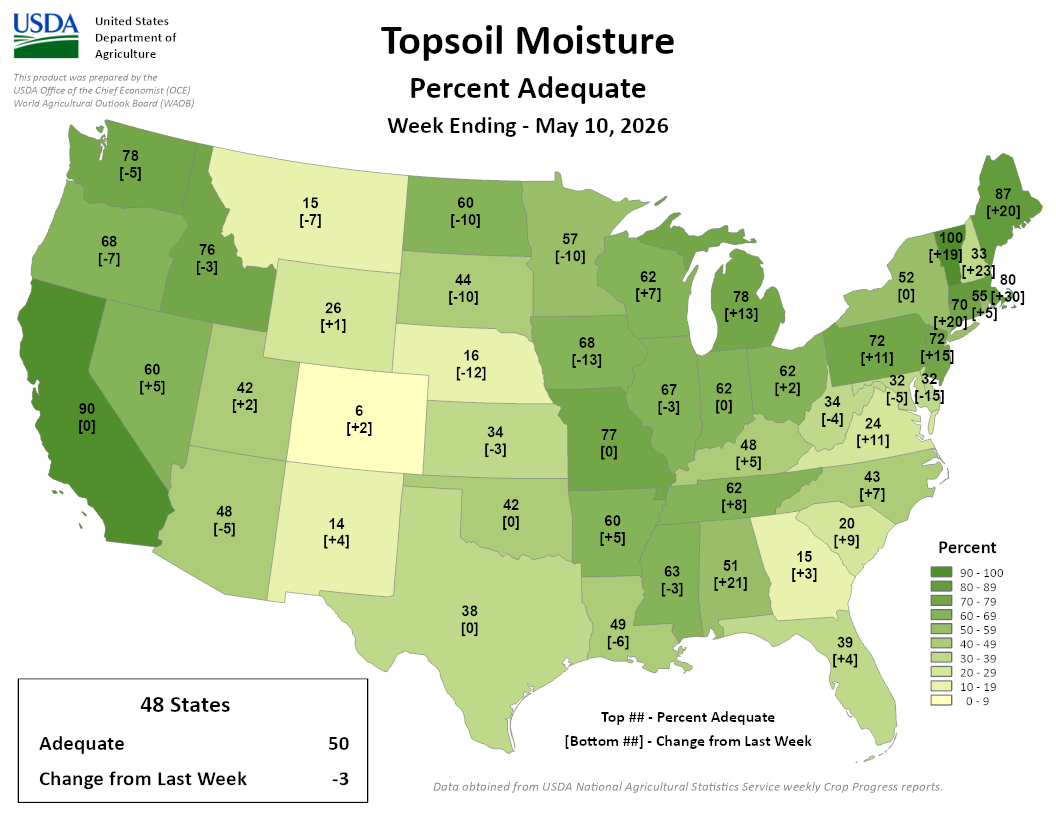
Image Description ↓
A color-coded choropleth map from the USDA showing topsoil moisture percent adequate across the contiguous 48 states for the week ending May 10, 2026. Each state displays two values: percent adequate (top) and change from the previous week in brackets (bottom).
Notable regional patterns:
- Driest conditions (0–9%): Wyoming (6, +2) and Colorado (14, +4)
- 10–29% adequate: New Mexico (15, +3), Nebraska (16, -12), Kansas (34, -3), Louisiana (20, +9), Mississippi (15, +3)
- Moderate (40–69%): Most of the Plains, Southeast, and Pacific Northwest
- Wettest conditions (90–100%): California (90, 0), Connecticut (100, +19), and parts of the Northeast
Largest weekly declines: Nebraska (-12), North Dakota (-10), Montana (-10), South Dakota (-13)
Largest weekly gains: Mississippi (+21), Maine (+20), New Hampshire (+30), New Jersey (+23)
The national 48-state average is 50% adequate, a decrease of 3 points from the prior week. Data source: USDA National Agricultural Statistics Service weekly Crop Progress reports.
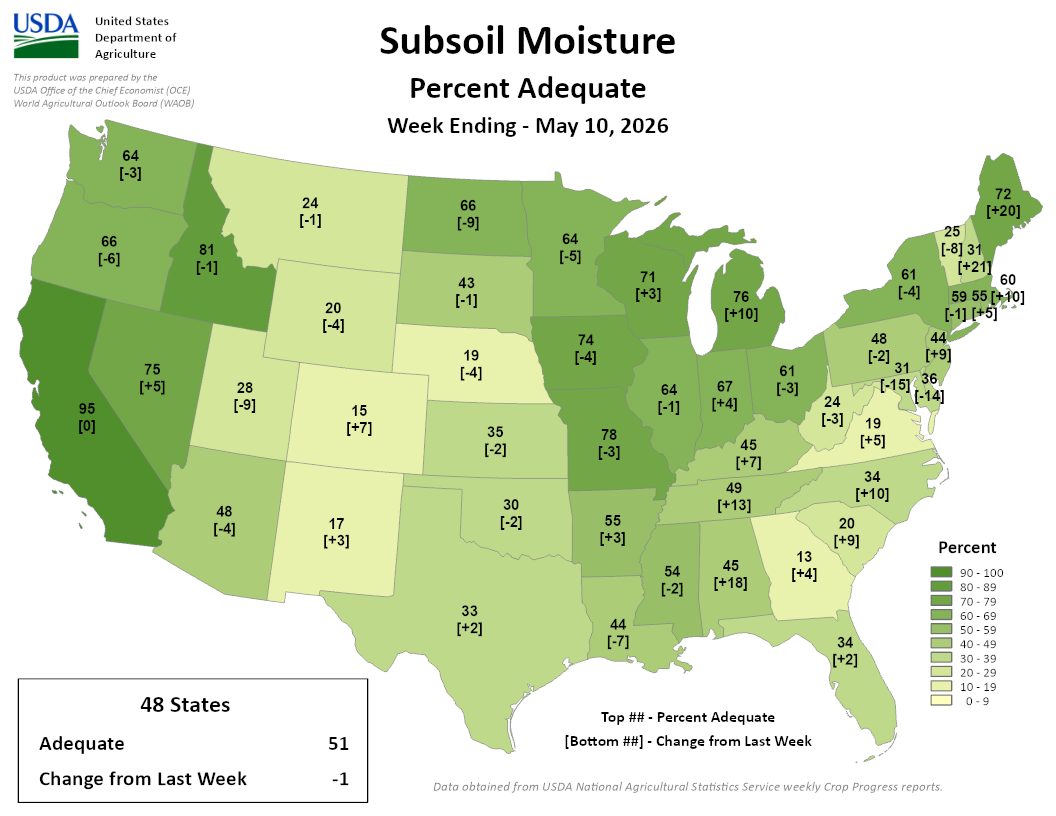
Image Description ↓
Choropleth map of contiguous U.S. subsoil moisture (percent adequate) from the USDA Office of the Chief Economist. Each state displays its current percent adequate (top number) and change from the previous week (bracketed number).
Regional highlights:
- West: California 95% (no change), Nevada/Idaho 75% (+5), Oregon 81% (−1), Washington 64% (−3)
- Northern Plains/Midwest: Michigan 76% (+10), Wisconsin 71% (+3), Iowa 78% (−3), Illinois 74% (−4), Indiana 67% (+4)
- Southern Plains: Kansas 35% (−2), Oklahoma 30% (−2), Texas ranges from 33% to 44%
- Southeast: Georgia 13% (+4), Alabama 20% (+9), Mississippi 45% (+18), South Carolina 34% (+10)
- Northeast: Maine 72% (+20), Vermont/New Hampshire 31% (+21), Connecticut 60% (+10)
Color scale (dark to light green): 90–100%, 80–89%, 70–79%, 60–69%, 50–59%, 40–49%, 30–39%, 20–29%, 10–19%, 0–9%. The Southeast and Southern Plains show the driest conditions; the Pacific Coast and upper Midwest show the highest moisture levels.
- 62% and 71% of agricultural soils in the state are reported as having adequate topsoil and subsoil moisture, respectively.
- 30% and 25% of agricultural soils in the state are reported as having surplus topsoil and subsoil moisture, respectively.
Wisconet Soil Temperature
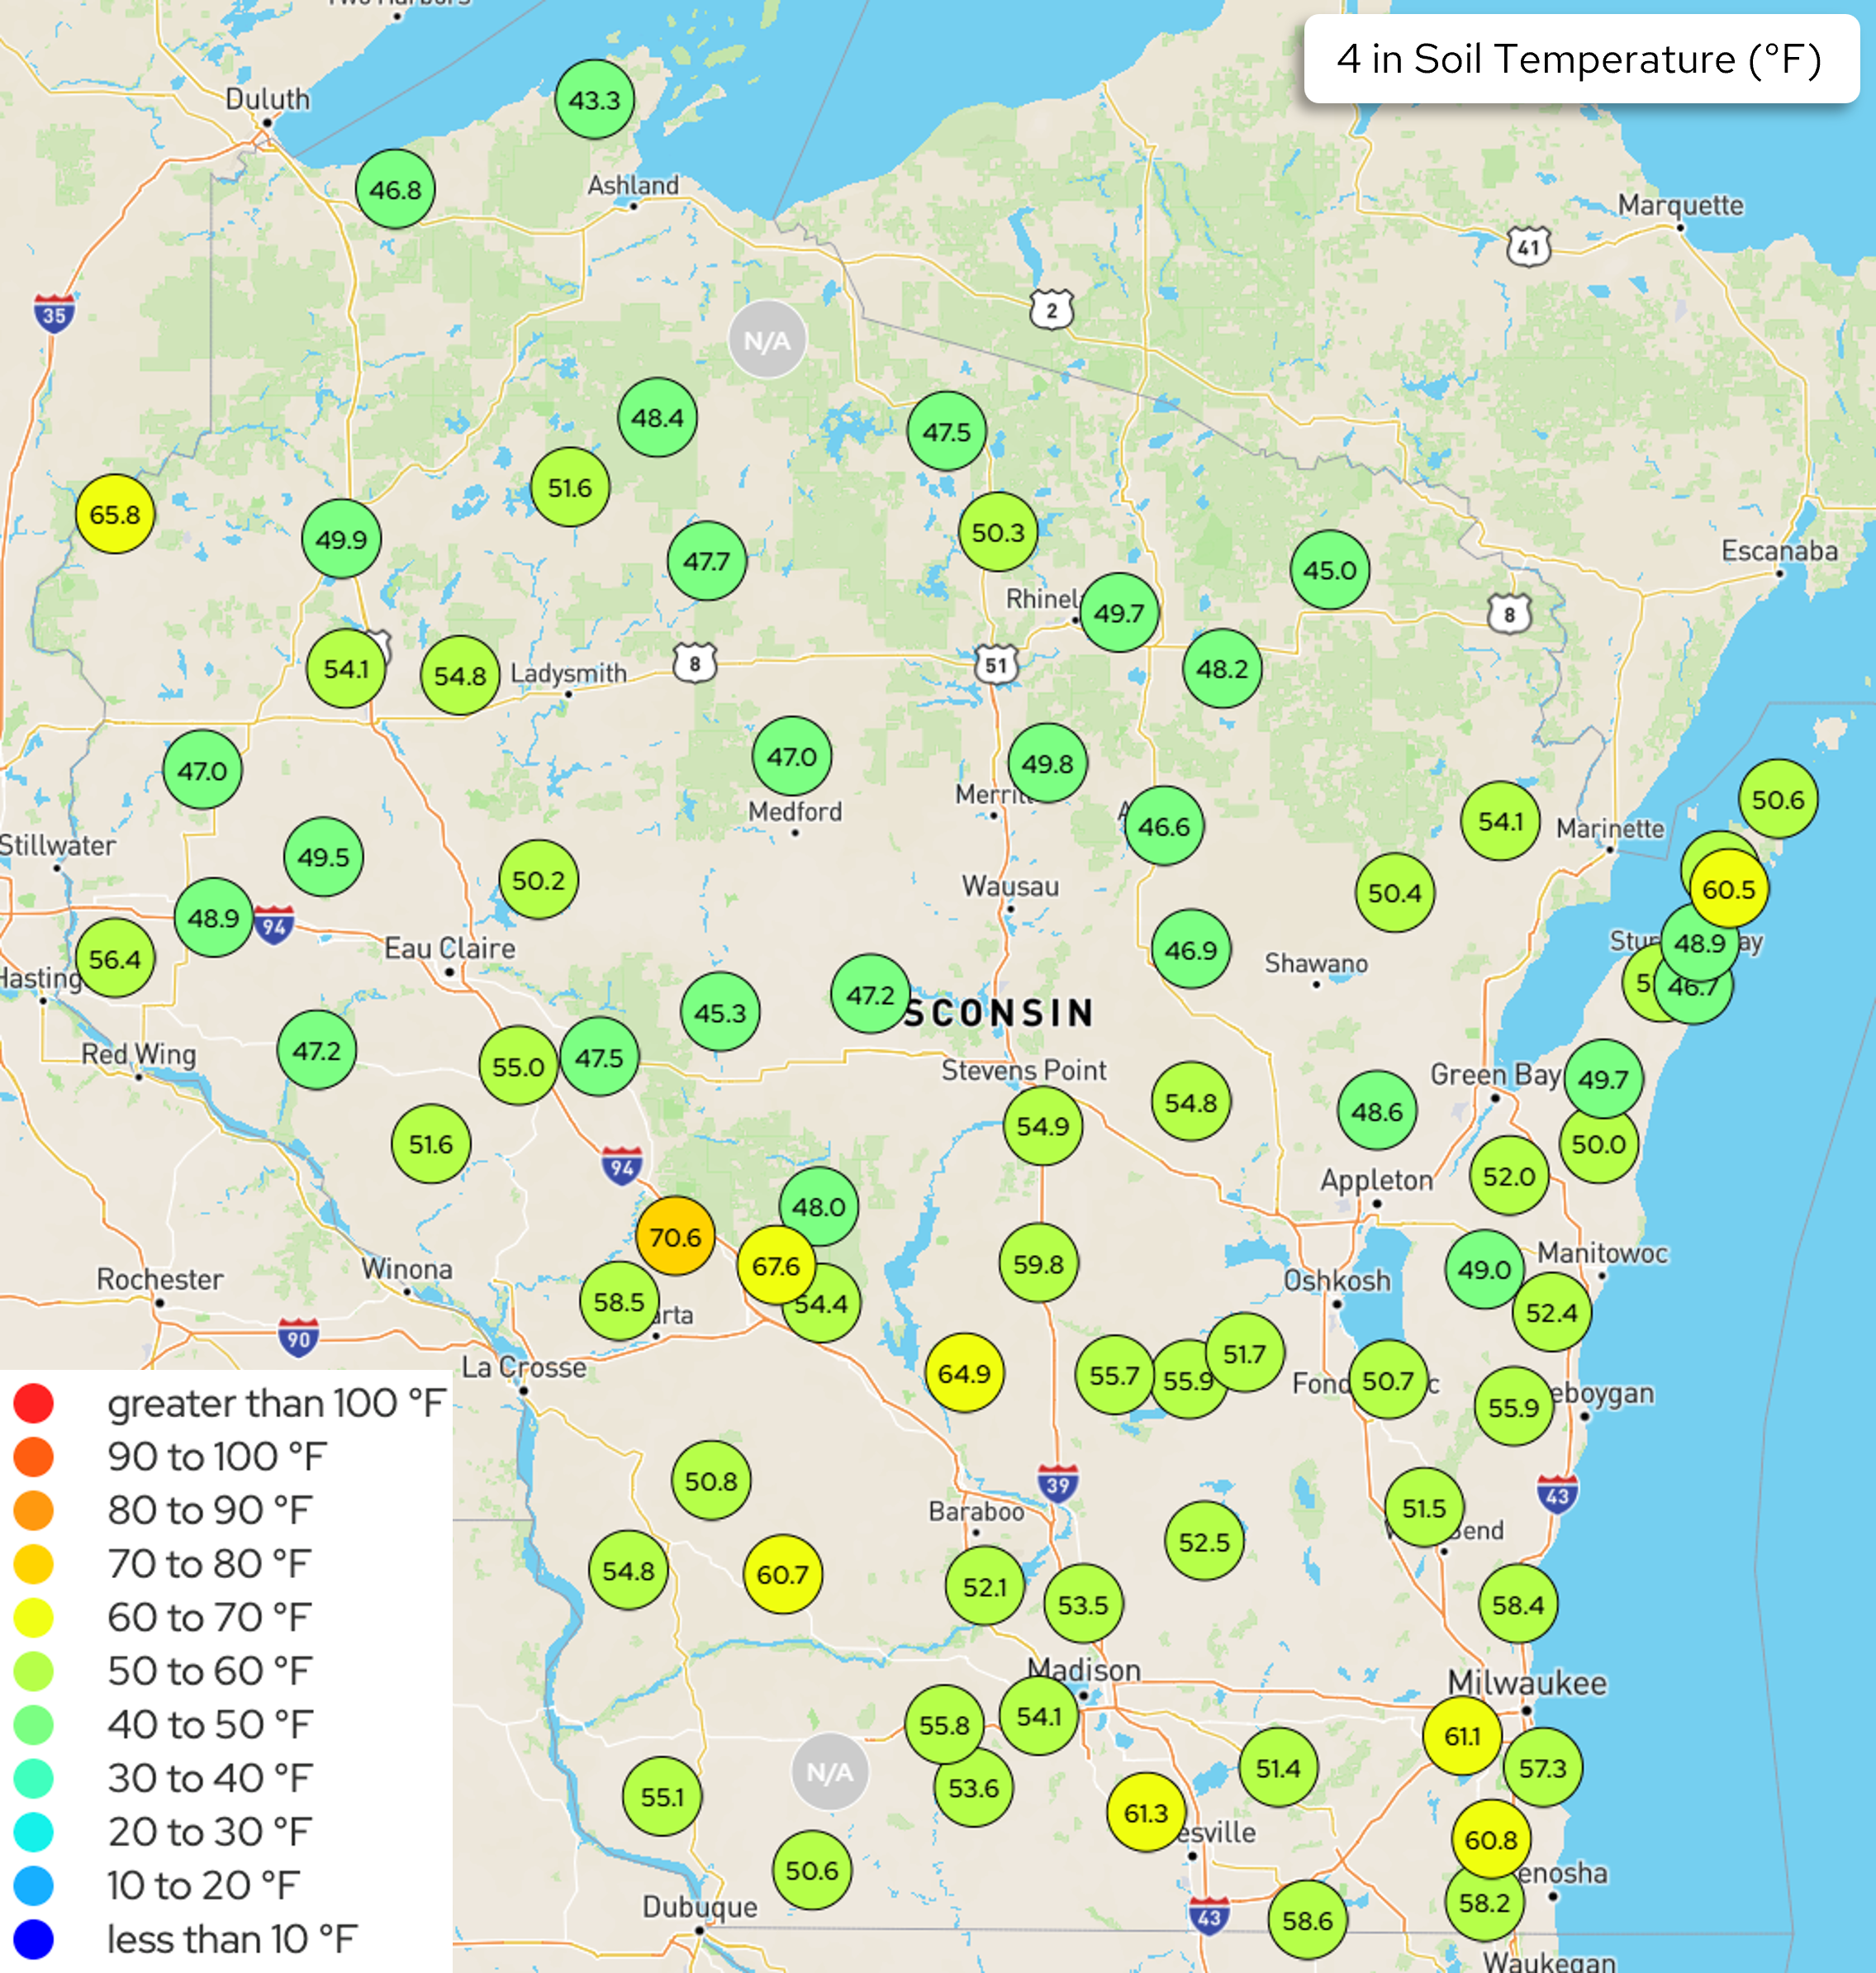
Image Description ↓
Color-coded dot map of Wisconsin showing 4-inch soil temperatures in °F across weather station locations. Most stations across northern and central Wisconsin read 45–55°F (green). Southern and western Wisconsin show warmer readings of 60–70°F (yellow), with two stations near La Crosse reaching 70.6°F and 67.6°F (orange). The far northwest near Stillwater shows 65.8°F. The color scale ranges from dark blue (below 10°F) through cyan, teal, green, yellow, orange, and red (above 100°F). Two stations are marked N/A.
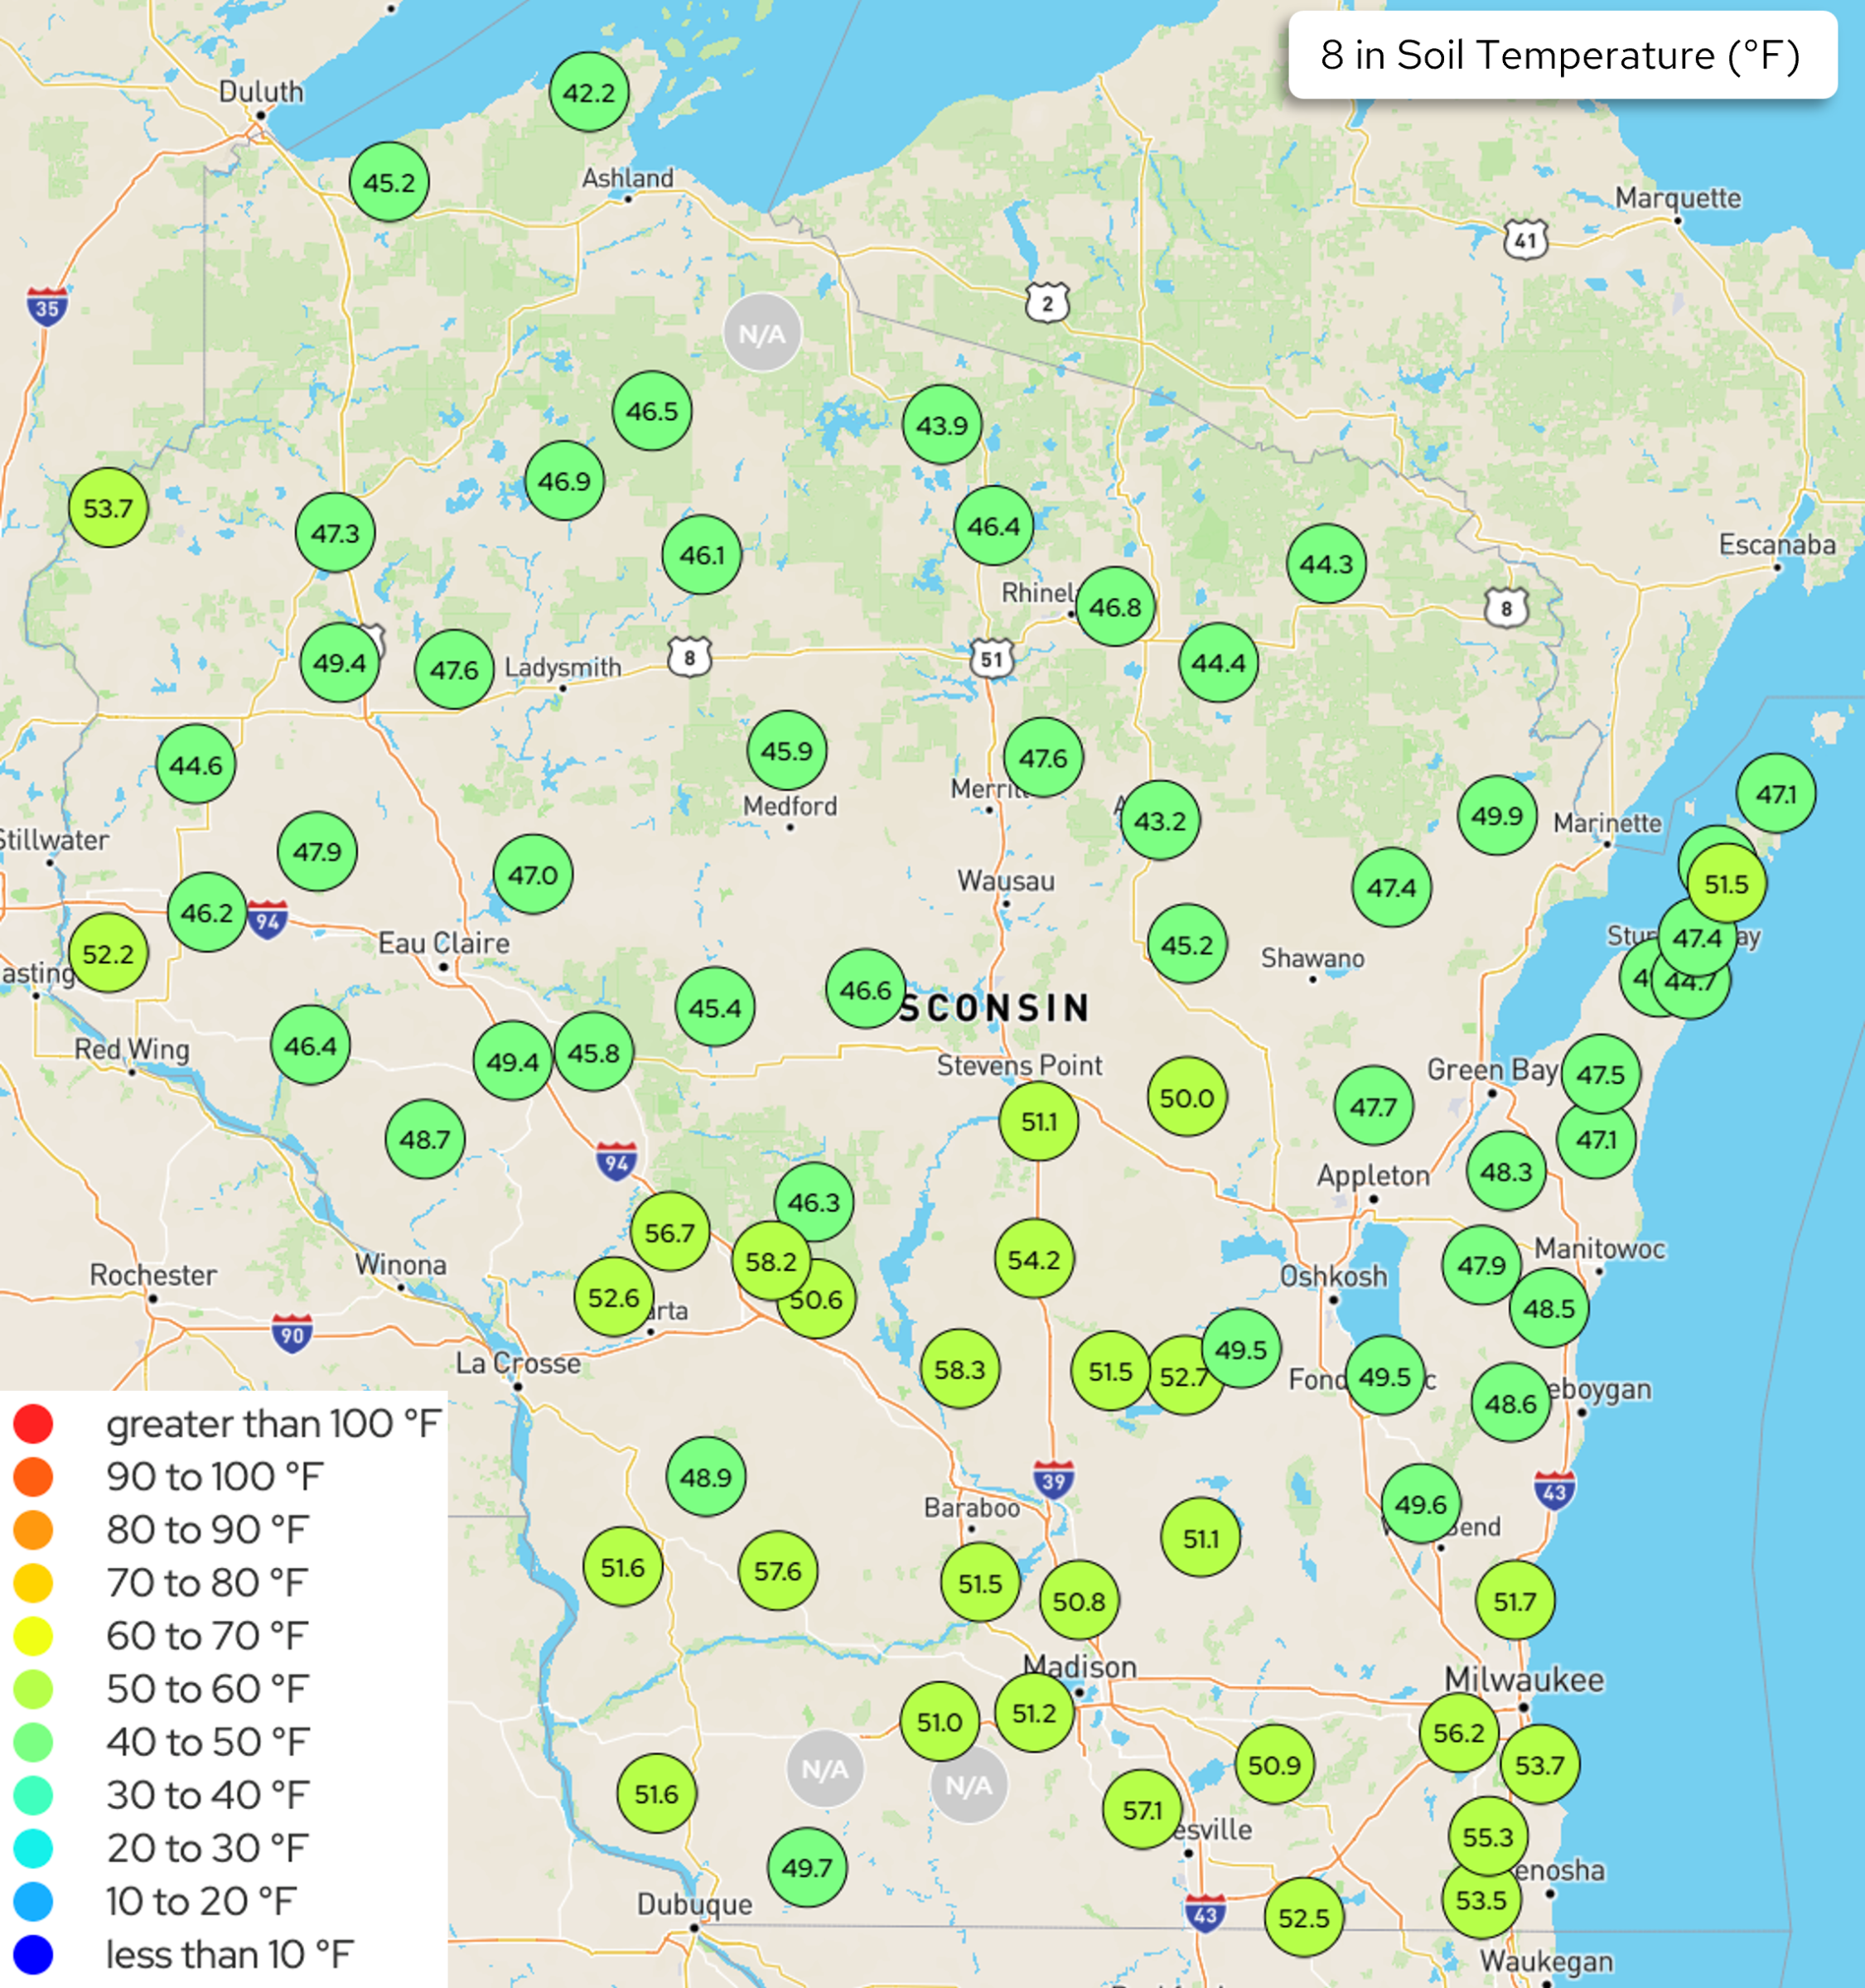
Image Description ↓
A color-coded map of Wisconsin and border regions showing 8-inch depth soil temperatures in °F, from a university weather network. Circular markers display numeric readings at individual station locations across the state. The color scale ranges from dark blue (below 10°F) through cyan, teal, green, yellow-green, yellow, and orange to red (above 100°F).
Temperatures across Wisconsin are predominantly in the 40–50°F range (medium green) in the north and central regions, and 50–60°F (yellow-green) in the south and southwest. Notable readings include: a low of 42.2°F near Duluth/northern border; mid-40s across much of central and northern Wisconsin (e.g., 43.2, 44.3, 44.4, 44.6, 44.7); readings in the upper 40s to low 50s across central Wisconsin (e.g., 47.6, 49.4, 51.1); and warmer readings in the southwest and south-central areas, including 56.7, 57.6, 58.2, and 58.3°F. The southeast corridor near Milwaukee shows readings of 52.5–56.2°F. Two stations display “N/A” (no data). A color legend appears in the lower left.
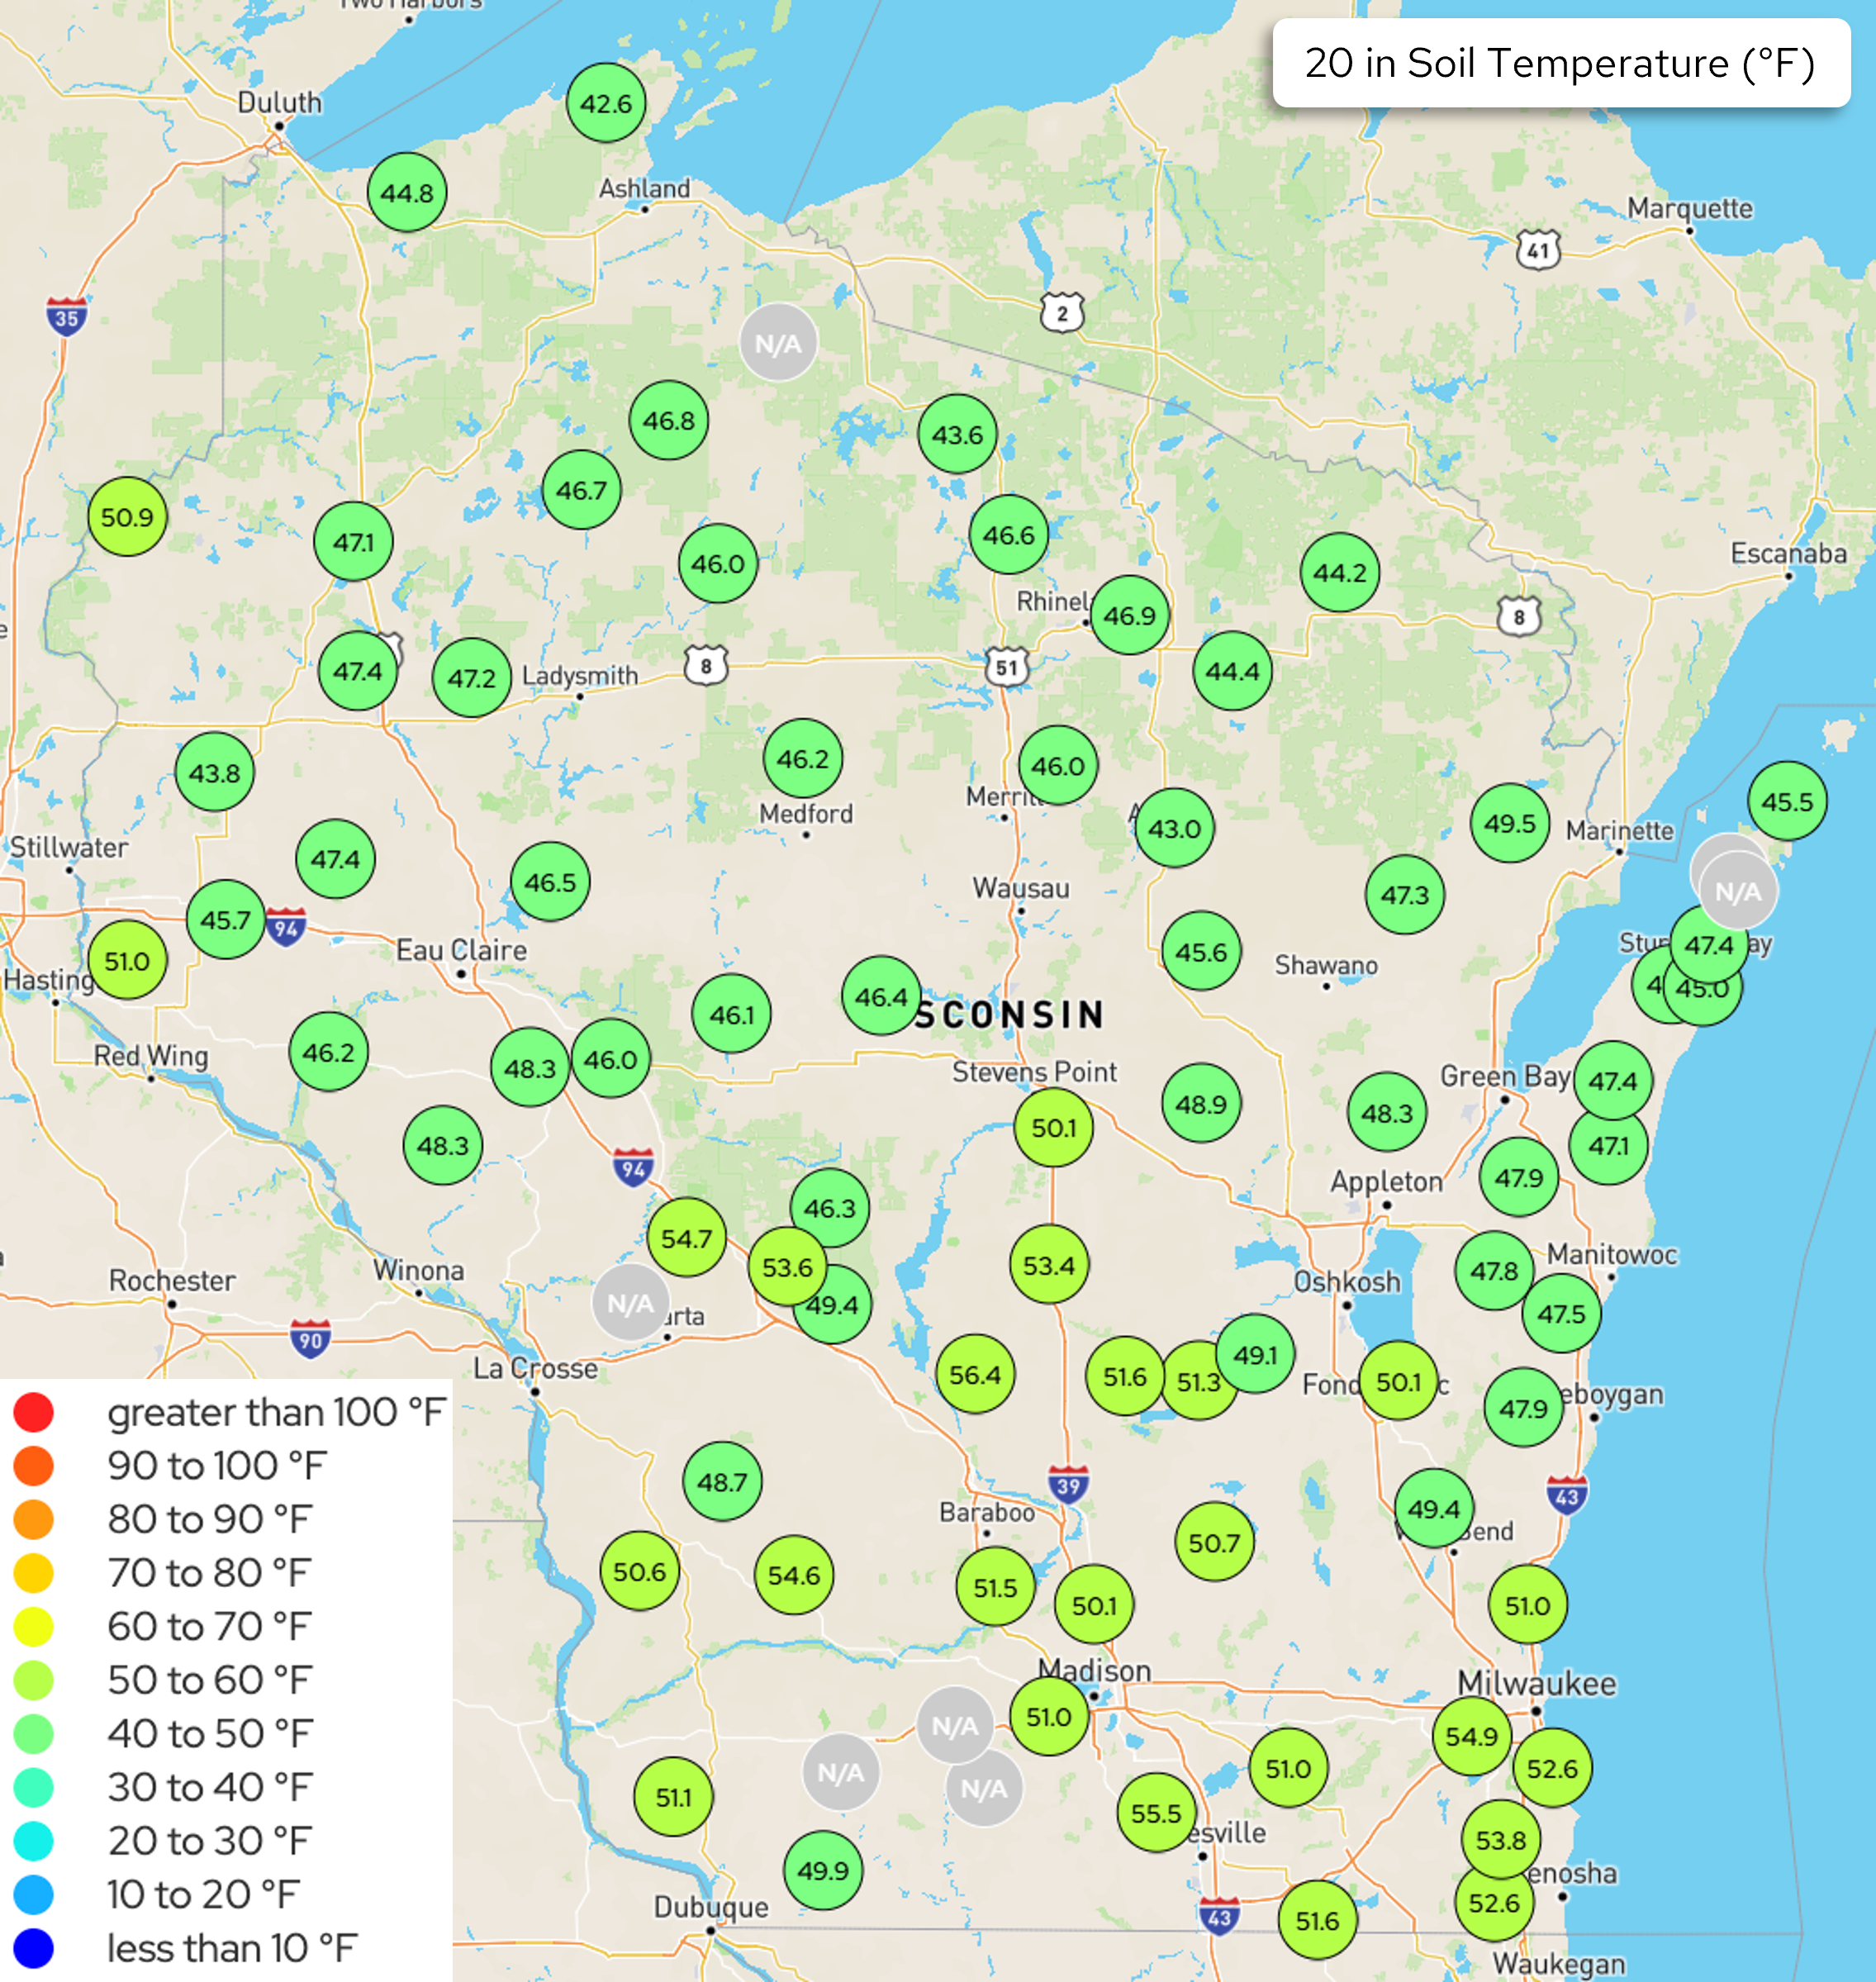
Image Description ↓
A color-coded dot map of Wisconsin showing 20-inch depth soil temperatures in degrees Fahrenheit from a network of monitoring stations. Dots are colored on a spectrum from dark blue (below 10°F) to red (above 100°F); all visible readings fall in the 40–60°F range, represented by light and medium green dots (40–50°F and 50–60°F respectively). Northern Wisconsin stations show cooler readings generally in the low-to-mid 40s°F (e.g., 42.6, 43.6, 44.2, 44.4, 44.8). Central Wisconsin stations range from the mid-40s to low 50s°F (e.g., 46.0–50.1). Southern Wisconsin stations are warmer, mostly in the low-to-mid 50s°F (e.g., 51.0–56.4), with the highest visible reading of 56.4°F in the south-central region. Several stations display “N/A” indicating no data available. A legend in the lower left identifies the full color scale in 10°F increments from “less than 10°F” (dark blue) to “greater than 100°F” (red).
- The maps show Wisconet soil temperature conditions on May 11th @ 2:00 pm.
U.S. Drought Monitor
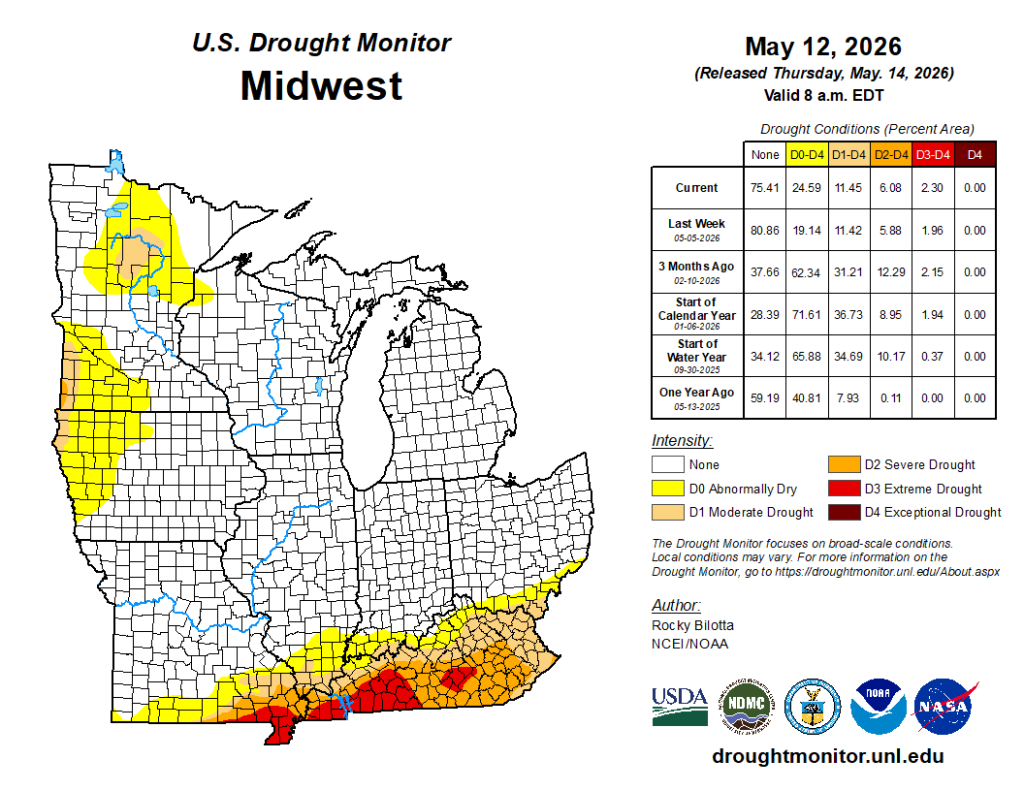
Image Description ↓
Map of the U.S. Midwest showing drought conditions as of May 12, 2026, released by NOAA/USDA. The majority of the region (75.41%) has no drought. Drought affects 24.59% of the area (D0–D4 combined). Northwestern Minnesota shows D0 (Abnormally Dry) and D1 (Moderate Drought) conditions. The most severe drought — D3 (Extreme Drought, shown in red) — is concentrated in southern Missouri, southern Illinois, and western Kentucky, affecting 2.30% of the region. No D4 (Exceptional Drought) is present. Compared to one year ago, drought coverage has expanded significantly (40.81% vs. 24.59% D0–D4). A data table shows drought percent-area comparisons across current, last week, 3 months ago, start of calendar year, start of water year, and one year ago. Map produced by Rocky Bilotta, NCEI/NOAA.
Compared to last week:
- Midwest: Drought coverage and severity increased slightly from last week. Portions of MN and IA were added to D0 coverage, and the widespread drought in the south expanded in coverage.
- 88.6% of the Midwest region is drought free (~11.4% in D1-D4).
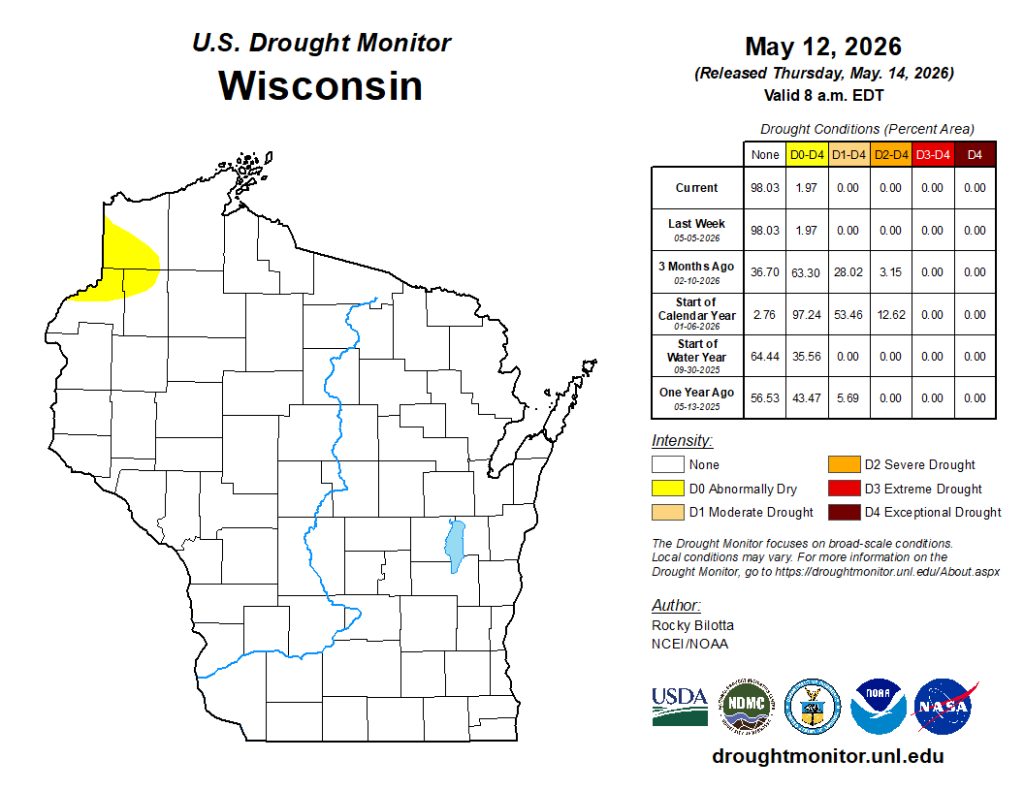
Image Description ↓
U.S. Drought Monitor map of Wisconsin dated May 12, 2026 (released May 14, 2026). A small area in the northwest corner of the state is classified as D0 Abnormally Dry, shown in yellow. The remainder of the state shows no drought conditions.
The accompanying data table shows drought conditions as percent of state area:
- Current: 98.03% None, 1.97% D0–D4, 0% D1 or higher
- Last Week (05-05-2026): Identical to current
- 3 Months Ago (02-10-2026): 36.70% None, 63.30% D0–D4, 28.02% D1–D4, 3.15% D2–D4
- Start of Calendar Year (01-06-2026): 2.76% None, 97.24% D0–D4, 53.46% D1–D4, 12.62% D2–D4
- Start of Water Year (09-30-2025): 64.44% None, 35.56% D0–D4, 0% D1 or higher
- One Year Ago (05-13-2025): 56.53% None, 43.47% D0–D4, 5.69% D1–D4
No D3 Extreme or D4 Exceptional Drought is recorded at any time point. Data source: NCEI/NOAA via droughtmonitor.unl.edu.
- No change from last week’s report.
![Write WCAG 2.1 AA compliant alt text for these university website images. Include: essential content, visible text, key details (no fluff), concise alt text (150 chars max) + longer description if needed. If using a longer image description, include "Image description below" in the alt text. Avoid "Image of" openings and emotion assumptions.
Format:
Alt text: [brief]
Image description: [detailed]](https://cropsandsoils.extension.wisc.edu/files/2026/05/current_WI_chng_1W-1-1024x791.png)
Image Description ↓
U.S. Drought Monitor Class Change map for Wisconsin comparing May 5 to May 12, 2026, produced by the National Drought Mitigation Center at the University of Nebraska. The map displays Wisconsin county boundaries with a color-coded legend ranging from 5 Class Degradation (dark brown) to 5 Class Improvement (dark blue), with gray indicating no change. Nearly all counties show no color fill, indicating no drought class change over the one-week period. A small gray-shaded area appears in the far northwestern corner of the state, representing “No Change” in drought classification. No degradation or improvement is indicated anywhere in the state. Source: droughtmonitor.unl.edu.
- The state remains drought free.
U.S. Drought Monitor Time Series
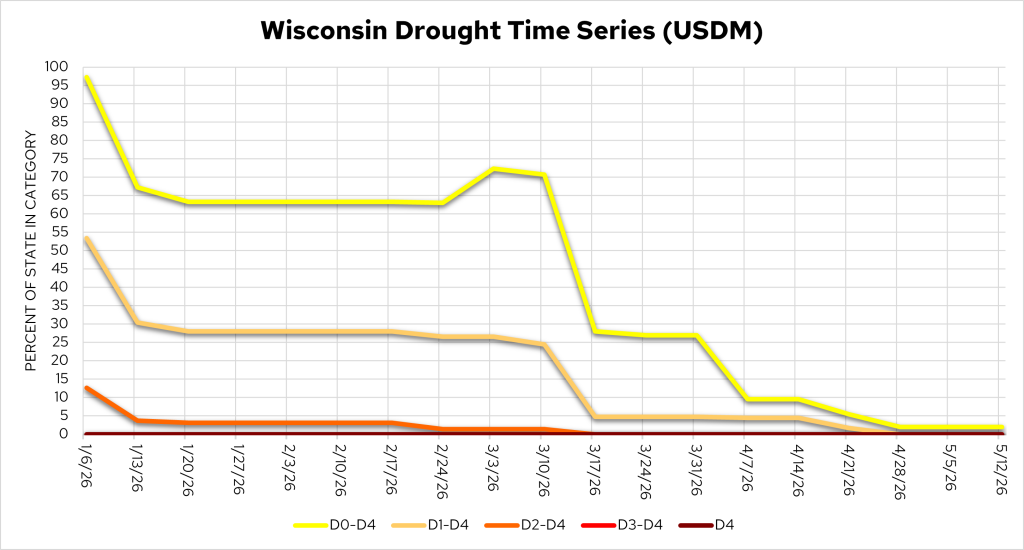
Image Description ↓
Line chart showing the percent of Wisconsin in each U.S. Drought Monitor category from 1/6/26 to 5/12/26. Five lines are plotted: D0–D4 (yellow), D1–D4 (tan), D2–D4 (orange), D3–D4 (red), and D4 (dark red). In early January, D0–D4 coverage peaked near 97% and D1–D4 near 53%. All categories declined through January, then stabilized through mid-March, with D0–D4 holding around 63–71% and D1–D4 near 27%. A sharp drop occurred after 3/10/26: D0–D4 fell from ~70% to ~27% by 3/17/26, continuing downward to under 10% by late April. D2–D4 and D3–D4 remained below 15% and near 0% respectively throughout. By 5/12/26, all categories converged near 0–2%, indicating near-elimination of drought conditions across the state.
- 2% of the state remains abnormally dry (D0), all in Douglas, Burnett, and Washburn Counties.
Temperature Trends
7 Day Temperatures
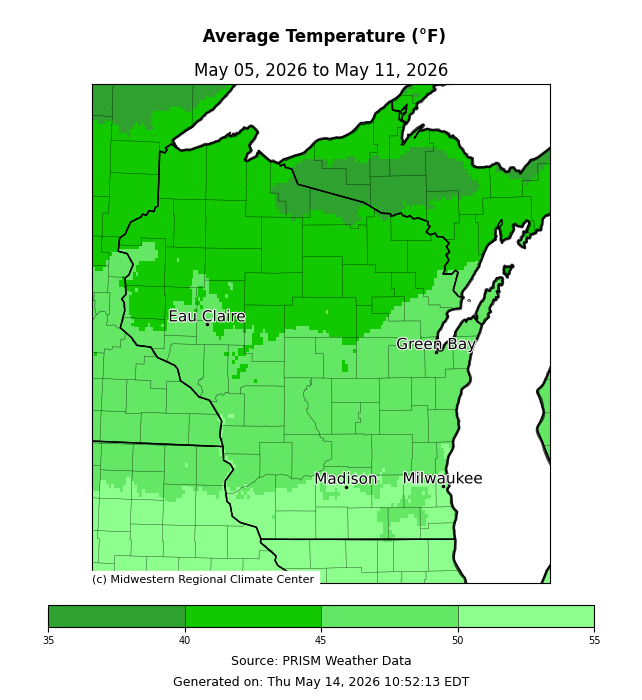
Image Description ↓
Choropleth map of Wisconsin and Upper Michigan showing 7-day average temperatures (°F) from May 5–11, 2026, sourced from PRISM Weather Data via the Midwestern Regional Climate Center. A green color scale runs from 35°F (dark green) to 55°F (light green). Southern Wisconsin, including Madison and Milwaukee, shows the warmest readings at approximately 50–55°F (lightest green). Central Wisconsin and the Green Bay area average 45–50°F (medium green). Northern Wisconsin and the Upper Peninsula of Michigan are coolest at 35–45°F (dark green), with the coldest pocket in the northeastern Upper Peninsula. The Eau Claire region in west-central Wisconsin shows slightly cooler values than surrounding southern areas, around 45–48°F.
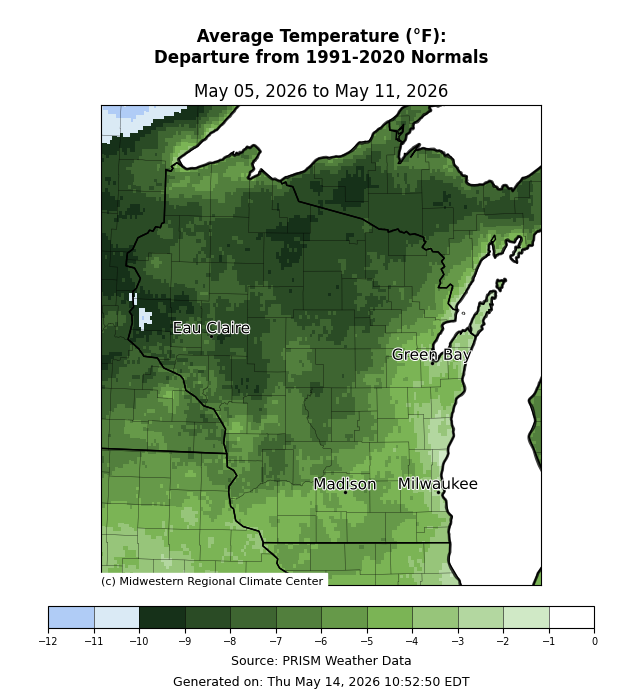
Image Description ↓
Map of Wisconsin showing average temperature departure from 1991–2020 normals, May 5–11, 2026. Nearly the entire state is shaded dark green, indicating temperatures 4–8°F below normal. Cities labeled: Eau Claire, Green Bay, Madison, Milwaukee. Source: PRISM Weather Data via Midwestern Regional Climate Center.
- Average temperatures ranged from 50-55°F in the south to 40-45°F in the north.
- Temperatures were 4-8°F below normal across most of Wisconsin. Temperatures were most below normal in the north and west.
30 Day Temperatures
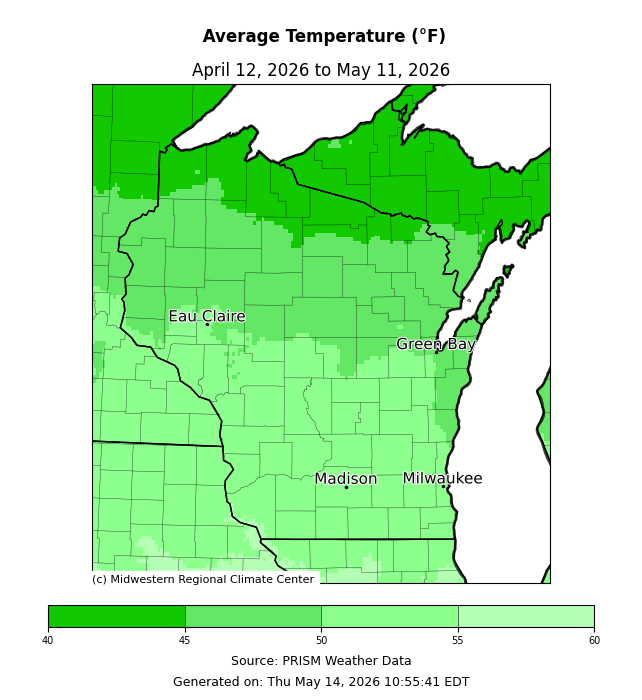
Image Description ↓
Map of Wisconsin showing average temperatures (°F) from April 12–May 11, 2026. Southern counties (Madison, Milwaukee) averaged 55–60°F; northern counties 40–50°F. Source: PRISM/Midwestern Regional Climate Center.
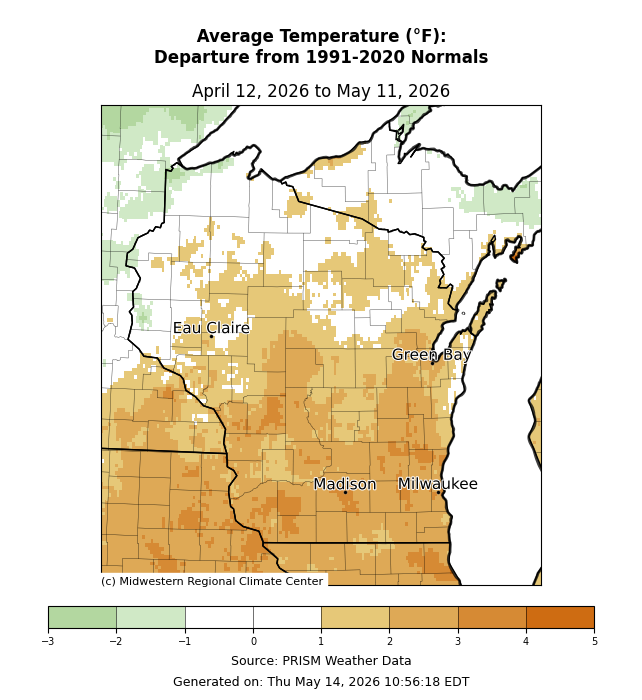
Image Description ↓
Map of Wisconsin and neighboring states showing average temperature departure from 1991–2020 normals, April 12–May 11, 2026. Most of Wisconsin is 2–5°F above normal (orange-brown shading), with the strongest anomalies in southern and central Wisconsin near Madison and Milwaukee. Northern Wisconsin and the Upper Peninsula of Michigan show near-normal or slightly below-normal temperatures (white to light green). A color scale ranges from –3°F (green) to +5°F (dark brown). Source: PRISM Weather Data via Midwestern Regional Climate Center, generated May 14, 2026.
Crop Progress and Condition
Crop Progress Report for Wisconsin for the Week Ending on May 3rd
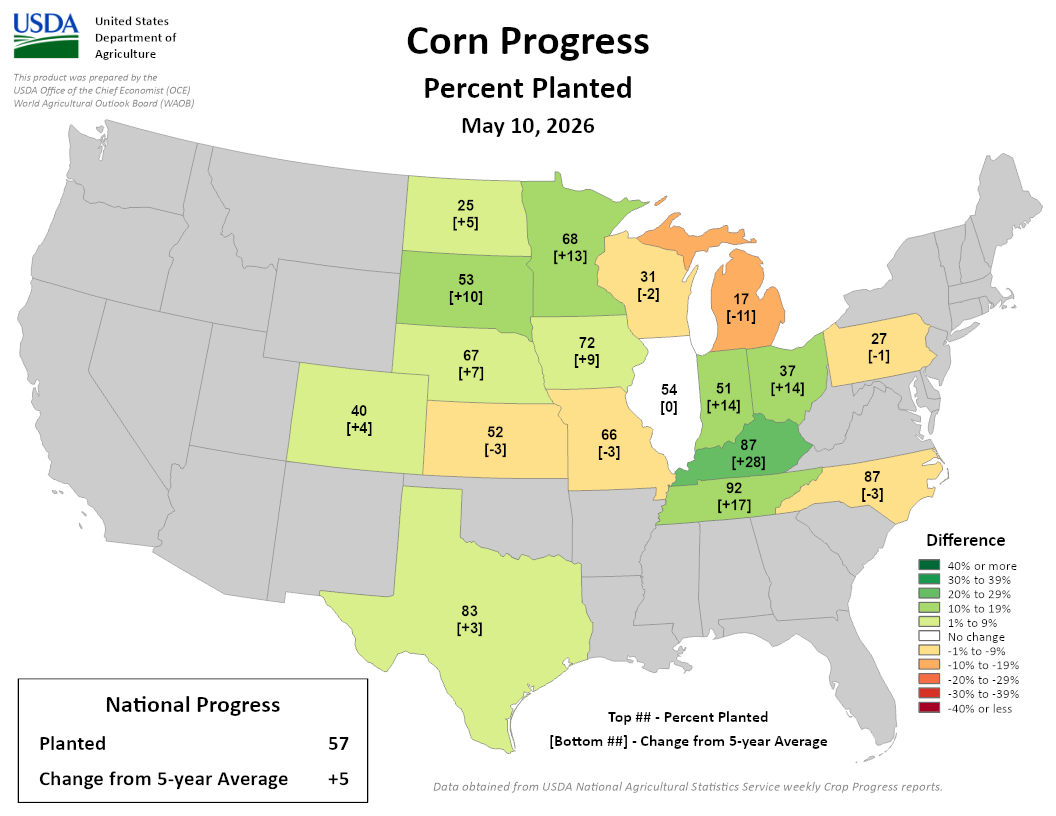
Image Description ↓
USDA choropleth map showing corn planting progress by state as of May 10, 2026. Each state displays percent planted (top number) and change from 5-year average in brackets. National totals: 57% planted, +5% change from 5-year average.
State data, listed by region:
Northern Plains/Midwest: North Dakota 25% [+5]; South Dakota 53% [+10]; Nebraska 67% [+7]; Kansas 52% [−3]
Corn Belt: Minnesota 68% [+13]; Iowa 72% [+9]; Missouri 66% [−3]; Illinois 54% [0]; Indiana 51% [+14]; Ohio 37% [+14]
Great Lakes: Wisconsin 31% [−2]; Michigan 17% [−11]
South/Southeast: Texas 83% [+3]; Tennessee 92% [+17]; Kentucky 87% [+28]; North Carolina 87% [−3]
Mid-Atlantic: Pennsylvania 27% [−1]
Mountain West: Colorado 40% [+4]
Color legend indicates deviation from 5-year average, ranging from dark green (40%+ above) through white (no change) to dark red (40%+ below). Michigan shows the largest deficit (−11%); Kentucky shows the largest surplus (+28%).
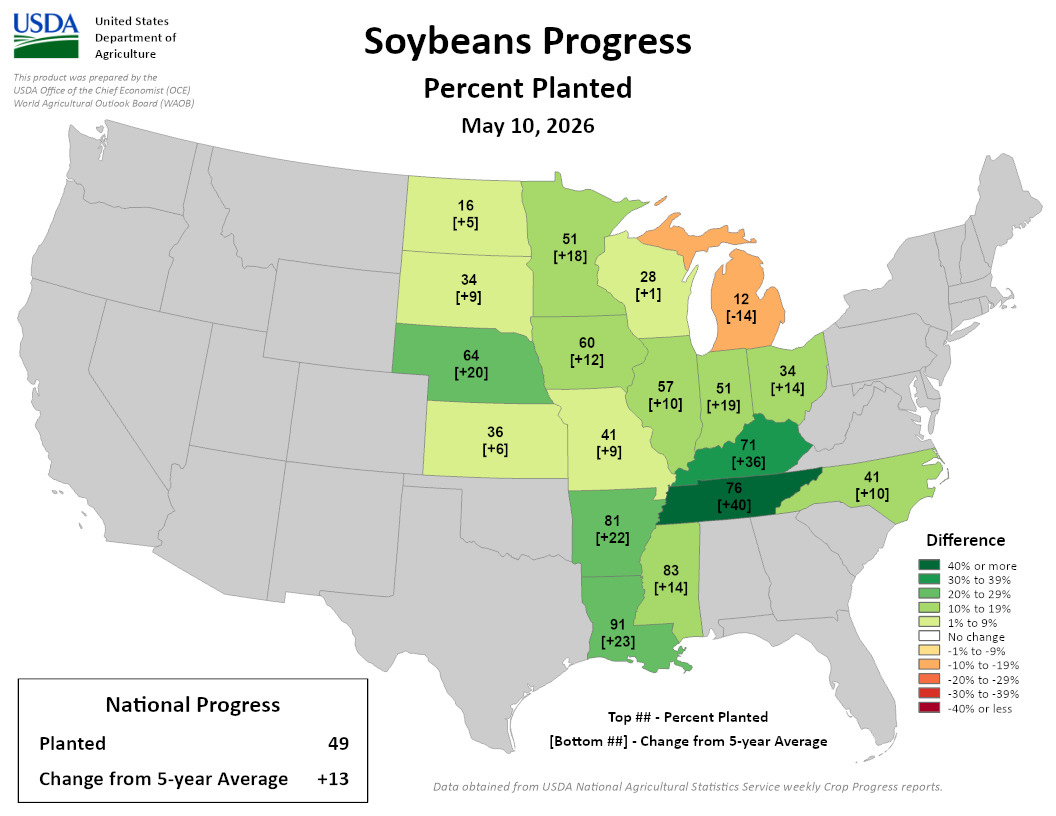
Image Description ↓
Choropleth map of the contiguous US showing soybean planting progress by state as of May 10, 2026. Each state displays percent planted and change from the 5-year average in brackets. Most soybean-producing states show above-average progress (green shading). Notable values: Tennessee 76% [+40], Kentucky 71% [+36], Louisiana 91% [+23], Arkansas 81% [+22], Nebraska 64% [+20], Indiana 51% [+19]. Michigan is the only state below average at 12% [-14], shown in orange. National totals: 49% planted, +13 above 5-year average. Legend ranges from dark green (40%+ above average) to dark red (40%+ below average).
- Wisconsin had 6.2 days suitable for fieldwork statewide, thanks to little to no rainfall.
- Corn planting is at 31% complete, up from 21% last week.
- Soybean planting is at 28% complete, up from 18% last week.
- Oat planting is 47% complete, compared to the average of 57%. Emergence is at 23% percent complete.
- Pasture and range were rated 54% good to excellent, up 4 percentage points from last week.
- Winter wheat was rated 59% good to excellent, up 3% from last week.
- Read the full USDA report.
Forecasts and Outlooks
7 Day Precipitation Forecast
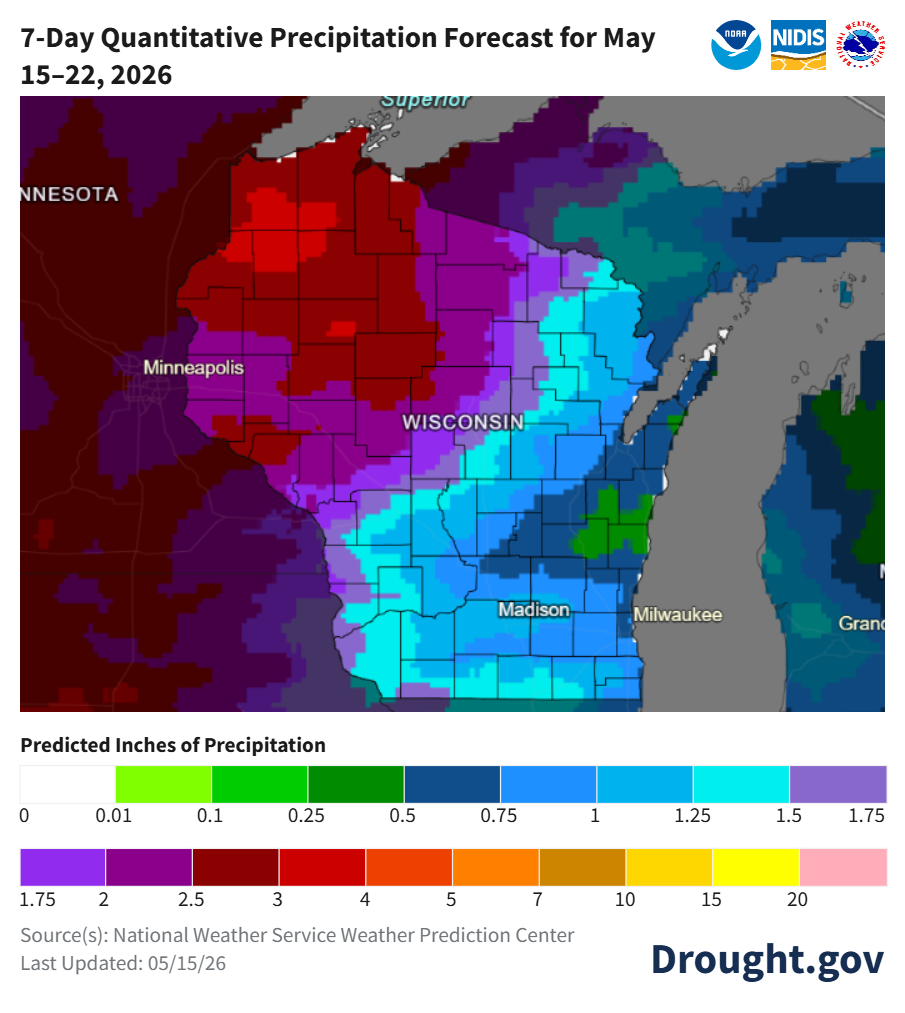
Image Description ↓
NOAA/NWS Weather Prediction Center quantitative precipitation forecast map for May 15–22, 2026, covering the upper Midwest. Wisconsin is the central focus. Madison is shaded cyan, indicating approximately 1.25–1.5 inches of predicted precipitation. Central and northern Wisconsin show lighter blues and purples (1–1.75 inches). The Minnesota–Wisconsin border region is shaded deep red to crimson, indicating 3–5+ inches. Milwaukee and the Lake Michigan shoreline appear in darker blue-greens (1–1.25 inches). A color scale at the bottom runs from white/gray (0 inches) through greens, blues, purples, reds, oranges, and yellows up to 20+ inches. Source: National Weather Service Weather Prediction Center, last updated 05/15/26.
- When? – Multiple chances for precipitation between Friday (5/15) and Tuesday (5/20).
- Where? – Highest chances in the northwest and north-central counties. Overall, most in the state will have a more active week compared to early May’s dryness.
- Check your local forecast for details on totals and timing.
- Average precip (1991-2020) for this week: 0.90”.
Freeze Potential
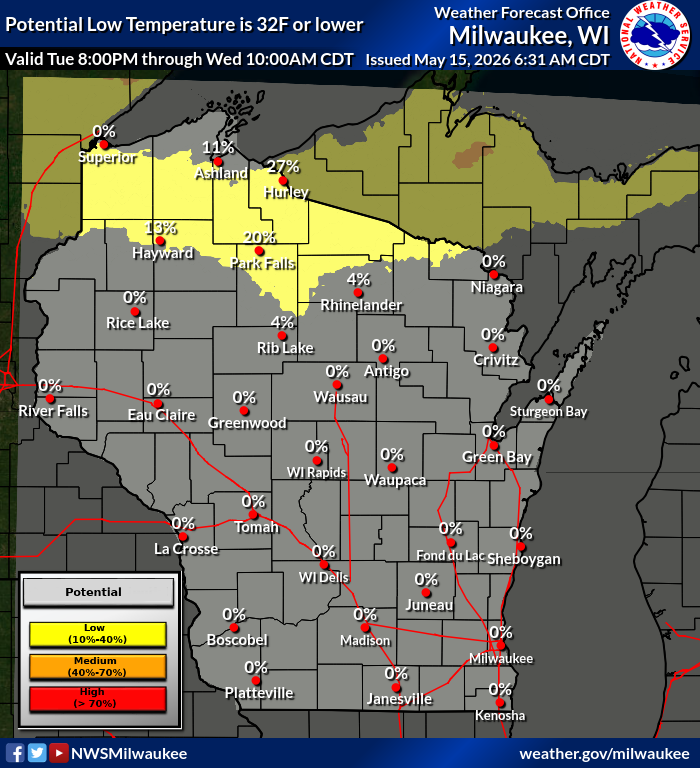
Image Description ↓
NWS Milwaukee frost map showing probability of temperatures reaching 32°F or below, valid Tuesday 8:00 PM through Wednesday 10:00 AM CDT. Northern Wisconsin counties are shaded yellow (low, 10–40% probability), with labeled chances including Hurley 27%, Park Falls 20%, Ashland 11%, Hayward 13%, Rib Lake and Rhinelander 4%. All other Wisconsin locations show 0% probability and are shaded gray. A red contour line marks the southern boundary of frost risk, running roughly through the north-central region. Legend indicates yellow = low (10–40%), orange = medium (40–70%), red = high (>70%). Issued 6:31 AM CDT May 15, 2026 by the Weather Forecast Office, Milwaukee, WI.
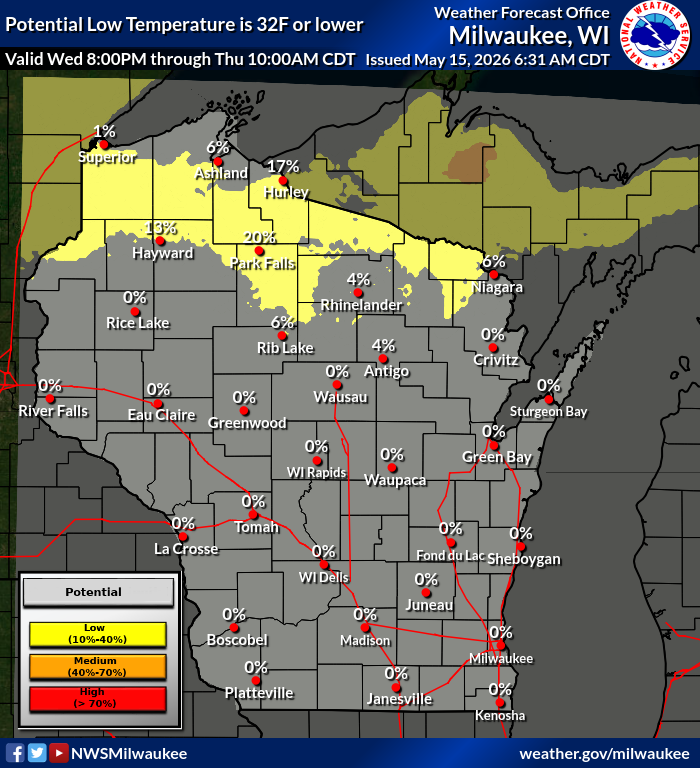
Image Description ↓
A Weather Forecast Office Milwaukee, WI frost probability map showing the potential for temperatures of 32°F or lower, valid Wednesday 8:00 PM through Thursday 10:00 AM CDT, issued May 15, 2026 at 6:31 AM CDT. The map uses a color-coded legend: yellow for low potential (10–40%), orange for medium (40–70%), and red for high (over 70%). Northern Wisconsin counties are shaded yellow, indicating low freeze potential. All remaining counties are gray, indicating 0% probability. Labeled city probabilities: Superior 1%, Ashland 6%, Hurley 17%, Hayward 13%, Park Falls 20%, Rhinelander 4%, Rib Lake 6%, Antigo 4%, Niagara 6%. All other labeled cities — including Madison, Milwaukee, Green Bay, Eau Claire, La Crosse, and Wausau — show 0%. A red contour line marks the southern boundary of freeze risk, running through north-central Wisconsin. Source: NWSMilwaukee / weather.gov/milwaukee.
- Probabilities of overnight lows at or below 32°F are low in far northern counties early next week. Be sure to check your local forecast.
- To view an interactive map of where conditions may be favorable for frost formation over the next seven days, check out the National Weather Service Frost & Freeze Decision Support Tool.
- To explore data on when the last spring freeze typically occurs in your county, please check out the interactive MRCC Freeze Date Tool.
8-14 Day Temperature and Precipitation Outlook
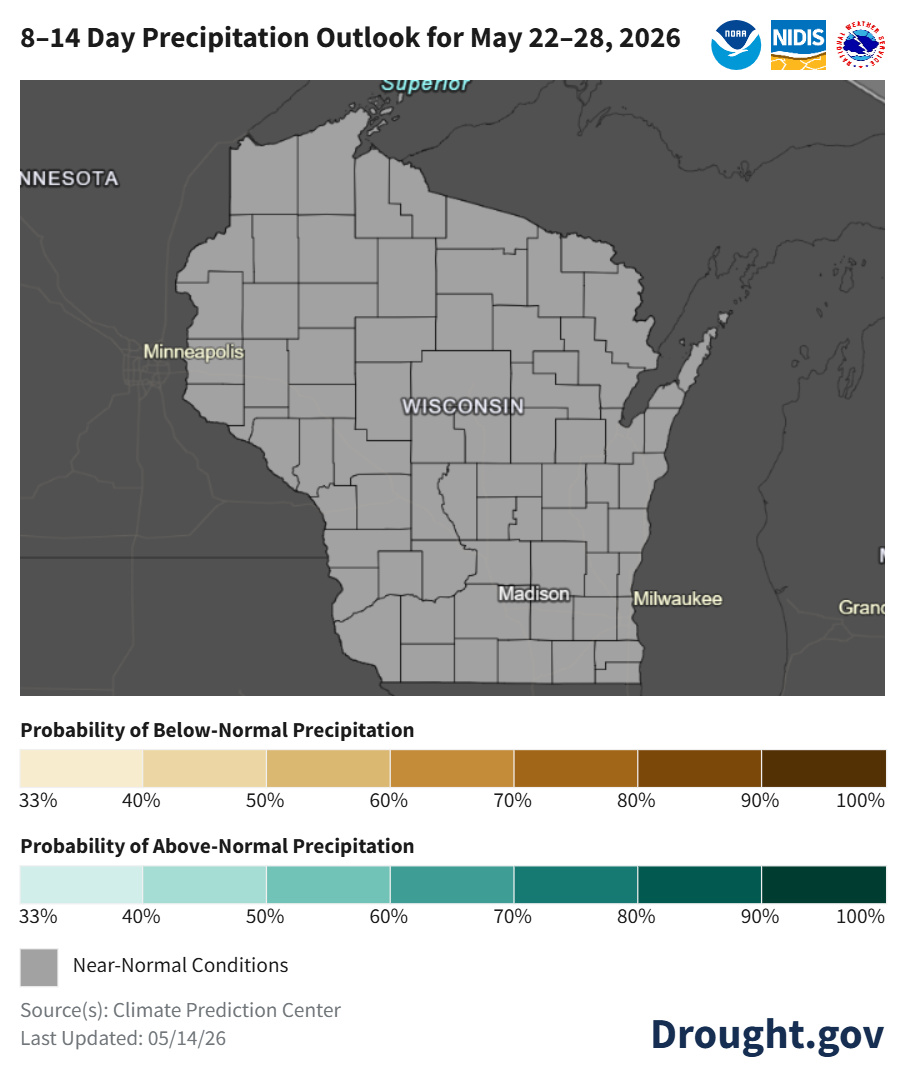
Image Description ↓
NOAA/NIDIS 8–14 Day Precipitation Outlook for Wisconsin, May 22–28, 2026. The entire state is shaded gray, indicating near-normal precipitation conditions are forecast statewide. No areas show elevated probability of below-normal (brown) or above-normal (teal) precipitation. Map sourced from the Climate Prediction Center, last updated 05/14/26.
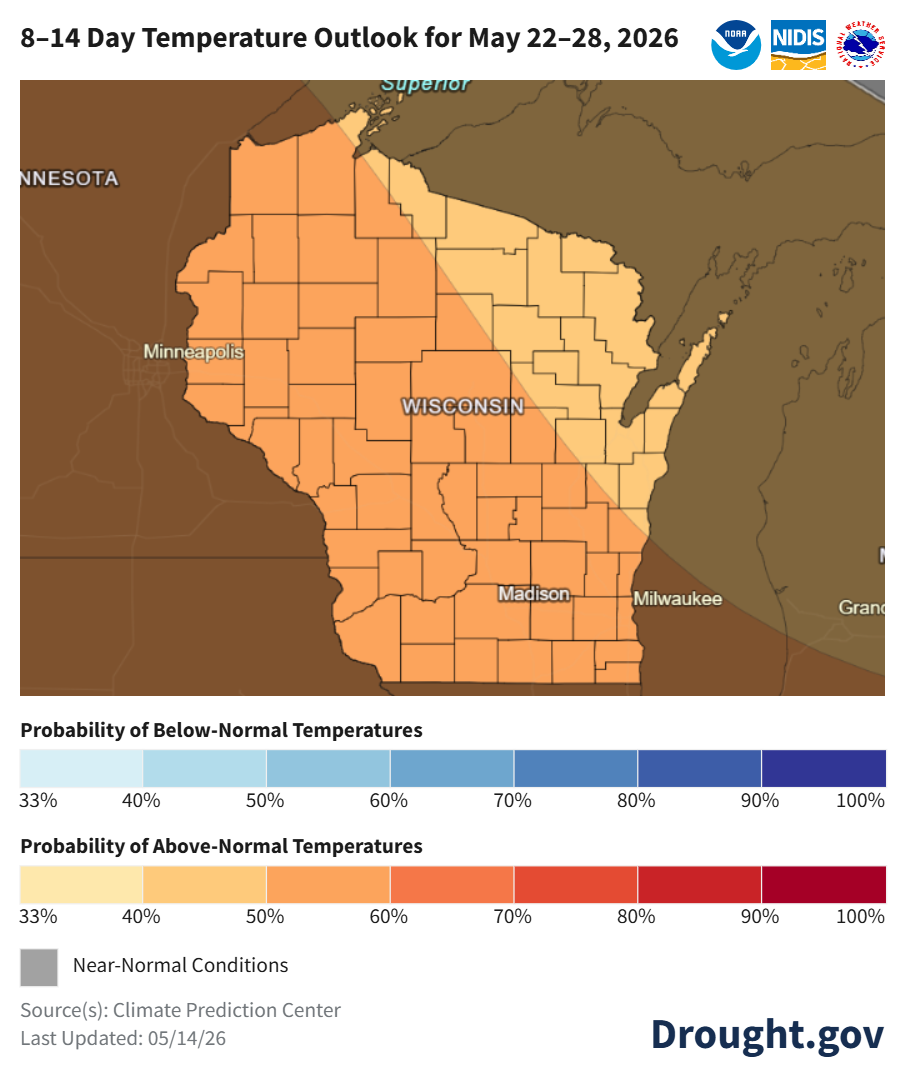
Image Description ↓
Map from NOAA’s Climate Prediction Center showing the 8–14 day temperature outlook for May 22–28, 2026, covering Wisconsin and surrounding states. Most of Wisconsin is shaded in medium orange, indicating a 50–60% probability of above-normal temperatures. The northeastern portion of the state, including the area near Green Bay and Lake Michigan, is shaded in light peach/cream, indicating a 33–40% probability of above-normal temperatures. Minnesota and areas outside Wisconsin are shaded dark brown, indicating higher probabilities (likely 70–80%+) of above-normal temperatures. Madison and Milwaukee fall within the medium orange zone. A color scale at the bottom shows blue shades for below-normal probability (33–100%) and orange-to-dark-red shades for above-normal probability (33–100%), with gray representing near-normal conditions. Source: Climate Prediction Center. Last updated 05/14/26.
- Late May: Temperatures are leaning towards near normal statewide (40-50% chance), with a weaker lean in the northeast (33-40% chance). Precipitation is leaning towards near normal statewide.
- Statewide normals (1991-2020) for May 22-28 are 58.7°F and 0.94”.
90 Day Temperature and Precipitation Outlook
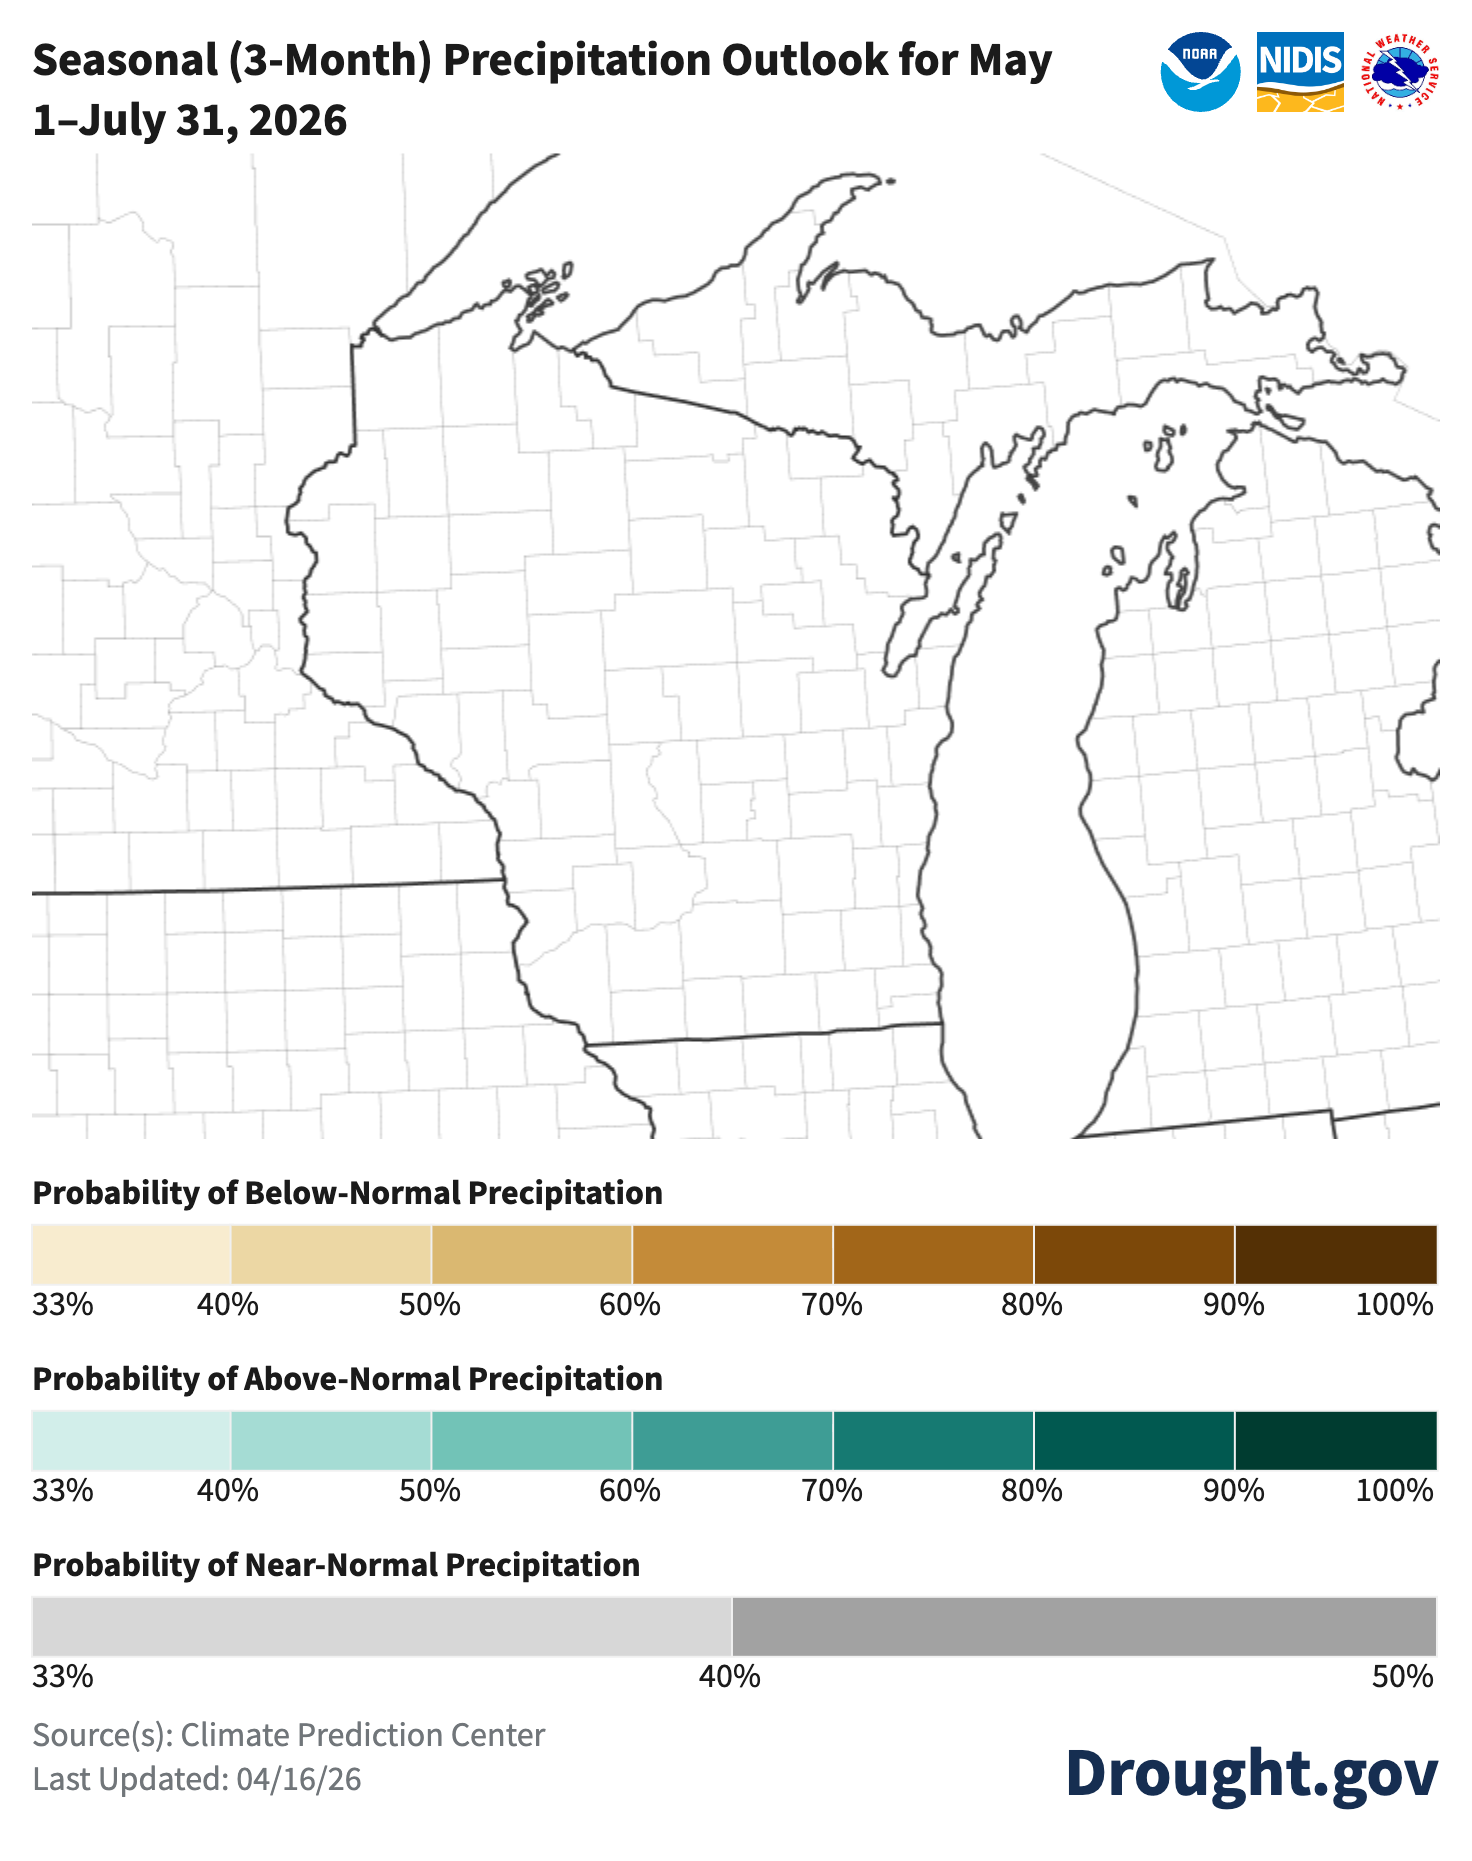
Image Description ↓
A choropleth map from NOAA’s Climate Prediction Center (via Drought.gov, last updated 04/16/26) showing the 3-month precipitation outlook for the Great Lakes region — including Wisconsin, Michigan, Illinois, Indiana, Ohio, and surrounding areas. The map contains no colored shading, indicating the entire region falls within the “near-normal” precipitation category (33–50% probability). Three color-scale legends are shown below the map: below-normal precipitation (tan to dark brown, 33–100%), above-normal precipitation (light teal to dark teal, 33–100%), and near-normal precipitation (light to medium gray, 33–50%). The absence of color on the map itself signals equal chances or a near-normal outlook with no strong signal favoring either wet or dry conditions.
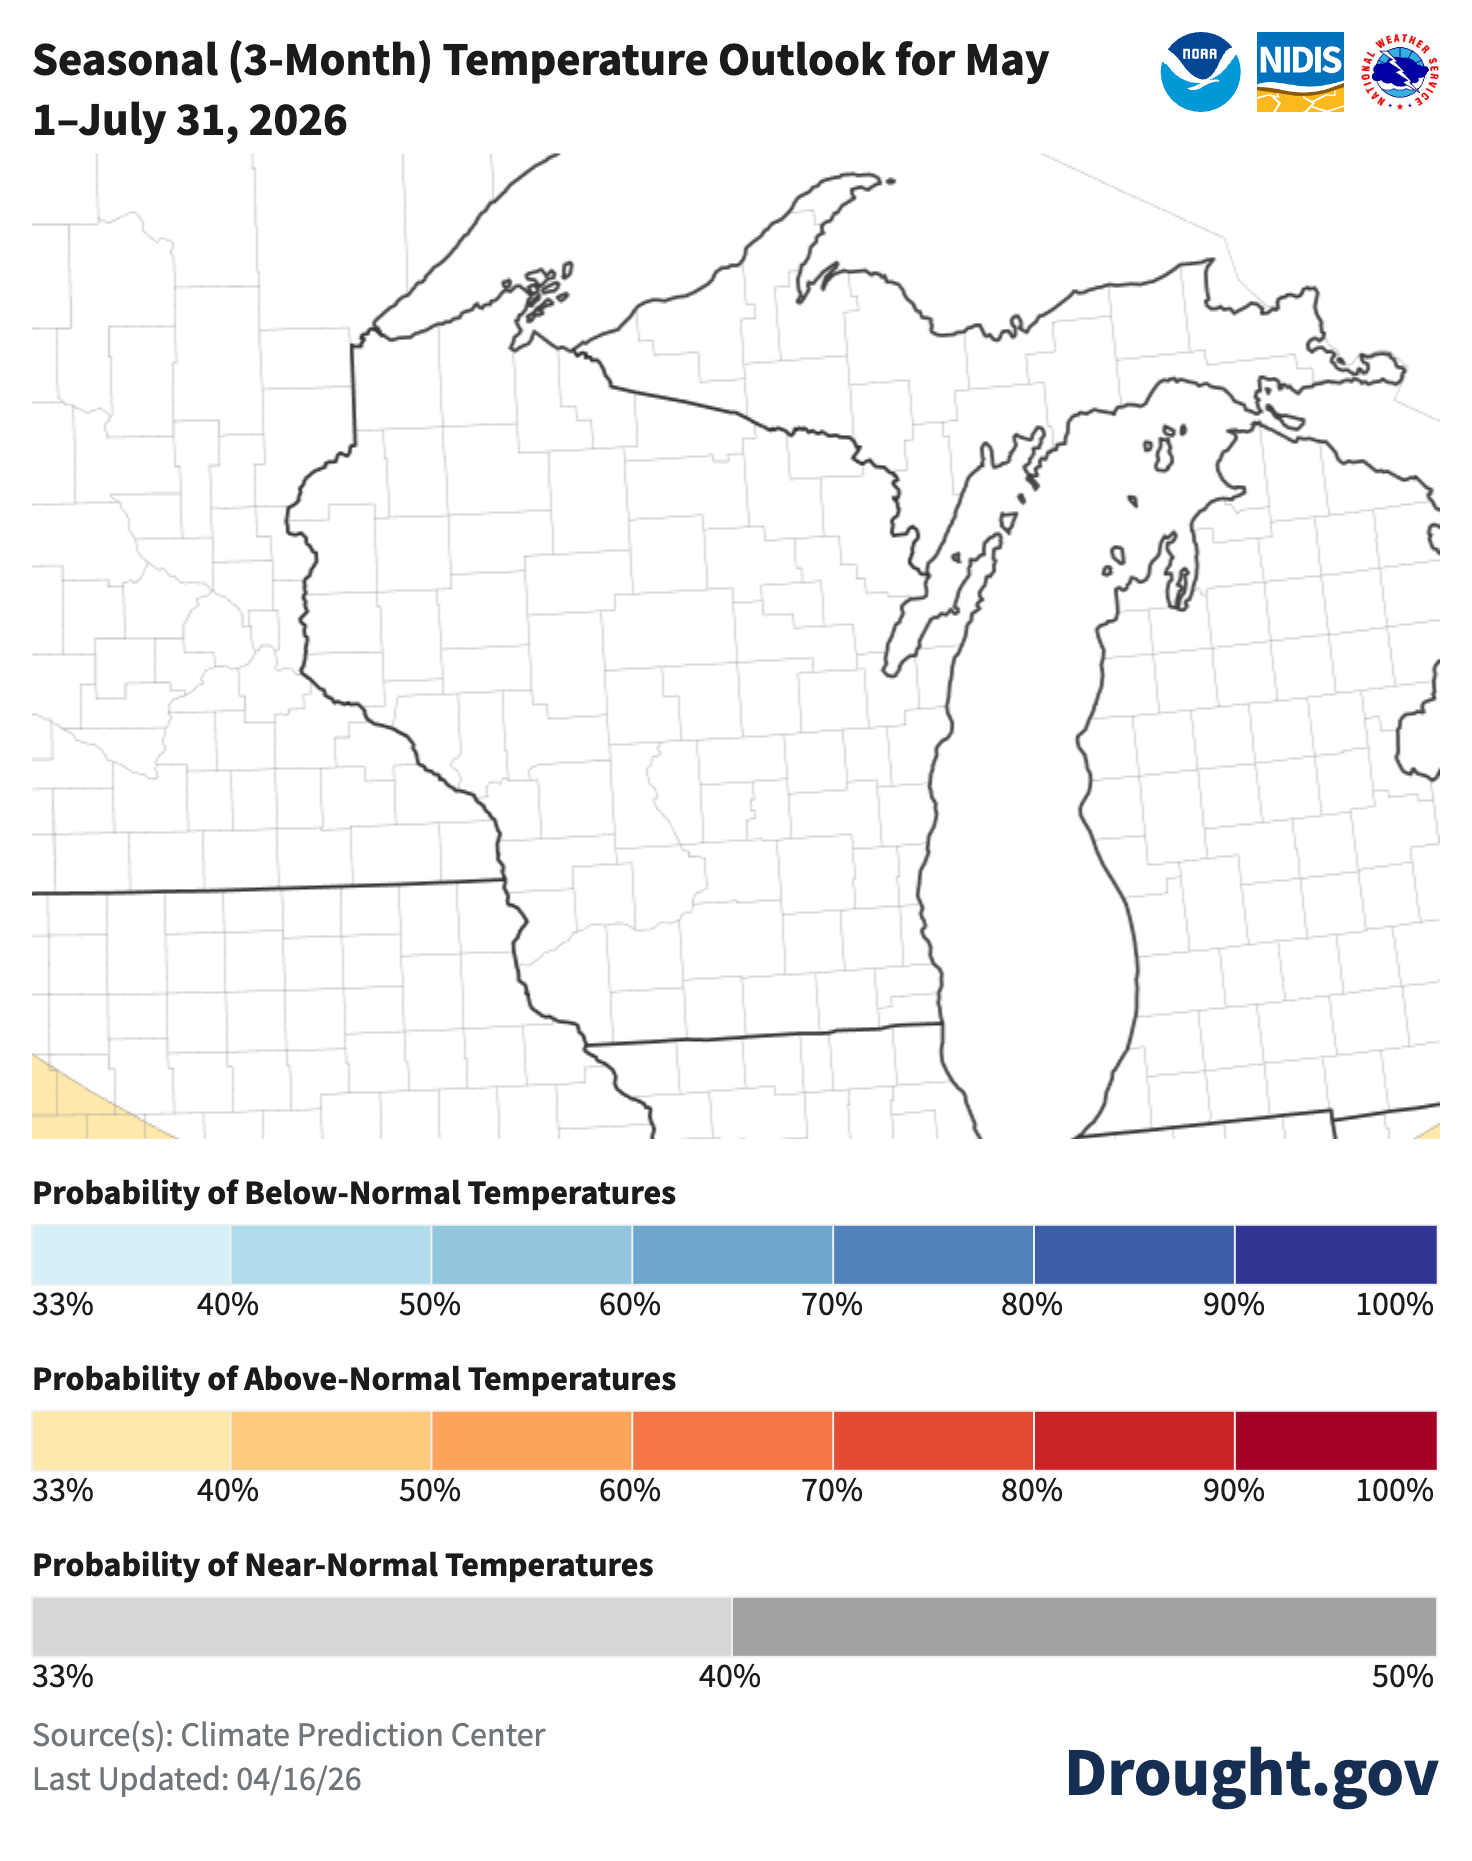
Image Description ↓
A choropleth map from NOAA’s Climate Prediction Center (via Drought.gov, last updated 04/16/26) covering the Great Lakes region including Wisconsin, Michigan, Illinois, Indiana, Ohio, and surrounding states. The map shows the 3-month seasonal temperature outlook for May 1 through July 31, 2026. The majority of the mapped area is unshaded (white), indicating equal chances of below-, near-, or above-normal temperatures. Small areas of light orange/tan shading appear in the far southwestern and southeastern corners of the map, suggesting a slight probability (around 33–40%) of above-normal temperatures in those regions. Three color scale legends are shown below the map: blue tones (33–100%) for below-normal probability, orange-to-red tones (33–100%) for above-normal probability, and gray tones (33–50%) for near-normal probability.
- May-July: Uncertainty for temperatures and precipitation statewide with equal chances for above-, near-, or below-normal conditions.
- Statewide normals (1991-2020) for May-July are 63.2°F and 12.67”.
User Survey
Are you a regular user of the Ag Weather Outlook for Wisconsin (AgWOW)? Or maybe you are viewing these slides for the first time this week? Either way, we want to hear your feedback on this resource! Please take a few minutes and fill out this survey. Your feedback will help us better serve your ag-weather data needs through AgWOW.
If you have any trouble accessing or filling out the survey, please email Josh Bendorf at jbendorf@wisc.edu. Thank you!