

Weather and climate conditions this week in Wisconsin
Here are this week’s take-home points about the weather. As a reminder, AgWOW reports will be published weekly throughout the growing season. Scroll down for the full report.
Additionally, we’re collecting user feedback. Regardless of whether it’s your first time here or if you are a regular user, we’d love to hear from you!
Key Points
Recent Conditions
- Temperatures were 4-8°F above normal across most of the state, with the eastern side of the state being the most above normal. This included some days with heat indices over 100°F.
- Rainfall totals were highest in southwest counties last week, with totals of 3-6” common. The driest regions last week were the north central and far southeast counties.
Impact
- Most Wisconet research farm stations showed an increase in 4-inch moisture following a relatively wet week for most sites. North central stations saw decreased moisture following a dry week.
- Satellite-based soil moisture estimates indicate southwest Wisconsin has higher-than-normal soil moisture in the top 1 meter. Drier-than-normal conditions remain in place across the northwest, north central, and east central regions.
- D1 drought was eliminated in the La Crosse area, but the region of D1 south of Madison persists.
- Soybean blooming is well underway in Wisconsin fields, with the winter wheat and oat crops coloring. There were no major shifts in crop or pasture conditions from last week’s report.
Outlook
- There are minimal chances for rain over the next seven days, with the best chances for rain on Thursday (7/9) and Saturday (7/11).
- The outlook for Mid-to-Late July indicates statewide leans towards above normal temperatures and below normal precipitation.
- The outlook for July indicates no strong leans in the temperature or precipitation probabilities.
- Late summer through early fall (July-Sept) may be cooler-than-normal in southern and central counties, with precipitation leaning towards below normal for most of the state.
Agronomic, Fruit and Vegetable Considerations
Field Conditions
- Thunderstorms have brought hail to areas of the state. Read more about hail damage and crop impacts here.
- Pockets of heavy rainfall have flooded fields. Read about What Happens to your Crops in Flooded Fields.
Forage Management
- Second crop is well underway in Southern WI. Consider using a PEAQ (Predictive Equations for Alfalfa Quality) stick to estimate relative feed value as you decide when to make each cut.
- Scout for potato leafhopper in alfalfa fields.
Pest Management
- Scout fields to note what weed species are emerging or have escaped herbicide application.
- Early planted soybeans are reaching reproductive stages. Revisit POST herbicide labels for timing considerations. Glufosinate must be applied before the R1 stage and Enlist One can be applied through the R1 stage. See recommendations for POST herbicide application in soybean during this warm weather stretch.
- Western bean cutworm trapping has begun for the season. Check DATCP trap catches.
- Japanese beetles are starting to emerge.
- Corn rootworm larvae are feeding on corn roots now. Conduct a root dig to assess damage.
- Continue to scout corn and soybean fields for disease. Particularly, tar spot in corn and white mold in soybean to stay ahead of any disease pressure. Learn more about using Disease Forecasting Tools.
- Red crown rot was confirmed in WI last year. Know what to scout for in your soybean fields this year.
Manure Applications
- Reminder of Wisconsin’s NR 151 Runoff Rules with the timing of manure spreading and current runoff levels. Check DATCP Runoff Risk Advisory Forecast.
Small Grains
- Small grain harvest will begin soon in Southern WI. Review harvest, storage and nutrient removal topics.
- As you harvest, remember the importance of combine cleaning.
Fruit Considerations- General
- Make sure newly planted fruit crops are getting enough water in this heat. Without irrigation, growth can stall during establishment. Irrigation frequency depends on soil type—sandy soils need water daily or every two days, while heavier soils like silt or clay can be watered less often by applying several days’ worth of water at once.
- Wisconsin fruit growers can reference the Midwest Fruit Pest Management Guide for a list of registered products and recommended best practices. View the MFPMG Online.
Fruit Considerations- Disease
- Apple and grape growers can reference the NEWA weather station network to monitor for disease infection periods in their area. Check out your nearest weather station: NEWA Weather Station Network (Cornell).
- Downy mildew foliar symptoms (“oil-stains”) have been observed in West Madison. Scout for pale-yellow lesions on the tops of leaves and white downy growth on the underside of leaves.
Fruit Considerations- Insects
- Apple growers should continue monitoring degree-day (base 50℉) accumulation for Codling moth. Second generation larvae will typically emerge at ~1250 degree-days (base 50℉) from the biofix date. Ensure to refresh traps/lures and continue monitoring weekly.
- Japanese beetle have been observed in Southern WI. Review best monitoring and management practices here: Japanese beetle.
- Apple maggot was captured in southern WI. Growers can use red sphere traps to monitor populations and establish a biofix date.
- Woolly apple aphid has been observed in southern WI. Check for white “cottony” appearing tufts where leaf petioles meet branches.
- Check out the WI DATCP Orchard Insect Pest Bulletin for more information on current insect trap captures across the state.
- Overview of grape insect/mite monitoring and management: Grape Insects and Mite Pests, 2024 Field Season (Cornell, 2024).
Vegetable Considerations- Disease
- Early detection of alternaria leaf blight of cucurbits will help you control this disease before major damage occurs. Symptoms start as small, water-soaked lesions that can develop concentric rings. Alternaria leaf blight can sometimes be confused with anthracnose and angular leaf spot which thrive in similar conditions. Angular leaf spot can be distinguished by angular lesions often confined by veins and the whitish liquid that forms on the underside of leaves when wet and forms a crust when dry. The most distinguishing symptom of Anthracnose is the dark, sunken lesions on fruit that have salmon-colored spores under damp conditions.
- Humid conditions are conducive to cucurbit gummy stem blight and black rot. They are both caused by the fungus Didymella bryoniae. Gummy stem blight is the term for stem and leaf infections while black rot refers to the fruit infection. Leaf symptoms include brown edges that may develop yellow halos and become dry and crack over time. Stem lesions typically occur close the crown of the plant. Lesions are tan and as the disease progresses, they crack open and leak a think amber colored fluid. Fruit lesions appear water-soaked and turn black as they age.
- Bacterial spot symptoms can occur on leaves, stems and fruit. Lesions on tomato leaves are brown, circular spots with yellow halos. The center of the lesion often falls out leaving a hole. On pepper leaves, the lesions do not have a yellow halo and the centers do not fall out. Symptoms on fruit are brown raised spots. On tomato fruit they often have a waxy white halo. Management options include planting resistant varieties, avoiding overhead irrigation if possible, staying out of wet fields, working in residue at the end of the season and pesticides.
- It can be very difficult to distinguish bacterial spot from bacterial speck although bacterial speck only occurs on tomatoes while bacterial spot can infect both tomatoes and peppers. Management for bacterial speck is similar to management for bacterial spot.
- Septoria leaf spot is fungal disease that causes tan to grey lesions with dark spots on tomato plants. They can distinguished from bacterial spot or speck by the presence of dark, raised fungal bodies inside the lesion. Preventative applications of fungicides containing copper or chlorothalonil can be useful in areas with chronic Septoria infections.
- Preventative fungicide applications for late blight of tomato and potato are recommended for earlier planted potatoes around Spring Green, Hancock, Grand Marsh and southward.
- Preventative applications for early blight in potato are recommended for fields from Plover southward. Preventative measures allow for the most successful management.
- As potato canopies close, about 70-100% bloom, conditions favorable for white mold development increase. Fungicides are the primary control measure. The first application should occur when plants reach bloom stage or the canopy closes. More information on fungicide options can be found here.
- There are no confirmed cases of sweet corn tar spot in WI; however, it has been confirmed at low levels in states south of WI including Indiana and Iowa. Recent weather conditions are conducive for disease development so scout crops regularly to look for symptoms. Early symptoms are small raised black spots on both the upper and lower leaf surfaces that typically start in the lower canopy before spreading to newer growth. Management options include managing residue to reduce overwintering, growing cultivars that are less susceptible, and fungicides. Use the crop risk assessment tool to determine when to time protective sprays.
Vegetable Considerations- Insects
- Start scouting for potato colonizing aphids (green peach aphids and potato aphids) as they have been detected in central WI. It is particularly important to be proactive about insecticide programs to limit the establishment of these early populations once their presence has been confirmed in your fields. Scouting and insecticide recommendations.
- Japanese beetles are beginning to emerge. Pheromone traps show mixed control as often the traps attract more beetles to your area. If you do choose to use a trap, make sure it is far away from your crops. Biological controls options are available for grubs although success is inconsistent. Information on chemical control can be found here.
- Diamondback moths are completing their first generation in central WI. There are typically 3 to 5 generations a year. Continue scouting for eggs and larvae through the season. Management options can be found here.
- Start scouting for squash bugs as eggs laying starts around late June or early July. Orange to brown colored eggs are laid in clusters on the underside of leaves. Chemical control is most effective when applied at egg hatch, so early detection is key for the best management. In small plantings, crush eggs and trap adults by placing newspaper or cardboard on the soil surface. At night, they will congregate underneath and can be killed in the morning.
- The second generation of adult Colorado potato beetles are now active in southern and central WI. If control of the 1st generation was successful, the 2nd generation population may be low or slow to appear. If this is the case, new insecticide applications should be delayed until new defoliation reaches 3-5%. In depth management info
- Western bean cutworms are being detected as far north as Wausau. View trap catches for your area on the DATCP trap network map. Scout for egg masses on the upper surfaces of new leaves and unfurled leaves above and below the ear zone. Management options
Dive deeper into each report section by clicking a topic below.
Precipitation Trends
7 Day Precipitation
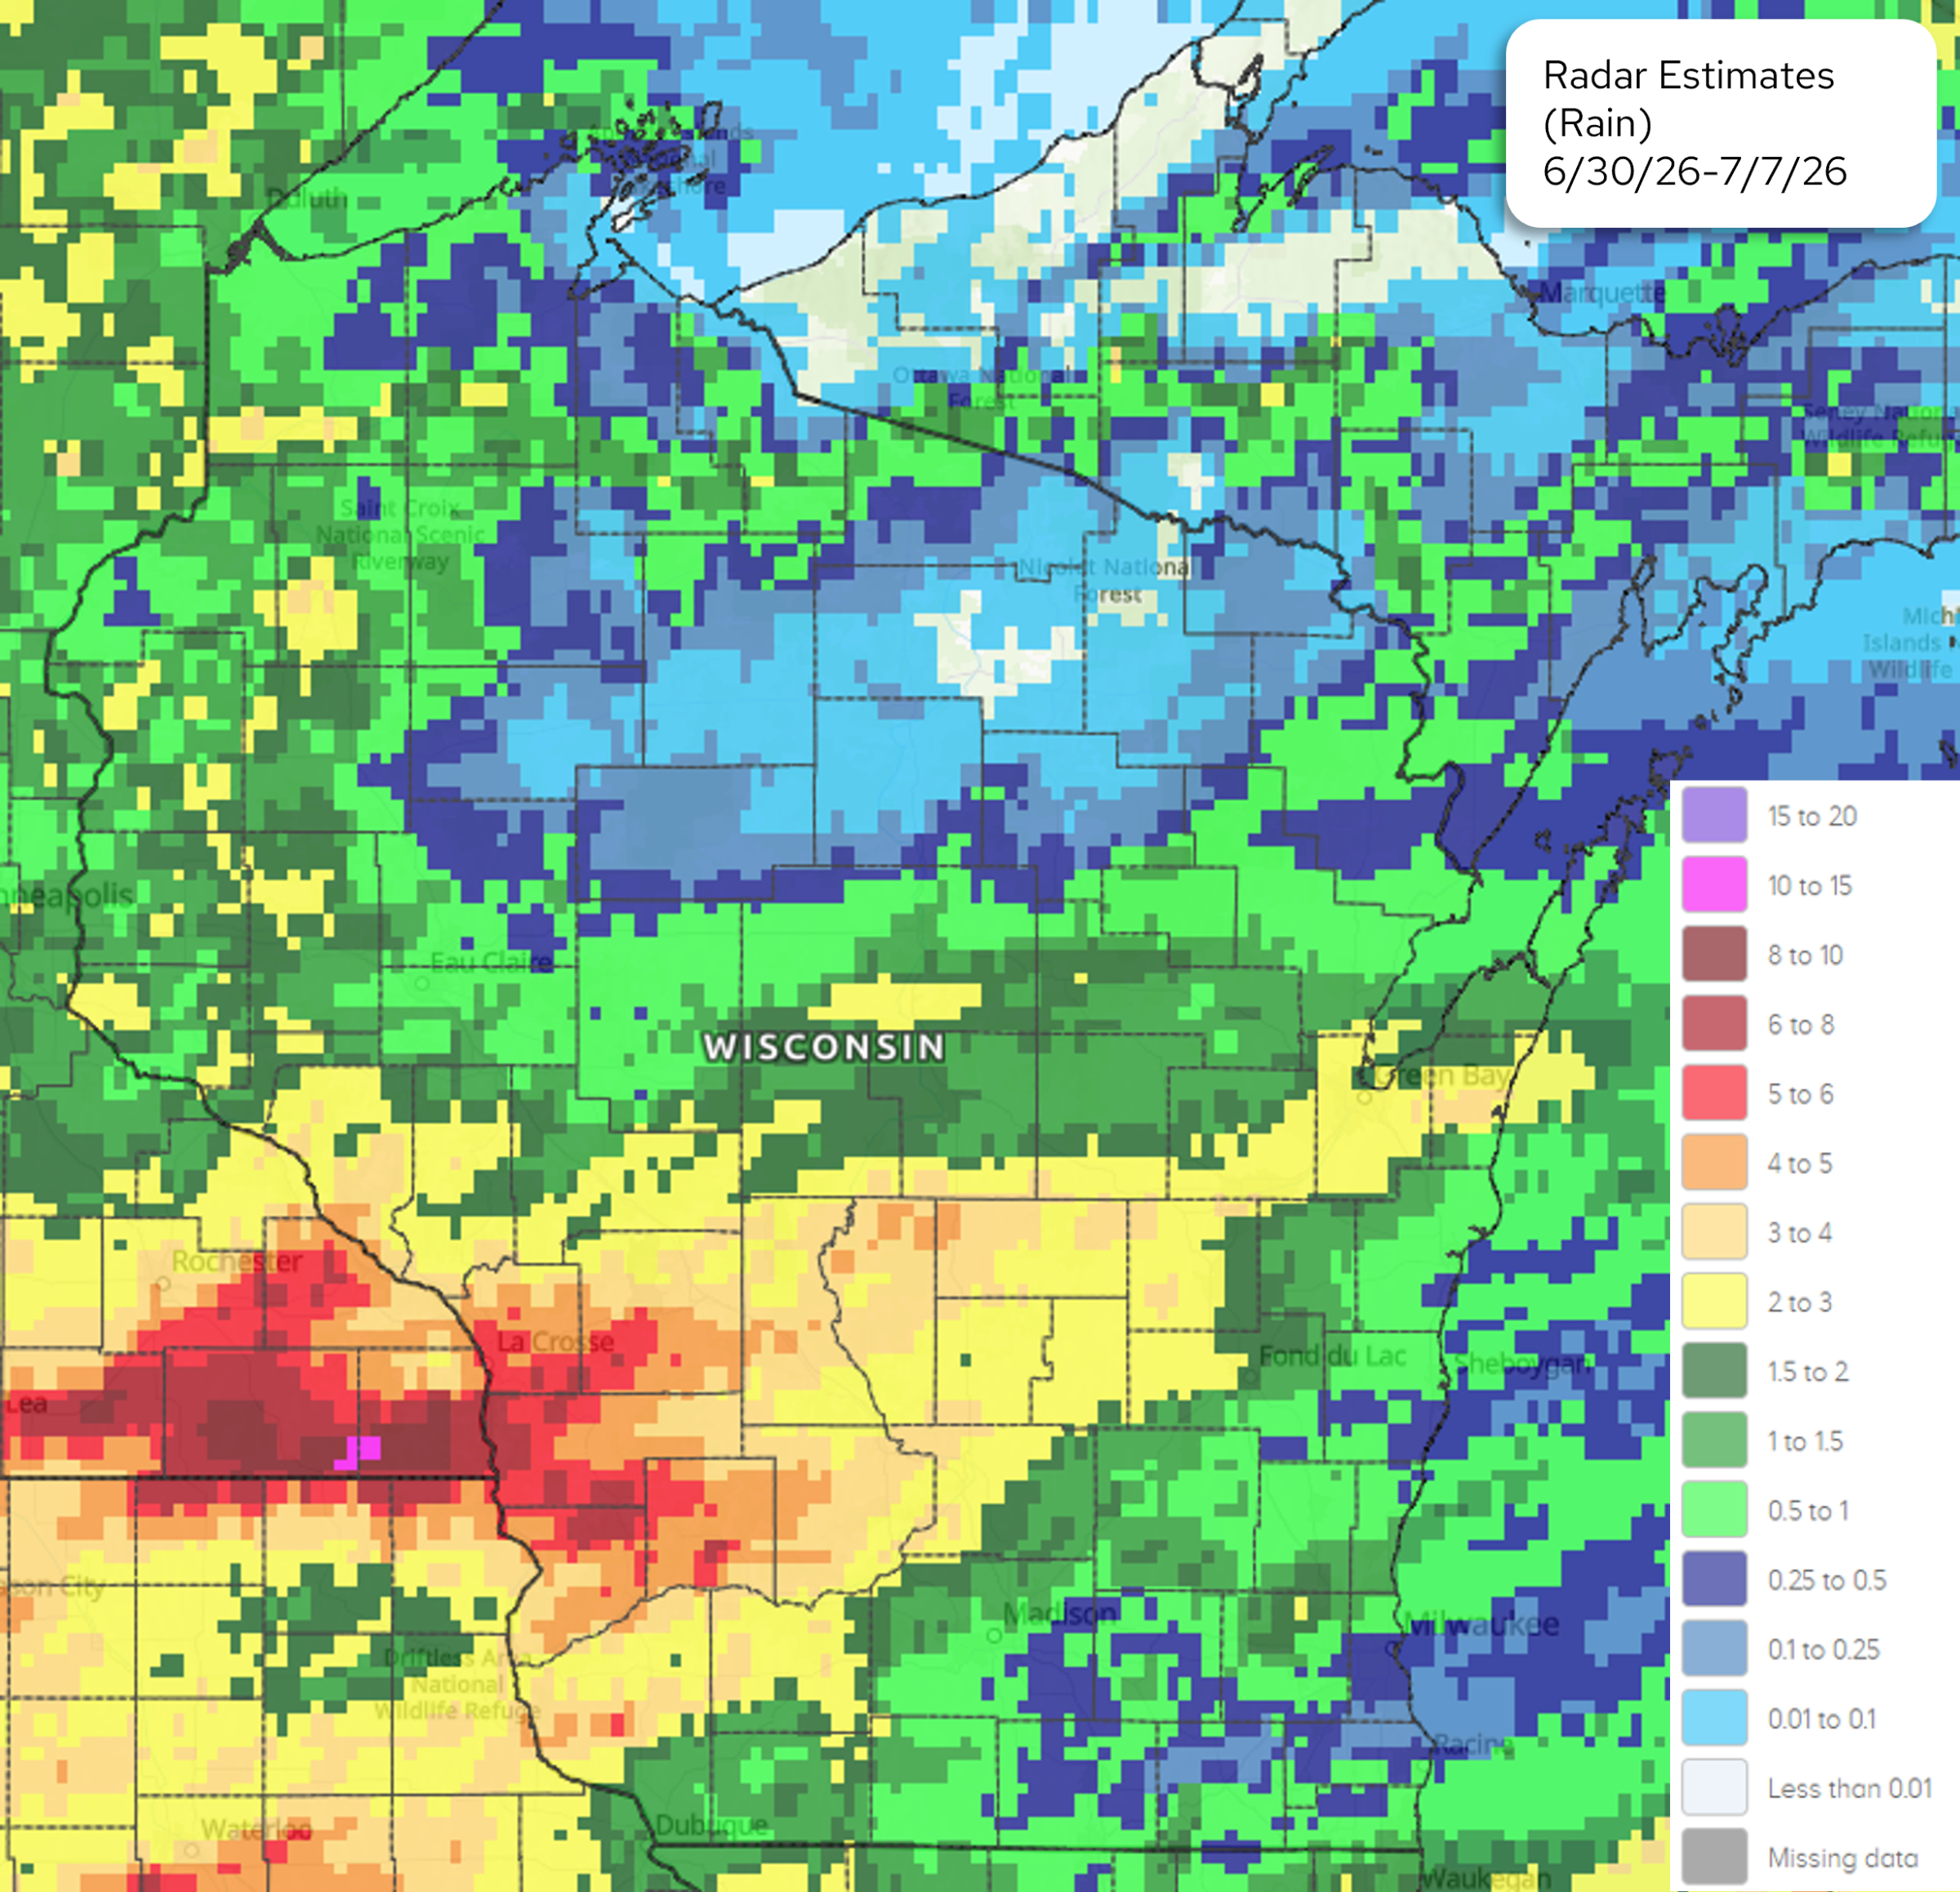
Image Description ↓
Radar-estimated rainfall totals for the Upper Midwest, June 30–July 7, 2026. Heaviest rain fell over southeastern Minnesota and southwestern Wisconsin near La Crosse and Rochester, with widespread 5–8 inches and isolated pockets of 10–15 inches. Central and eastern Wisconsin, including the Madison and Fond du Lac areas, received roughly 1.5–3 inches. Northern Wisconsin and the Lake Superior shoreline saw lighter totals, generally under 1 inch, with some areas near Marquette, Michigan receiving minimal rainfall. Color scale ranges from less than 0.01 inches (light gray) to 15–20 inches (purple).
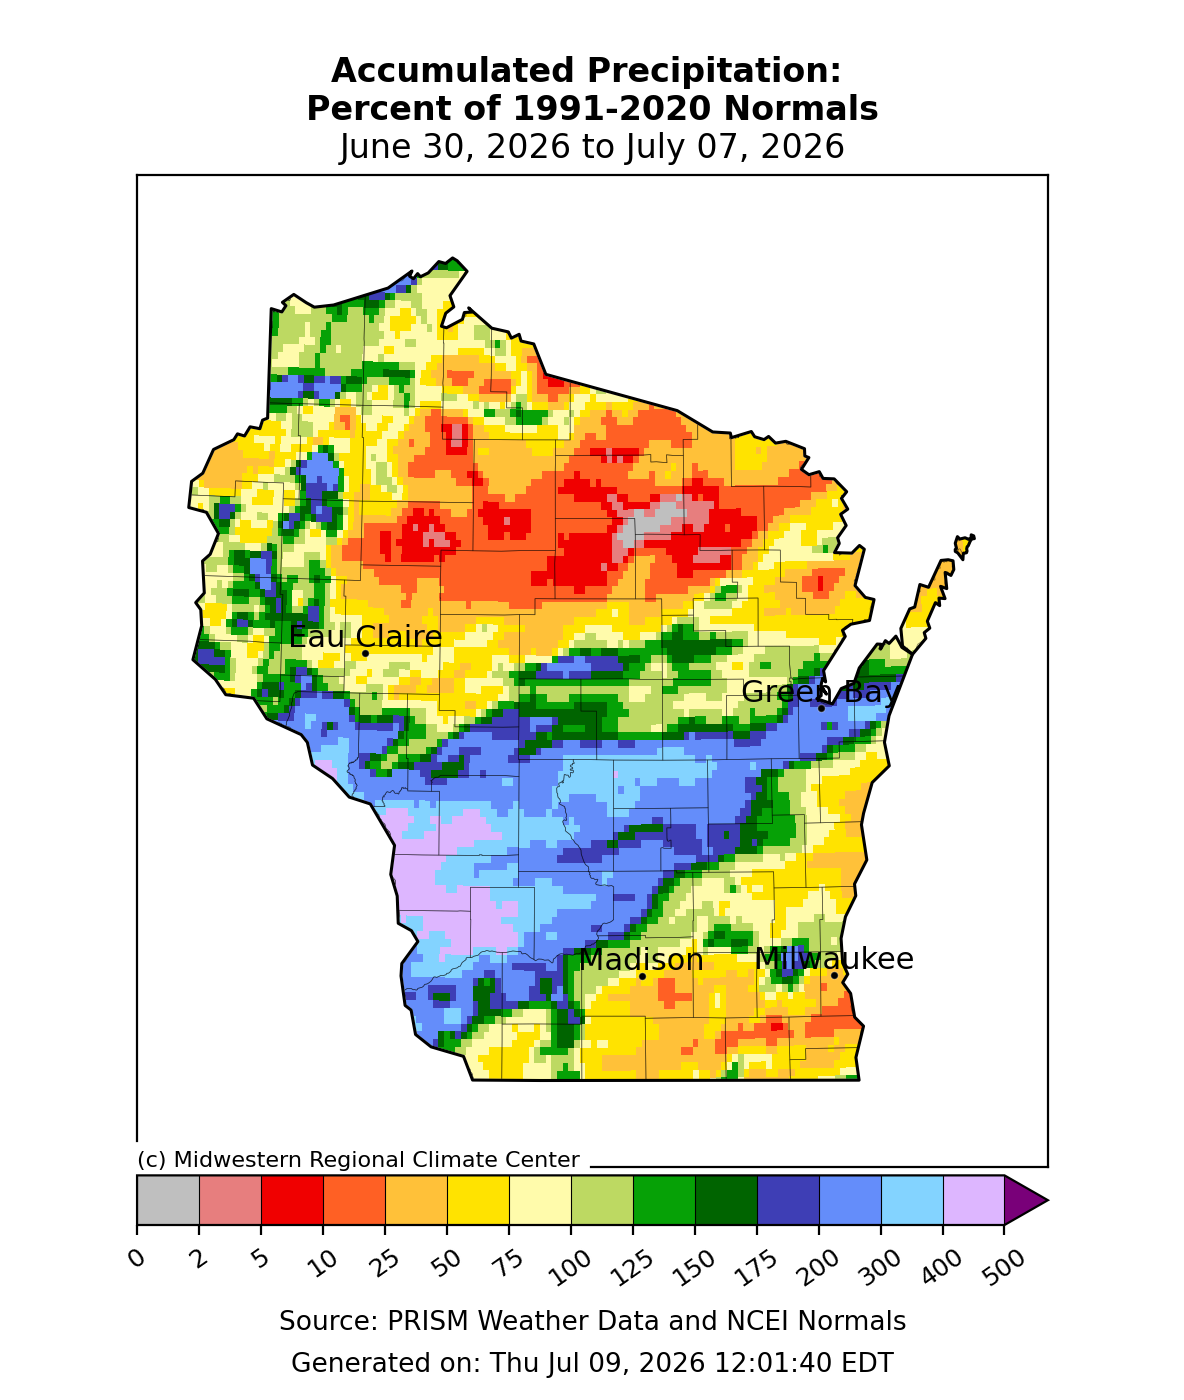
Image Description ↓
Choropleth map titled “Accumulated Precipitation: Percent of 1991-2020 Normals, June 30, 2026 to July 07, 2026,” sourced from PRISM Weather Data and NCEI Normals, generated by the Midwestern Regional Climate Center on July 9, 2026. A color scale from gray/red (0-10%, driest) through yellow (100%, normal) to blue/purple (300-500%, wettest) is applied across the state. North-central Wisconsin, spanning the area north of Eau Claire and inland from Green Bay, shows extensive red and orange shading indicating 5-25% of normal precipitation, the driest region on the map. A band running roughly from southwest to east-central Wisconsin, including areas near Madison, shows blue and light-blue shading indicating 175-300% of normal precipitation, with a small purple patch southwest of Madison exceeding 400%. Eau Claire sits near the boundary between dry (north) and wet (south) zones. Green Bay is near moderately dry conditions to its north with wetter conditions to its south. Madison lies within the wet band. Milwaukee, on the southeastern edge, shows near-normal to moderately dry conditions (50-100%).
- Rainfall totals were highest in southwest counties last week, with totals of 3-6” common. Localized areas saw over 6” (300-500% of normal).
- 1-3” was common across central counties, as well as in parts of the northwest.
- The driest regions last week were the north central and far southeast counties (<1”).
- Highest Wisconet station total from last week: 6.97” (Soldiers Grove, Crawford County). Totals in northern Crawford County were as high as 500% of normal.
30 Day Precipitation Total and Departure from Normals
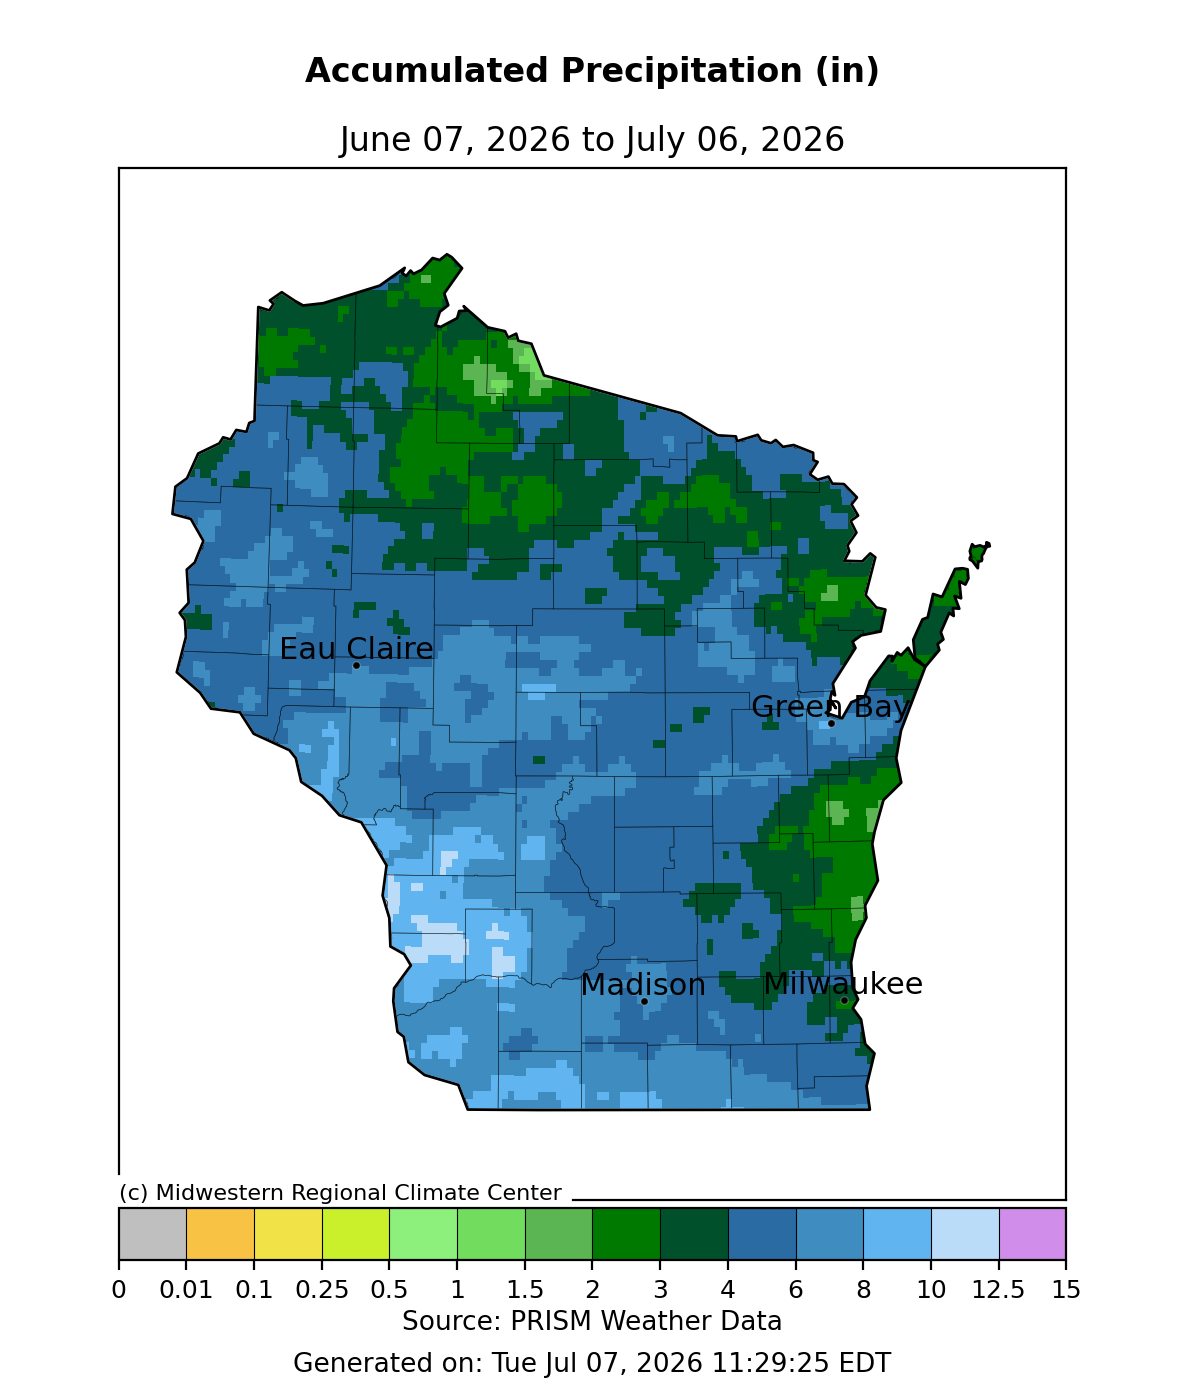
Image Description ↓
Choropleth map titled “Accumulated Precipitation (in), June 07, 2026 to July 06, 2026,” sourced from PRISM Weather Data via the Midwestern Regional Climate Center, generated Tue Jul 07, 2026 11:29:25 EDT. Most of Wisconsin shows 4–8 inches of rainfall (blue shades), with lighter blue areas of 8–10 inches in south-central Wisconsin near Madison. Dark green patches indicating 3–6 inches appear scattered across the northern counties, along the Lake Michigan shoreline near Green Bay and Milwaukee, and in the Door Peninsula. City markers are labeled for Eau Claire, Green Bay, Madison, and Milwaukee. A color-scale legend at the bottom ranges from 0 to 15 inches, using gray, orange, yellow, green, dark green, blue, light blue, and purple shading.
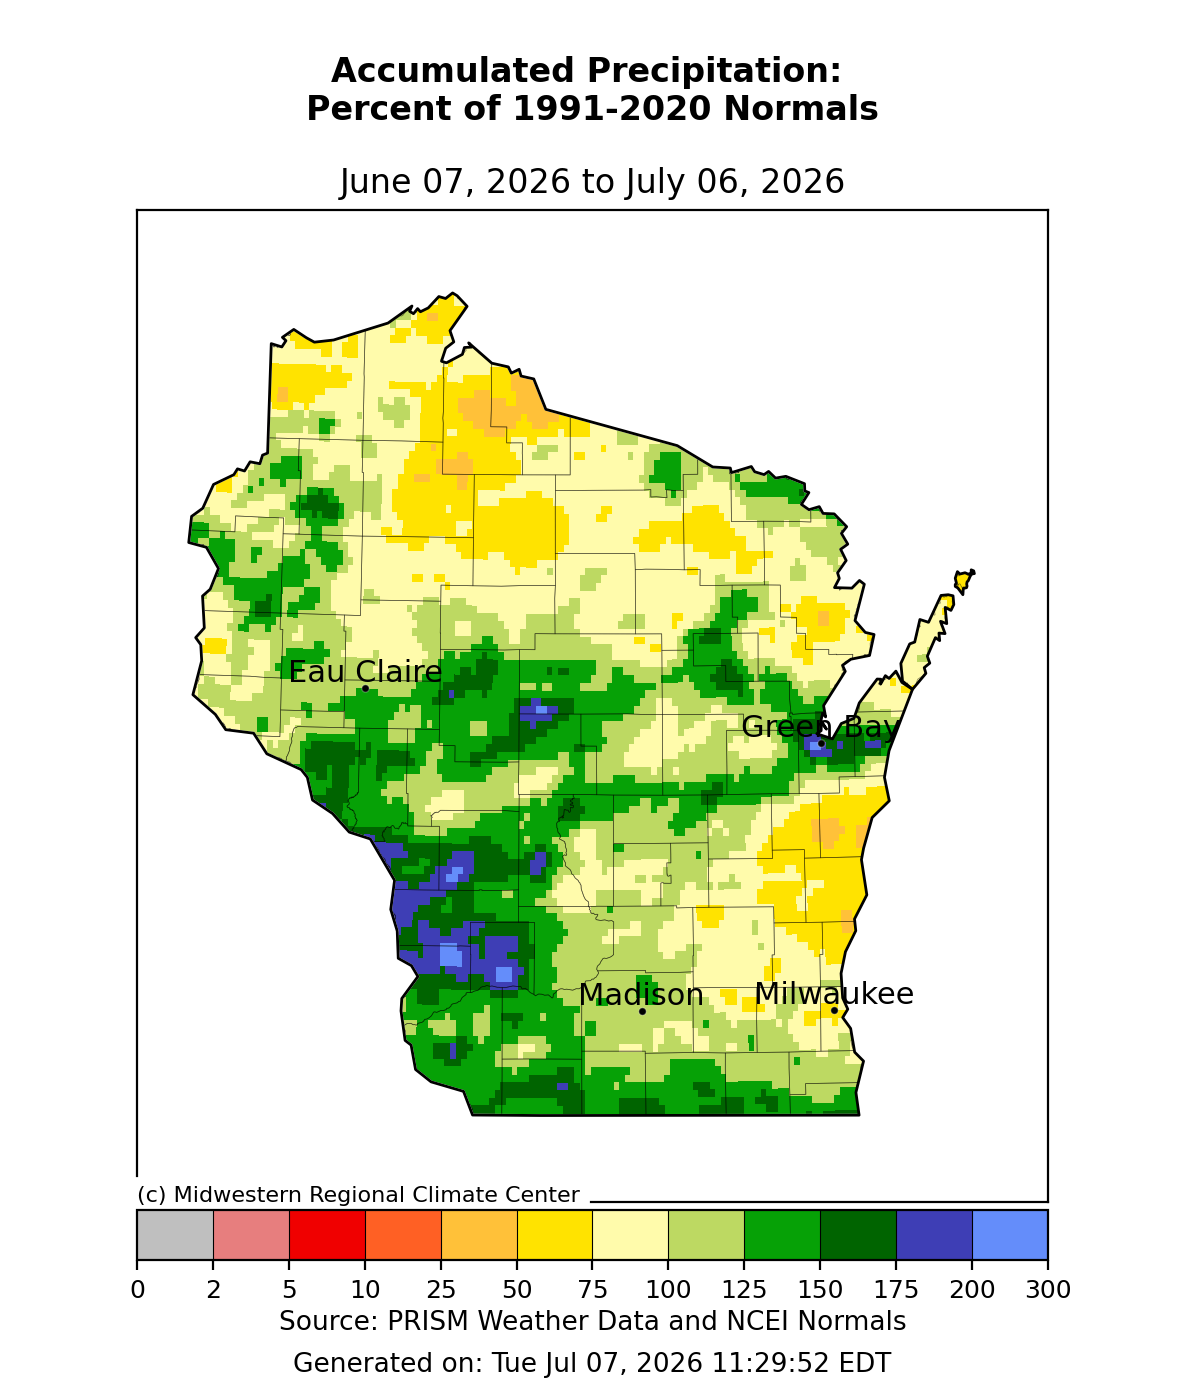
Image Description ↓
Choropleth map of Wisconsin titled “Accumulated Precipitation: Percent of 1991-2020 Normals,” dated June 07, 2026 to July 06, 2026, from the Midwestern Regional Climate Center. A color scale ranges from gray (0%) and red (2-10%, driest) through orange and yellow (25-75%), pale yellow (100%, near normal), light and dark green (125-175%), to dark and light blue (200-300%, wettest). The map shows a broad area of yellow/orange (below-normal precipitation, roughly 50-75%) across north-central Wisconsin near Eau Claire. Southern and southwestern Wisconsin, including areas near Madison, show green and dark blue shading indicating well above-normal precipitation (125% to over 200%), with a cluster of blue “wettest” spots southwest of Madison. Green patches (above-normal precipitation) also appear near Green Bay and scattered through central and eastern Wisconsin, while pockets of yellow (drier) appear east of Green Bay and near Milwaukee. City markers show Eau Claire, Green Bay, Madison, and Milwaukee. Source: PRISM Weather Data and NCEI Normals. Generated Tue Jul 07, 2026, 11:29:52 EDT.
- Most of Wisconsin saw at least 6” of rainfall over the past 30 days. Totals in the southwest corner were highest (over 10” locally).
- Totals across southwest, west central, and central counties were at or above normal.
- In the far north and east central counties, totals were generally lower (2-4”; ≤75% of normal).
90 Day Precipitation Total and Percent of Normals
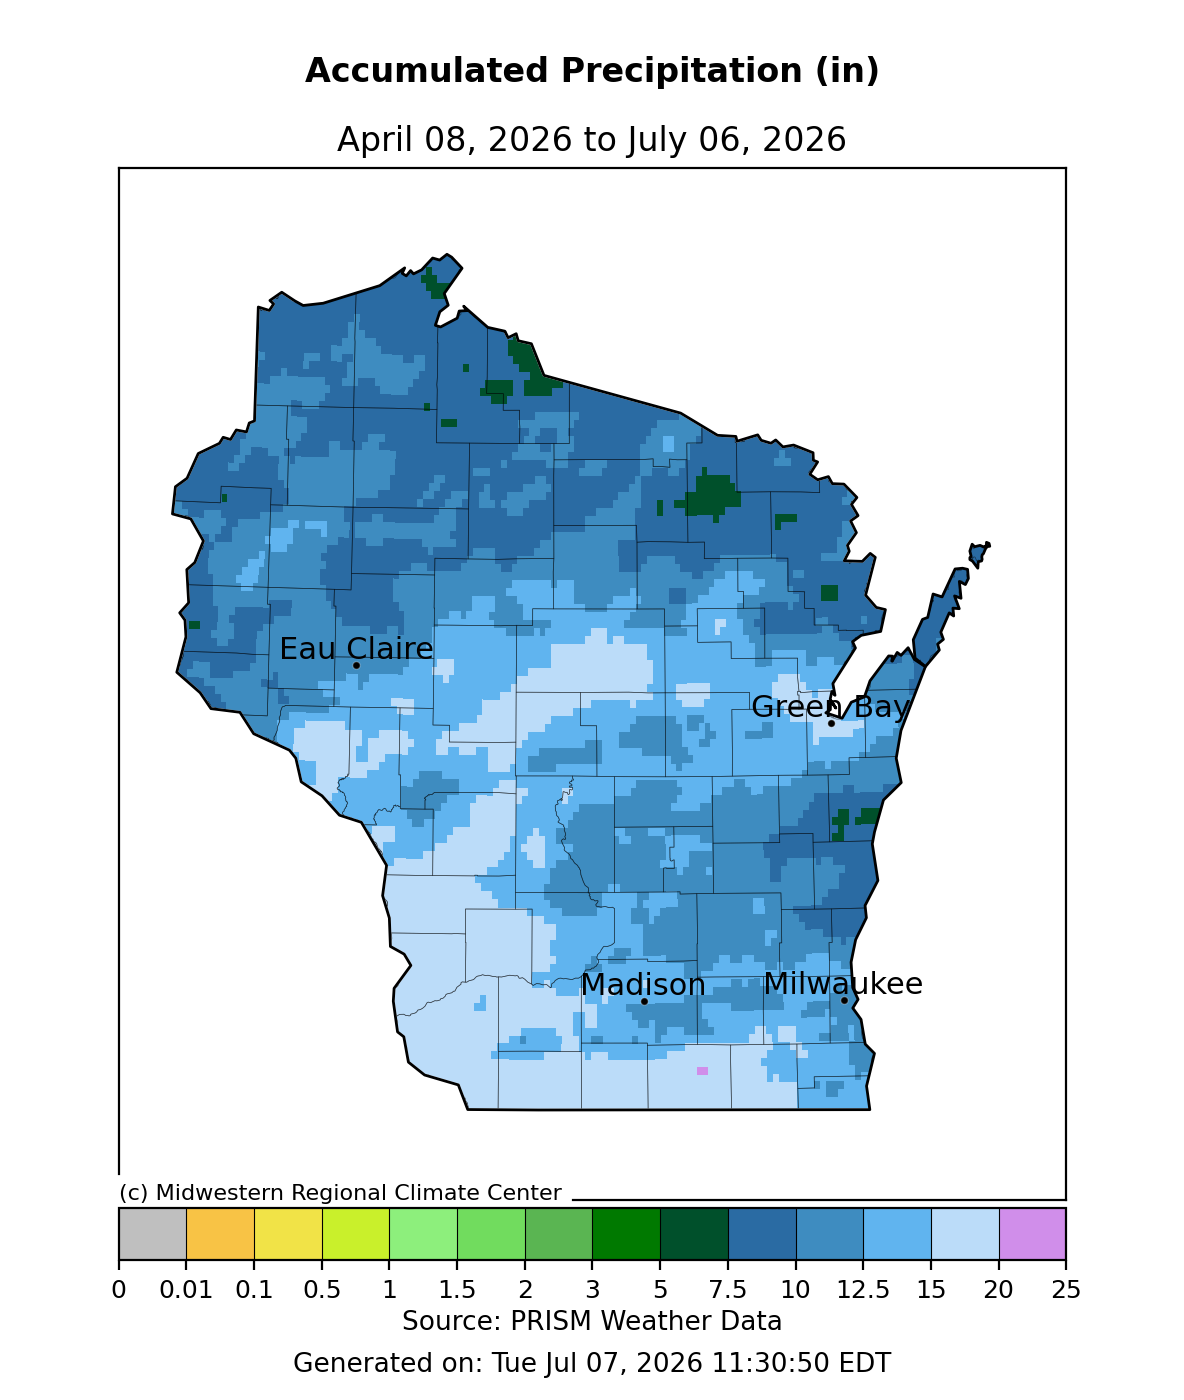
Image Description ↓
Map titled “Accumulated Precipitation (in), April 08, 2026 to July 06, 2026,” source PRISM Weather Data, generated Tue Jul 07, 2026 11:30:50 EDT, credited to Midwestern Regional Climate Center. Shows accumulated rainfall across Wisconsin using a color scale from 0 to 25 inches. Southern and south-central Wisconsin, including the area around Madison, shows lower totals in the 7.5–12.5 inch range (light blue). Northern, central, and eastern Wisconsin, including areas near Eau Claire, Green Bay, and Milwaukee, show higher totals mostly in the 10–15 inch range (medium blue), with scattered small pockets in the far north exceeding 15–20 inches (dark green/blue). A single small magenta spot south of Milwaukee indicates a localized area of 20–25 inches. City markers are labeled for Eau Claire, Green Bay, Madison, and Milwaukee.
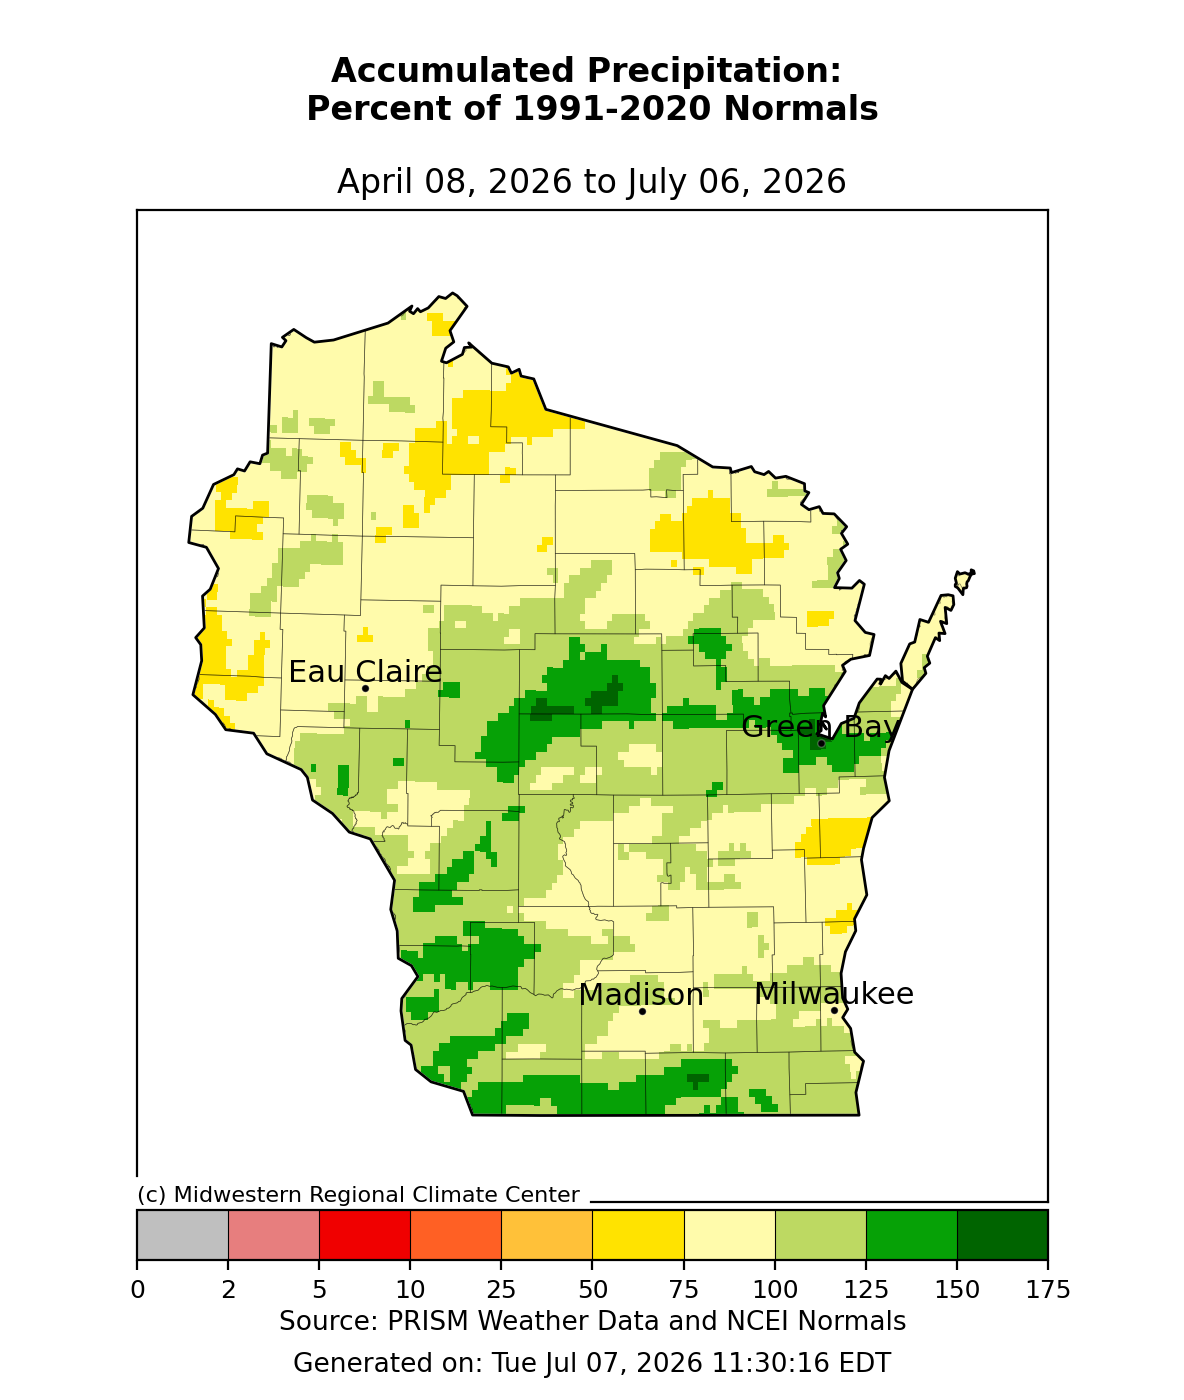
Image Description ↓
Choropleth map titled “Accumulated Precipitation: Percent of 1991-2020 Normals,” dated April 08, 2026 to July 06, 2026, from the Midwestern Regional Climate Center. Wisconsin is shaded by county-level precipitation percentages using a 10-category scale from 0 to 175+ percent of normal (gray for lowest, red/orange/yellow for below normal, pale yellow for near normal, green shades for above normal). Most of the state falls in the 100–125% (pale yellow) to 125–150% (light green) range. Notably wetter areas (dark green, 150–175%) appear in central Wisconsin, southwestern Wisconsin, and along the far southern border. Small pockets of below-normal precipitation (yellow, 50–75%) appear in the northwest, near Green Bay, and southeast of Madison. Cities labeled: Eau Claire, Green Bay, Madison, and Milwaukee. Source: PRISM Weather Data and NCEI Normals. Generated Tue Jul 07, 2026 11:30:16 EDT.
- Totals of 15-20” or more were common across southern, west central, and north central counties. These totals were 100-150% of normal.
- Most of the state received precipitation totals that were at or above normal, with most receiving at least 10” of precipitation (rain plus melted snow).
- Precipitation totals were lowest in the north (7.5-12.5”). In the north and northwest, 90-day totals were 50-100% of normal.
2026 Precipitation
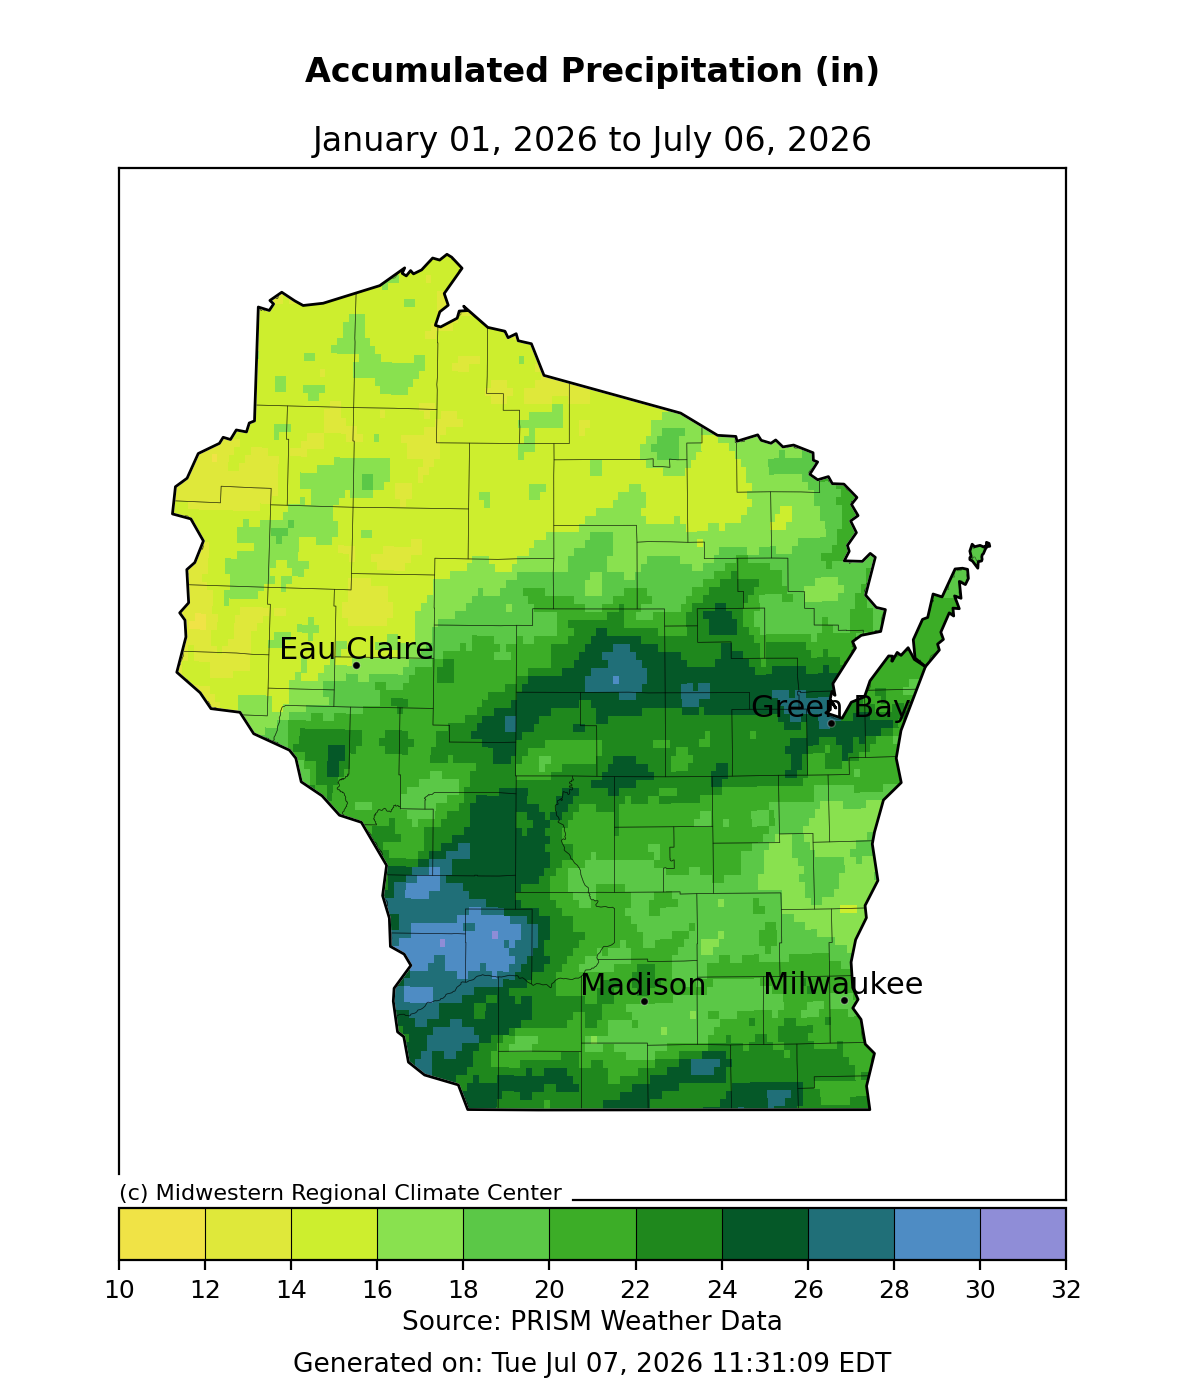
Image Description ↓
Choropleth map of Wisconsin titled “Accumulated Precipitation (in), January 01, 2026 to July 06, 2026,” source PRISM Weather Data, generated Tue Jul 07, 2026 11:31:09 EDT, credited to the Midwestern Regional Climate Center. A color scale from 10 to 32 inches runs from yellow (low) through green (mid) to blue and purple (high). Northern Wisconsin shows the lowest totals, mostly yellow-green (12–18 in). Central and southern Wisconsin show higher totals, mostly dark green (20–26 in), with several blue pockets exceeding 28 in near south-central Wisconsin, southwest of Madison, and north of Madison. Small purple areas indicating over 30 in appear in the south-central region. Four cities are labeled with markers: Eau Claire (northwest, light green, ~16–18 in), Green Bay (northeast, green, ~20–22 in), Madison (south-central, dark green, ~22–24 in), and Milwaukee (southeast, green, ~20–22 in).
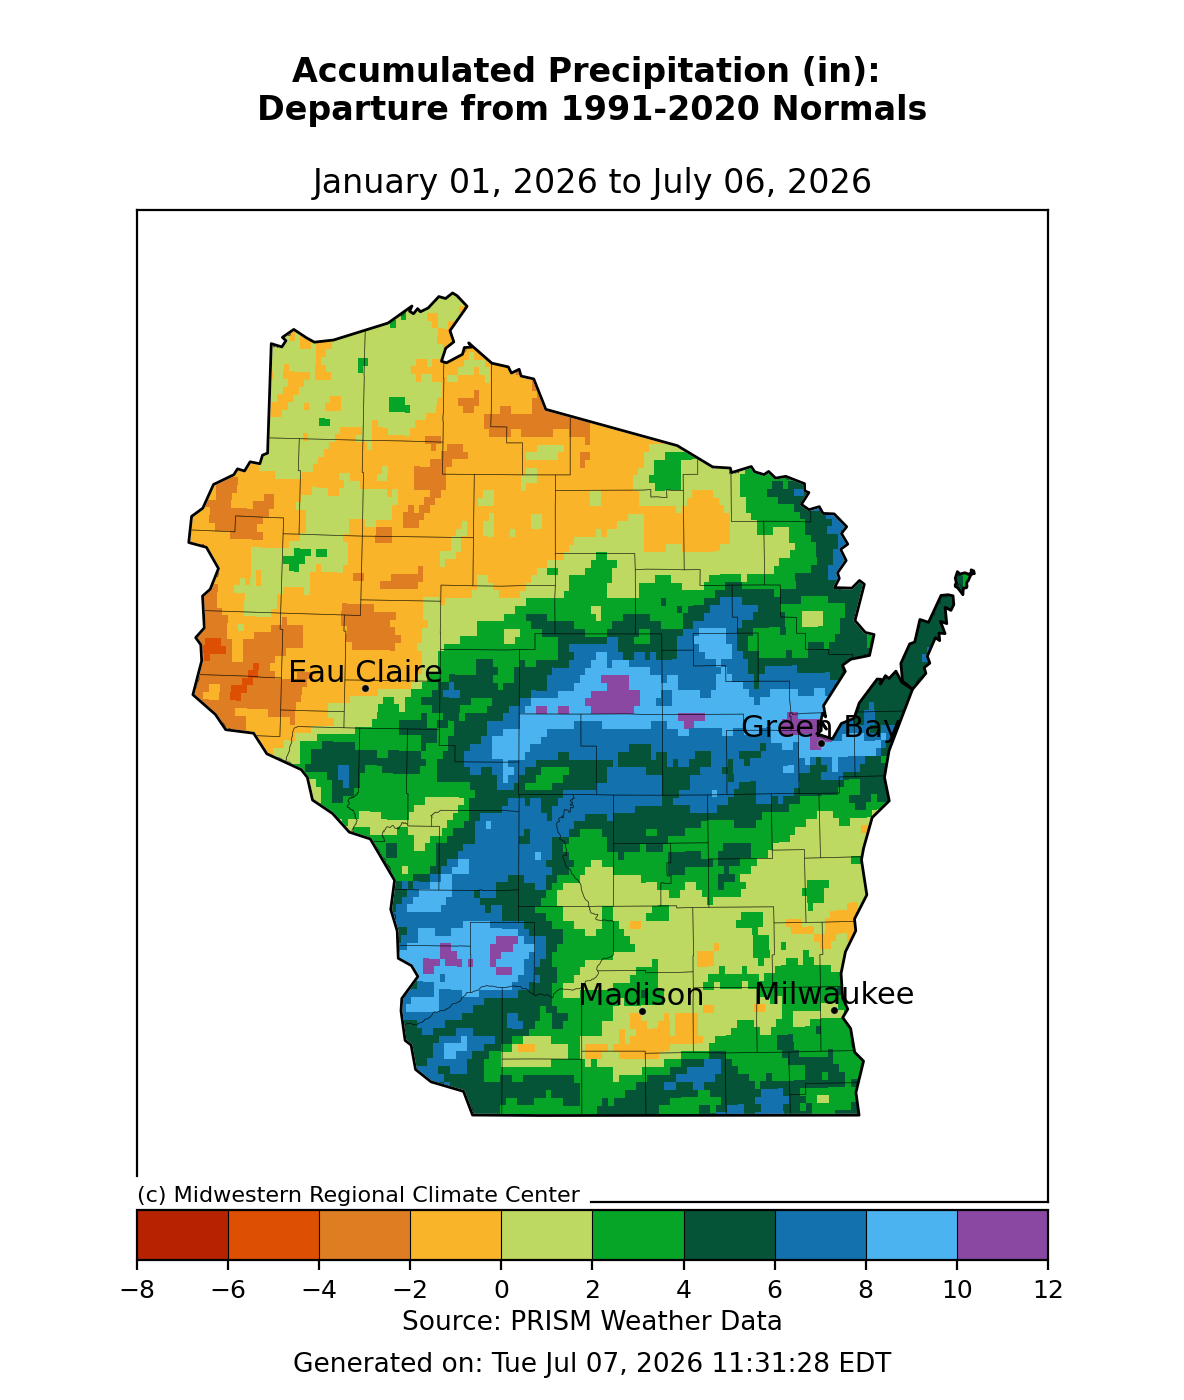
Image Description ↓
Choropleth map of Wisconsin titled “Accumulated Precipitation (in): Departure from 1991-2020 Normals,” dated January 01, 2026 to July 06, 2026. A color scale from dark red (-8 in) through orange, yellow, light green, green, dark green, blue, light blue, to purple (+12 in) shows precipitation departure. Northern and central Wisconsin, including areas near Eau Claire and Green Bay, show orange to yellow shading indicating below-normal precipitation (roughly -6 to 0 in), with a band of blue and light blue across the central part of the state indicating above-normal precipitation (6-10 in), including isolated purple patches (10-12 in) near the center and southwest. Southern Wisconsin, including Madison and Milwaukee, shows mostly light green to yellow shading (0-2 in departure). Eastern Wisconsin near Green Bay shows dark green to blue shading. City markers are labeled for Eau Claire, Green Bay, Madison, and Milwaukee. Source: PRISM Weather Data, Midwestern Regional Climate Center. Generated Tue Jul 07, 2026 11:31:28 EDT.
Soil Moisture and Temperature Trends
Soil Moisture Models
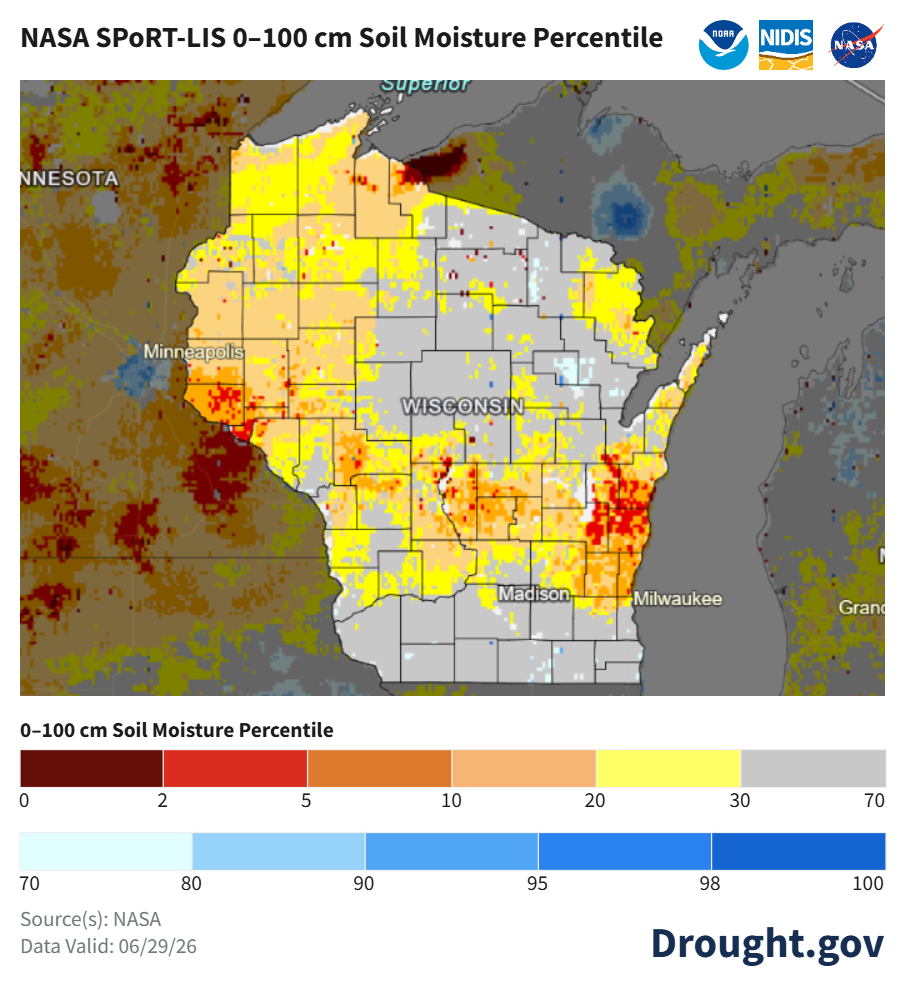
Image Description ↓
Choropleth map of Wisconsin and surrounding region showing 0–100 cm soil moisture percentile, sourced from NASA via Drought.gov, data valid 06/29/2026. Legend ranges from dark red (0–2, driest) through red, orange, tan, yellow (2–30) to gray (30–70, near normal), then light blue to dark blue (70–100, wettest). Most of Wisconsin shows yellow to tan shading, indicating low soil moisture percentiles (roughly 10–30). Pockets of red and dark red (below 5th percentile) appear in western Wisconsin near the Minnesota border, and in the southeast near Milwaukee and along the Lake Michigan shoreline. Central Wisconsin, including the Madison area, shows a mix of gray (near-normal, 30–70 percentile) and yellow patches. Far western Minnesota near Minneapolis shows scattered dark red areas indicating very dry conditions. No significant blue (wet) areas appear over Wisconsin itself, though small blue patches are visible over Lake Superior and Lake Michigan regions.
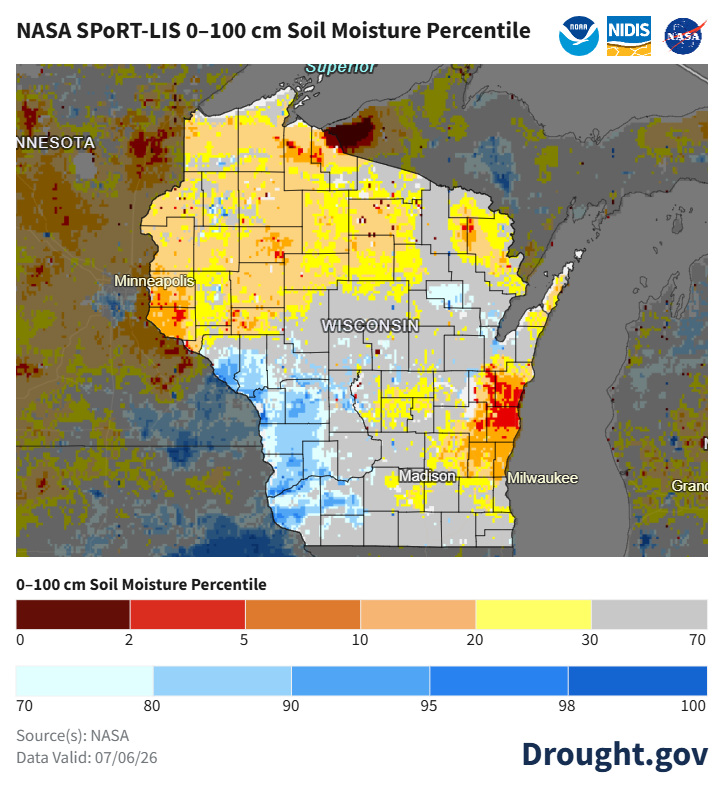
Image Description ↓
NASA SPoRT-LIS map titled “0–100 cm Soil Moisture Percentile,” sourced from NASA, data valid 07/06/26 (Drought.gov). Wisconsin is shaded by soil moisture percentile using a color scale from dark red (0–2, driest) through red, orange, tan, and yellow (2–30) to gray (70, near-normal), then light to dark blue (70–100, wettest). Northern and central Wisconsin show mostly orange and yellow tones (roughly 10–30th percentile), with scattered dark red patches near the Minnesota border indicating extreme dryness. Southwestern Wisconsin displays widespread blue shading (80–98th percentile), indicating wetter-than-normal conditions. Southeastern Wisconsin, near Madison and Milwaukee, shows clusters of red and orange (2–10th percentile), indicating dry conditions. Much of central Wisconsin is gray, representing near-normal or non-agricultural areas. Surrounding states and Lake Superior/Lake Michigan are grayed out as outside the area of focus.
- Satellite-based soil moisture estimates indicate southwest Wisconsin has higher-than-normal soil moisture in the top 1 meter, following a wet week.
- Dryness improved across central counties, but drier-than-normal conditions remain in place across the northwest, north central, and east central regions.
- Notes on how to interpret the maps:
- Red areas = top 5 driest in 100 years.
- Dark red areas = top 2 driest in 100 years.
- Dark blue areas = top 2 wettest in 100 years.
Wisconet Soil Moisture
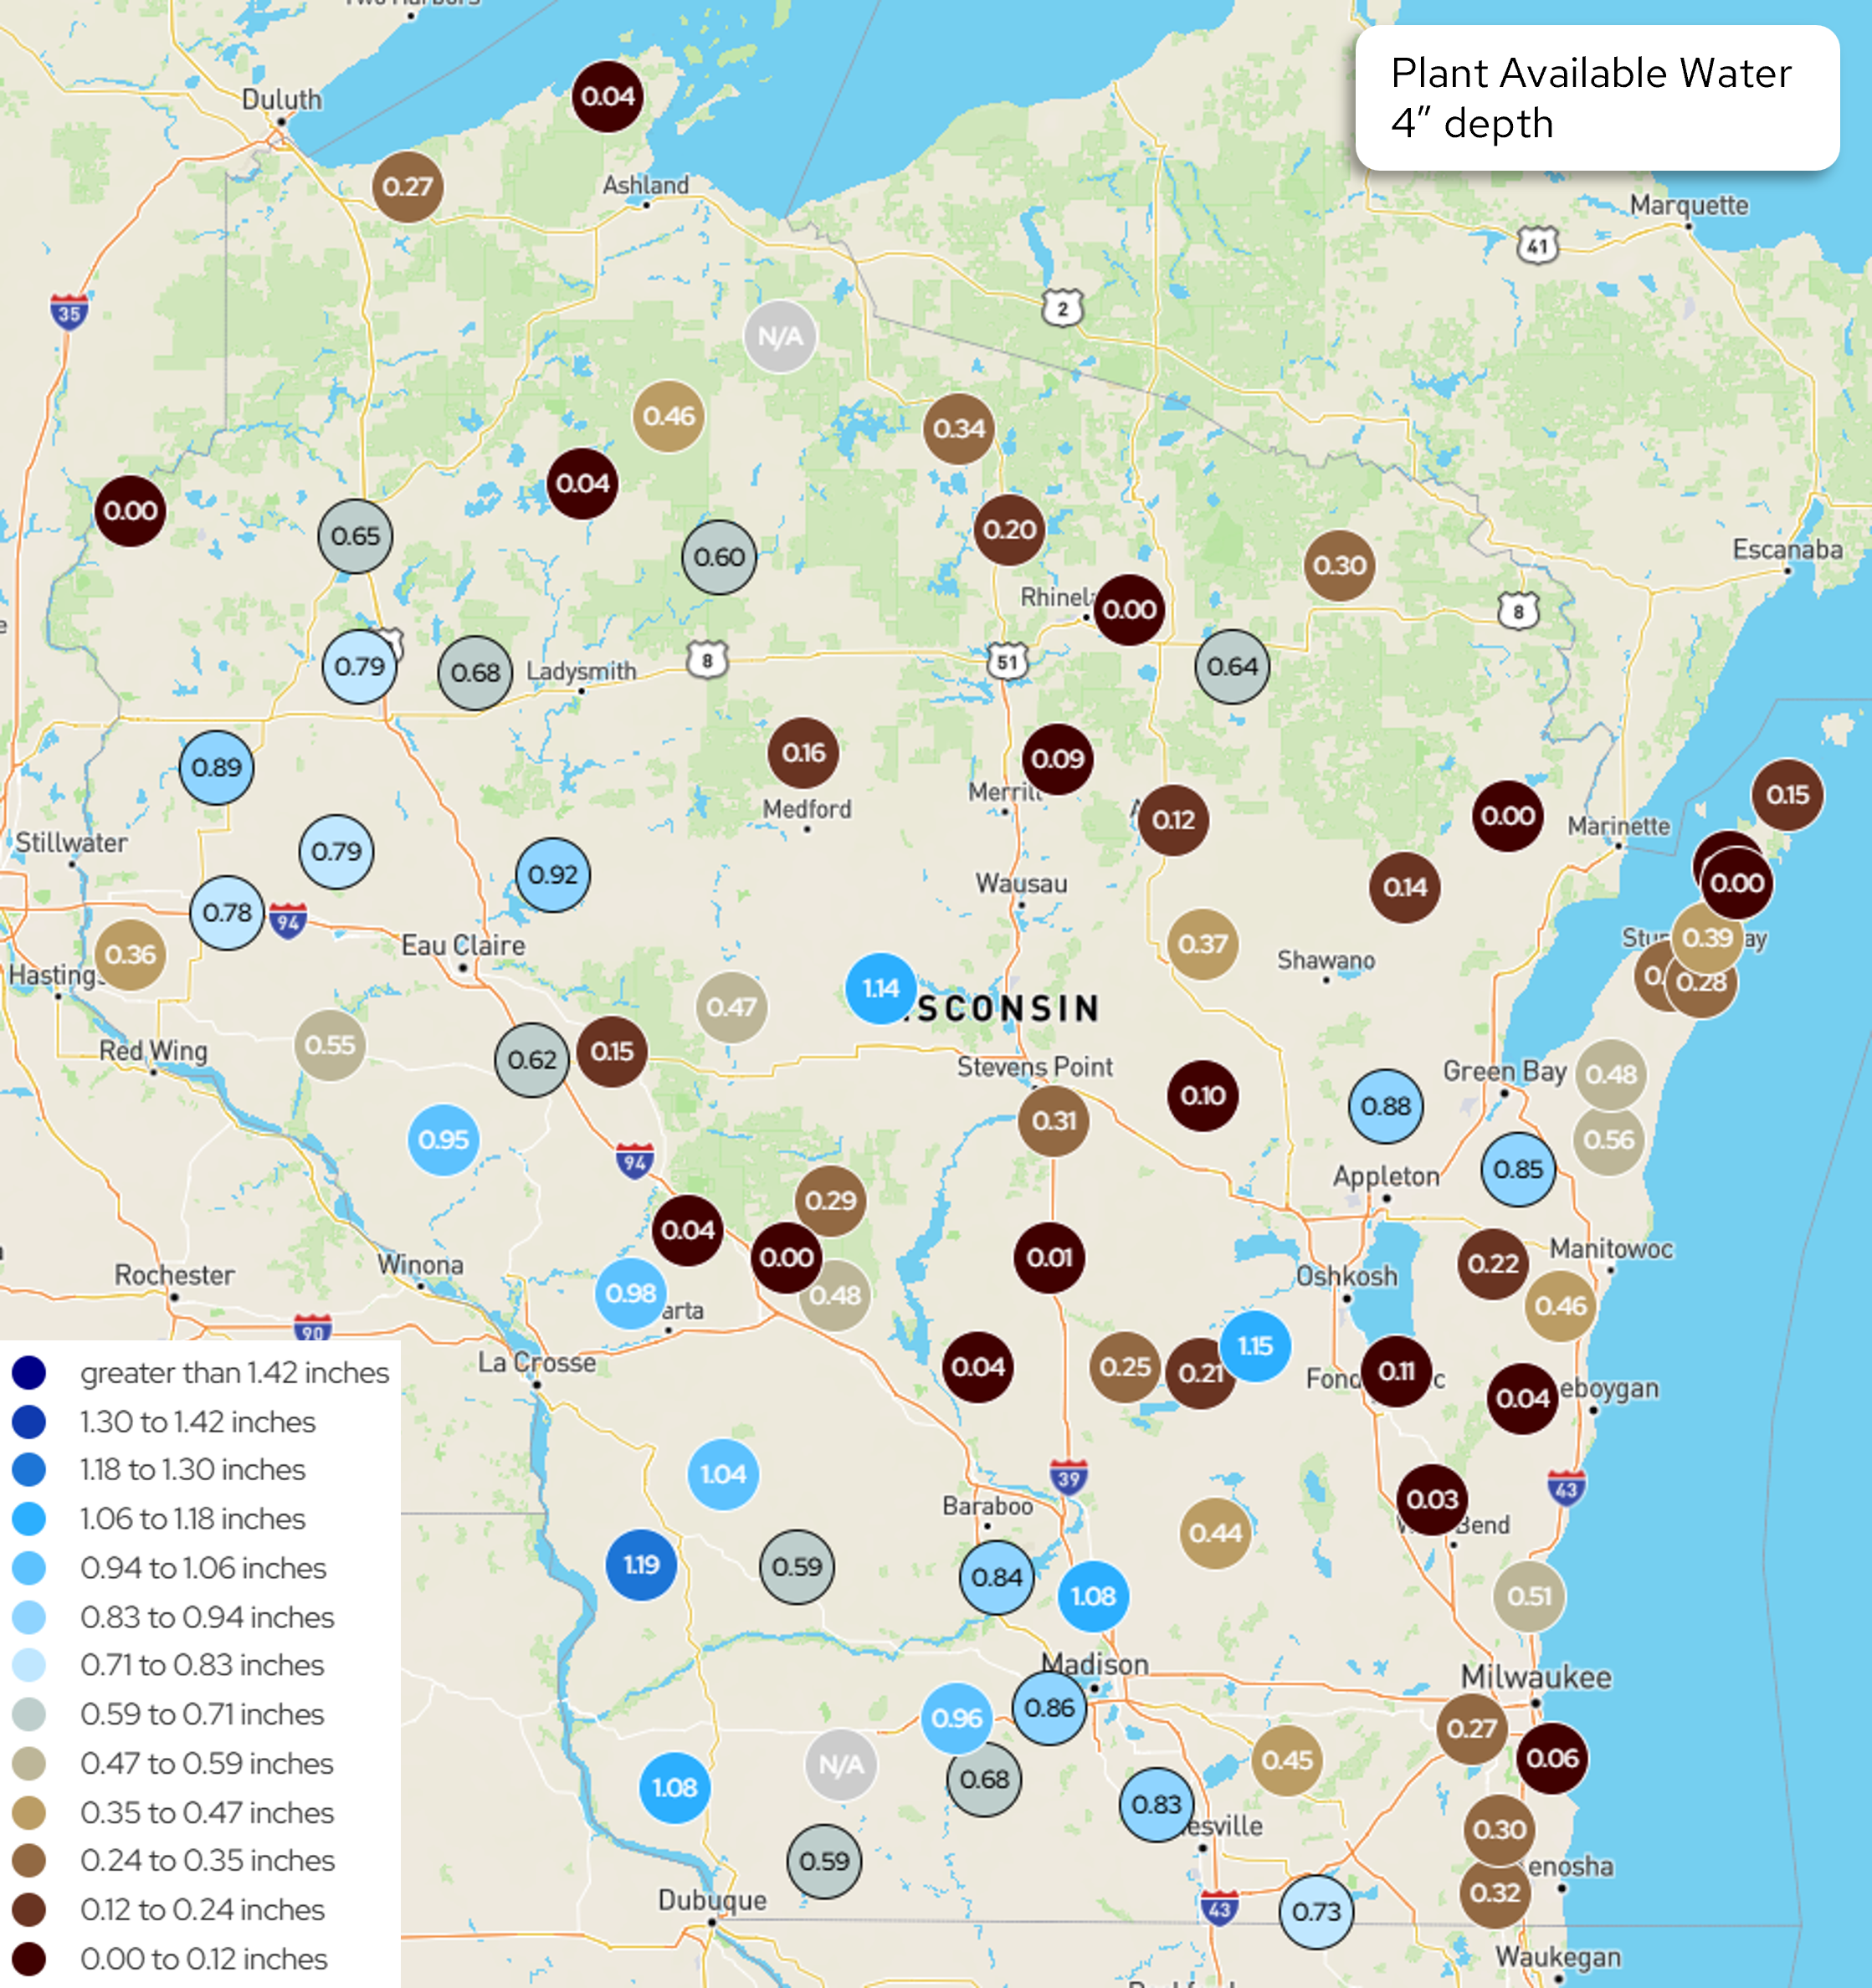
Image Description ↓
Choropleth-style point map of Wisconsin and border areas titled “Plant Available Water, 4″ depth,” with color-coded circles at roughly 70 weather station locations showing inches of available water, from dark navy (greater than 1.42″) through blues, grays, tans, browns, to dark red/maroon (0.00–0.12″). Most stations across central, northern, and eastern Wisconsin show dark red or brown values (0.00–0.35″), indicating low plant available water. Higher blue values (0.83–1.19″) appear mainly in western Wisconsin near La Crosse, Eau Claire, and Madison, and scattered points near Green Bay and Appleton. One station is marked “N/A” near Rhinelander and another near Janesville. A legend in the lower left lists 12 color-coded ranges from “greater than 1.42 inches” down to “0.00 to 0.12 inches.”
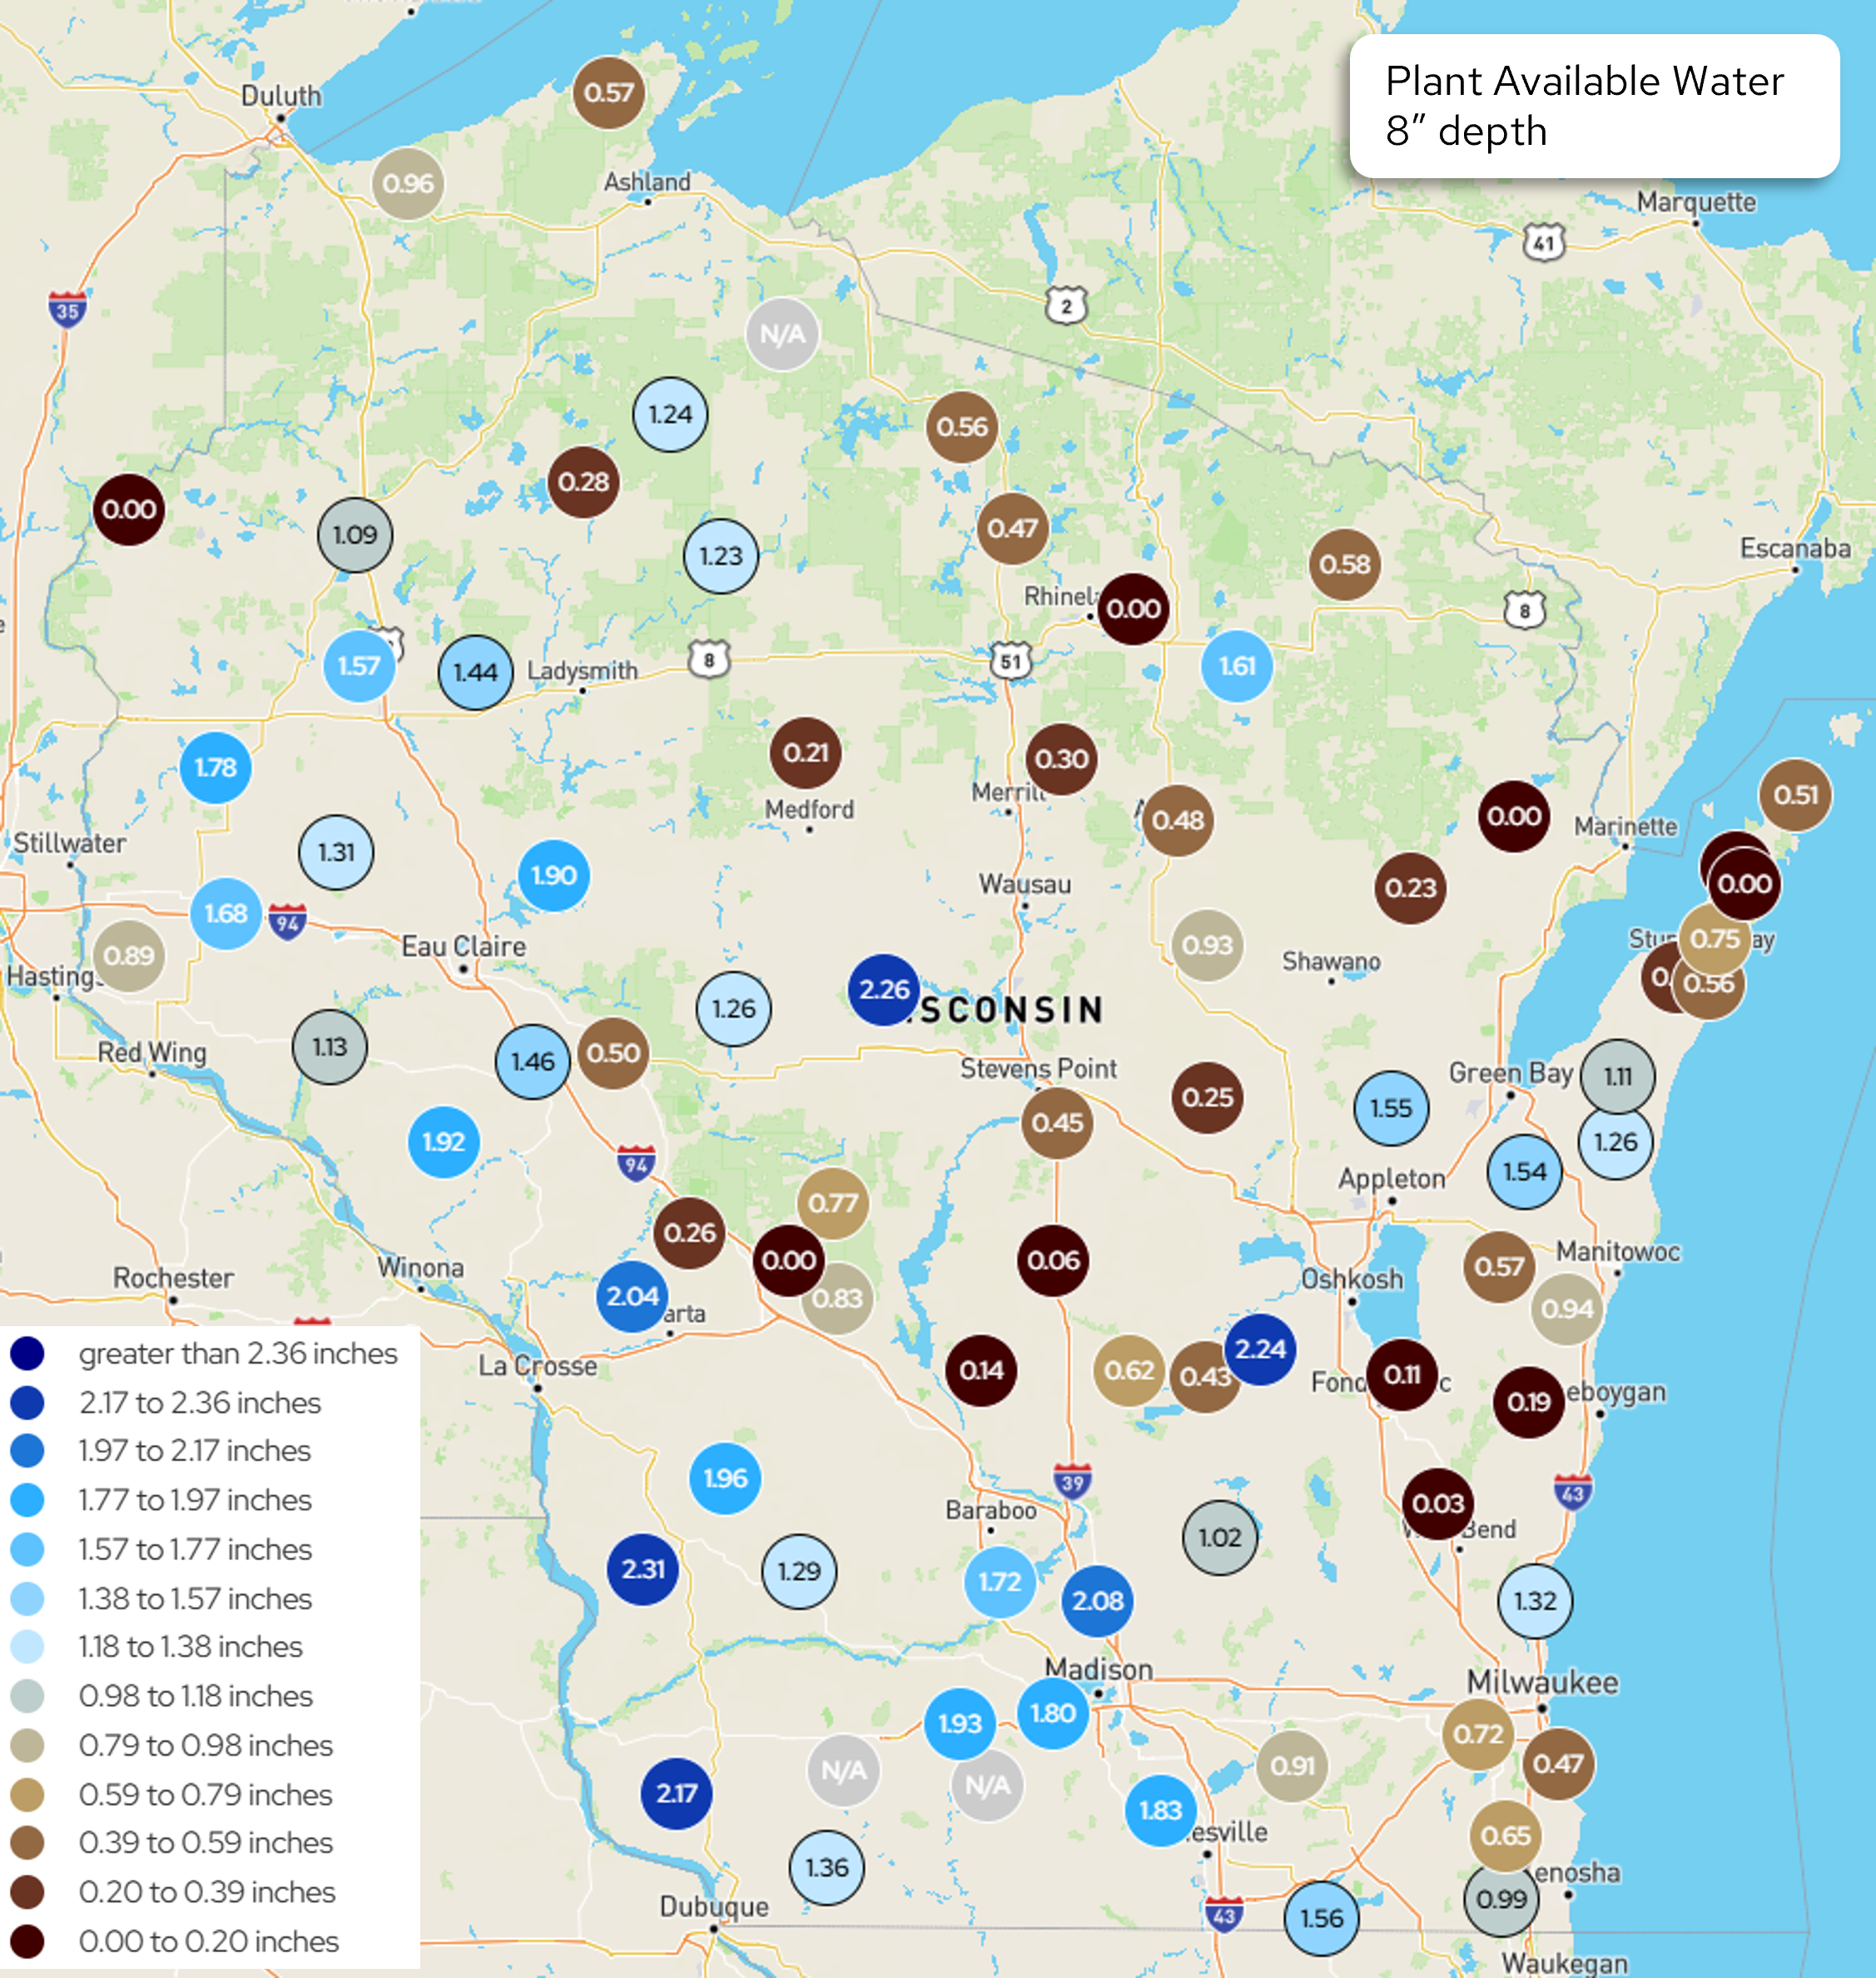
Image Description ↓
Map of Wisconsin showing plant available water (8″ soil depth) readings at roughly 60 monitoring locations statewide, each marked with a colored circle labeled with a numeric value in inches. Color scale (dark red to dark blue) indicates water content from driest to wettest: dark red/maroon = 0.00–0.20 in, brown shades = 0.20–0.98 in, gray/tan = 0.98–1.18 in, light blue shades = 1.18–2.17 in, and dark blue = greater than 2.36 in. Readings are heavily clustered at the low end (many stations at 0.00–0.30 in) across central and northeastern Wisconsin, while higher readings (1.5–2.3 in) appear mainly in western and south-central Wisconsin near Eau Claire, La Crosse, and Madison. Two stations near Superior/Duluth and one near Ashland show N/A. A legend in the lower left lists twelve color-coded ranges from “greater than 2.36 inches” (darkest blue) to “0.00 to 0.20 inches” (darkest red).
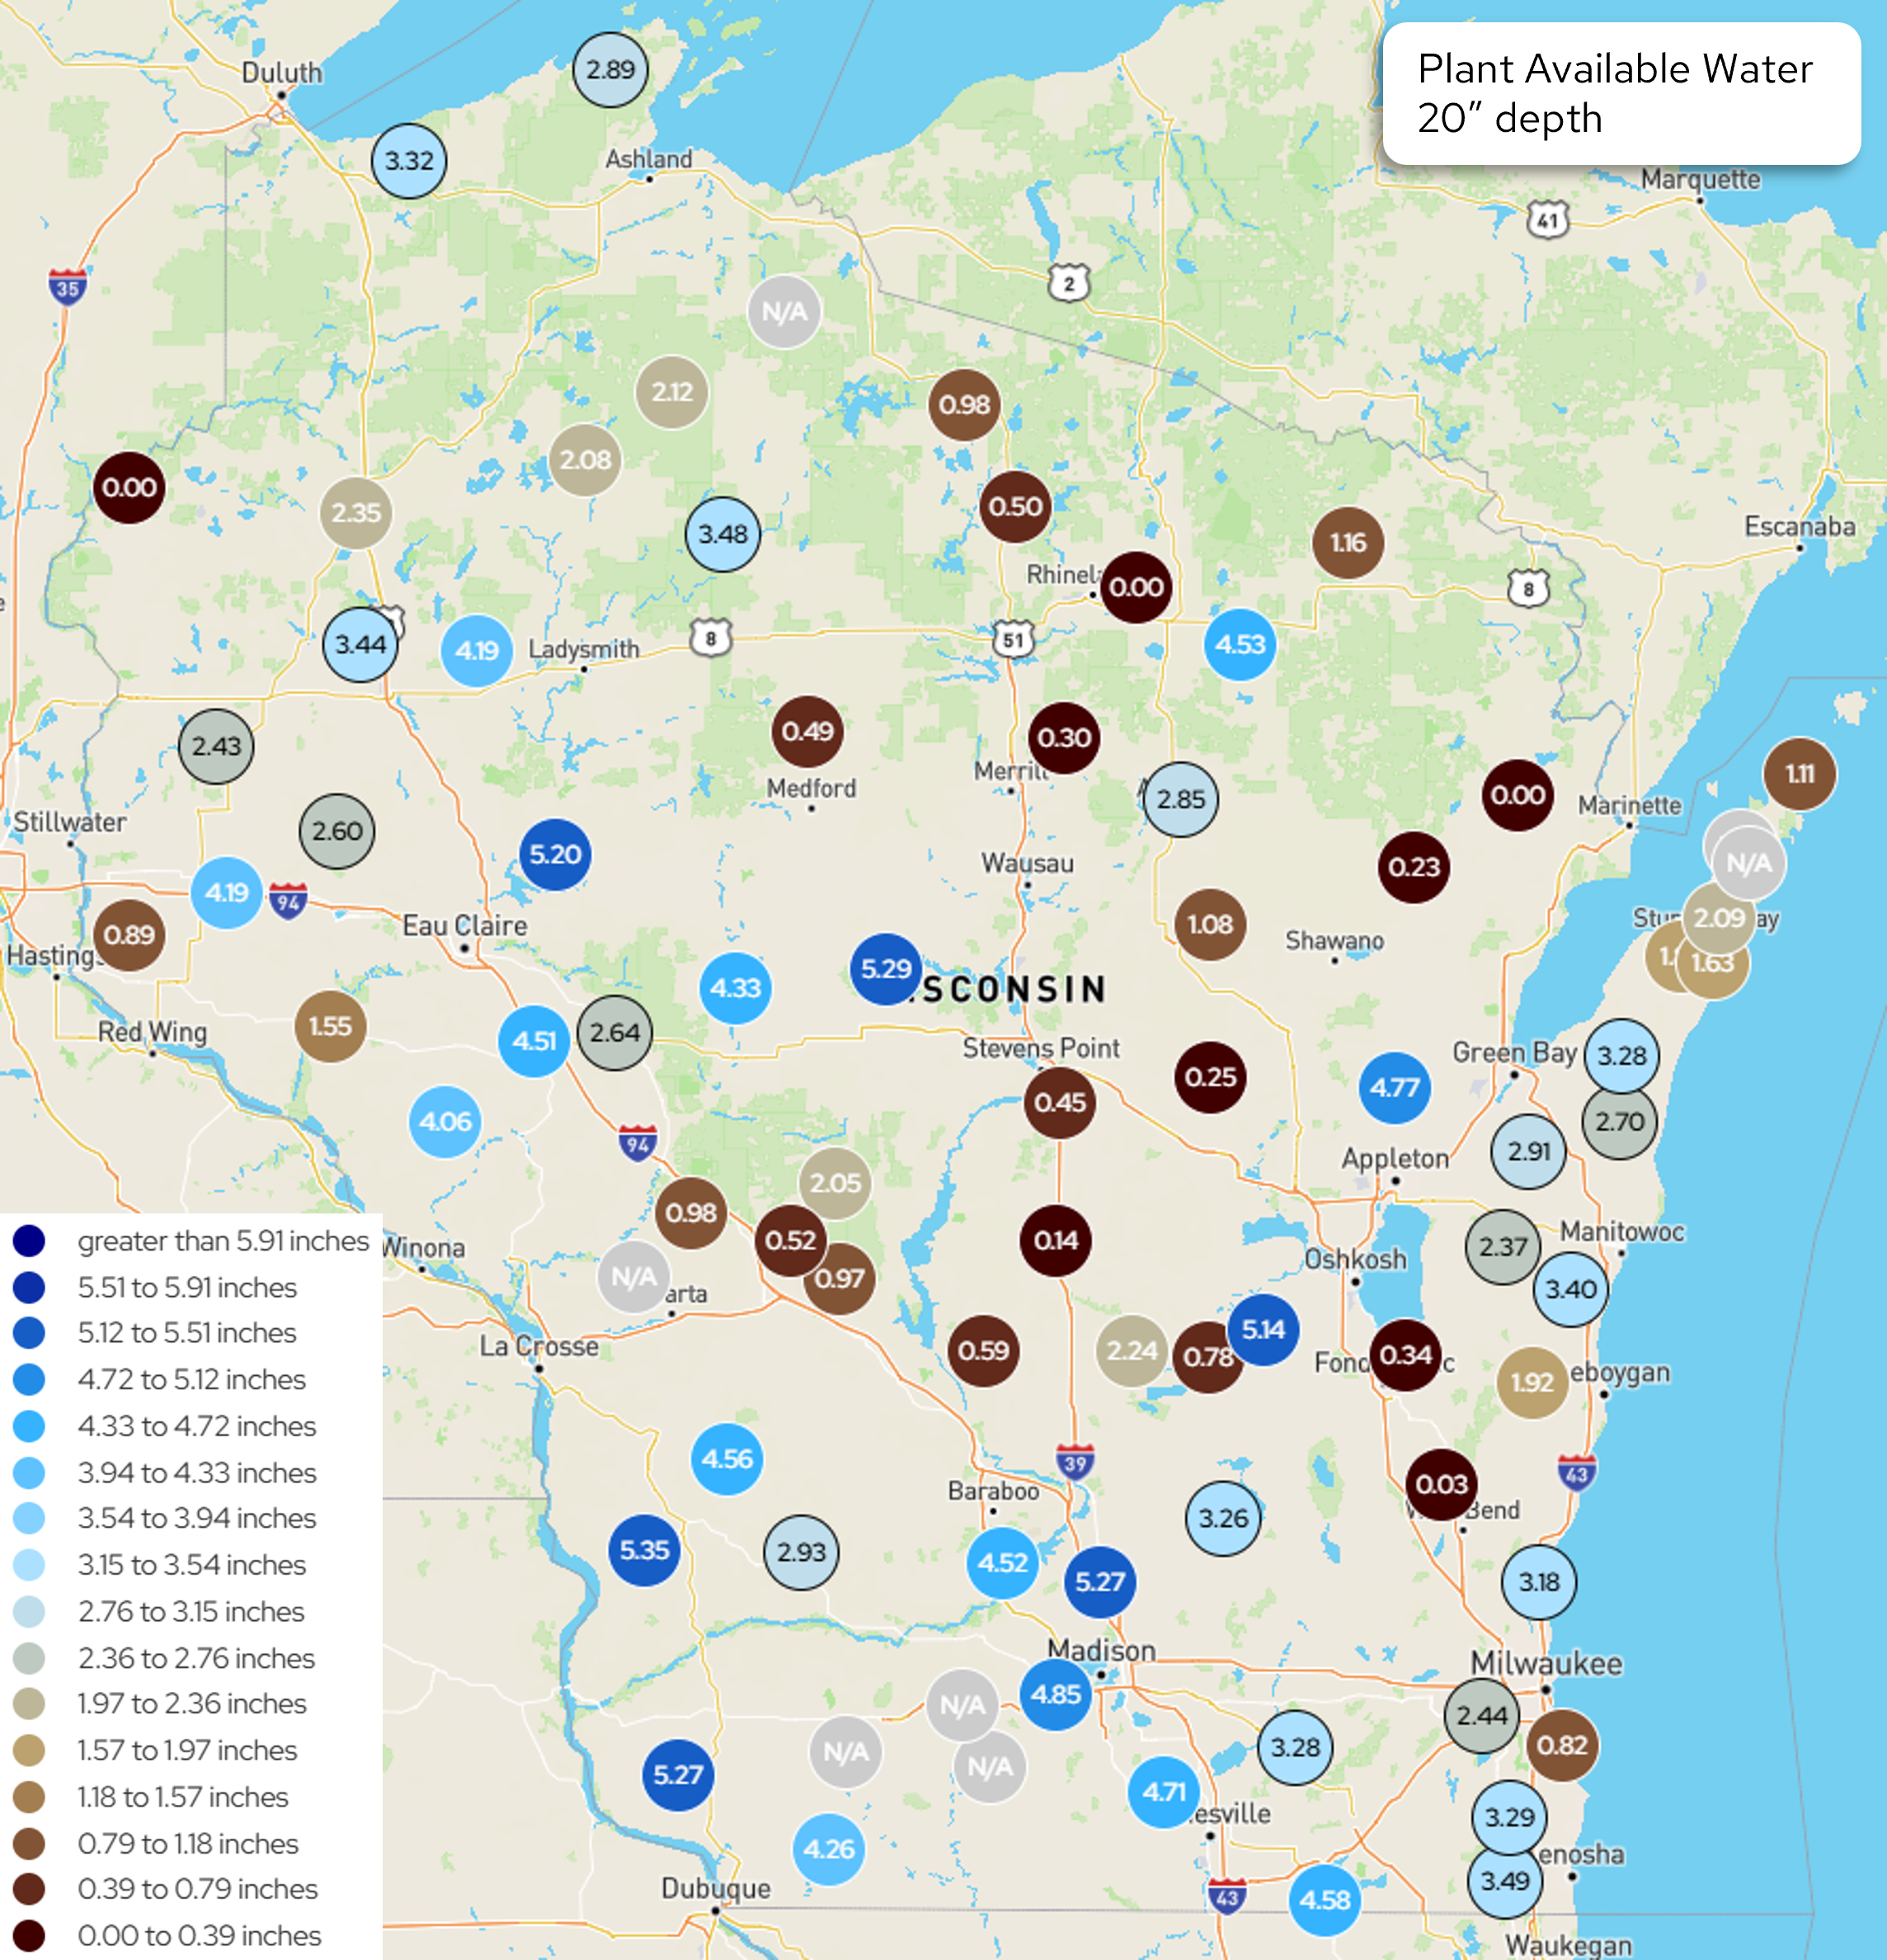
Image Description ↓
Map of Wisconsin showing Plant Available Water at 20″ soil depth for dozens of monitoring stations, each marked with a colored circle and numeric value in inches. Color scale (legend, bottom left): dark navy blue = greater than 5.91″, ranging through blue shades down to 2.76–3.15″ (pale blue), then tan/brown shades from 2.36–2.76″ down to 0.00–0.39″ (dark maroon), plus gray circles marked “N/A” for missing data.
Regional pattern: Western and southern Wisconsin (near Eau Claire, La Crosse, Madison, and along I-94/I-39 corridors) show mostly blue values, generally 4.0–5.35″, indicating higher available water. Central and northeastern Wisconsin (near Wausau, Rhinelander, Shawano, and Stevens Point) show many dark maroon values between 0.00 and 0.59″, indicating very low available water. Northern border areas near Duluth and Ashland show mixed tan and blue values (2.08–3.32″). Eastern shoreline areas near Green Bay, Appleton, and Milwaukee show mostly light blue and gray-blue values (2.44–3.49″), with some low maroon outliers (0.03, 0.34, 0.82). Several stations across the state, including near Winona, Wautoma, and Sturgeon Bay, are marked “N/A.”
- Most Wisconet research farm stations showed an increase in 4-inch moisture from last week’s report, following a relatively wet week for most sites. North central stations (Rhinelander & Kemp) saw decreased moisture following a dry week.
- The maps (above) show the daily average Wisconet plant available water (inches) on July 6th.
- The table (below) shows total precipitation and changes in plant available water from June 29th (Start) to July 6th (End).
- What is plant available water? To learn more, read this article from UW Extension Ag Water Quality on plant available water. There is also a webinar from UW Extension on soil water management that you can watch.
- Example: Imagine that you have 4 inches of soil in the bottom of a bucket. In that soil, there are 1.5 inches of plant available water. Therefore, if you removed the soil and left only the water available for plant roots to take up, you would have 1.5 inches of water in the bottom of the bucket.
- The wilting point is when plant available water is at 0 inches, and the plant can no longer access water at that depth in the soil.
| Research Farm | County | Total Precipitation (in.) | 4″ Start | 4″ End | 8″ Start | 8″ End | 20″ Start | 20″ End |
|---|---|---|---|---|---|---|---|---|
| Arlington | Columbia | 1.46 | 0.92 | 1.08 | 1.84 | 2.08 | 5.03 | 5.27 |
| Black River Falls | Jackson | 2.07 | 0.00 | 0.04 | 0.01 | 0.26 | 0.32 | 0.98 |
| Dairy Forage ARS | Sauk | 2.19 | 0.69 | 0.84 | 1.44 | 1.72 | 3.43 | 4.52 |
| Hancock | Waushara | 3.27 | 0.00 | 0.01 | 0.00 | 0.06 | 0.00 | 0.14 |
| Kemp | Oneida | 0.08 | 0.34 | 0.20 | 0.73 | 0.47 | 0.93 | 0.50 |
| Lancaster | Grant | 5.00 | 0.93 | 1.08 | 1.95 | 2.17 | 5.05 | 5.27 |
| Marshfield | Marathon | 2.23 | 1.13 | 1.14 | 2.24 | 2.26 | 5.27 | 5.29 |
| O.J. Noer (Turfgrass) | Dane | 0.75 | 0.86 | 0.86 | 1.82 | 1.80 | 4.88 | 4.85 |
| Peninsular | Door | 0.83 | 0.24 | 0.39 | 0.52 | 0.75 | 1.87 | 2.09 |
| Rhinelander | Oneida | 0.00 | 0.04 | 0.00 | 0.12 | 0.00 | 0.12 | 0.00 |
| Spooner | Washburn | 3.43 | 0.41 | 0.65 | 0.63 | 1.09 | 1.14 | 2.35 |
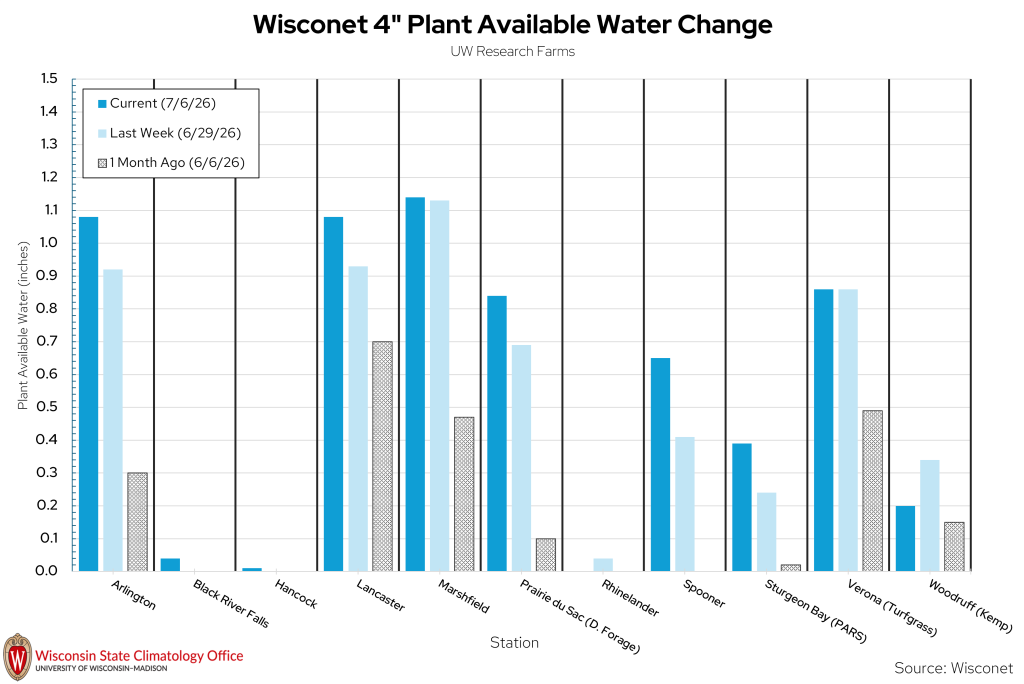
| Research Farm | Current 4″ Soil Moisture | Last Week’s 4″ Soil Moisture | 1 Month Ago 4″ Soil Moisture |
|---|---|---|---|
| Arlington | 1.08 | 0.92 | 0.30 |
| Black River Falls | 0.04 | 0.00 | 0.00 |
| Dairy Forage ARS | 0.84 | 0.69 | 0.10 |
| Hancock | 0.01 | 0.00 | 0.00 |
| Kemp | 0.20 | 0.34 | 0.15 |
| Lancaster | 1.08 | 0.93 | 0.70 |
| Marshfield | 1.14 | 1.13 | 0.47 |
| O.J. Noer (Turfgrass) | 0.86 | 0.86 | 0.49 |
| Peninsular | 0.39 | 0.24 | 0.02 |
| Rhinelander | 0.00 | 0.04 | 0.00 |
| Spooner | 0.65 | 0.41 | 0.00 |
USDA Soil Moisture Reports
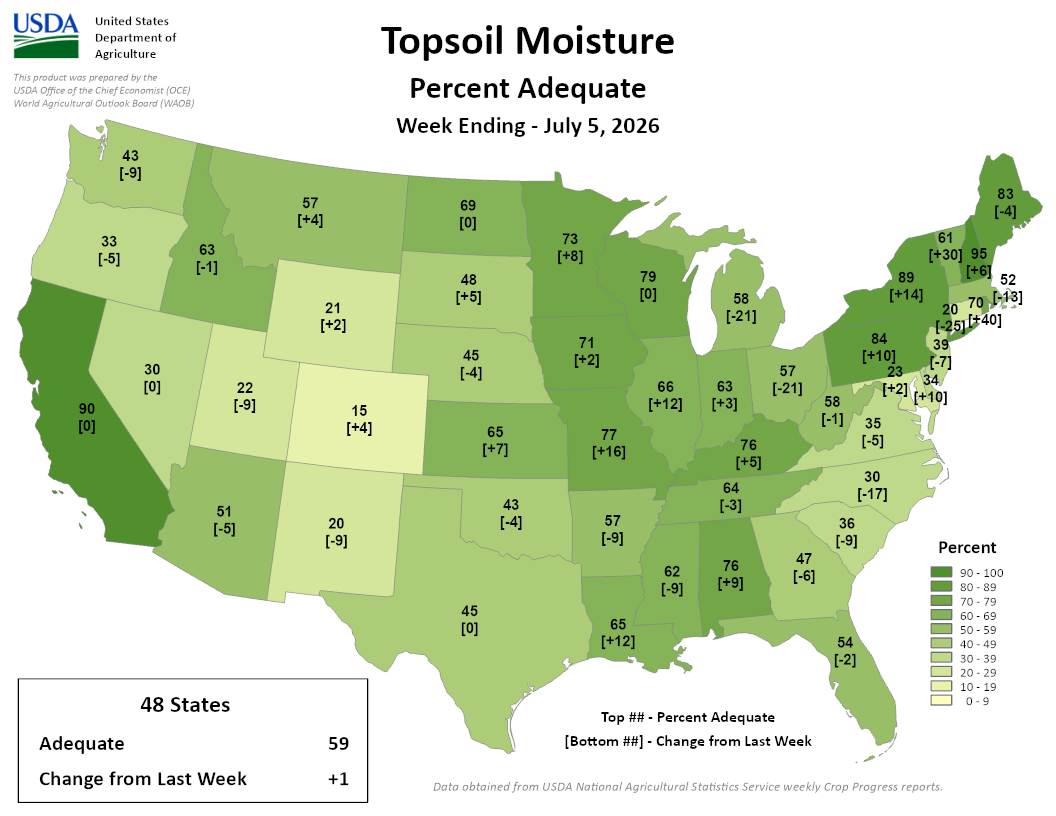
Image Description ↓
Choropleth map of the contiguous United States shading each state by percent of topsoil moisture rated “adequate,” using a light-to-dark green scale (0–9% palest to 90–100% darkest). Each state shows two numbers: the percent adequate on top, and the change from the previous week in brackets below.
State values (percent adequate [change from last week]):
Washington 43 [-9], Oregon 33 [-5], California 90 [0], Idaho 63 [-1], Nevada 30 [0], Utah 22 [-9], Arizona 51 [-5], Montana 57 [+4], Wyoming 21 [+2], Colorado 15 [+4], New Mexico 20 [-9], North Dakota 69 [0], South Dakota 48 [+5], Nebraska 45 [-4], Kansas 43 [-4], Oklahoma 45 [0], Texas 65 [+12], Minnesota 73 [+8], Iowa 71 [+2], Missouri 77 [+16], Arkansas 57 [-9], Louisiana 65 [+12], Wisconsin 79 [0], Illinois 66 [+12], Mississippi 62 [-9], Alabama 76 [+9], Michigan 58 [-21], Indiana 63 [+3], Kentucky 76 [+5], Tennessee 64 [-3], Georgia 47 [-6], Florida 54 [-2], Ohio 57 [-21], West Virginia 58 [-1], Virginia 35 [-5], North Carolina 30 [-17], South Carolina 36 [-9], Pennsylvania 84 [+10], New York 89 [+14], New Jersey 23 [+2], Delaware 34 [+10], Maryland 39 [-7], Connecticut 20 [-25], Rhode Island 70 [+40], Massachusetts 52 [-13], Vermont 61 [+30], New Hampshire 95 [+6], Maine 83 [-4].
Bottom-left summary box: “48 States — Adequate: 59, Change from Last Week: +1.” Source note: data obtained from the USDA National Agricultural Statistics Service weekly Crop Progress reports. Prepared by USDA Office of the Chief Economist (OCE), World Agricultural Outlook Board (WAOB).
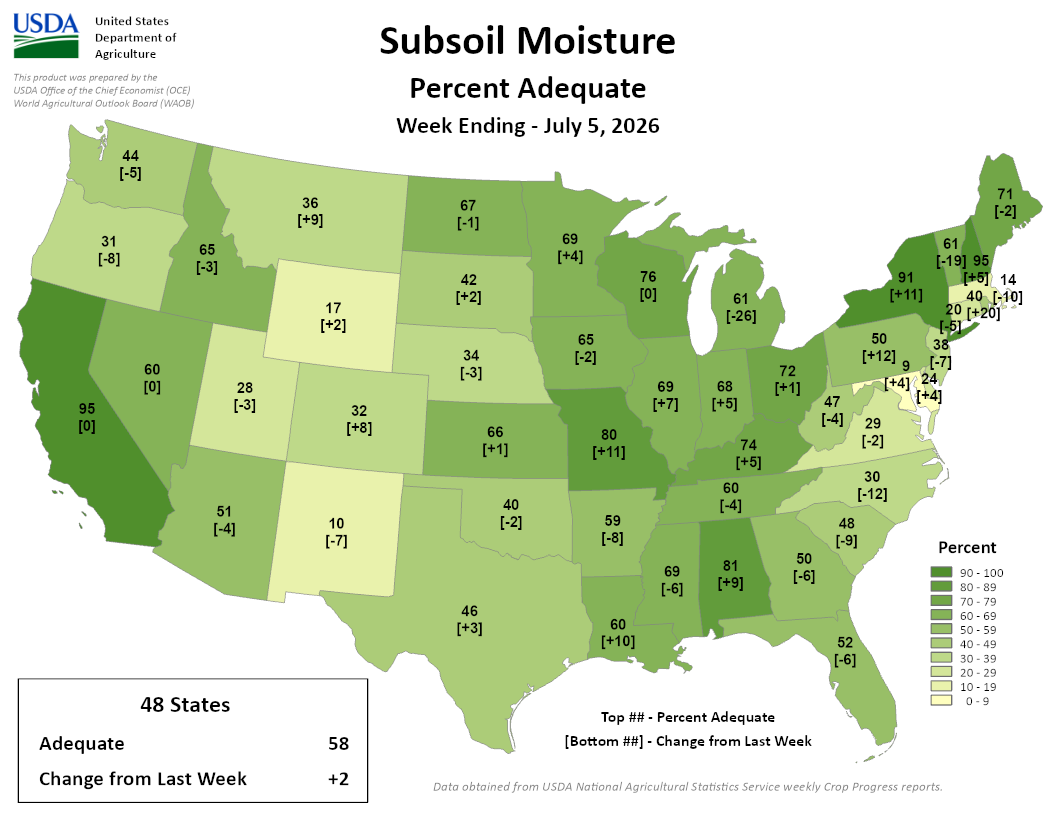
Image Description ↓
Choropleth map of the contiguous United States titled “Subsoil Moisture: Percent Adequate, Week Ending – July 5, 2026,” prepared by USDA’s Office of the Chief Economist and World Agricultural Outlook Board. Each state is shaded on a green scale (darkest green = 90-100% adequate, palest yellow-green = 0-9% adequate) and labeled with its percent adequate value and change from the prior week in brackets.
State values (percent adequate [change from last week]):
Washington 44 [-5], Oregon 31 [-8], California 95 [0], Idaho 65 [-3], Nevada 60 [0], Utah 28 [-3], Arizona 51 [-4], New Mexico 10 [-7], Montana 36 [+9], Wyoming 17 [+2], Colorado 34 [-3], North Dakota 67 [-1], South Dakota 42 [+2], Nebraska 65 [-2], Kansas 66 [+1], Oklahoma 40 [-2], Texas 46 [+3], Minnesota 69 [+4], Iowa 80 [+11], Missouri 59 [-8], Arkansas 69 [-6], Louisiana 60 [+10], Wisconsin 76 [0], Illinois 68 [+5], Michigan 61 [-26], Indiana 72 [+1], Kentucky 74 [+5], Tennessee 60 [-4], Mississippi 81 [+9], Alabama 50 [-6], Georgia 52 [-6], Florida 30 [-12], South Carolina 48 [-9], North Carolina 29 [-2], Virginia 47 [-4], West Virginia 9 [+4], Ohio 50 [+12], Pennsylvania 91 [+11], New York 61 [-19], Vermont/New Hampshire area 95 [+5], Maine 71 [-2], New Jersey 14, Delaware 40 [-10], Maryland 20 [-5], Connecticut/Rhode Island area 38 [-7], 24 [+4].
Bottom-left summary box: “48 States — Adequate: 58, Change from Last Week: +2.” Legend indicates percent ranges in 10-point increments from 0-9 (palest) to 90-100 (darkest green). Footer notes data obtained from USDA National Agricultural Statistics Service weekly Crop Progress reports.
- 79% and 76% of agricultural soils in the state are reported as having adequate topsoil and subsoil moisture, respectively. The values are unchanged from last week’s report.
- 9% and 14% of agricultural soils in the state are reported as having short to very short topsoil and subsoil moisture, respectively. The topsoil value decreased from last week’s report.
Wisconet Soil Temperature
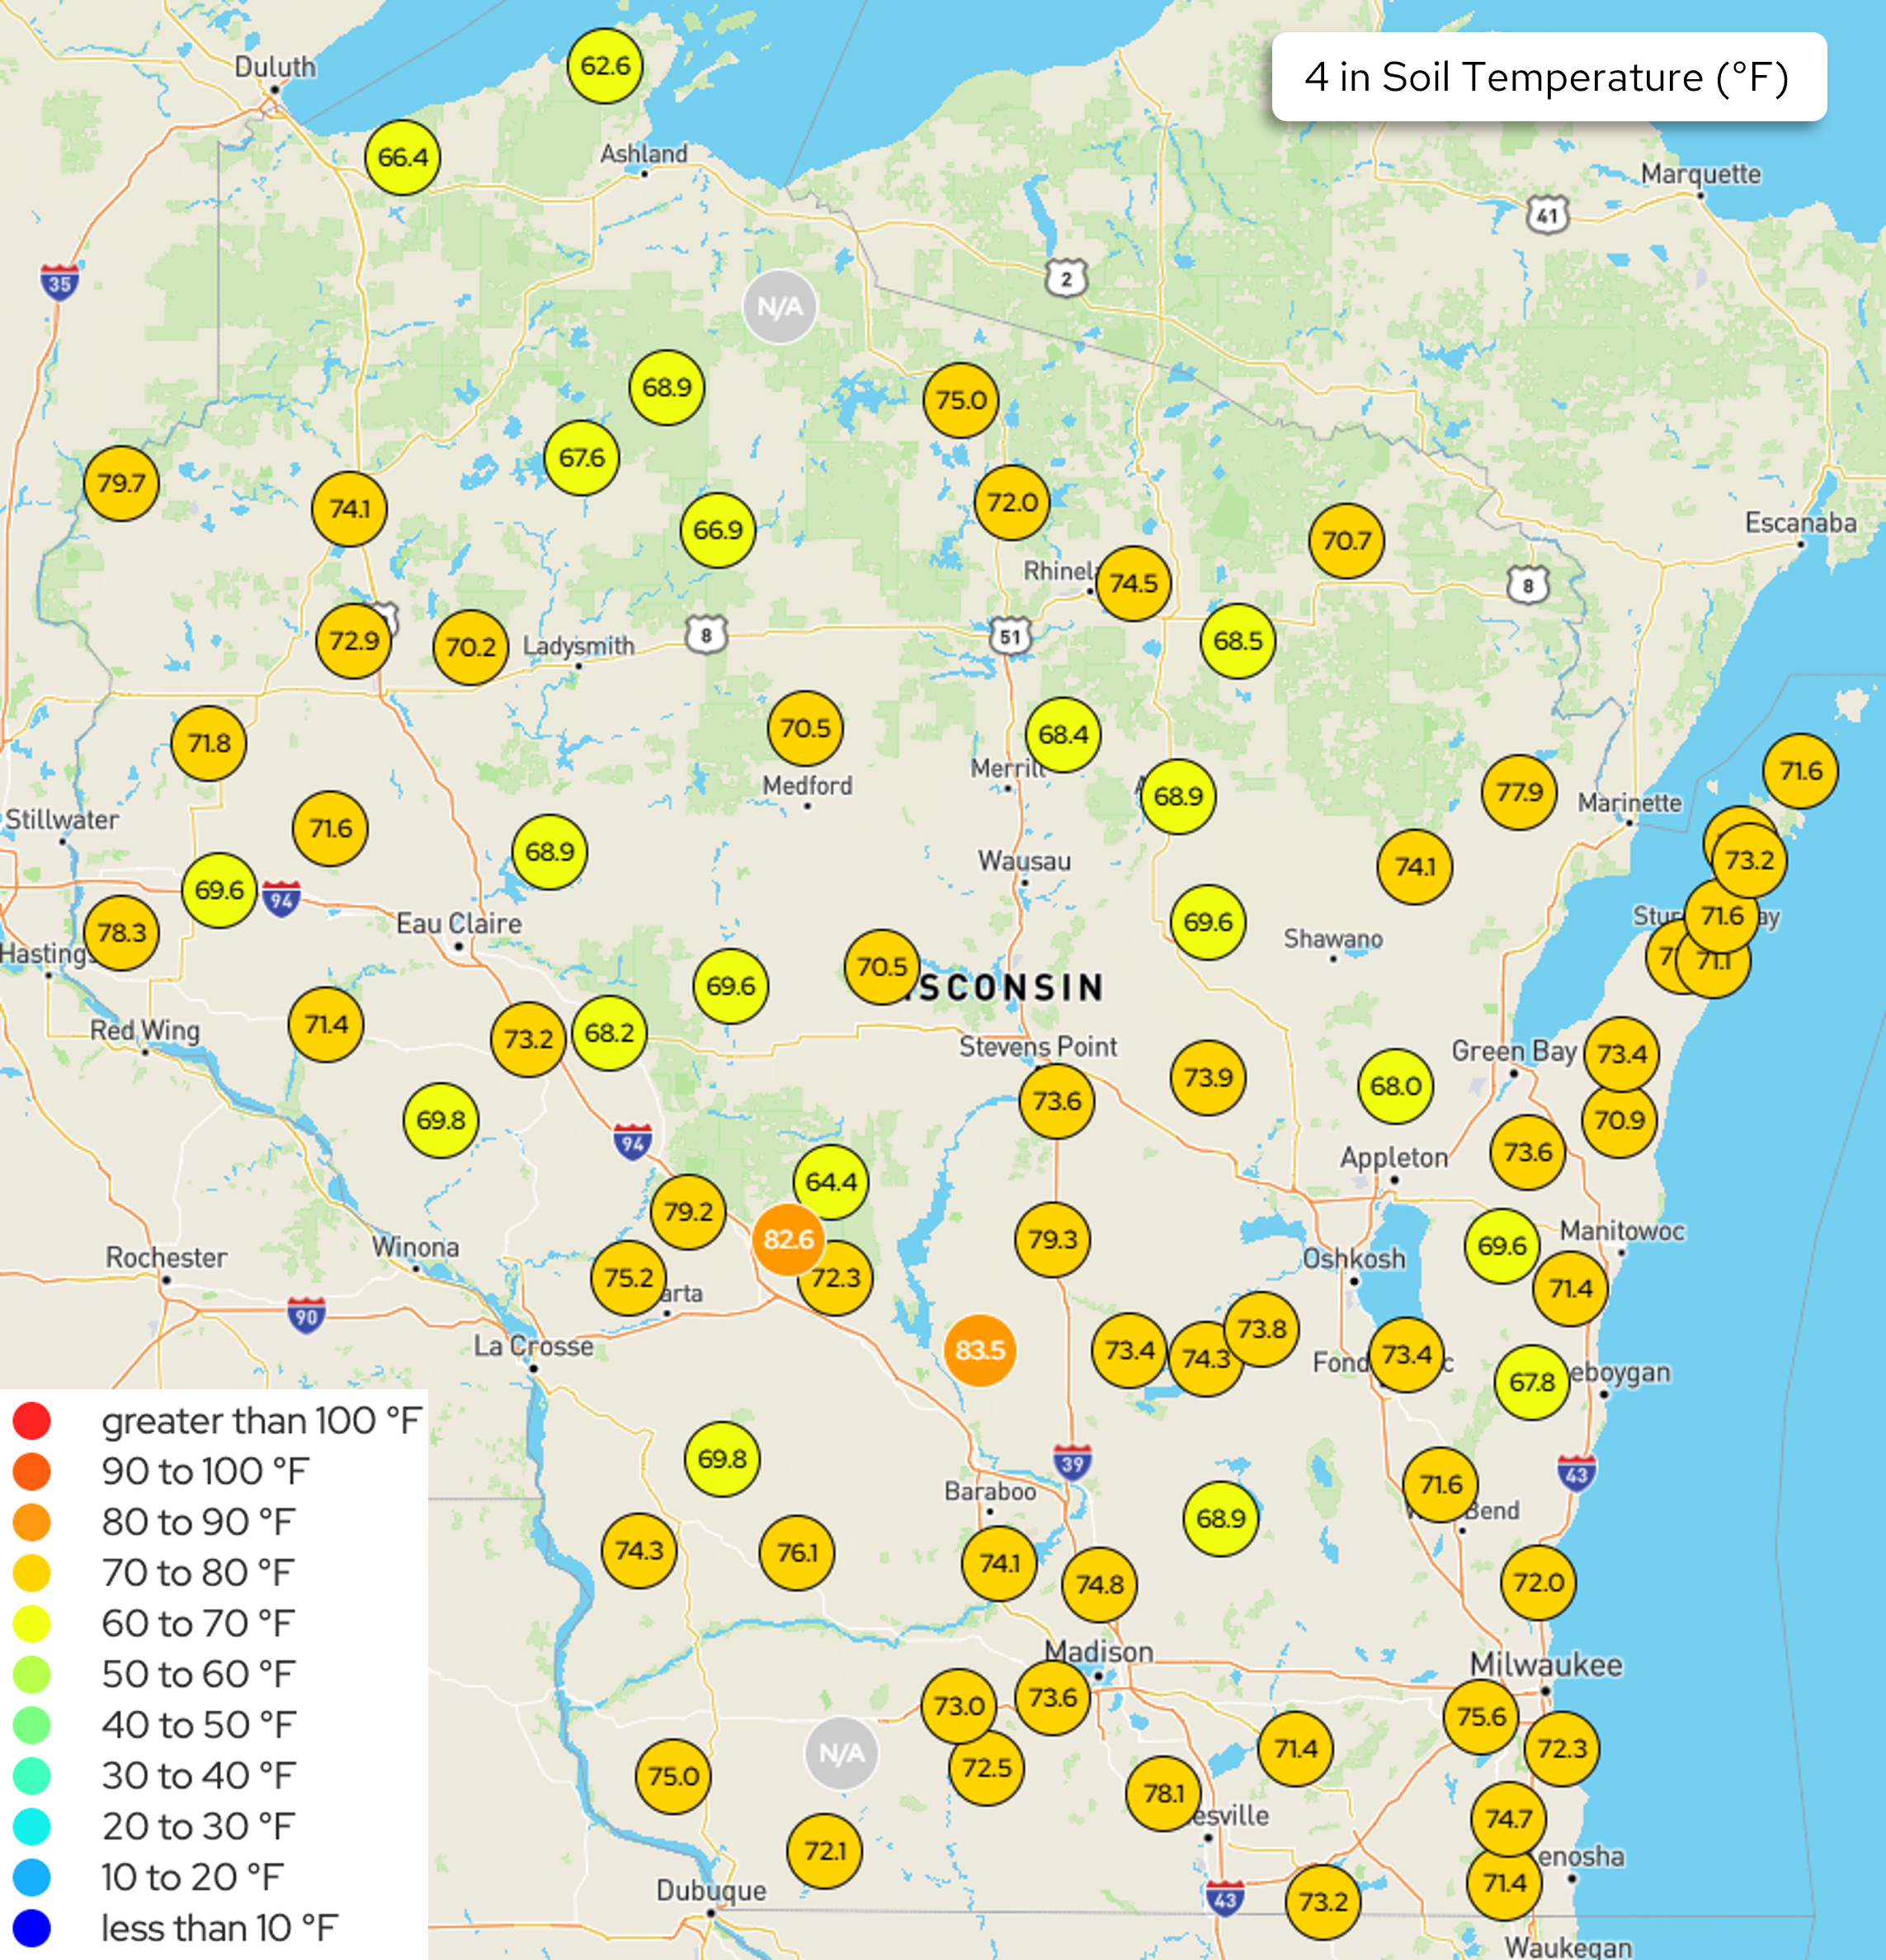
Image Description ↓
Map of Wisconsin displaying 4-inch soil temperature readings (°F) at numerous monitoring station locations across the state, using a color-coded legend from blue (less than 10°F) through green, yellow, orange, and red (greater than 100°F). Most stations show yellow (60–70°F) or gold/orange (70–80°F) readings, ranging roughly from 62.6°F in the north near Ashland to a high of 83.5°F near Baraboo/Reedsburg (shown in orange, 80–90°F range). Two stations are marked “N/A”: one near the Michigan border north of Rhinelander, and one south of Baraboo. Readings cluster in the high 60s to high 70s throughout central, western, and southeastern Wisconsin, including areas near Eau Claire, Wausau, Stevens Point, Madison, and Milwaukee, with slightly cooler readings (mid-to-high 60s) in the northern regions near Duluth and Ashland.
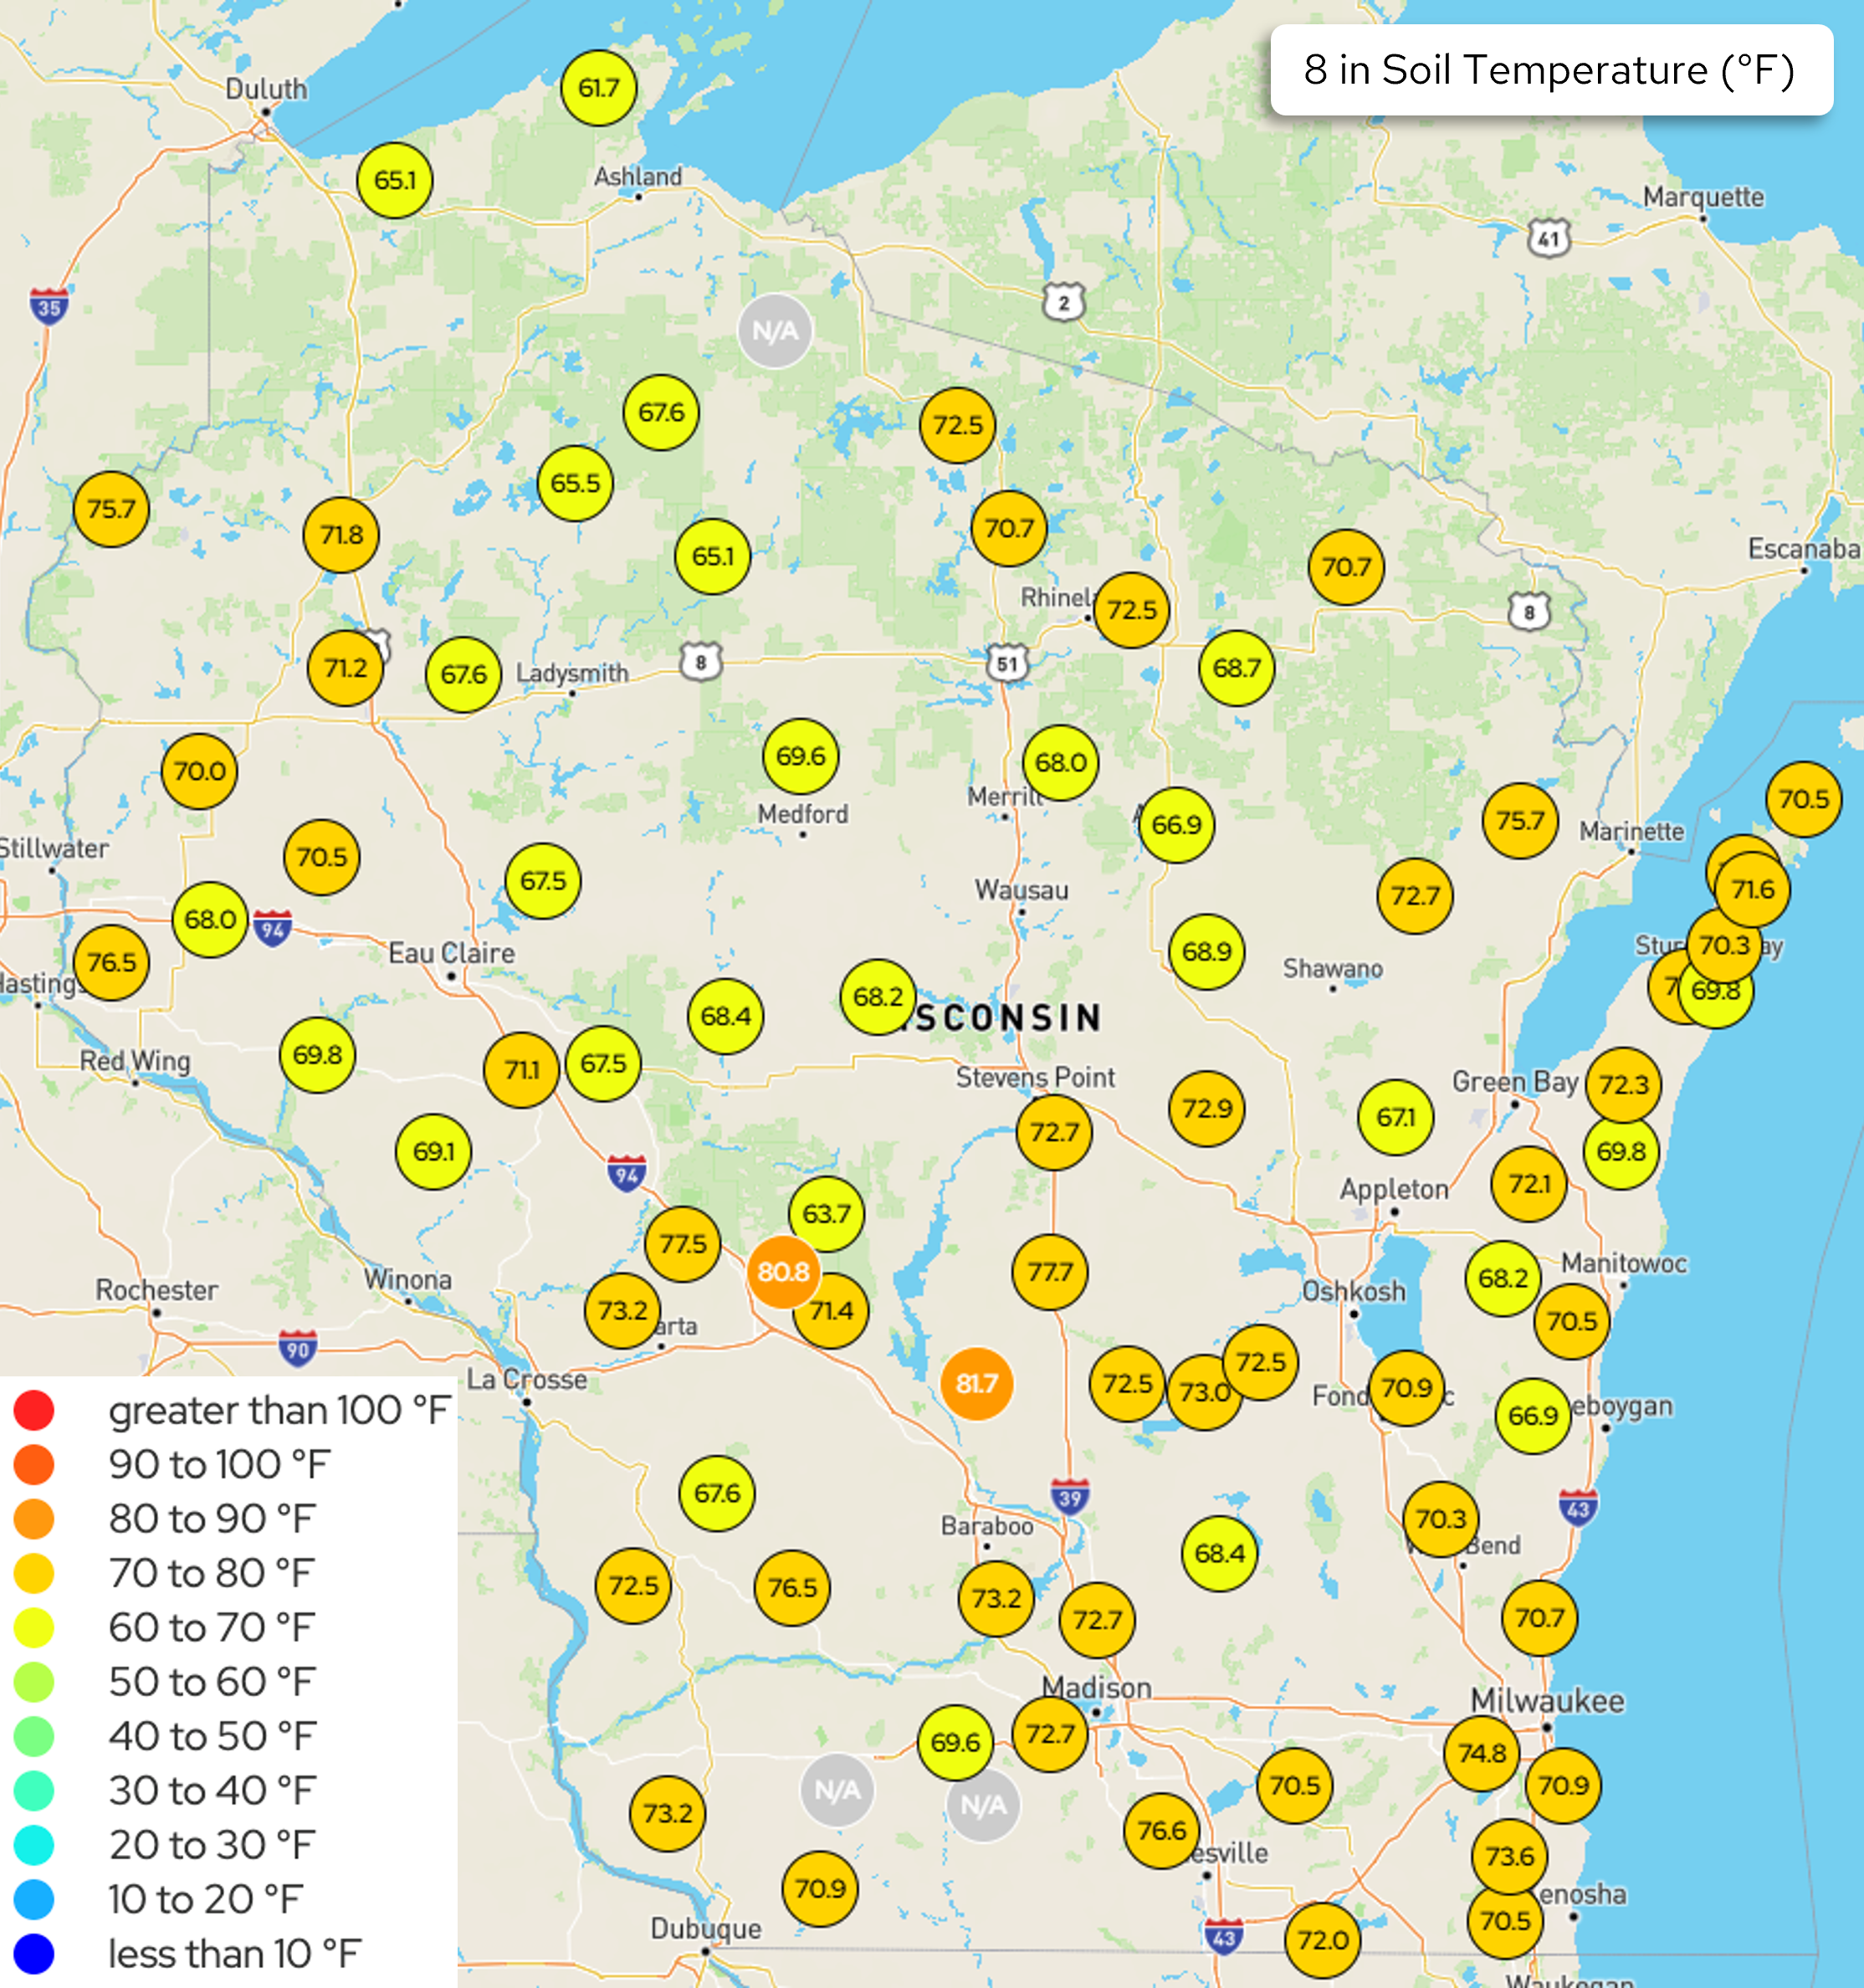
Image Description ↓
Map titled “8 in Soil Temperature (°F)” displaying numbered station readings across Wisconsin and border areas of Minnesota, Iowa, Illinois, and Michigan’s Upper Peninsula. A color-coded legend indicates ranges from less than 10°F to greater than 100°F, with actual readings ranging roughly from 61.7°F to 81.7°F. Most stations show values in the 65–77°F range (yellow to orange markers, representing the 60–70°F and 70–80°F categories). Two stations near Sparta/Tomah in west-central Wisconsin show higher readings of 80.8°F and 81.7°F (darker orange, 80–90°F category). A few stations, including two near Beloit and one south of Duluth, are marked “N/A.” Cities labeled include Duluth, Ashland, Rhinelander, Wausau, Stevens Point, Green Bay, Appleton, Oshkosh, Madison, Milwaukee, La Crosse, Eau Claire, and Dubuque, along with major highways such as I-94, I-90, I-39, I-43, and US-51.
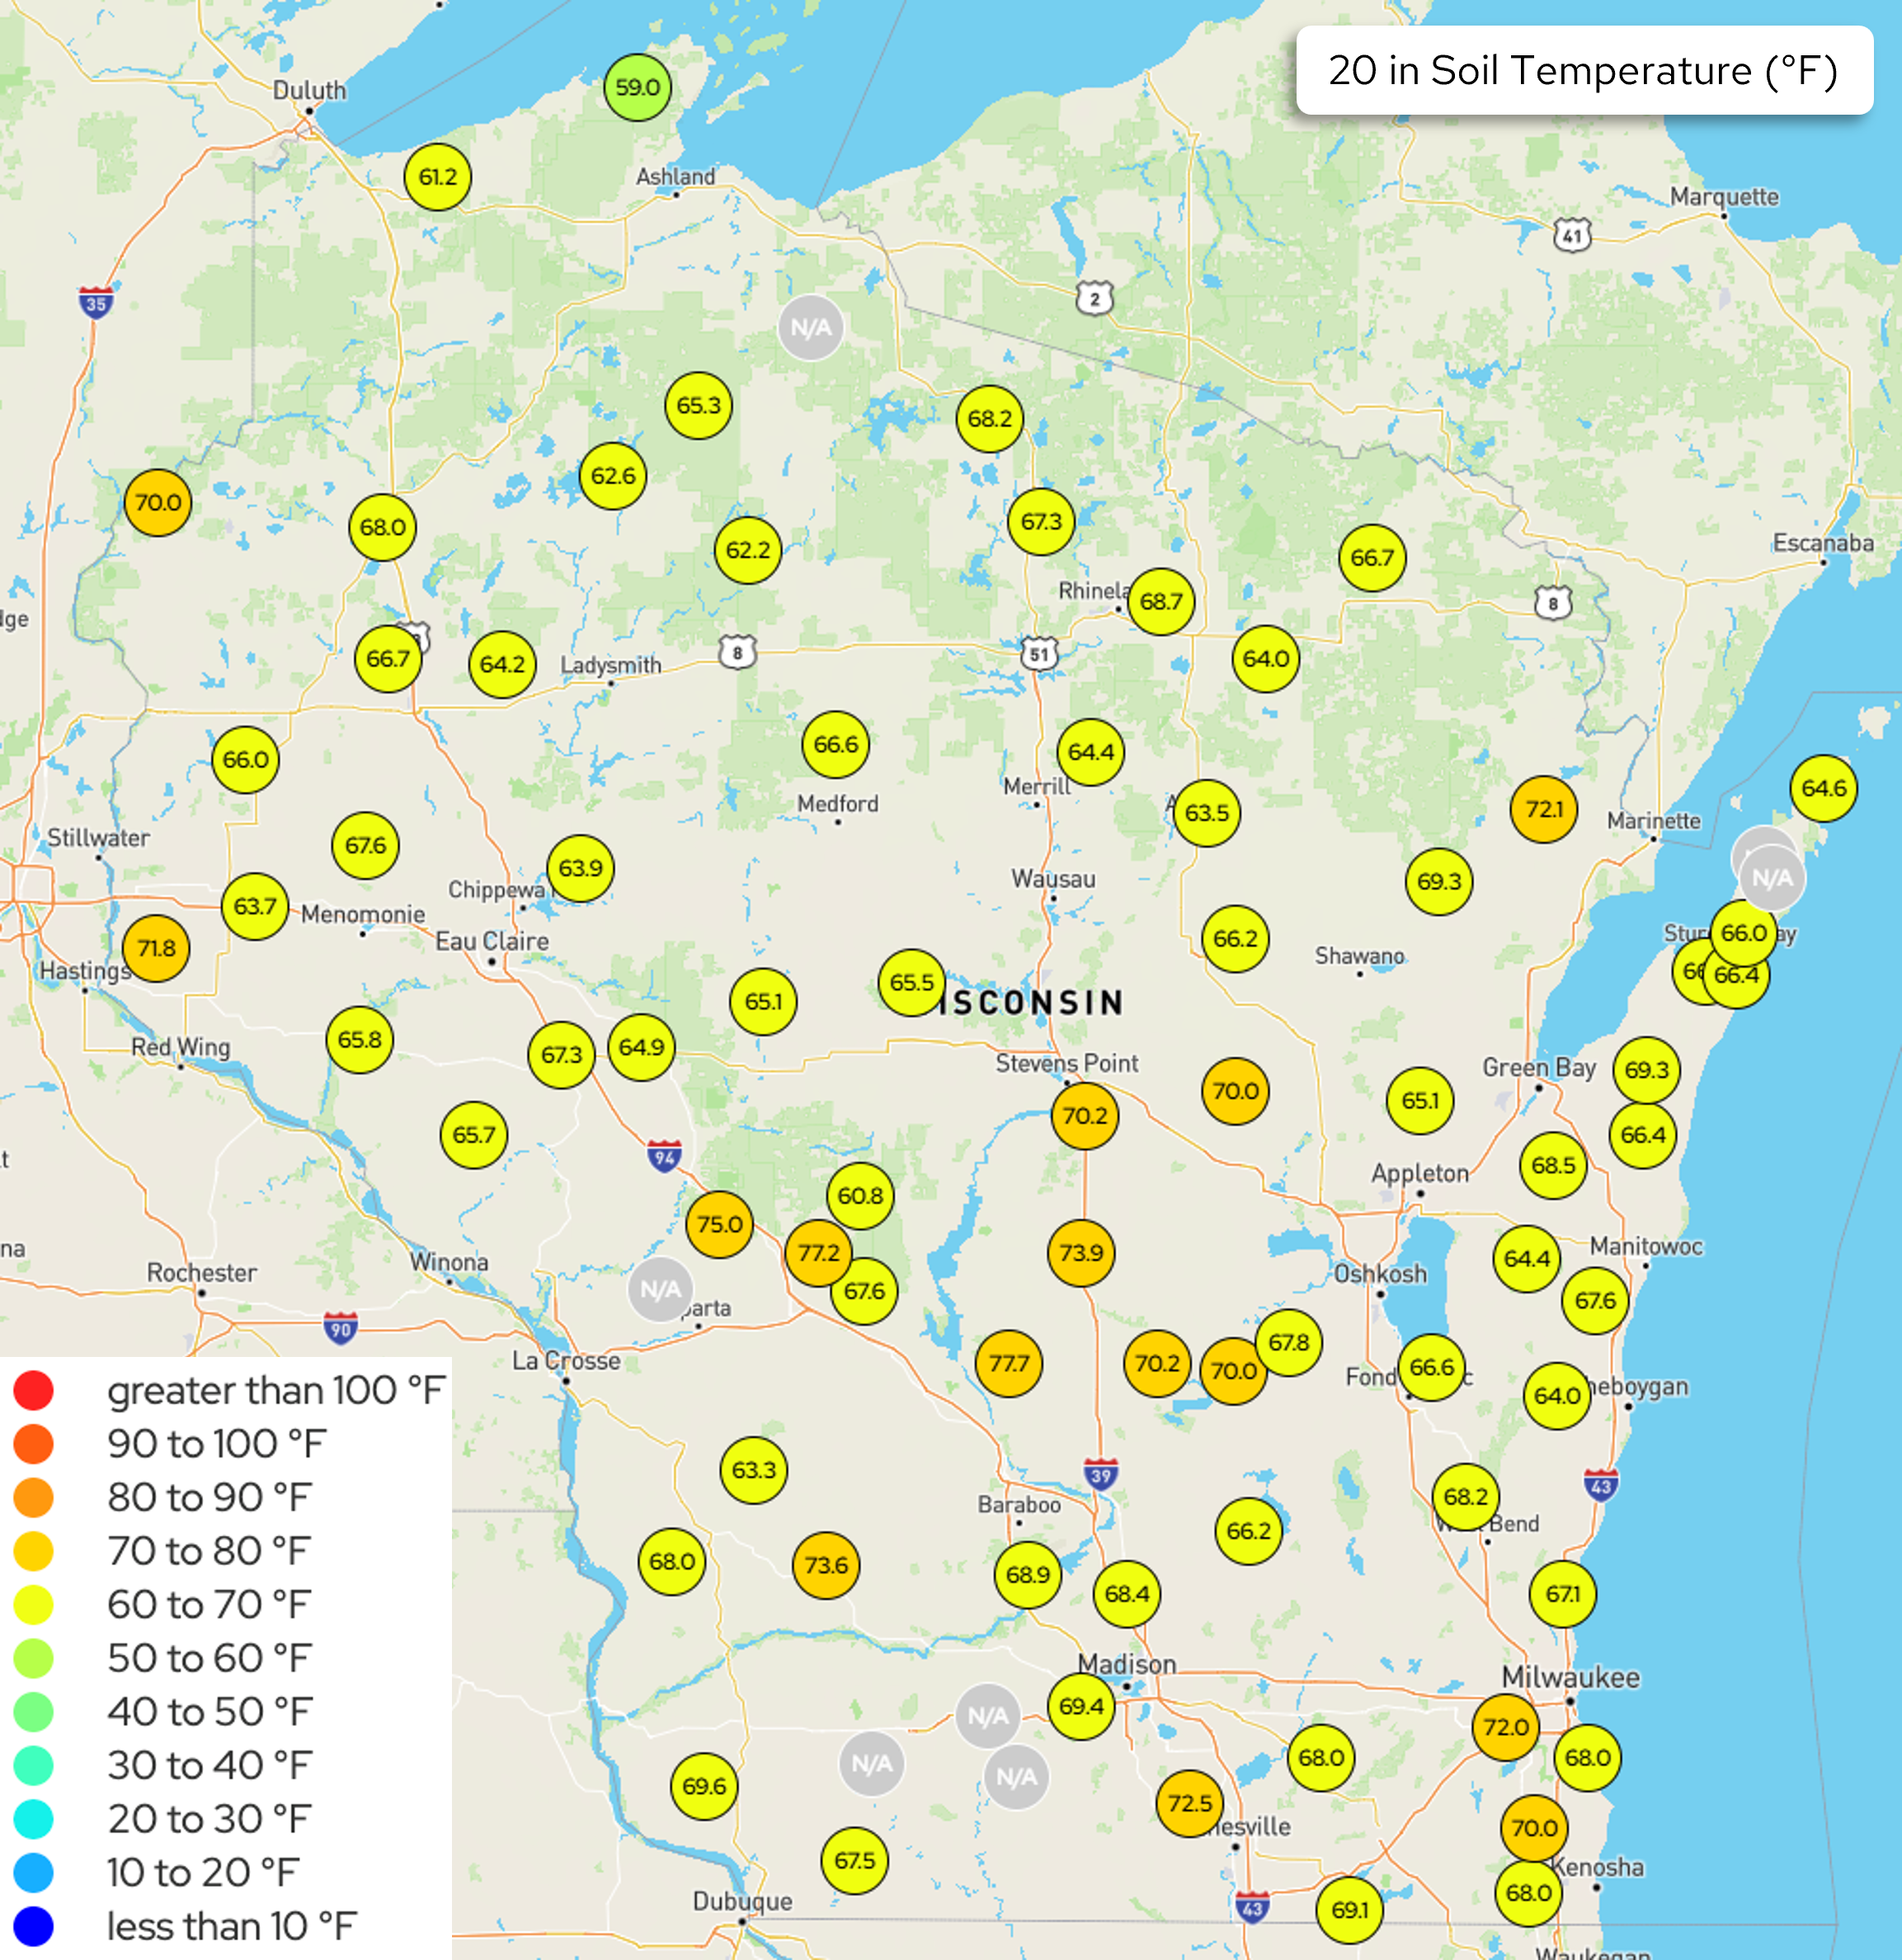
Image Description ↓
Map titled “20 in Soil Temperature (°F)” displaying numbered station readings across Wisconsin, color-coded by range per legend (blue <10°F through red >100°F). Most readings fall in the 60–70°F (yellow) range, with scattered stations in the 70–80°F (gold/orange) range concentrated in central Wisconsin near Sparta, Stevens Point, and Baraboo, where several readings exceed 73°F (e.g., 77.7, 77.2, 75.0). A single 59.0°F (green, 50–60°F range) reading appears in far northern Wisconsin near Ashland. Several stations are marked “N/A” (gray), located near Ashland, Sparta, and south of Madison. Readings span the state from Duluth/Superior in the northwest to Green Bay, Milwaukee, and Kenosha in the east and southeast.
- The maps show daily average Wisconet soil temperature conditions on July 6th
U.S. Drought Monitor
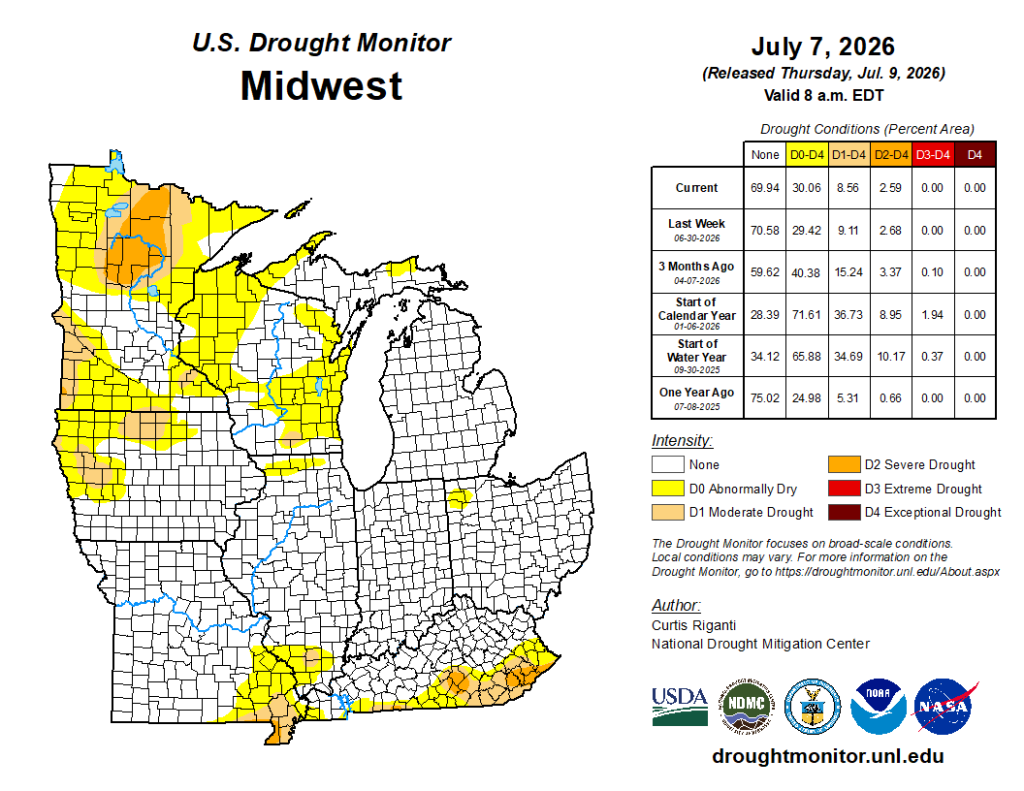
Image Description ↓
Map of the Midwest U.S. showing drought intensity by county as of July 7, 2026 (released July 9, 2026, valid 8 a.m. EDT). Most severe conditions (D2, Severe Drought) appear in north-central Minnesota and scattered areas of southern Missouri/southern Illinois border region. Widespread D0 (Abnormally Dry) and pockets of D1 (Moderate Drought) span western and central Minnesota, northern Iowa, and southern Missouri/Illinois. Ohio, Indiana, and Michigan show little to no drought. Accompanying table lists percent area by category: Currently, 69.94% of the region has no drought, 30.06% is D0-D4, 8.56% is D1-D4, 2.59% is D2-D4, and 0% is D3-D4 or D4. Comparisons show conditions have slightly worsened since last week (70.58% none) but improved significantly since the start of the calendar year (28.39% none) and start of the water year (34.12% none). One year ago, 75.02% of the region had no drought. Source: droughtmonitor.unl.edu, author Curtis Riganti, National Drought Mitigation Center, in partnership with USDA, NOAA, and NASA.
Compared to last week:
- Midwest: Minimal change (<1%) in D1-D4 coverage. 1-2 class improvements were indicated in the IA-WI-MN tri-state region.
- 91.4% of the Midwest region is drought free (~8.6% in D1-D4).
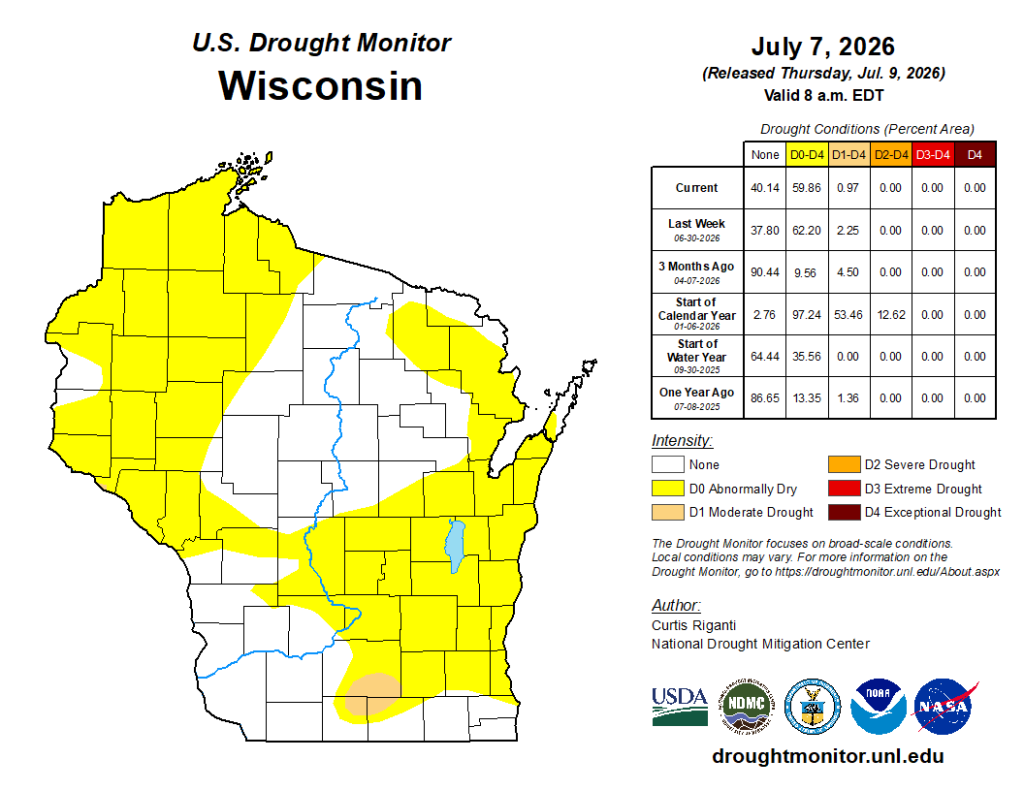
Image Description ↓
U.S. Drought Monitor map of Wisconsin dated July 7, 2026 (released Thursday, July 9, 2026, valid 8 a.m. EDT), authored by Curtis Riganti of the National Drought Mitigation Center. The map shows most of the state in “None” (white) condition, with a band of D0 Abnormally Dry (yellow) running through western, northeastern, and south-central Wisconsin, plus a small pocket of D1 Moderate Drought (tan) in south-central Wisconsin near the Illinois border. No areas show D2 Severe, D3 Extreme, or D4 Exceptional drought.
A data table lists drought conditions as percent of area over time:
- Current (07-07-2026): None 40.14%, D0-D4 59.86%, D1-D4 0.97%, D2-D4 0.00%, D3-D4 0.00%, D4 0.00%
- Last Week (06-30-2026): None 37.80%, D0-D4 62.20%, D1-D4 2.25%, D2-D4 0.00%, D3-D4 0.00%, D4 0.00%
- 3 Months Ago (04-07-2026): None 90.44%, D0-D4 9.56%, D1-D4 4.50%, D2-D4 0.00%, D3-D4 0.00%, D4 0.00%
- Start of Calendar Year (01-06-2026): None 2.76%, D0-D4 97.24%, D1-D4 53.46%, D2-D4 12.62%, D3-D4 0.00%, D4 0.00%
- Start of Water Year (09-30-2025): None 64.44%, D0-D4 35.56%, D1-D4 0.00%, D2-D4 0.00%, D3-D4 0.00%, D4 0.00%
- One Year Ago (07-08-2025): None 86.65%, D0-D4 13.35%, D1-D4 1.36%, D2-D4 0.00%, D3-D4 0.00%, D4 0.00%
Logos for USDA, NDMC, a federal seal, NOAA, and NASA appear at the bottom, along with the source URL droughtmonitor.unl.edu.
- Wisconsin: D1 drought remains south of Madison
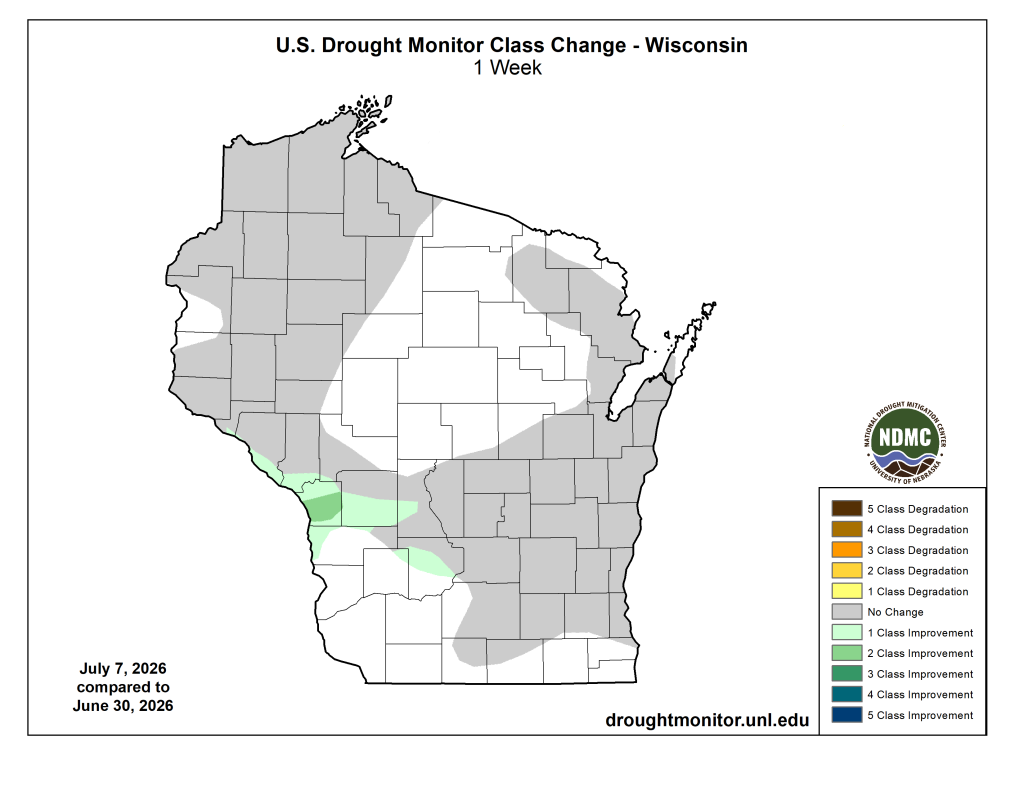
Image Description ↓
Map titled “U.S. Drought Monitor Class Change – Wisconsin, 1 Week,” comparing July 7, 2026 to June 30, 2026, from droughtmonitor.unl.edu (NDMC/University of Nebraska). A diagonal gray band running from the northwest corner through the central-east and into the southeast shows “No Change.” The rest of the state (central, north, and southwest) is unshaded, indicating no drought designation. A cluster of green shading in the southwest, roughly around Vernon, Crawford, and Richland counties, indicates improvement: light green areas show 1 Class Improvement, and a darker green patch shows 2-3 Class Improvement. No areas show degradation. Legend at right lists categories from 5 Class Degradation (dark brown) through No Change (gray) to 5 Class Improvement (dark blue), with only “No Change” and the improvement categories (1-3 class) appearing on this map.
- Wisconsin: 1-2 class improvement in the La Crosse area. D1 was eliminated in the La Crosse area, but the region of D1 south of Madison persists.
U.S. Drought Monitor Time Series
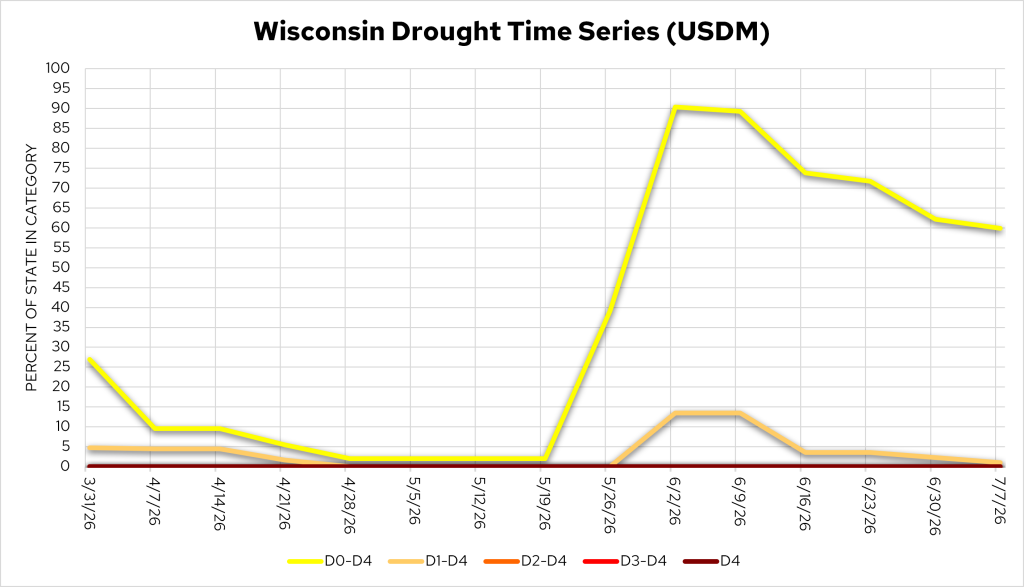
Image Description ↓
Line chart titled “Wisconsin Drought Time Series (USDM),” y-axis “Percent of State in Category” (0–100), x-axis dates weekly from 3/31/26 to 7/7/26. Five lines: D0-D4 (yellow), D1-D4 (tan), D2-D4 (orange), D3-D4 (red), D4 (dark red). D0-D4 starts at 27% (3/31), drops to about 9% (4/7–4/14), declines to near 2% by 4/28, stays flat near 2% through 5/19, then rises sharply to about 90% by 6/2, holds near 89% through 6/9, declines to about 73% by 6/16, stays near 71–73% through 6/23, drops to about 61% by 6/30, and ends near 60% on 7/7. D1-D4 starts near 5%, declines to near 0% by late April, stays near 0 through late May, rises to about 13% by 6/2, holds through 6/9, then declines to about 3–4% by 6/16 through 7/7. D2-D4, D3-D4, and D4 remain at or near 0% throughout the entire period.
- D0 coverage = 59.9%; D1 coverage = 1.0%
Temperature Trends
7 Day Temperatures
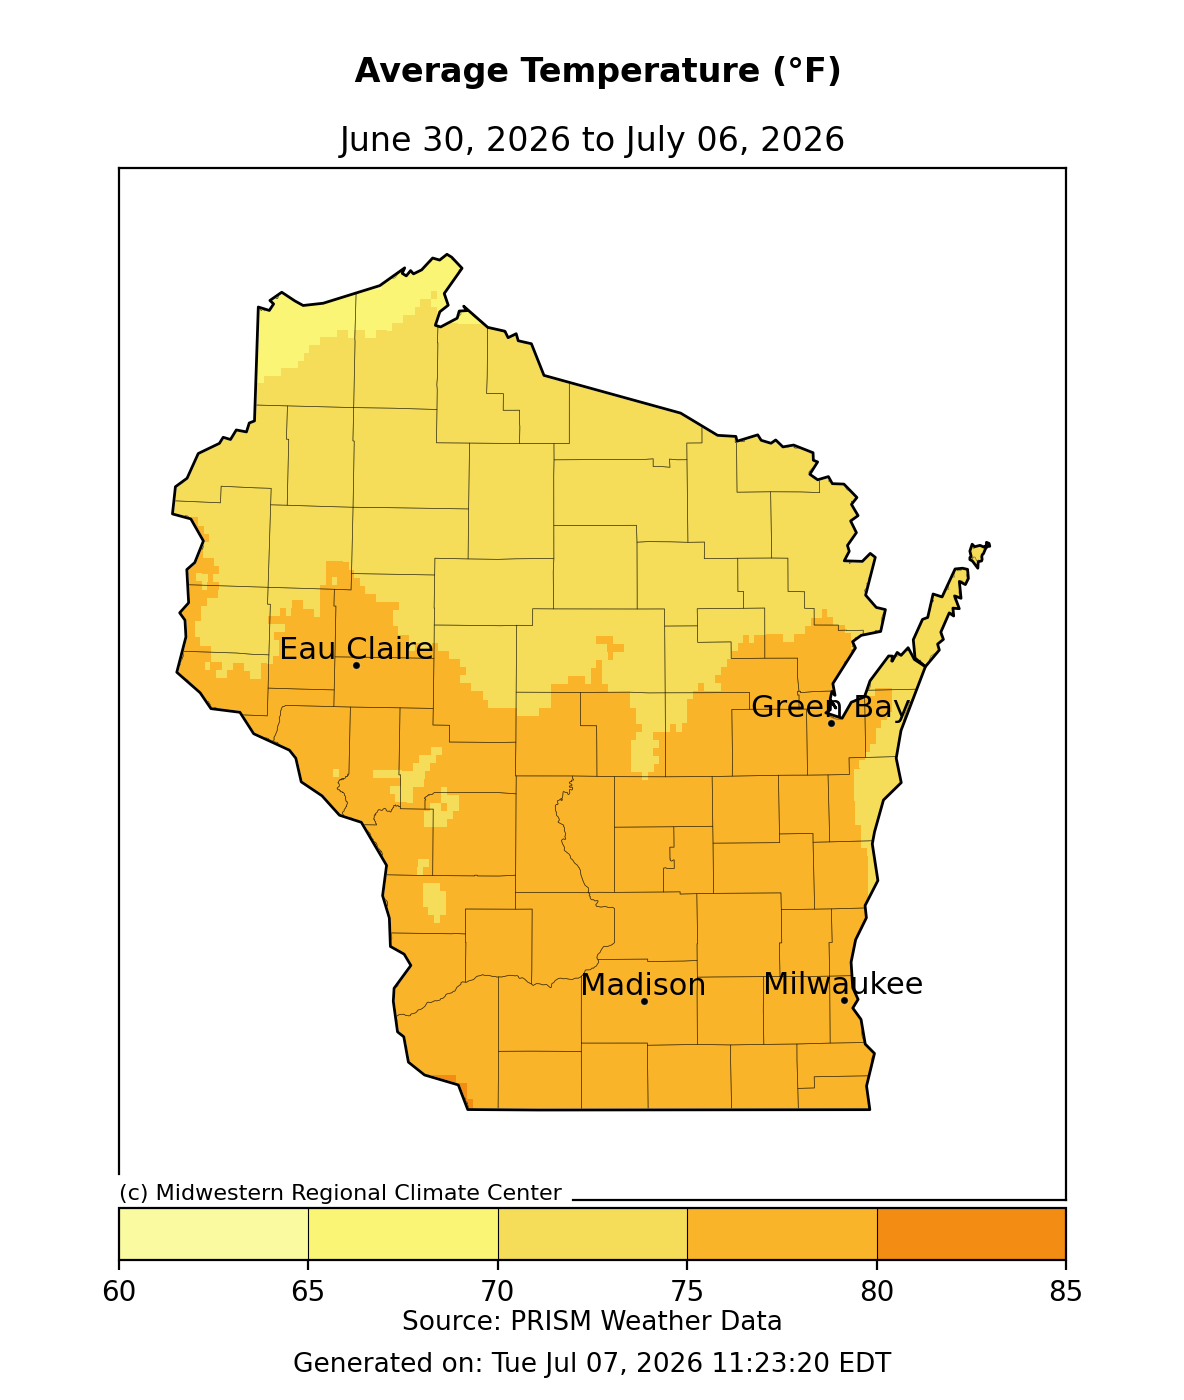
Image Description ↓
Choropleth map of Wisconsin titled “Average Temperature (°F), June 30, 2026 to July 06, 2026,” source PRISM Weather Data, credit Midwestern Regional Climate Center, generated July 7, 2026. Color scale ranges from 60°F (pale yellow) to 85°F (dark orange) in 5-degree increments. Northern Wisconsin shows 65-70°F, with far northern areas near 60-65°F. Central Wisconsin, including Eau Claire and Green Bay, ranges 70-75°F with scattered 75-80°F pockets. Southern Wisconsin, including Madison and Milwaukee, shows predominantly 75-80°F across most counties, with small isolated areas reaching 80-85°F. Four cities are marked with labeled points: Eau Claire, Green Bay, Madison, and Milwaukee.
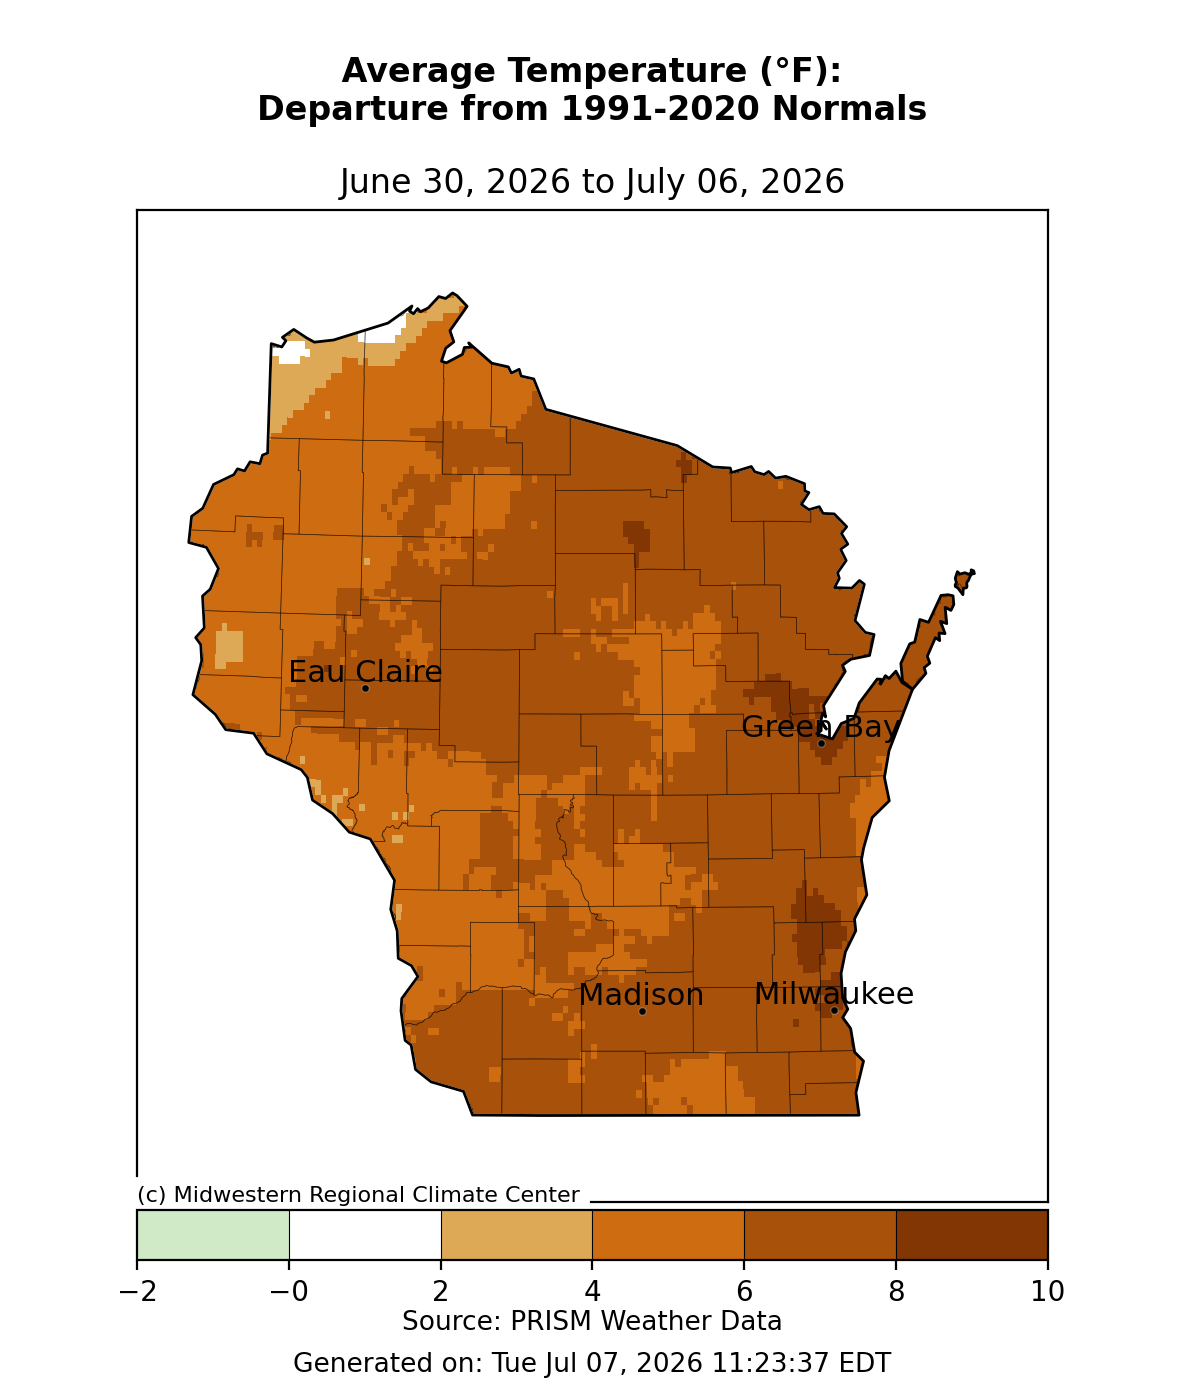
Image Description ↓
Choropleth map titled “Average Temperature (°F): Departure from 1991-2020 Normals, June 30, 2026 to July 06, 2026,” sourced from PRISM Weather Data via the Midwestern Regional Climate Center. Most of Wisconsin shows temperatures 4-8°F above the 1991-2020 normal (orange to dark brown shading), with isolated pockets exceeding 8°F near Green Bay and south-central Wisconsin. The far northwestern corner of the state (near Lake Superior) shows near-normal to slightly below-normal temperatures (white to light tan shading, roughly -2 to 2°F). Cities labeled: Eau Claire, Green Bay, Madison, and Milwaukee. Legend ranges from -2°F (light green) to 10°F (dark brown). Generated Tue Jul 07, 2026, 11:23:37 EDT.
- Average temperature ranged from 75-80°F in the southern half of the state; to 70-75°F in the northern half (cooler along Lake Superior).
- Temperatures were 4-8°F above normal across most of the state, with the eastern side of the state being the most above normal (6-10°F).
- Extreme heat (June 29 – July 1): Wisconet stations across the state recorded daily maximum heat indices topping 100°F! Check out how hot it got in your neck of the woods.
30 Day Temperatures
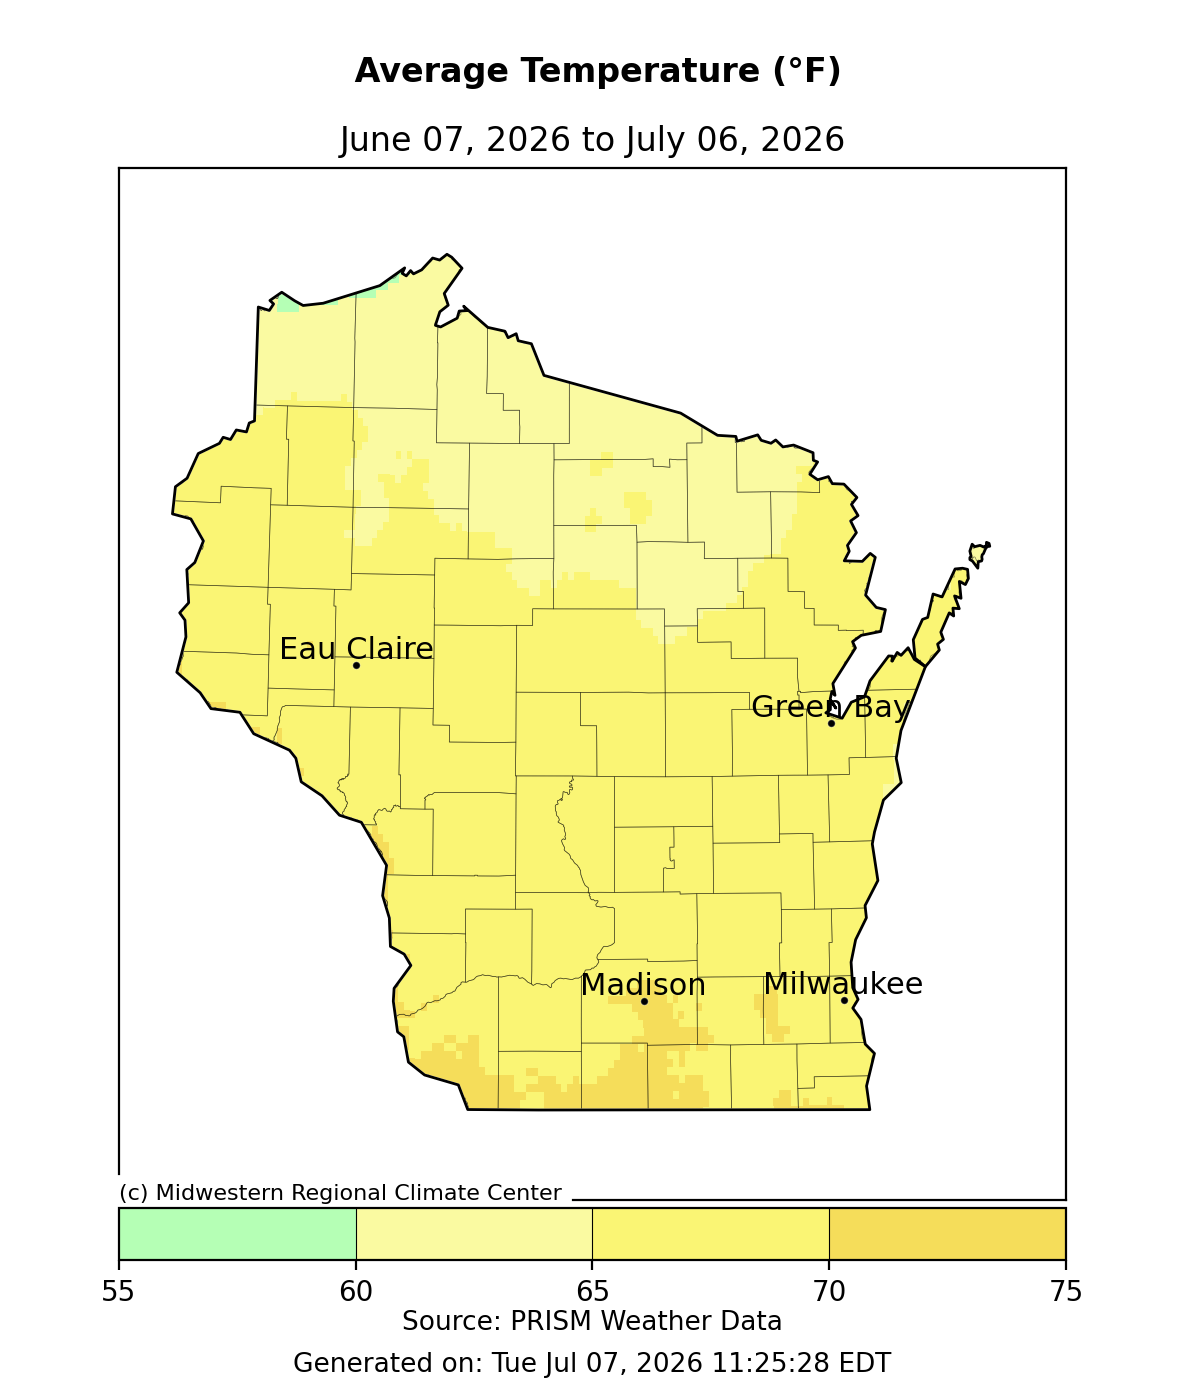
Image Description ↓
Choropleth map titled “Average Temperature (°F), June 07, 2026 to July 06, 2026,” sourced from PRISM Weather Data via the Midwestern Regional Climate Center. Most of Wisconsin shows 65–70°F (yellow), with scattered areas of 70–75°F (darker gold) in the south-central region near Madison and along parts of the Lake Michigan shoreline near Green Bay and Milwaukee. A small area of 60–65°F (pale yellow) appears in the north-central region, and a small strip of 55–60°F (green) appears at the far northern border. Eau Claire, Madison, Milwaukee, and Green Bay are marked with dots and labels. A color scale legend at the bottom ranges from 55°F to 75°F. Generated Tue Jul 07, 2026, 11:25:28 EDT.
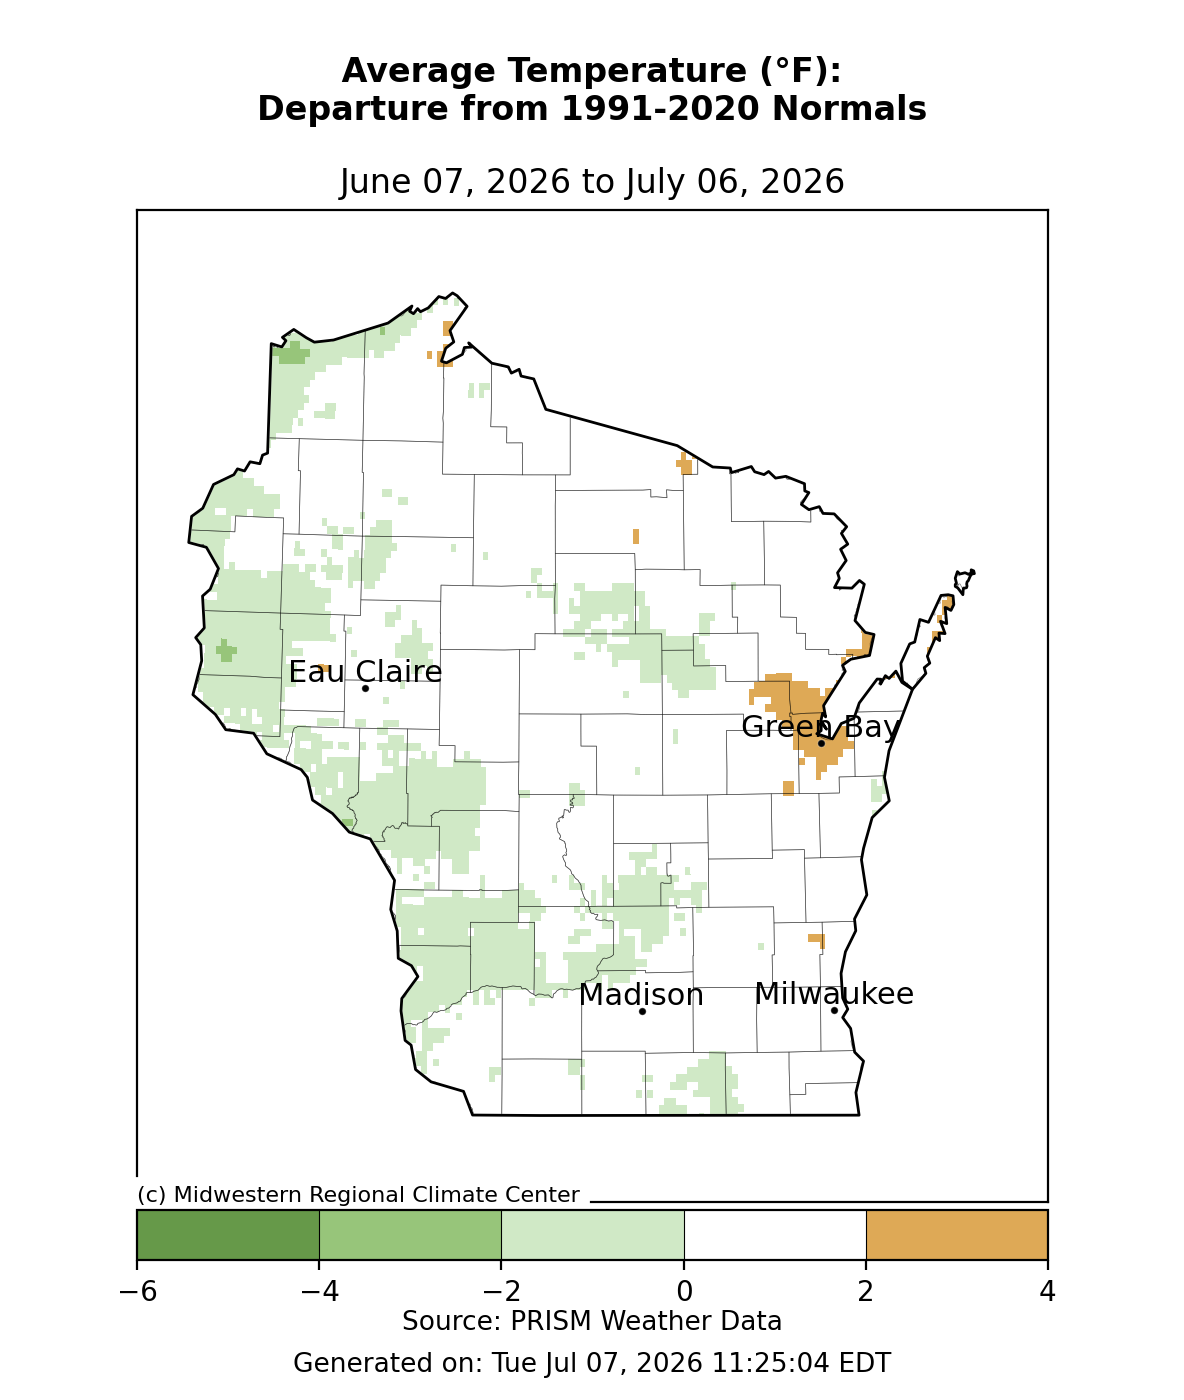
Image Description ↓
Choropleth map titled “Average Temperature (°F): Departure from 1991-2020 Normals,” dated June 07, 2026 to July 06, 2026, source PRISM Weather Data, generated Tue Jul 07, 2026 11:25:04 EDT, credited to the Midwestern Regional Climate Center. The map shows Wisconsin with county boundaries and four labeled cities: Eau Claire, Green Bay, Madison, and Milwaukee. A color scale ranges from dark green (-6°F) through light green, white (0°F), to orange (+4°F). Most of the state appears white to light green, indicating near-normal to slightly below-normal temperatures, with light green patches scattered across the western, central, and southern counties. A concentrated orange area of 2–4°F above normal appears along the Lake Michigan shoreline near Green Bay, with smaller scattered orange patches near the Door Peninsula and a few isolated spots elsewhere in the state.
Growing Degree Days (Base 50°F)
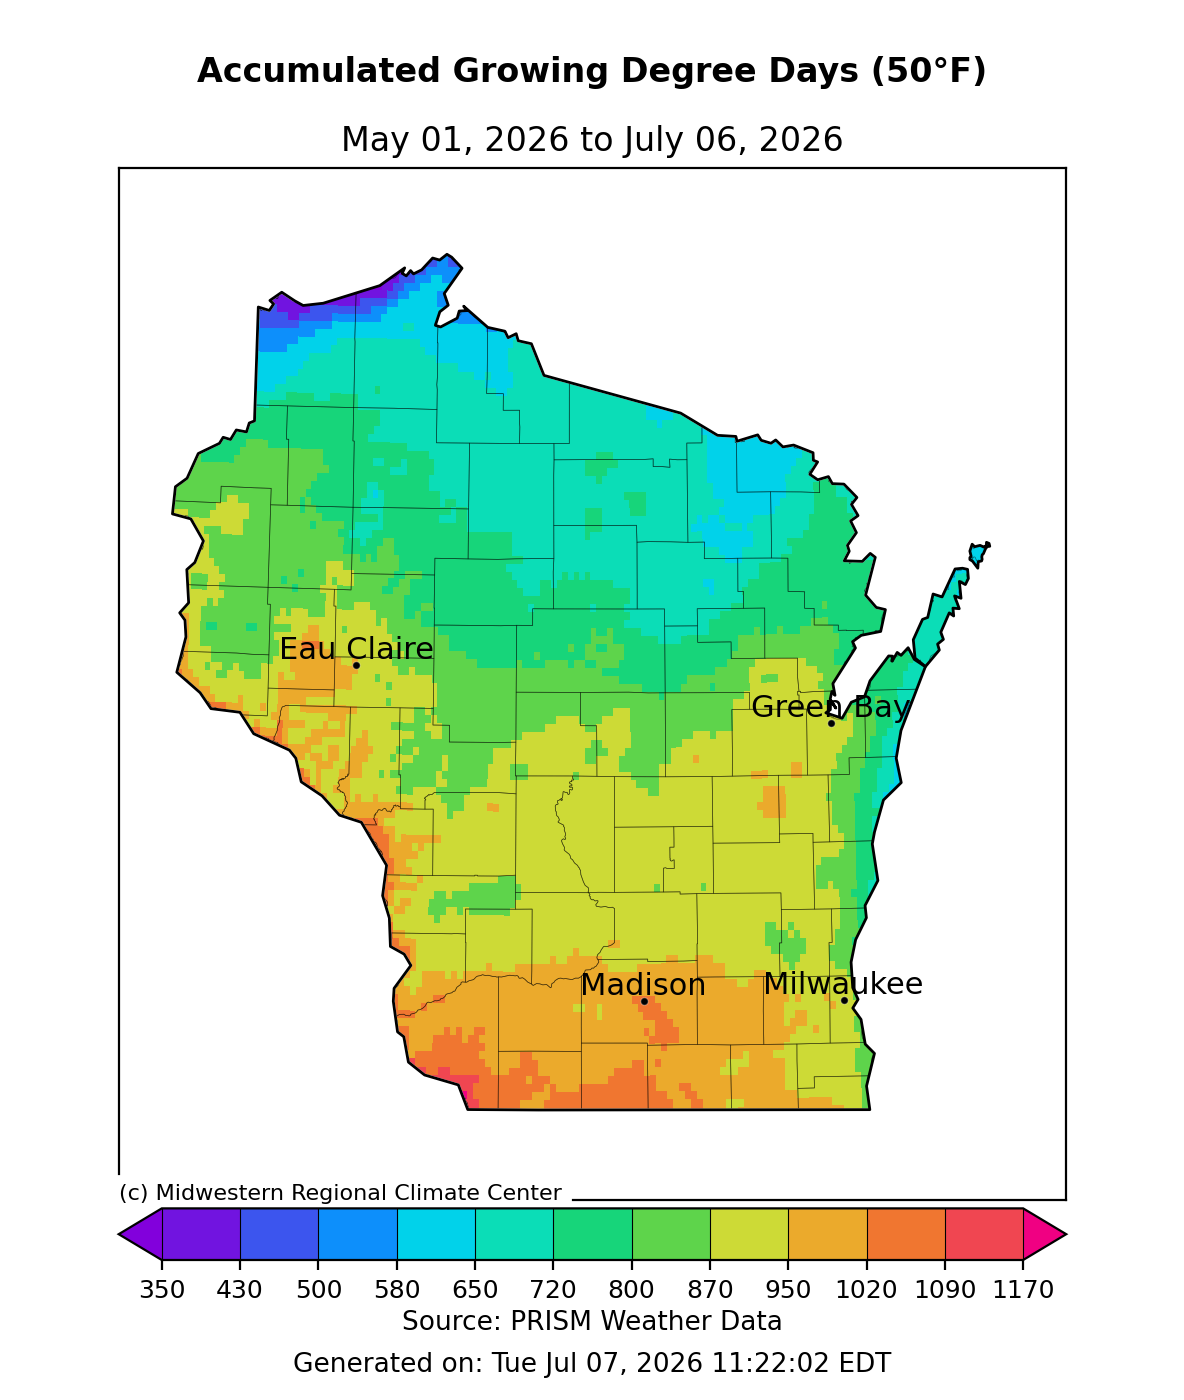
Image Description ↓
Choropleth map titled “Accumulated Growing Degree Days (50°F), May 01, 2026 to July 06, 2026,” sourced from PRISM Weather Data via the Midwestern Regional Climate Center, generated Jul 07, 2026. Color scale ranges from 350 (purple, lowest) to 1170+ (pink/red, highest) GDD. Far northern Wisconsin shows the lowest accumulation (350–500, purple/blue). Central and northeastern Wisconsin show moderate accumulation (580–800, teal/green). Southern Wisconsin shows the highest accumulation (870–1090+, yellow/orange/red), with the warmest pockets in the far south-central and southwestern counties. Four cities are labeled with markers: Eau Claire (west-central, ~700–800 GDD), Green Bay (northeast, ~800–870 GDD), Madison (south-central, ~950–1020 GDD), and Milwaukee (southeast, ~950–1020 GDD).
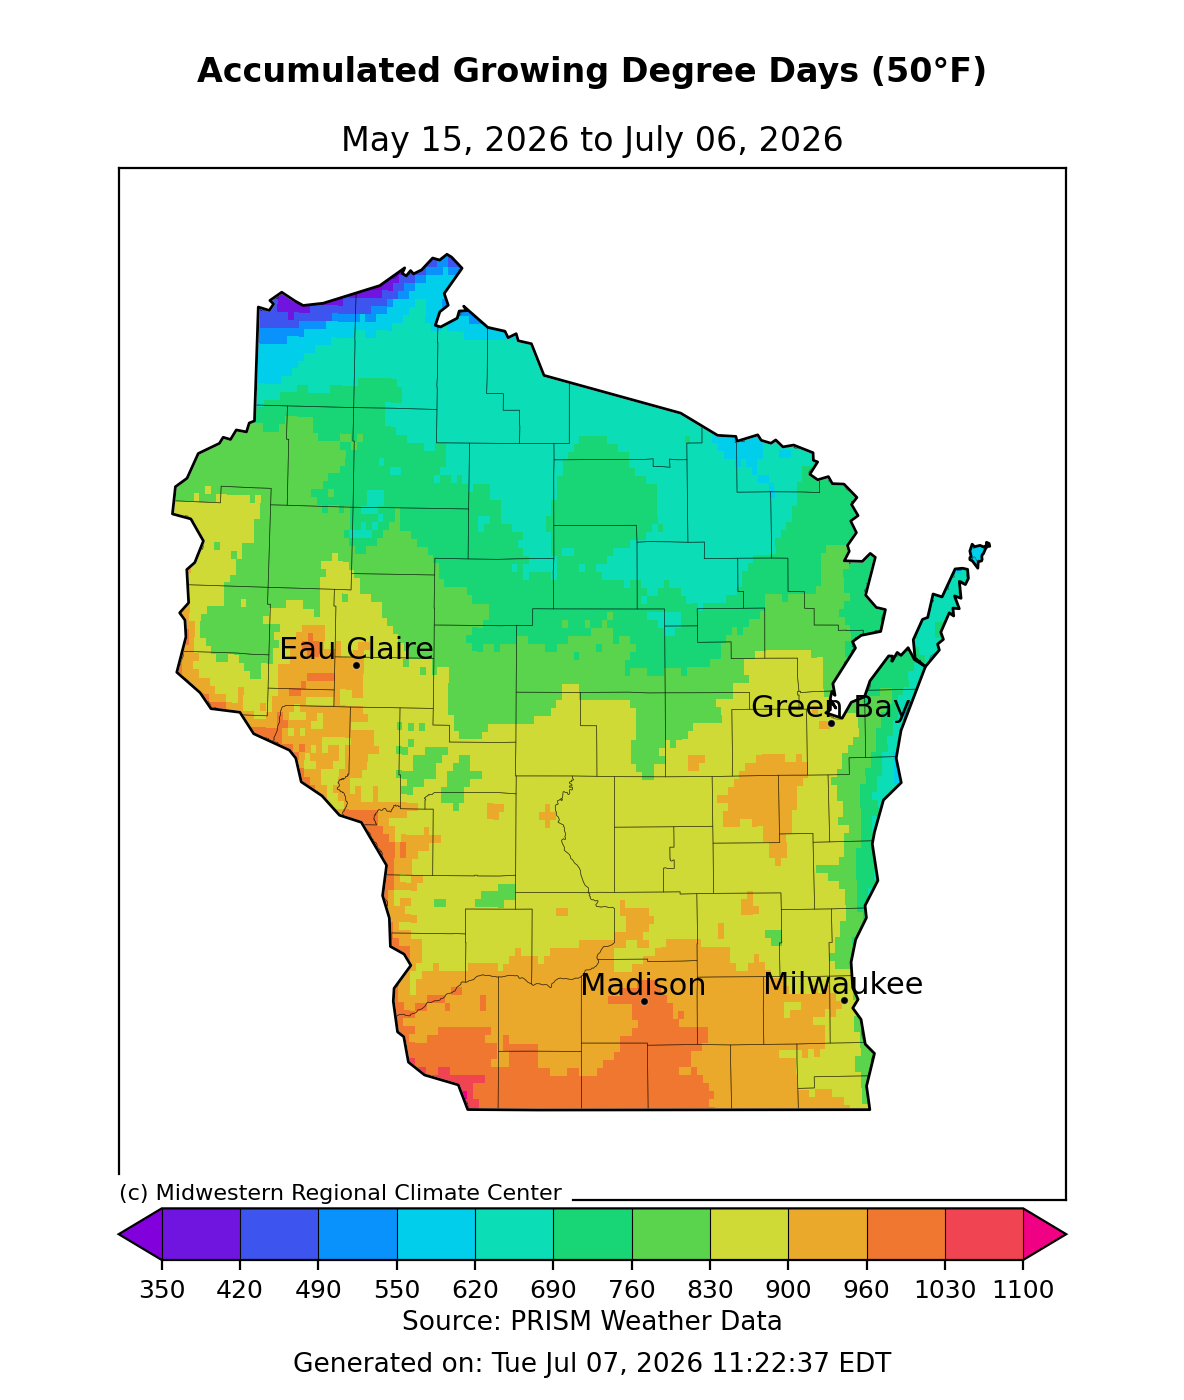
Image Description ↓
Choropleth map titled “Accumulated Growing Degree Days (50°F), May 15, 2026 to July 06, 2026,” sourced from PRISM Weather Data via the Midwestern Regional Climate Center, generated Jul 07, 2026. County boundaries are outlined, with four cities marked: Eau Claire, Green Bay, Madison, and Milwaukee. A color scale ranges from 350 GDD (dark purple) to 1100 GDD (magenta/pink) in increments of 70. The northern tip of the state shows the lowest accumulation (dark purple to blue, roughly 350–550 GDD). Central and northeastern Wisconsin, including areas near Green Bay, show moderate accumulation (teal to green, roughly 550–830 GDD). Southern Wisconsin, including areas around Madison, Eau Claire, and Milwaukee, shows the highest accumulation (yellow to orange, roughly 830–1030 GDD), with localized orange patches near Eau Claire and south-central counties indicating values approaching 1000 GDD or higher.
- Starting May 1 – Growing degree day accumulation ranges from 1090 GDD in the far south and west to 720 GDD in the far north. These values are 105-110% of normal.
- Starting May 15 – Growing degree day accumulation ranges from 1030 GDD in the far south and west to 620 GDD in the far north. These values are 110-115% of normal.
Crop Progress and Condition
Crop Progress Report for Corn
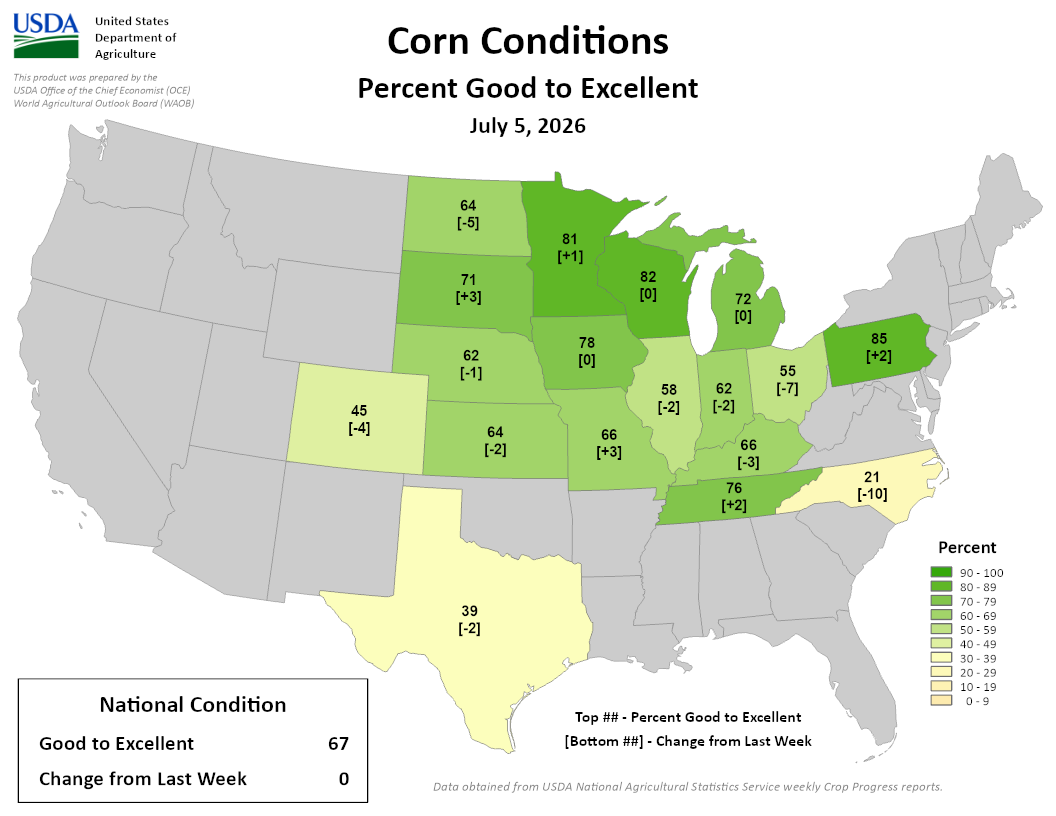
Image Description ↓
Choropleth map of the continental United States titled “Corn Conditions, Percent Good to Excellent, July 5, 2026,” prepared by USDA’s Office of the Chief Economist. Green shading darkens with higher percentages, per a legend ranging from 0–9 (lightest tan) to 90–100 (darkest green). Each shaded state shows a percentage and its change from the prior week in brackets:
- Minnesota: 81 [+1]
- Wisconsin: 82 [0]
- Michigan: 72 [0]
- Pennsylvania: 85 [+2]
- North Dakota: 64 [-5]
- South Dakota: 71 [+3]
- Nebraska: 62 [-1]
- Iowa: 78 [0]
- Illinois: 58 [-2]
- Indiana: 62 [-2]
- Ohio: 55 [-7]
- Kansas: 64 [-2]
- Missouri: 66 [+3]
- Kentucky: 66 [-3]
- Tennessee: 76 [+2]
- North Carolina: 21 [-10]
- Colorado: 45 [-4]
- Texas: 39 [-2]
States without data are shown in gray. A box in the lower left reports the National Condition: 67% good to excellent, with 0 change from the prior week. A note at the bottom states data is from USDA National Agricultural Statistics Service weekly Crop Progress reports.
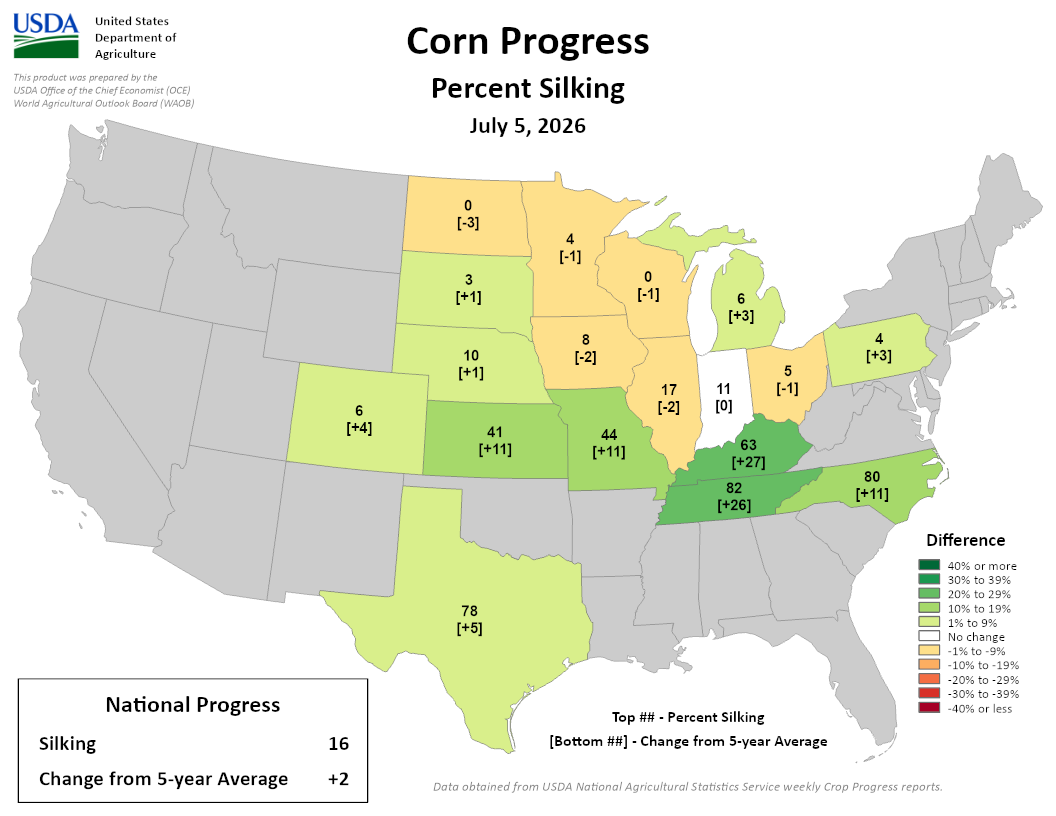
Image Description ↓
USDA choropleth map titled “Corn Progress: Percent Silking, July 5, 2026,” prepared by USDA Office of the Chief Economist and World Agricultural Outlook Board. Each state is shaded by its difference from the 5-year average and labeled with percent silking (top number) and change from average in brackets (bottom number).
State values (percent silking [change from 5-year average]):
North Dakota: 0 [-3]
Minnesota: 4 [-1]
South Dakota: 3 [+1]
Wisconsin: 0 [-1]
Michigan: 6 [+3]
Nebraska: 10 [+1]
Iowa: 8 [-2]
Illinois: 17 [-2]
Indiana: 11 [0]
Ohio: 5 [-1]
Pennsylvania: 4 [+3]
Colorado: 6 [+4]
Kansas: 41 [+11]
Missouri: 44 [+11]
Kentucky: 63 [+27]
Tennessee: 82 [+26]
North Carolina: 80 [+11]
Texas: 78 [+5]
States not reported are shown in gray. The color scale ranges from dark red (-40% or less) through orange/yellow (negative differences), white (no change), to shades of green (positive differences up to 40% or more).
National summary: Silking at 16%, up 2 percentage points from the 5-year average.
Source note: Data obtained from USDA National Agricultural Statistics Service weekly Crop Progress reports.
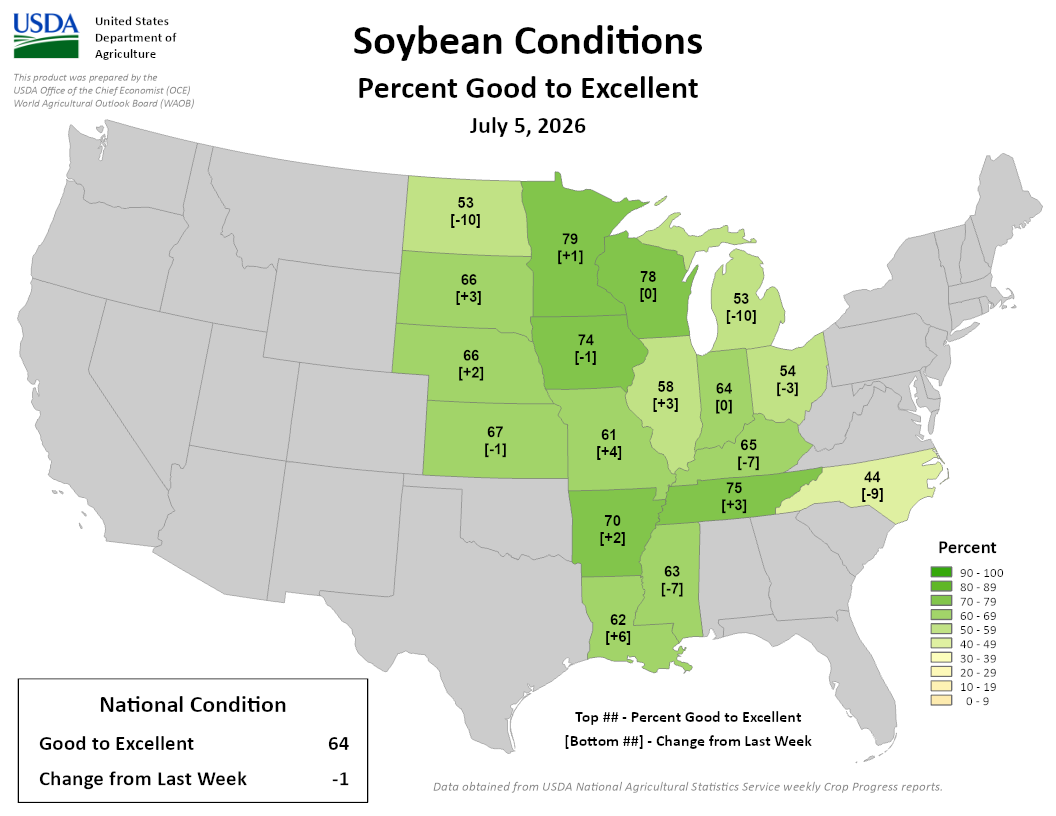
Image Description ↓
Choropleth map of the United States titled “Soybean Conditions: Percent Good to Excellent, July 5, 2026,” prepared by USDA’s Office of the Chief Economist. Green shading intensity reflects percentage rated good to excellent; each state shows its percentage and change from the previous week in brackets. State values: Minnesota 79 [+1], Wisconsin 78 [0], South Dakota 66 [+3], Iowa 74 [-1], Nebraska 66 [+2], Kansas 67 [-1], Missouri 61 [+4], Illinois 58 [+3], Indiana 64 [0], Ohio 54 [-3], Michigan 53 [-10], North Dakota 53 [-10], North Carolina 44 [-9], Tennessee 75 [+3], Arkansas 70 [+2], Mississippi 62 [+6], Alabama 63 [-7]. Other states are gray (not measured). A legend on the right shows percentage ranges from 0-9 (tan) to 90-100 (dark green). A box in the lower left lists national condition: Good to Excellent 64%, Change from Last Week -1. Source note: data obtained from USDA National Agricultural Statistics Service weekly Crop Progress reports.
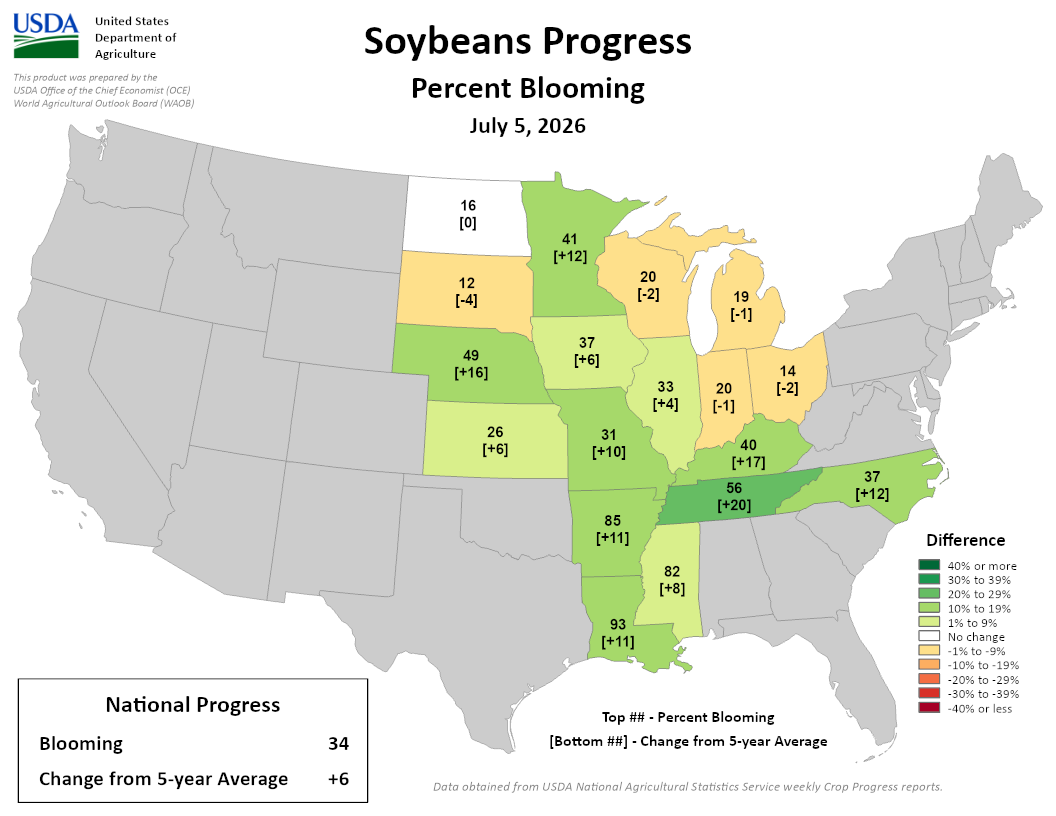
Image Description ↓
USDA Office of the Chief Economist/WAOB map titled “Soybeans Progress – Percent Blooming, July 5, 2026.” Shaded states show percent blooming with change from 5-year average in brackets: North Dakota 16 [0]; South Dakota 12 [-4]; Nebraska 49 [+16]; Minnesota 41 [+12]; Iowa 37 [+6]; Kansas 26 [+6]; Missouri 31 [+10]; Illinois 33 [+4]; Wisconsin 20 [-2]; Michigan 19 [-1]; Indiana 20 [-1]; Ohio 14 [-2]; Kentucky 40 [+17]; Tennessee 56 [+20]; North Carolina 37 [+12]; Arkansas 85 [+11]; Mississippi 82 [+8]; Louisiana 93 [+11]. States are color-coded by difference from average, ranging dark green (40%+ above) through light green/yellow (near average) to orange/red (below average); North Dakota is white (no change); ungraded states are gray. Sidebar box: National Progress – Blooming 34%, Change from 5-year average +6. Source note: Data obtained from USDA National Agricultural Statistics Service weekly Crop Progress reports.
- Wisconsin had 4.6 days suitable for fieldwork statewide, which was slightly down from the previous week.
- Soybeans are 20% blooming. Corn silking has yet to get underway.
- Corn and soybean conditions are 82% and 78% good to excellent, respectively.
- Winter wheat is 74% coloring and is rated 80% good to excellent (up 1% from last week).
- Oats are 78% headed and 29% coloring. Oat condition is 81% good to excellent.
- Pasture and range were rated 66% good to excellent, up 1% from last week.
- The second cutting of alfalfa is 48% complete.
- Read the full USDA report.
Forecasts and Outlooks
7 Day Precipitation Forecast
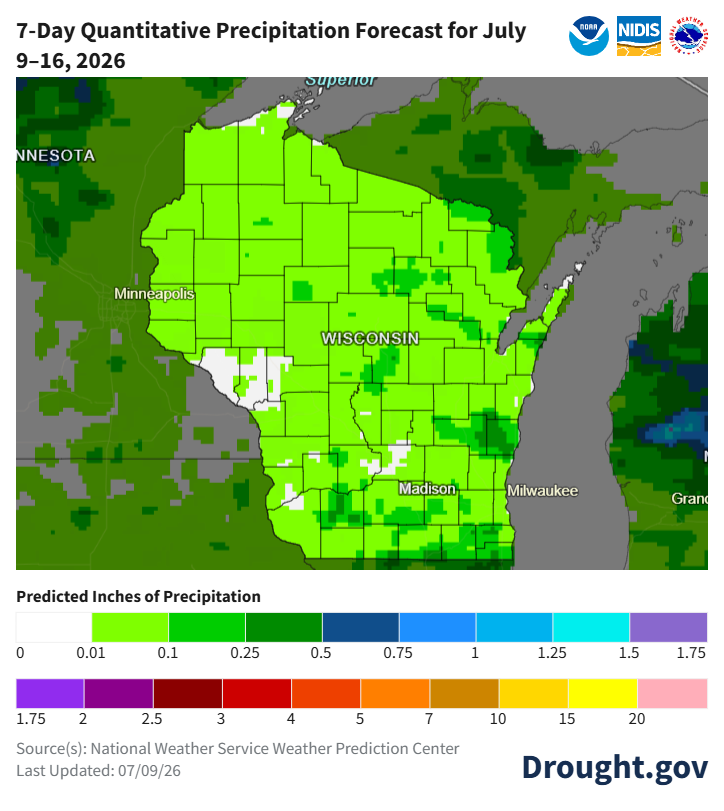
Image Description ↓
Map titled “7-Day Quantitative Precipitation Forecast for July 9–16, 2026,” sourced from the National Weather Service Weather Prediction Center via Drought.gov, last updated 07/09/26. Shows Wisconsin and surrounding states/lake areas (Minnesota, Lake Superior, Lake Michigan, Milwaukee, Madison, Minneapolis, Grand Rapids area visible at edges). Most of Wisconsin is shaded light green, indicating predicted precipitation of 0.1–0.25 inches over the 7-day period. Scattered small pockets of white (0 inches) appear in western and south-central Wisconsin. Darker green patches (0.25–0.5 inches) are scattered across central and northeastern Wisconsin and more heavily along the Michigan/Lake Michigan side. Areas outside Wisconsin, including parts of Michigan near Lake Michigan, show darker green to blue shading indicating higher precipitation (0.5–1+ inches). The color legend ranges from white (0 inches) through light green, green, dark green, blue shades, cyan, and purple (up to 1.75 inches), with a second row extending from purple through dark red, orange, gold, yellow, and pink (1.75 to 20+ inches), though most of Wisconsin falls within the lower (green) end of this scale.
- When? – Minimal rain chances over the next seven days. The best chances for rain are on Thursday (7/9) and Saturday (7/11).
- Where? – No strong indications towards a particular region of the state.
- Check your local forecast for details on totals and timing.
- Average precip (1991-2020) for this week: 0.92”.
8-14 Day Temperature and Precipitation Outlook
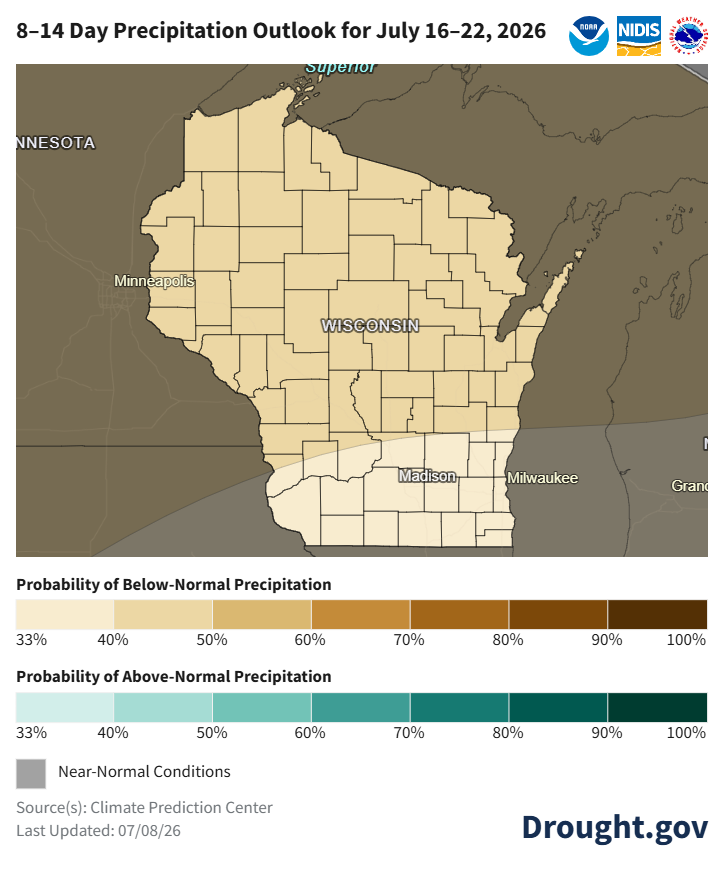
Image Description ↓
Climate Prediction Center map titled “8–14 Day Precipitation Outlook for July 16–22, 2026,” covering Wisconsin and parts of neighboring Minnesota, Michigan, and Illinois. Nearly all of Wisconsin is shaded light tan, indicating a 33–40% probability of below-normal precipitation. A narrow band of counties in the south-central part of the state, including those around Madison, is shaded the lightest tan, representing the low end of that same 33–40% below-normal probability range. No areas show above-normal precipitation probability or near-normal conditions. Legend includes two color scales: “Probability of Below-Normal Precipitation” (tan to dark brown, 33% to 100%) and “Probability of Above-Normal Precipitation” (light to dark teal, 33% to 100%), plus a gray swatch for “Near-Normal Conditions.” Source: Climate Prediction Center. Last updated 07/08/26. NOAA, NIDIS, and National Weather Service logos appear in the top right; Drought.gov logo appears in the bottom right.
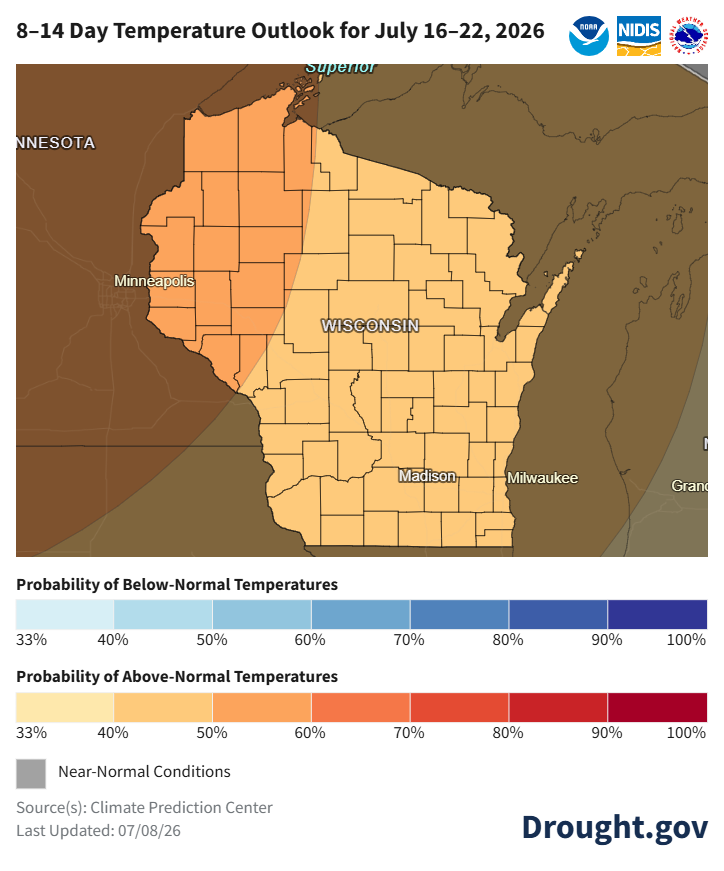
Image Description ↓
NOAA Climate Prediction Center map of Wisconsin titled “8–14 Day Temperature Outlook for July 16–22, 2026.” Counties are shaded in light tan to orange, indicating probabilities of above-normal temperatures. Western and northwestern Wisconsin show darker orange shading (about 50–60% probability of above-normal temperatures), while central, eastern, and southern Wisconsin are lighter tan (about 33–50% probability). Major city labels include Madison, Milwaukee, Minneapolis, and Superior. A legend shows probabilities for below-normal temperatures in blue and above-normal temperatures in tan-to-red shades. Sources listed as Climate Prediction Center; last updated July 8, 2026. Drought.gov, NOAA, NIDIS, and National Weather Service logos appear on the graphic.
- Mid-to-Late July: Temperatures are leaning towards above normal statewide, especially in the northwest (40-60% odds). Precipitation is leaning below normal statewide, with a stronger lean in the central and northern counties (33-50% odds).
- Statewide normals (1991-2020) for July 16-22 are 69.5°F and 0.91”.
30 Day Temperature and Precipitation Outlook
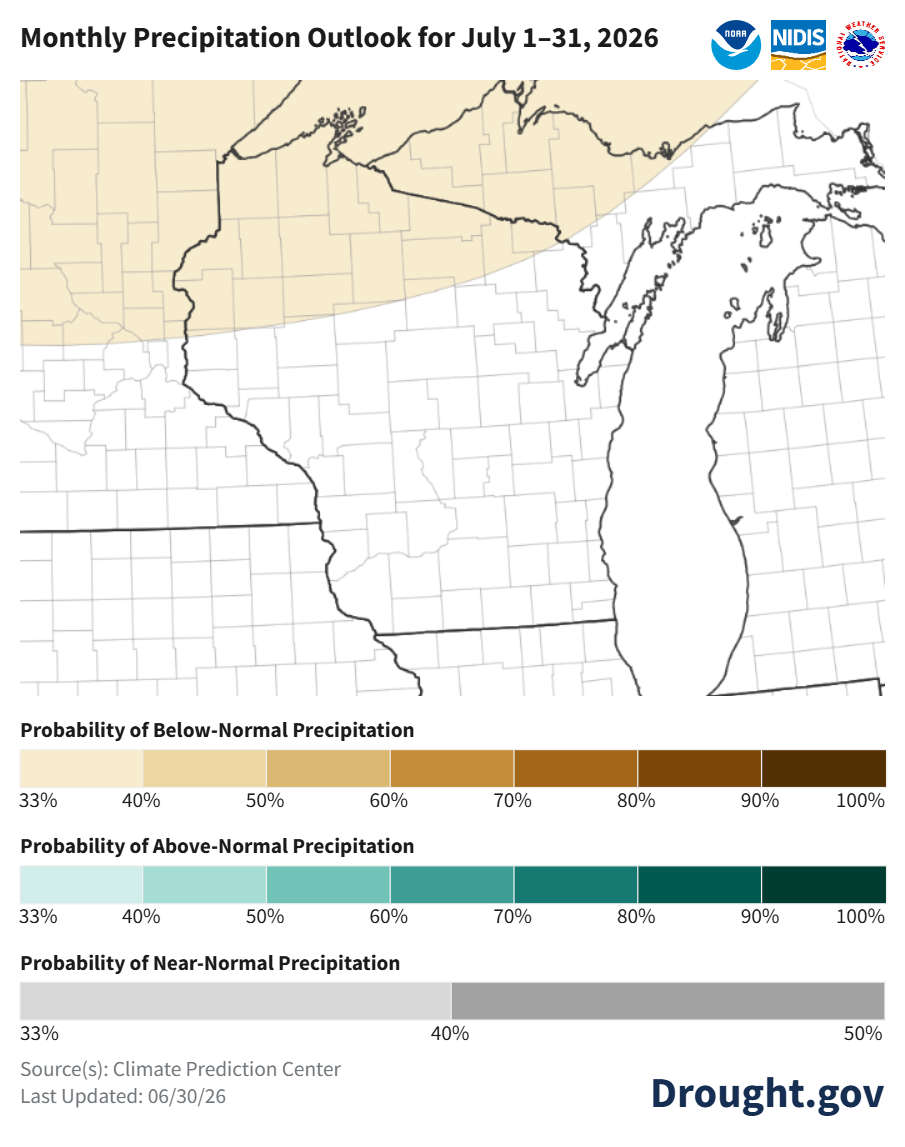
Image Description ↓
Choropleth map titled “Monthly Precipitation Outlook for July 1–31, 2026,” covering Minnesota, Wisconsin, Michigan, and surrounding states/Lake Michigan, sourced from NOAA’s Climate Prediction Center via Drought.gov, last updated 06/30/26. A tan-shaded region covering northern Minnesota and the northwest corner of Wisconsin indicates a 33-40% probability of below-normal precipitation. The remainder of the mapped area (most of Wisconsin, all of Michigan, and Lake Michigan) is unshaded, indicating equal chances among below-normal, near-normal, and above-normal precipitation. Three horizontal color-scale legends appear below the map: “Probability of Below-Normal Precipitation” (cream to dark brown, 33% to 100%), “Probability of Above-Normal Precipitation” (pale to dark teal, 33% to 100%), and “Probability of Near-Normal Precipitation” (light to dark gray, 33% to 50%).
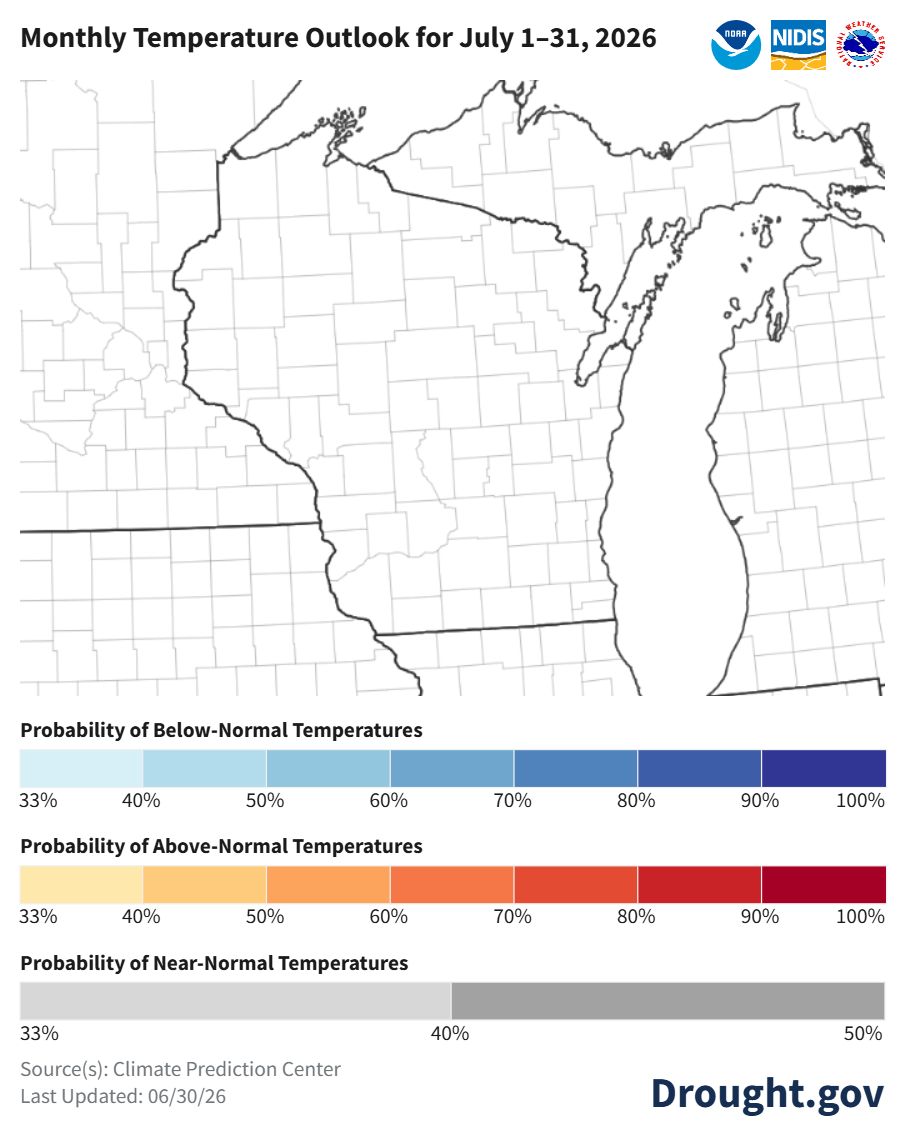
Image Description ↓
NOAA/NIDIS/National Weather Service map covering Wisconsin, Michigan, and parts of Iowa, Minnesota, and Illinois for the period July 1–31, 2026. The map area itself shows no shaded probability data. Below the map are three color-coded legend scales: “Probability of Below-Normal Temperatures” (light to dark blue, 33%–100%), “Probability of Above-Normal Temperatures” (light yellow to dark red, 33%–100%), and “Probability of Near-Normal Temperatures” (light to dark gray, 33%–50%). Source: Climate Prediction Center. Last updated 06/30/26. Drought.gov logo in bottom right.
- July: No strong leans in the temperature or precipitation probabilities. There is a slight lean towards drier-than-normal in the north (33-40% odds).
- Statewide normals (1991-2020) for July 1-30 are 69.2°F and 4.04”.
90 Day Temperature and Precipitation Outlook
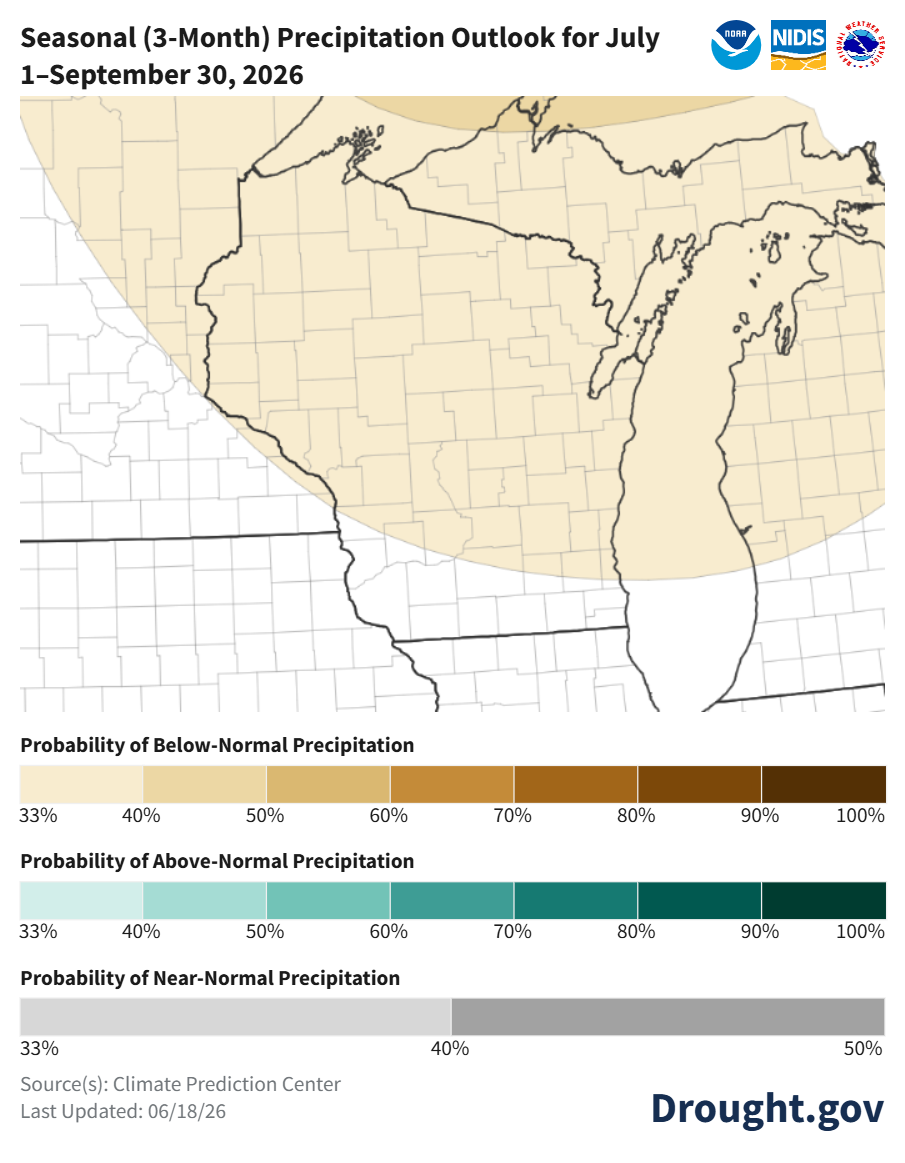
Image Description ↓
A map titled “Seasonal (3-Month) Precipitation Outlook for July 1–September 30, 2026” showing Wisconsin and surrounding Midwest states. NOAA, NIDIS, and National Weather Service logos appear in the upper right. State and county boundaries are visible, with Wisconsin centered.
Most of Wisconsin is shaded light tan, indicating a 33–40% probability of below-normal precipitation across the July–September period. The tan shading extends across northern, central, and eastern Wisconsin. The southern edge of Wisconsin and nearby regions appear gray, indicating near-normal precipitation probabilities (about 33–50%) with no strong tilt toward wetter or drier conditions.
Legends below the map include:
“Probability of Near-Normal Precipitation,” shown in gray (about 33–50%), present mainly in southern areas.
“Probability of Below-Normal Precipitation,” ranging from 33% to 100% (light tan to dark brown), with Wisconsin mainly in the lowest category (33–40%).
“Probability of Above-Normal Precipitation,” ranging from 33% to 100% (light teal to dark green), not represented over Wisconsin.
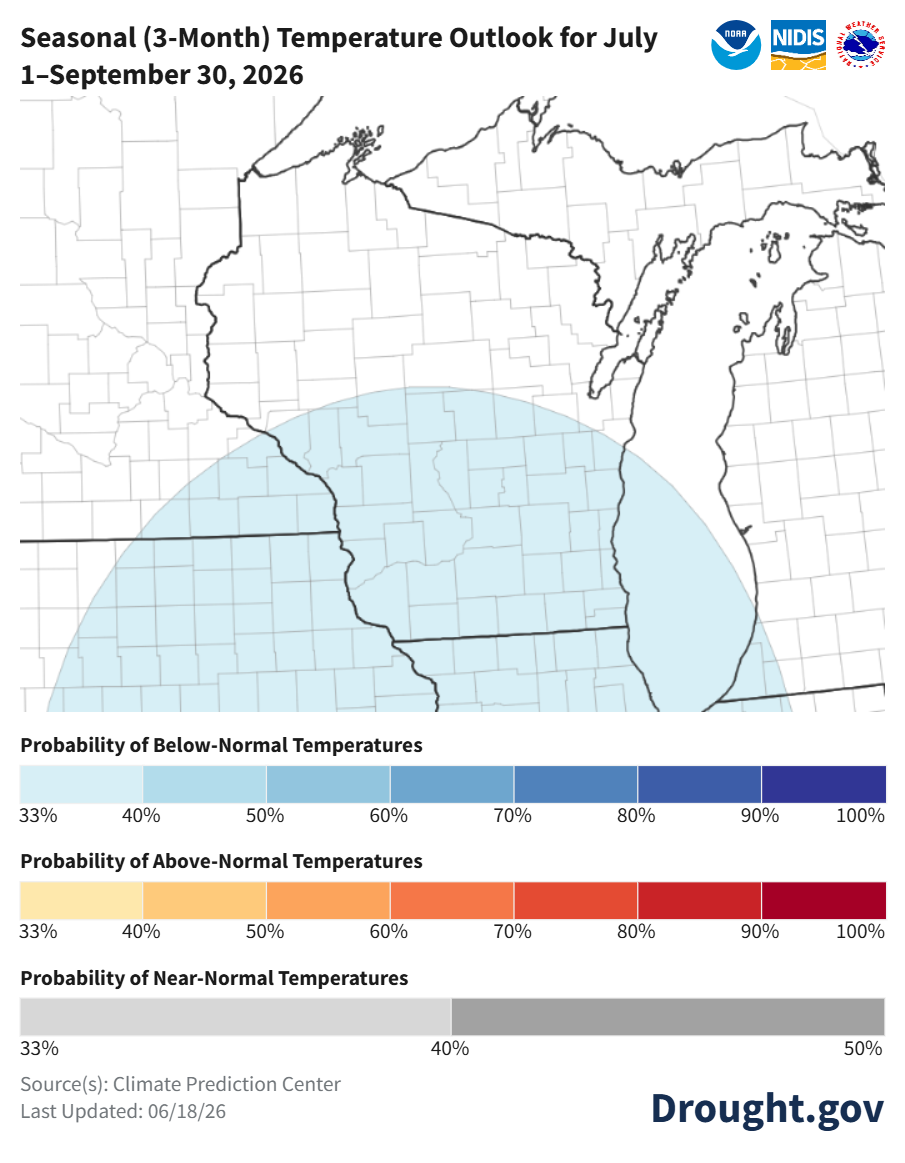
Image Description ↓
A map titled “Seasonal (3-Month) Temperature Outlook for July 1–September 30, 2026” showing Wisconsin and surrounding Midwest states. NOAA, NIDIS, and National Weather Service logos appear in the upper right. State and county boundaries are visible, with Wisconsin centered.
Southern Wisconsin is shaded light blue, indicating a 33–50% probability of below-normal temperatures during the July–September period. This cooler-than-normal signal covers much of the southern half of the state and extends into neighboring states. Northern Wisconsin appears mostly gray, indicating near-normal temperature probabilities (about 33–50%) with no strong tilt toward above- or below-normal conditions.
Legends below the map include:
“Probability of Near-Normal Temperatures” (gray, about 33%–50%), covering northern Wisconsin.
“Probability of Below-Normal Temperatures” (blue gradient, 33%–100%), with southern Wisconsin in the lowest category (33–50%).
“Probability of Above-Normal Temperatures” (tan to red gradient, 33%–100%), not represented over Wisconsin.
- July-Sept: Temperatures in southern and central counties are leaning towards below normal temperatures (33-40% odds), with uncertainty further north. Precipitation is leaning towards below normal for most of the state (33-40% odds), with uncertainty in the far south.
- Statewide normals (1991-2020) for July-Sept are 65.4°F and 11.53”.
User Survey
Are you a regular user of the Ag Weather Outlook for Wisconsin (AgWOW)? Or maybe you are viewing this page for the first time this week? Either way, we want to hear your feedback on this resource! Please take a few minutes and fill out this survey. Your feedback will help us better serve your ag-weather data needs through AgWOW.
If you have any trouble accessing or filling out the survey, please email Josh Bendorf at jbendorf@wisc.edu. Thank you!