Manure is a valuable source of nutrients to farmers in Wisconsin. Statewide nutrient management guidelines include accounting for the nitrogen (N) provided from manure to improve accuracy in N applications and avoid overapplication of N. However, there are multiple methods for estimating N available to crops from manure, also called N credits. The purpose of this article is to provide insight into various approaches to calculate and verify manure-N availability (N credits). We explore: 1) approaches used to calculate plant available N (PAN) from manure that can be used for planning N applications; 2) research methods used to develop “book values” or availability coefficients; 3) soil test indices that might help farmers determine manure N availability from a specific manure application. Developing a better understanding of these methods and approaches will allow for more proper crediting of manure.
Introduction
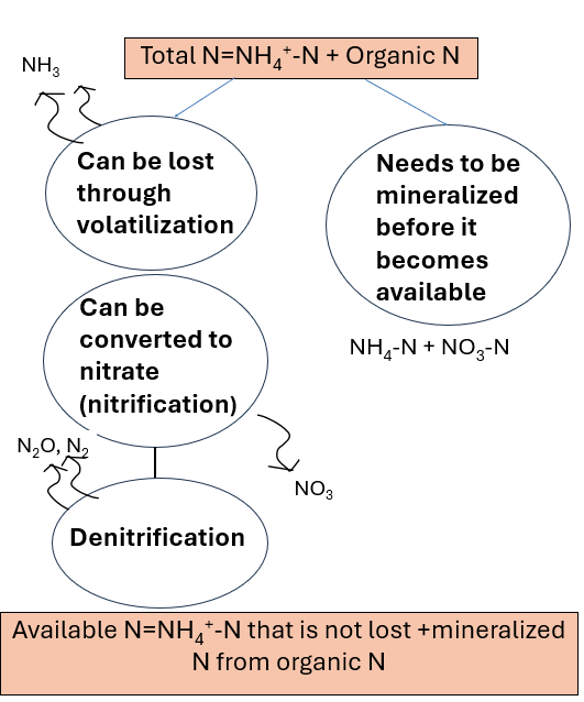
Current nutrient application recommendations for Wisconsin indicate that when manure is applied to land, the amount of available nitrogen (N) in manure should be accounted for in the total N applied. In cases where the available N in manure is not sufficient to meet crop needs, the manure available N should be subtracted from the total recommended N rate to determine the remaining N needs (Laboski and Peters, 2012). However, estimating the available N from manure can be challenging as not all the N is immediately available in the first season after application. This is because manure contains both organic and inorganic forms of N (where inorganic forms are plant-available). Ammonium-N is plant-available but organic N needs to be converted to a plant available form, a process called mineralization. In this process microbes break down organic N and convert it to ammonium and nitrate (Figure 1). This process takes time and depends on favorable environmental conditions, and characteristics of manure and soil. The inorganic form of N in manure is primarily present in the form of ammonium. The presence of ammonium combined with a relative high manure pH can lead to loss of N to the atmosphere in the form of ammonia. In the soil, ammonium can also be transformed to nitrate in a process called nitrification. Nitrate can easily dissolve in water and can be lost through the soil profile in leaching. If soil becomes anaerobic, nitrate can also be reduced to gaseous forms of nitrogen such as nitrous oxide and lost to the air.
In current guidelines for Wisconsin, N availability from manure varies based on animal species, the manure dry matter content (i.e., liquid or solid), and time between application and incorporation. Additionally, the total N content of manure varies with animal species (median values in Table 1) and is affected by the animal’s diet, manure storage and management, and land application technique. This variability is apparent in samples analyzed in Wisconsin from 2015 to 2021 where, for example, the N content in semi -solid dairy manure ranged from 0.2 to 48 lbs/ton and in solid beef manure from 2.2 to 44.4 lbs/ton.
Manure N content also varies within the same operation. For example, Dou et al. (2001) found dry matter and total N varied by 22 and 30%, respectively, in a manure storage system. While agitation can create a more homogeneous manure composition, a recent assessment of 16 Wisconsin dairy farms measured persistent high nutrient variability in agitated manure. The variability of total Kjeldahl N (TKN) and total ammoniacal N compositions during one season of emptying manure storage ranged from 7 to 48% and 4 to 54%, respectively (Aguirre-Villegas et al., 2018). This is why sampling and testing manure before application is recommended and more accurate than using book values.
Table 1. Median and standard deviation (in parentheses) of nitrogen (N) and ammonium (NH4) content of manures tested in Wisconsin, 2015-2021.1
| Solid Manure | Dry Matter (%) | N (lb/ton) | NH42 (lb/ton) |
|---|---|---|---|
| Beef solid | 30.7 (15.2) | 13.7 (6.8) | 2.9 (1.7) |
| Beef semi-solid | 14.1 (2.7) | 13.3 (4.7) | 7.5 (3.1) |
| Dairy solid | 35.0 (18.6) | 9.0 (10.1) | 1.2 (1.3) |
| Dairy semi-solid | 14.8 (2.6) | 6.4 (2.8) | 2.5 (1.3) |
| Poultry solid/semi-solid | 60.7 (14.4) | 53.2 (17.2) | 11.5 (6.8) |
| Swine solid | 34.3 (20.5) | 19 (8.8) | 10 (5.7) |
| Swine semi-solid | 12.7 (2.2) | 16 (2.9) | 11 (1.8) |
| Liquid Manure | Dry Matter (%) | N (lb/1000 gal) | NH42 (lb/1000 gal) |
|---|---|---|---|
| Dairy liquid | 2.4 (1.1) | 13.3 (6.8) | 8.5 (3.9) |
| Swine liquid | 3.3 (2.6) | 33.2 (18.6) | 27.0 (13.8) |
1 Results were retrieved by the UW Soil & Forage Analysis Lab from labs that do manure analysis in Wisconsin.
2 NH4 results represent fewer samples than total N because NH4 is not included in the standard manure analysis for Wisconsin.
Equations for Determining Plant Available Nitrogen from Manure
Whether you use typical “book” values or collect and analyze manure at a certified laboratory, you will need to determine how much of that N is likely to be available to a crop to know its fertilizer value. Plant available N (PAN) from manure is the amount of N that can be taken up by the plant (Bundy and Meisinger, 1994) and knowing this value is important for planning N fertilizer applications.
There are various methods that can be used to calculate PAN from manure, some of which are presented below. Each method has sound justification for its use, however specific circumstances including data availability may favor one method over others.
Plant available N can be calculated by multiplying the manure N analysis by an availability coefficient (Equation 1).
Equation 1
Plant Available Nitrogen (PAN) = Manure N Analysis * Availability Coefficient
This equation accounts for all manure N losses and mineralization in a single availability coefficient. In Wisconsin, the availability coefficient in Equation 1 is provided in the Nutrient Application Guidelines for Field, Vegetable, and Fruit Crops in Wisconsin (publication A2809) as a function of manure type and time to incorporation. Time to manure incorporation is important because the longer the time between application and incorporation, the more ammonia is lost to the atmosphere, reducing the amount of N that remains in the soil and thus lowering estimated credits. Although, not necessarily more accurate, there are equations that include additional N components and coefficients, in calculating PAN from manure (Schmitt et al. 1996).
Equation 2
Plant Available Nitrogen (PAN) = NH4-N + (Organic N * Mineralization Component)
Equation 2 requires manure analysis of ammonium (NH4) and organic N. In using this equation, the assumption is that all the ammonium-N is available, and a mineralization coefficient is used to determine how much organic N becomes available. The mineralization coefficient in this equation is a function of animal species and method of storage and handling (Schmitt et al. 1996).
Equation 3
Plant Available Nitrogen (PAN) =(Organic N * Mineralization Component) + (NH4-N * (1 – Loss Coefficient))
Equation 3 includes an estimation of the organic-N that will be mineralized and an estimation of the loss of ammonium as affected by the method of application (Schmitt et al. 1996). In this equation, ammonium availability is calculated using a loss coefficient and the assumption is that ammonium availability varies with manure application method. Like Equation 2, this equation requires ammonium analyses of manure which is not offered as part of a routine manure analysis of certified labs in Wisconsin but is available upon request.
Again, while each of these approaches can be equally valid, each requires coefficients or components that might not always be easy to obtain or estimate. The reason to choose one over the other is a matter of which coefficients and components are available for given circumstances. In research different methods have been used to estimate these coefficients. Below is a highlight of some common approaches used to estimate N availability coefficients and N recovery from applied manure. Specifically, these include: 1) the Fertilizer Equivalence approach; 2) mineralization or decay series; 3) the Difference Method; and 4) the 15N approach.
Fertilizer Equivalence
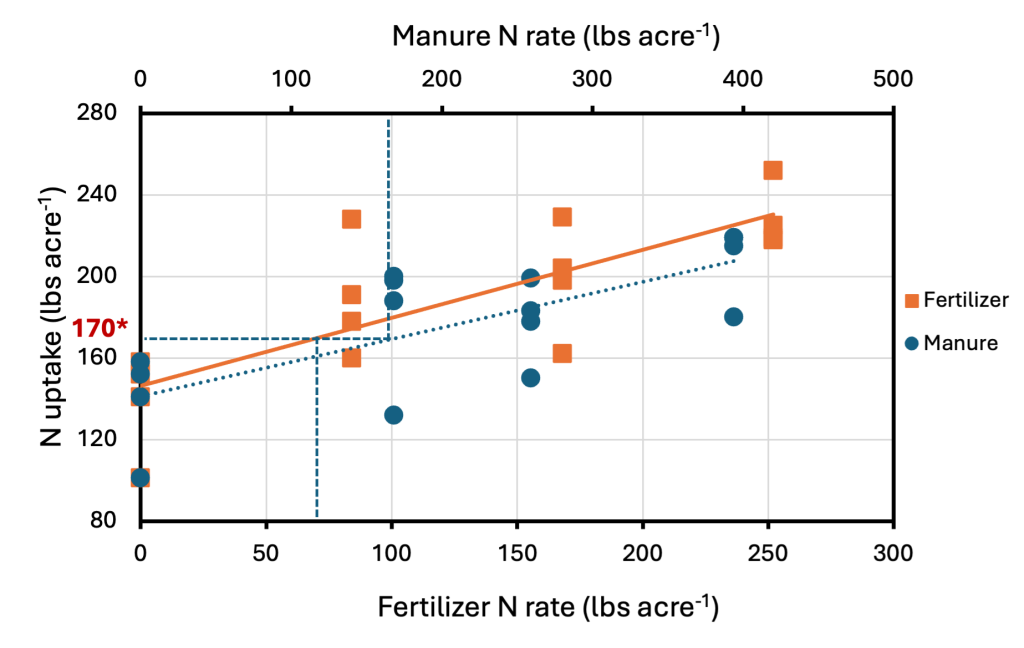
The most common approach to estimate PAN from manure is referred to as the Fertilizer Equivalence approach. This approach determines equivalent rates of commercial fertilizer N and applied manure N that result in similar levels of crop yield or N uptake (Klausner and Guest, 1981). This is accomplished by plotting the yield or nutrient uptake in the fertilizer treatments against the rate of fertilizer N and generating a regression model (Figure 2). Yield or N uptake values from the manure treatments are then entered into the equation and the fertilizer N rate that would have produced the same N uptake or yield as a manure N rate is the fertilizer equivalent value.
Let’s consider the following example from Figure 2: Manure is applied at a rate of 168 lbs N/acre (manure N rate is determined by multiplying the manure application rate by the total % N in manure). This manure N rate results in an N uptake of 170 lbs N/acre.
Using the regression equation fitted to N uptake vs. fertilizer N rate (orange line), we can solve for the N fertilizer rate that would have resulted in 170 lbs N/acre of uptake (which is what we observed with the 168 lbs N/ac from manure). In doing so, we find that an N fertilizer rate of 71 lbs N/ac would have resulted in the same N uptake (170 lbs/ac) as 168 lbs N/ac from manure. Thus, the N availability coefficient is determined as follows: Availability Coefficient = [(71 lbs N/ac from fertilizer) / (168 lbs N/ac from manure)] x 100% = 42%.
Using the N Fertilizer Equivalence approach, Laboski et al. (2013) found that the average N availability is 51% for injected manure, consistent with Wisconsin’s nutrient application guidelines (A2809). However, the N availability was calculated at 36% when manure was incorporated less than one hour after spreading, which is less than the 50% N availability outlined in A2809 (Table 2). It is interesting to note the high N variability from this study from year to year. Muñoz et al. (2008) found first year N availability of 57, 53, 14, and 4% for fresh poultry, dried poultry, composted poultry, and composted cow manure respectively.
A shortcoming of this method is that it is highly dependent on the equation selected to describe crop response to N and this equation might change as the crop response changes from year to year. In addition, this approach discounts crop response to non-fertility benefits from manure such as the improvement of soil physical and chemical characteristics (Beegle et al. 2008).
Table 2. Nitrogen availability from pre-plant applied liquid dairy manure based on the fertilizer equivalence approach for different application methods and times of incorporation.
| Application Method and (Time to Incorporation) | 2009 (% N Availibity) | 2010 (% N Availibity) | 2011 (% N Availibity) | 2012 (% N Availibity) | Mean (% N Availibity) |
|---|---|---|---|---|---|
| Injected | 48 | 53 | 41 | 63 | 51 |
| Surface broadcast (< 1 hour) | 22 | 50 | 46 | 31 | 36 |
| Surface broadcast (1 day) | 19 | 51 | 50 | 32 | 37 |
| Surface broadcast (3 days) | 30 | 33 | 34 | 43 | 34 |
Incubation and Litter Bag Technique
Another approach to estimating PAN from manure is by determining mineralization coefficients (Equations 2 and 3). A mineralization coefficient is a number that shows how much of the organic N in manure is converted to PAN over a certain amount of time (ammonium N is immediately available and does not need to be mineralized). These coefficients are determined through incubation studies in the lab or in the field using litter bags. For example, Wisconsin’s manure N crediting guidelines use a mineralization coefficient of 25% of organic N to estimate first- year N availability from liquid manures with less than 2% dry matter (DM) and more than 75% of total N as NH-N (Laboski and Peters, 2012).
When mineralization coefficients are determined over multiple time intervals, the resulting values form a decay series. One common method for determining these coefficients is through incubation studies. These involve mixing soil with the manure amendment, maintaining specific temperature and moisture conditions, and measuring the release of inorganic N over time. A challenge with this method is that the pre-treatment of the soil and the amendment (e.g. grinding, drying and sieving) might cause an initial flush of mineralization potentially skewing early results (Beegle et al., 2008). In an incubation experiment where the contribution of individual manure components to mineralized N using 15N were evaluated, Cusick et al. (2006) found that on average 30% of manure 15N mineralized over the 168 days of this trial with the highest rate of mineralization occurring in the urine (Table 3). In this study manure was labeled with 15N isotope and then 15N recovery was measured in the soil at the end of the study. The stable isotope 15N has been used for decades as a tracer to study N dynamics in soil and N uptake in above ground crop biomass.
Table 3. Mineralized 15N recovered from various labeled dairy manure components at different temperatures at the end of a 168-day observation.
| Temperature (°F) | Urine (% of applied 15N) | Feces (% of applied 15N) | Bedding (% of applied 15N) | All Components (% of applied 15N) |
|---|---|---|---|---|
| 52 | 44 | 13 | 15 | 24 |
| 64 | 60 | 18 | 24 | 30 |
| 77 | 63 | 26 | 25 | 36 |
| Average | 55 | 19 | 28 | 30 |
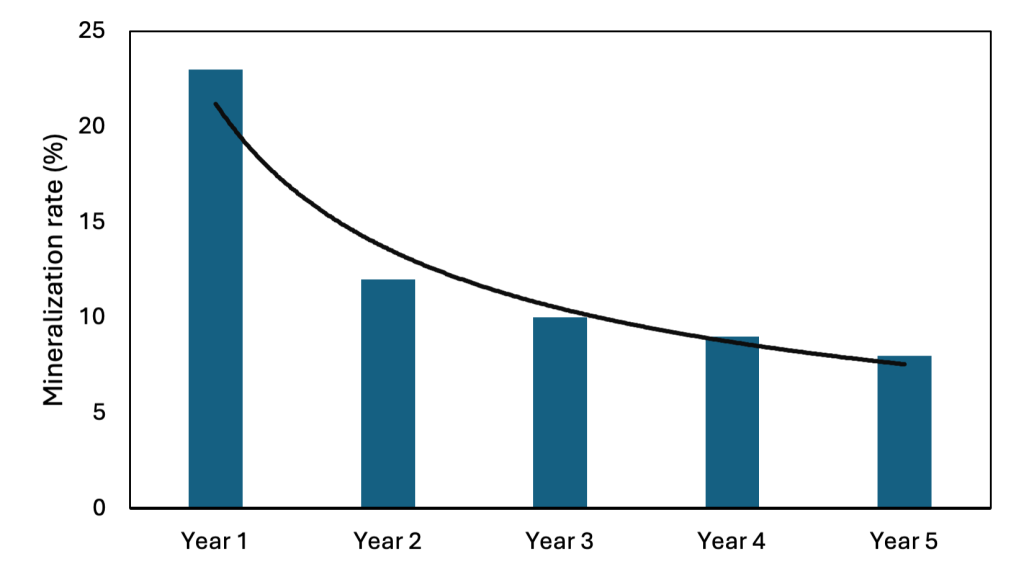
The use of buried litter bags is a common way to measure decomposition or decay of organic compounds under field conditions. Mineralization is then determined by the loss of material weight as a function of time. There are limitations with this method however, some of which are the isolation of the manure in the bag from the surrounding soil, protection from the manure in the bag from the soil microbes and the soil microenvironmental condition (Beegle et al., 2008). Lentz and Lehrsch (2012) developed a 5-year decay series for solid dairy manure using litterbags in which 23% of manure total N was mineralized in year 1. Subsequently, 12%, 10%, 9%, and 8% of total manure N was mineralized to plant available N in years 2 through 5, respectively (Figure 3).
Nitrogen Recovery
Nitrogen recovery is the amount of N taken up by the plant relative to what has been applied. Although not the same as N availability, it can help us understand the fate and efficiency of applied manure N (and trace where the applied manure N is going). In the next section we discuss two methods that are used to estimate N recovery: the Difference Method and the 15N method.
The Difference Method
The Difference Method calculates the apparent N recovery by subtracting N uptake in a control (unamended) plot from the N uptake in an amended plot. The difference is then divided by the amount of applied N. Below is an example of calculating N recovery using the difference method.
Example Calculation
A plot receives 30 tons/acre manure which supplies 115 lbs of N per acre. The N uptake in that plot is 93 lbs N/acre, while the N uptake in the unmanured plot is 53 lbs N/acre. Therefore, N recovery is:
((93-53) / 115) * 100 = 35%
In cases where the original background soil N levels are high, the N uptake in the plots that are unamended (control plots) might be high and sometimes even higher than the treated fields which could result in low to negative numbers with this approach. In a study conducted in Wisconsin an N recovery of -31% was reported (Table 4). The Difference Method assumes that that the soil provides the same amount of N to all plots and that the N taken up by the crop in fertilized or manured plots is coming from the supplied N (Muñoz et al. 2004). Another assumption is that N mineralization is not affected by the applied soil amendment which is contrary to the priming effect that other research has shown where amendments increase the mineralization rate of the original soil N (Beegle et al. 2008).
Table 4. Estimates of first-year manure N recovery as estimated by the Difference and 15N methods.
| Year | Difference Method | 15N Isotope Recovery | ||
| % | ||||
| Mean | Range | Mean | Range | |
| 1998 | 15 | -31 to 62 | 10 | 4 to 15 |
| 1999 | 18 | 9 to 31 | 17 | 8 to 26 |
| 2000 | 17 | -4 to 43 | 22 | 7 to 42 |
Adapted from Muñoz et al. (2004)
15N Isotope Recovery
Research conducted in Wisconsin has shown that first year N recovery using 15N ranged from 10 to 22% (Table 4). Like the Difference Method the recovery is calculated as the difference between the treated and untreated plots divided by the applied manure N rate. However, in the 15N Isotope Recovery Method, it is the atom % of 15N that is considered. Recovered 15N is then calculated as follows:
| 15N recovered % = |
|
× 100 |
Where P is the total crop N uptake, c is the atom %15N in the treated crop, d is the atom % 15N in a control crop, f is the total manure N applied, a is the atom % 15N in the applied manure, and b is the atom % 15N in the unlabeled manure (Muñoz et al. 2004).
Both the Difference Method and the 15N method are estimates of manure N that is recovered by the crop. The Difference Method compares crops response in amended plots to crop response in unamended plots. Therefore, this method is limited when native soil N is high resulting in negative recovery values. In addition, it does not consider an increase in N mineralized from soil due to the priming effect. Using labeled manure N has the benefit of being able to directly trace the N coming from the manure versus N coming from other sources.
In the following section we discuss soil test indices that might help farmers determine manure N availability from a specific manure application.
Soil Tests Indices
Although it is generally accepted that no single soil test will provide sufficient information to accurately reflect the complexity of N availability (Beegle et al., 2008), several soil tests might help us estimate N availability from manure.
The Pre-Sidedress Nitrate Test (PSNT)
The Pre-Sidedress Nitrate Test (PSNT) is a valuable tool for adjusting N application rates in corn during the growing season. Soil samples for the PSNT are collected to a depth of 12 inches when corn plants are between 6 and 12 inches tall, just prior to sidedress fertilization. The test helps identify fields where soil nitrate levels exceed the critical threshold of 21 ppm, indicating that no additional N is needed (Laboski and Peters, 2012).
The PSNT operates on the principle that early-season soil nitrate concentrations indicate the amount of N likely to become available during the growing season from both the soil itself and recently applied organic sources, such as manure or legume residues (Sims et al. 2013).
These nitrate levels represent the sum of nitrified ammonium-N and mineralized organic N from soil and manure, adjusted for losses due to leaching, crop uptake, and denitrification—processes that are strongly influenced by weather, soil properties, and management history (Bierer et al., 2020).
Take weather, for example: when temperatures are cool early in the season, N mineralization slows down. As a result, the PSNT may underestimate the amount of organic N that will become available later, potentially resulting in higher-than-needed N application rates. In years when May and June temperatures are below average, it is recommended to use manure N credit book values when determining the appropriate N application rates (Laboski and Peters, 2012). Tillage is another factor that can affect PSNT results. Pre-plant tillage stimulates organic matter decomposition, temporarily increasing N mineralization and elevating soil nitrate levels early in the season (White et al., 2024)
These examples highlight that while the PSNT provides a useful snapshot of soil nitrate levels and supports in-season N management, it should be interpreted alongside weather conditions and field management history to guide N fertilizer decisions effectively.
Potentially Mineralizable Nitrogen (PMN)
Residual N refers to the organic N in manure that does not mineralize in the year of application but becomes available in subsequent years. One index gaining attention for estimating this residual N is potentially mineralizable nitrogen (PMN)-defined as the fraction of organic soil N that can be converted into plant-available forms over a given period (Gorain and Paul, 2021).
PMN is measured through laboratory incubations and provides a direct estimate of mineralized nitrogen under controlled conditions. It also serves as an indirect indicator of the N that may become available during the growing season (Bandura et al., 2025). The term “potentially” highlights that laboratory incubations are only rough approximations of field conditions (Sullivan et al., 2020). Several studies have examined PMN responses to manure application. For example, Nyiraneza et al. (2009) found that long-term manure application increased PMN levels. Sharifi et al. (2011) reported that PMN was 49–62% higher when manure was applied at a high rate (268 lbs N acre⁻¹) compared to medium (134 lbs N acre⁻¹) and low (67 lbs N acre⁻¹) rates. However, they found no significant correlation between lab-based PMN measurements and field-based indicators of N supply. Another limitation of PMN is the turn-around time for results with the duration of the incubation process ranging from 7 days (anaerobic PMN) to 28 days (aerobic PMN), potentially affecting its relevance to N management decisions.
So, although PMN is an informative tool as it relates to soil health, its use to make manure application decisions is questionable.
Summary
Manure N crediting is complex and variable. Understanding the methods used to estimate N availability—along with their underlying assumptions—is essential for improving accuracy. Several approaches are commonly used.
In research:
- Fertilizer Equivalence is the most widely used method and forms the basis of Wisconsin’s manure N recommendations. Future research will focus on refining this approach.
- Mineralization or Decay Series models the rate of N release from manure but requires accurate estimates of organic N, calculated from total and ammonium N content.
- Difference Method (Apparent Recovery) is less reliable when initial soil N levels are extremely low or high.
- 15N Isotope Method offers high accuracy but is costly and time intensive.
For on-farm nitrogen management:
- Pre-Sidedress Nitrate Test (PSNT) estimates plant-available N from organic sources but cannot fully capture seasonal dynamics. Its results should be interpreted alongside weather, soil, and management history.
- Potential Mineralizable N estimates residual N from manure that becomes available in years following application. Although informative, its role in guiding manure application decisions is limited.
Regardless of the method, poor manure management increases N losses and reduces crop availability. Factors such as manure type, soil properties, and environmental conditions introduce uncertainty, making N crediting an estimate rather than a precise prediction.
Manure nutrient crediting is evolving, and so must our recommendations. Future research will re-evaluate Wisconsin’s estimates to reflect modern manure and crop management practices and aim to improve N availability estimates. Until then, accurate manure sampling and testing remain the backbone of effective N management.
Updated: Aug. 26, 2025
Reviewed by: Laura Good, Chris Clark, Chris Bandura
References
- Aguirre-Villegas, H. A., Sharara, M. A., & Larson, R.A. 2018. Nutrient Variability Following Dairy Manure Storage Agitation. Applied Engineering in Agriculture, 34, 908–917. https://doi.org/10.13031/aea.12796
- Bandura, C., Elmquist, D., Hall, S., Ruark, M. & Kampa, J. 2025. An overview of common soil health indicators. University of Wisconsin-Madison Division of Extension.
- Beegle D.B., Kelling, K.A., & Schmitt, M.A. 2008. Nitrogen from animal manures. In: J.S. Schepers and W.R. Raun (Eds.) Nitrogen in agricultural systems. Agronomy Monograph 49 (pp. 823–882). ASA, CSSA, and SSSA, Madison, WI. https://doi.org/10.2134/agronmonogr49.21
- Bierer, A. M., Maguire, R. O., Strickland, M. S., Stewart, R. D., & Thomason, W. E. 2020. Evaluating effects of dairy manure application method on soil health and nitrate. J. Soil Water Cons., 75, 527–536. https://doi.org/10.2489/jswc.2020.00074
- Bundy L.G., & Meisinger, J. 1994. Nitrogen availability indices. In: R. W. Weaver (Ed.), Methods of soil analysis. Part 2. Microbiological and biochemical properties (pp. 951-984). Soil Science Society of America. https://doi.org/10.2136/sssabookser5.2.c41
- Cusick, P.R., Powell, J.M., Kelling, K.A., Hensler, R.F., & Munoz, G.R. 2006. Dairy manure N mineralization from incubation and litterbags. Biol. Fertil. Soils 43,145–152. https://doi.org/10.1007/s00374-006-0071-z
- Dou, Z., Galligan, D. T., Allshouse, R. D., Toth, J. D., Ramberg, C. F., & J.D. Ferguson. 2001. Manure Sampling for Nutrient Analysis. J. Environ. Qual., 30, 1432. https://doi.org/10.2134/jeq2001.3041432x
- Gorain, B. & Paul, S. 2021. Biological indicators for monitoring soil quality under different land use systems in Rakshit, A., Parihar, M., Sarkar, B., Singh, H.B., & Fraceto, L.F. (Eds.). (2021). Bioremediation Science: From Theory to Practice (1st ed.). CRC Press. https://doi.org/10.1201/9780429327643
- Kelling, K.A. & Wolowski, R.P. 1993. Manure agronomic loading rates and nutrient balance. In: Livestock Waste Management Conference, Champagne, IL, 31-41.
- Klausner, S.D. & Guest, R.W. 1981. Influence of NH3 conservation from dairy manure on the yield of corn. Agron. J. 73, 720-723.
- Laboski, C.A.M., Jokela, W., & Andraski, T.W. 2013. Dairy manure application methods: N credits, gaseous N losses, and corn yield. Proc. of the 2013 Wisconsin Crop Management Conference 52, 20-31.
- Laboski, C.A.M., & Peters, J.B. 2012. Nutrient application guidelines for field, vegetable, and fruit crops in Wisconsin. University of Wisconsin Extension (A2809).
- Lentz, R.D., & Lehrsch, G.A. 2012. Net nitrogen mineralization from past year’s manure and fertilizer applications. Soil Sci. Soc. Am. J. 76, 1005–1015. https://doi.org/10.2136/sssaj2011.0282
- Leytem, A. B., Moore, A. D., Rogers, C. W., & Dungan, R. S. 2023. Predicting nitrogen mineralization from dairy manure and broadleaf residue in a semiarid cropping system. Soil Sci. Soc. Am. J. 88, 71–88. https://doi.org/10.1002/saj2.20599
- Meinen, R., White, C., Karsten, H. Spargo, J., & Sigdel, S. 2024. Pre-sidedress soil nitrate test for corn. PennState Extension. Pennsylvania State University.
- Motavalli, P.P. 1984. M.S. Thesis. University of Wisconsin-Madison.
- Muñoz, G.R., Kelling, K.A., Powell, J.M., & Speth, P.E. 2004. Comparison of estimates of first-year dairy manure nitrogen availability or recovery using nitrogen-15 and other techniques. J. Environ. Qual. 33, 719-727. https://doi.org/10.2134/jeq2004.7190
- Muñoz, G. R, Kelling, K.A, Rylant K.E, & Zhu, J. 2008. Field evaluation of nitrogen availability from fresh and composted manure. J. Environ. Qual. 37, 944-55. https://doi.org/10.2134/jeq2007.0219.
- Nyiraneza, J., Chantigny, M.H., N’Dayegamiye, A. & Laverdière, M.R. 2009. Dairy cattle manure improves soil productivity in low residue rotation systems. Agron. J., 101, 207-214. https://doi-org.ezproxy.library.wisc.edu/10.2134/agronj2008.0142
- Paul, J.W. & Beauchamp, E.G. 1993. Nitrogen availability for corn in soils amended with urea, cattle slurry, and solid and composted manures. Can. J. Soil Sci. 73: 253-266. https://doi.org/10.4141/cjss93-027
- Schmitt, M.A., Schmidt, J.P., & Randall, G.W. 1996. Proc. North Central Extension-Industry Soil Fertility Conference, St. Louis, MO. 12, 94-99.
- Sims, J.T., Vasilas, B.L., & Gartley, K.L. 2013. Nitrogen management for corn in Delaware: The Pre-sidedress nitrate test. University of Delaware Cooperative Extension.
- Sharifi, M., Zebarth, B.J., Burton, D.L., Rodd, V., & Grant, C.A. 2011. Long-term effects of semisolid beef manure application to forage grass on soil mineralizable nitrogen. Soil Sci. Soc. Am. J. 75, 649–658.
- Sullivan, D.M., Moore, A.D., Verhoeven, E., & Brewer, L.J. 2020. Baseline soil nitrogen mineralization: Measurement and interpretation. Oregon State University Extension Service.
- Thomas, B.W., Sharifi, M., Whalen, J.K., & Chantigny, M.H. 2015. Mineralizable nitrogen responds differently to manure type in contrasting soil textures. Soil Sci. Soc. Am. J., 79, 1396-1405, 10.2136/sssaj2015.03.0124
- White, C., Karsten, H., Meinen, R, Spargo, J, & Sigdel, S. 2024. Re-calibrating the pre-sidedress soil nitrate test for modern corn production. PennState Extension.