
Weather and climate conditions this month in Wisconsin
Here are this month’s take-home points about the weather. As a reminder, AgWOW reports will be published monthly until spring. Scroll down for the full report.
Additionally, we’re collecting user feedback. Regardless of whether it’s your first time here or if you are a regular user, we’d love to hear from you!
Key Points
One Month Conditions
- Temperatures were 2-4°F above normal across most of the state, with a few days topping 70°F in the south and west.
- Precipitation was well above normal across most of the state, especially in the central and northeast counties where totals were at or above 200% of normal.
Impact
- Soil moisture levels at 4” depth at UW research farm stations (Wisconet) showed increases from last week’s levels. Satellite-based soil moisture models indicate that central counties are far wetter than normal for this time of year.
- Chilling hours for Wisconsin’s perennial fruits range from 1182 to 1515 accumulated hours.
- There has been a large reduction in D0 coverage from early March, with a 22% decrease in D1 and D2 coverage.
Outlook
- Precipitation totals over the next 7 days look to be well above normal for this time of year, with multiple chances for rain statewide.
- Climate probabilities for middle-to-late April show statewide leans for above normal temperatures (especially in southern counties) and above normal precipitation.
- The outlook for April shows a lean towards above-normal precipitation statewide, with temperatures uncertain.
- The outlook for April-June indicates equal chances (uncertainty) for temperatures and precipitation statewide. The exception to this is a slight lean towards above normal temperatures in the far south.
Agronomic and Vegetable Considerations
Field Conditions
- Avoid trafficking fields in wet conditions to prevent compaction and rutting.
- Check alfalfa for early signs of winterkill.
- Keep livestock out of critical and sensitive areas with soft, muddy ground, see this article on the value of keeping cattle clean.
- 2-4″ soil temperatures remain cool with temperature swings. Soil temperatures should be consistently at 50 degrees F to reduce the risk of imbibitional chilling and soil-borne pathogens.
Manure Applications
- Reminder of Wisconsin’s NR 151 Runoff Rules with the timing of manure spreading and current runoff levels. Check DATCP Runoff Risk Advisory Forecast.
Small Grains
- Assess winter grain stands. Check winter wheat for any signs of winterkill.
- Avoid fertilizer applications in wet and cool conditions. Nitrogen loss is greater in wet conditions. Review small grain fertility.
Fruit Considerations
- Pre-emergent herbicide applications should be applied prior to green tip, during a dry period where temperatures will remain above 40F for several days post-application.
- Importance of Spring Herbicide Application in Fruit Trees – Michigan State
- Dormant copper and urea applications used to reduce fire blight and apple scab inoculum should be applied prior to green tip.
- Early Season Disease Prevention – UW-Madison
- Prune out damaged, dead or diseased tissue and remove any fruit mummies from the tree canopy prior to green tip. Growers can chop, bury or burn (where permitted) prunings.
- Sanitation for Disease Prevention – UW-Madison
Vegetable Considerations
- Asparagus cultivation can occur in early spring (very shallowly- less than 2 inches) before spears emerge to control bad weed problems or incorporate fertilizer.
- Risk from the first generation of adult seed corn maggots is increasing in southern WI as GDDs are now over 300 in some areas. Peak activity is expected at 360 GDD. Use the Vegetable Disease and Insect Forecasting Network to view GDDs for your area. This first generation overwinters in WI. When flies emerge, they are attracted to fields with high organic matter. If possible, terminate and incorporate cover crops 2-3 weeks before planting your cash crop to reduce the attractiveness of these fields as egg laying sites.
- Starting with healthy transplants is an important part of your IPM plan. Many tomato and pepper viruses are transmitted by aphids and thrips which love the warm environment of your greenhouse. Be sure to scout transplants regularly to look for these pests. Their populations can grow quickly and be difficult to control with chemical or biological methods. Therefore, it is important to limit potential sources of these viruses by not starting ornamentals in the same greenhouse as your vegetables. More information on control methods can be found here.
Dive deeper into each report section by clicking a topic below.
Precipitation Trends
7 Day Precipitation
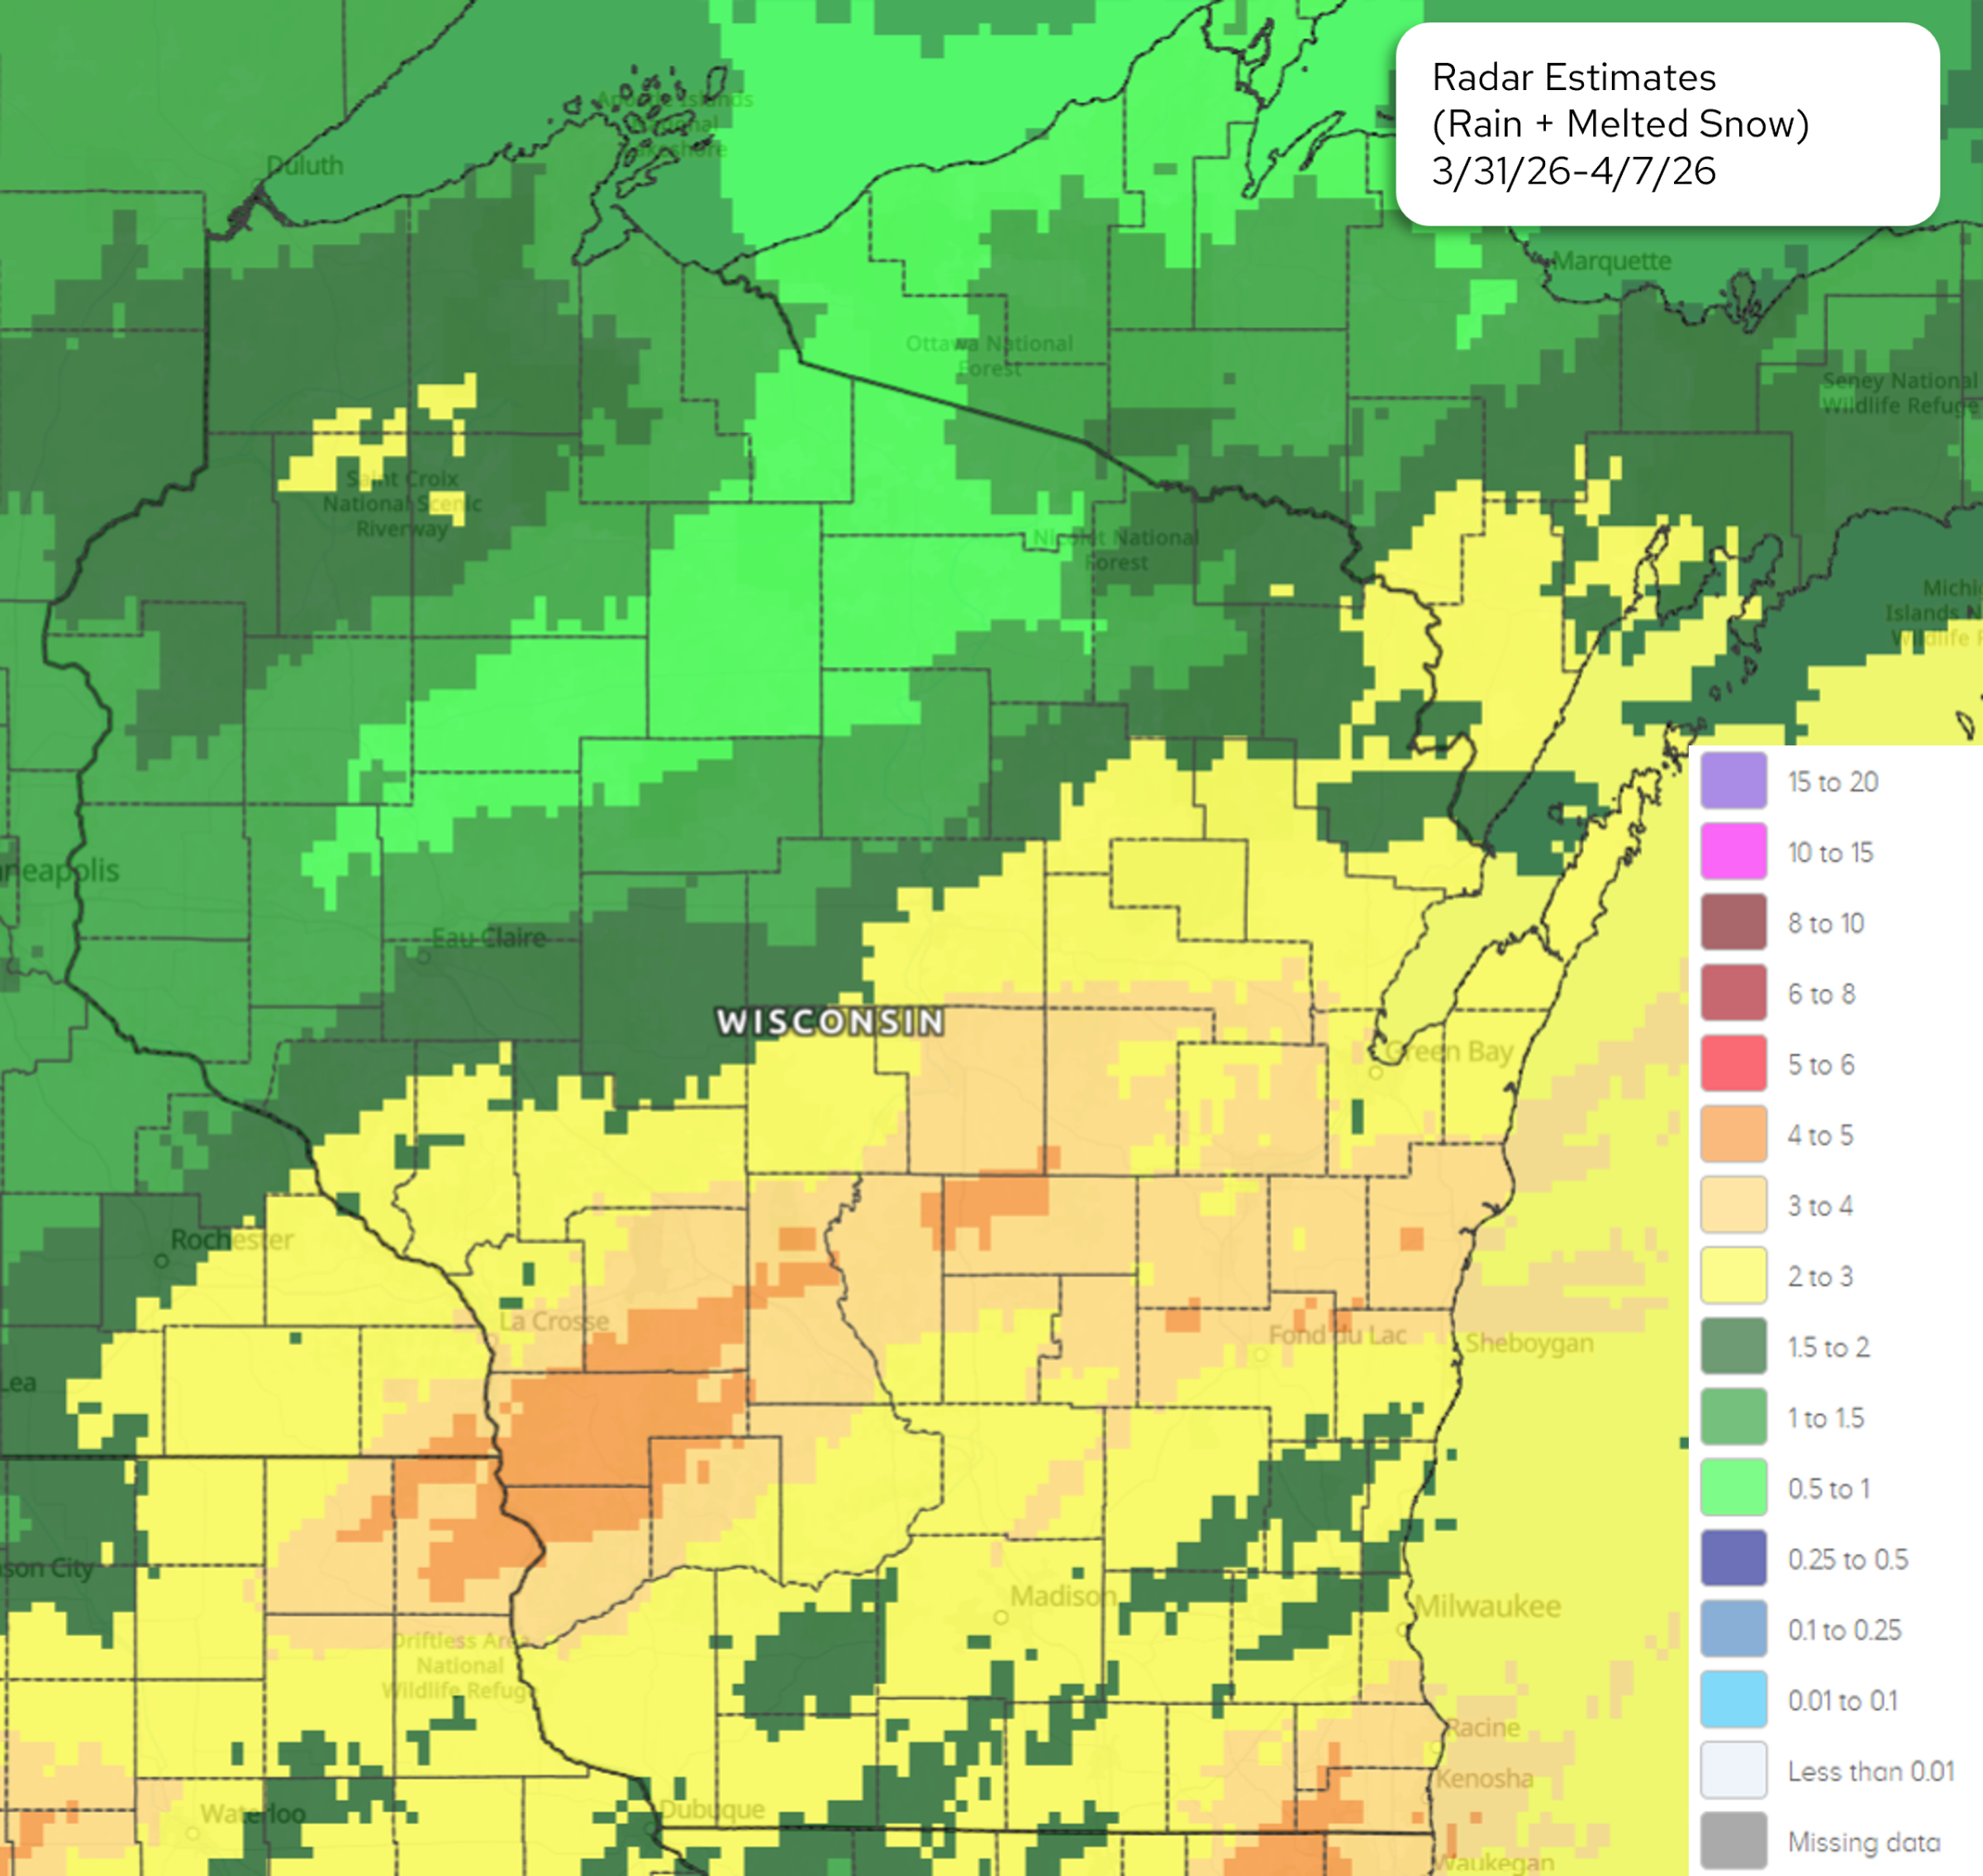
Image Description ↓
NOAA 7-day radar precipitation map (3/31/26–4/7/26) for Wisconsin and surrounding region. Northern Wisconsin received 0.5–2 inches (green tones). A band of heavier precipitation (2–5 inches, yellow to orange) spans central and southwestern Wisconsin, with the highest totals (4–5 inches, orange) concentrated near La Crosse and south-central areas. Madison received approximately 2–3 inches. The Lake Michigan shoreline and Upper Peninsula show dark green patches indicating 1.5–2 inch totals. Data represents rain plus melted snow equivalents.
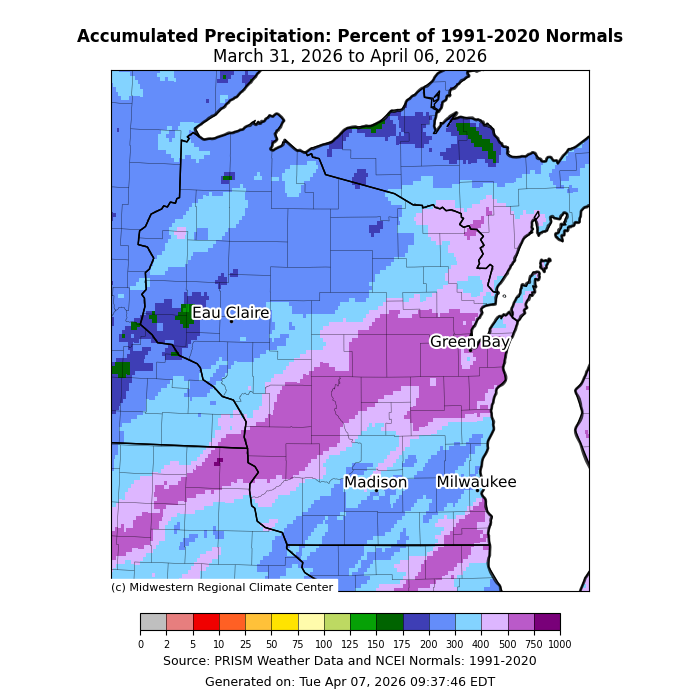
Image Description ↓
Map of Wisconsin and surrounding region showing accumulated precipitation as percent of 1991–2020 normals, March 31–April 6, 2026. Northern Wisconsin received 25–100% of normal precipitation (light blue). A large area covering central and southern Wisconsin — including Madison, Milwaukee, and the region extending toward Green Bay — received 150–400%+ of normal (pink to deep purple), indicating significant above-normal precipitation. A few isolated spots near Eau Claire and northeastern Wisconsin exceeded 400–1000% of normal (dark green/dark purple). Source: PRISM Weather Data and NCEI Normals; generated April 7, 2026.
- The heaviest precipitation was in a band stretching from Prairie du Chien to Green Bay, with totals of 3-5”.
- The far southeast corner of Wisconsin also received 3-5”.
- Most of the state experienced precipitation totals last week that were 200-400% of average.
- Flood warnings are in effect for several rivers as of April 7. Check the National Weather Service website for details.
30 Day Precipitation Total and Percent of Average
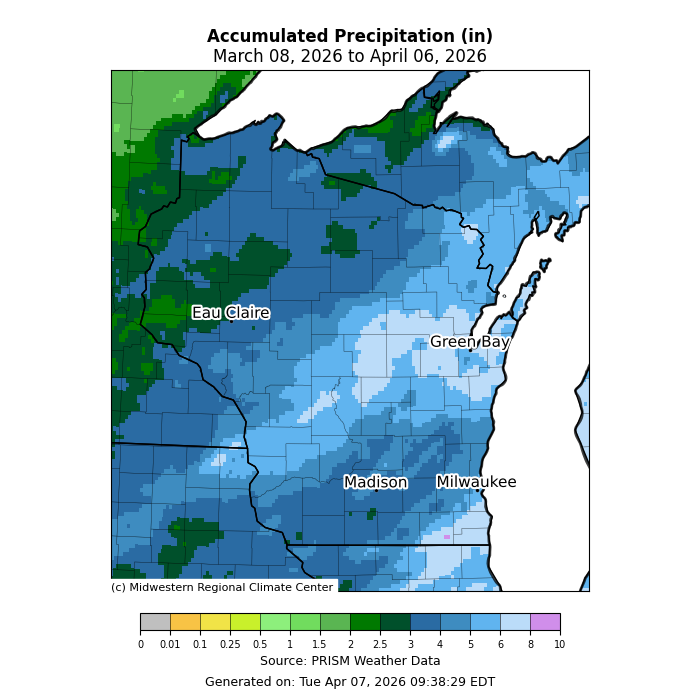
Image Description ↓
PRISM precipitation map of Wisconsin and surrounding region showing 1–3 inches accumulated March 8–April 6, 2026. Northwest Wisconsin and Minnesota border areas received 4–10+ inches (dark green). Central Wisconsin near Eau Claire shows 3–5 inches. Southern Wisconsin including Madison and Milwaukee received 1–2 inches (light blue). Green Bay area shows 2–3 inches. A notable low-precipitation pocket (under 1 inch, shown in white/light gray) appears in central Wisconsin between Eau Claire and Green Bay. Color scale ranges from 0.01 inches (gray) to 10+ inches (dark green/teal). Source: Midwestern Regional Climate Center, generated April 7, 2026.
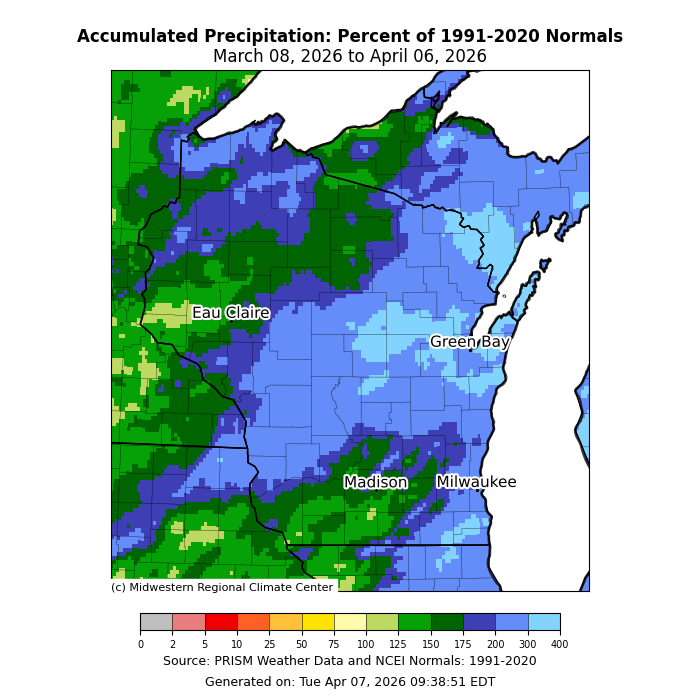
Image Description ↓
A color-coded map from the Midwestern Regional Climate Center displaying accumulated precipitation as a percent of 1991–2020 normals across Wisconsin and neighboring states for March 8 through April 6, 2026. Northern Wisconsin and the area around Eau Claire show dark blue and green shading, indicating 125–300%+ of normal precipitation. Central and southern Wisconsin, including Madison and Milwaukee, appear in light blue, representing roughly 75–125% of normal. The color scale ranges from 0 (white/tan) through yellow, green, blue, and purple up to 400% of normal. Source data is PRISM Weather Data and NCEI Normals.
- The highest totals (including rain and melted snow) were in central, northeastern, and far southeast counties. Totals here ranged from 5-8”.
- Most of the state saw precipitation totals that were 150% or more of average, with some locations at or above 300% of normal.
- South-central and northwest counties were closer to normal, with totals of 2-4”.
90 Day Precipitation Total and Percent of Average
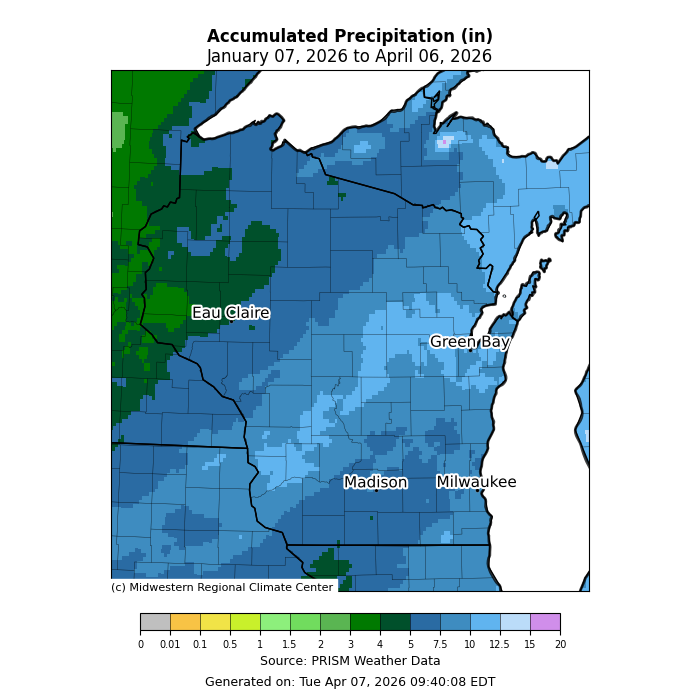
Image Description ↓
Map of accumulated precipitation (inches) across Wisconsin and neighboring states, January 7–April 6, 2026, based on PRISM weather data. Most of Wisconsin shows 2–5 inches (light blue). A diagonal band of higher precipitation (5–7.5 inches, medium blue) runs from southwest to northeast. The western edge near Minnesota shows significantly higher totals (7.5–12.5 inches, darker blue/green). Far western areas near the Minnesota border reach 12.5–20+ inches (dark green). Cities labeled: Eau Claire, Green Bay, Madison, Milwaukee. Madison and Milwaukee fall in the 3–5 inch range. Source: Midwestern Regional Climate Center. Generated April 7, 2026.
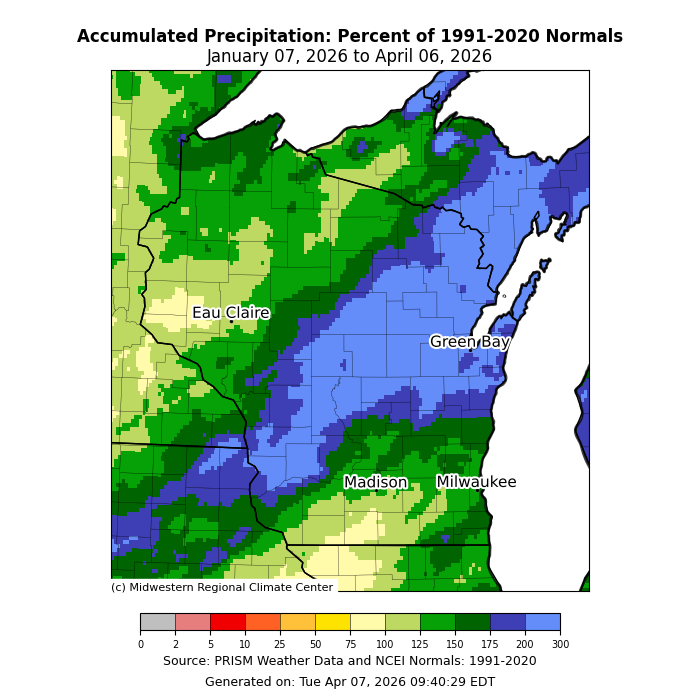
Image Description ↓
Map of Wisconsin and Upper Michigan showing accumulated precipitation as percent of 1991–2020 normals, January 7–April 6, 2026. Northwestern Wisconsin and the Upper Peninsula received 125–200%+ of normal precipitation (dark green). Central and eastern Wisconsin, including Madison, Milwaukee, and Green Bay, received 50–75% of normal (blue/light blue), indicating a significant deficit. Southern Wisconsin borders show below-normal values (yellow/tan, 25–50%). Data from PRISM/NCEI; generated April 7, 2026.
- The highest precipitation totals were in a band stretching from the southwest to the northeast, with totals of 7.5-12.5”. Totals in this band were 200-300% of normal.
- Precipitation totals were closer to average in the south and northwest (4-7.5”).
2026 Precipitation
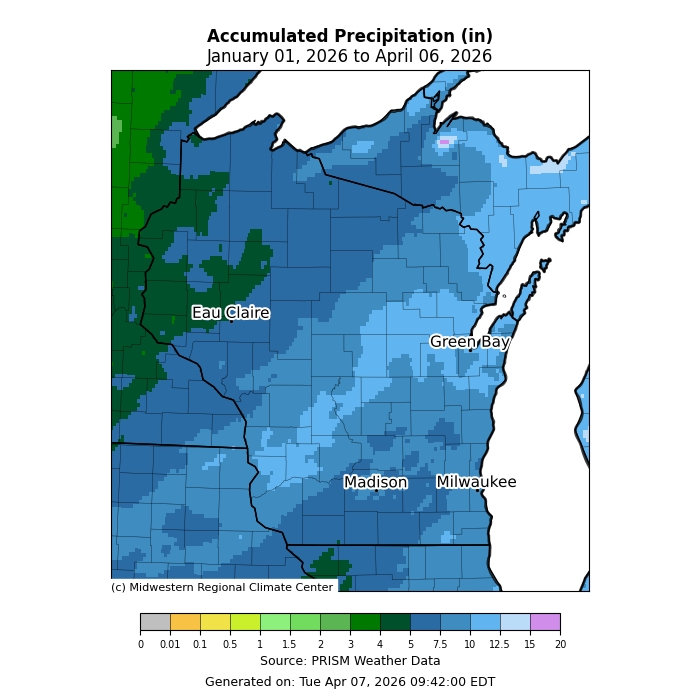
Image Description ↓
Map of accumulated precipitation across Wisconsin and neighboring areas, Jan 1–Apr 6, 2026. Most of Wisconsin shows 2–5 inches (light to medium blue). Northwestern Wisconsin and western Minnesota received significantly more — 7.5–12.5 inches (dark green). Madison and Milwaukee areas show approximately 3–5 inches. Data source: PRISM Weather Data via Midwestern Regional Climate Center.
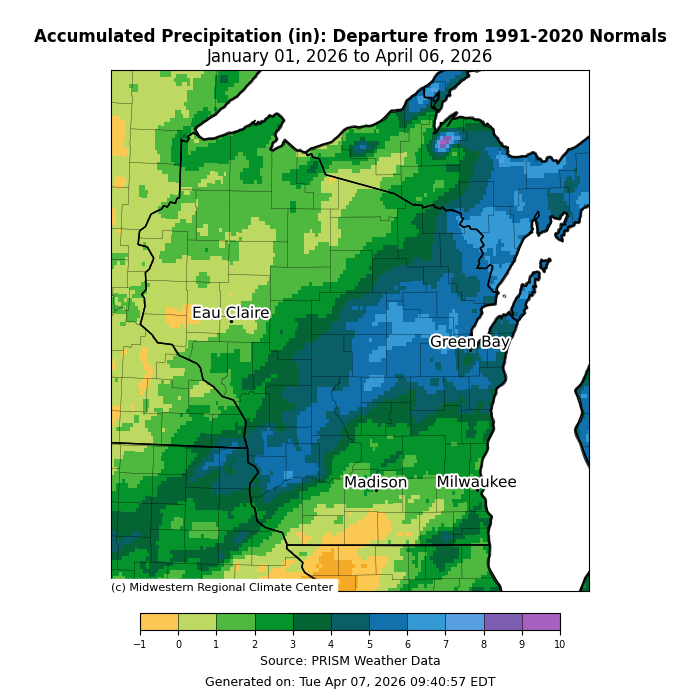
Image Description ↓
Map of Wisconsin showing accumulated precipitation departure from 1991–2020 normals, January 1–April 6, 2026. Eastern Wisconsin (Green Bay, Milwaukee, Madison) shows 6–9 inches above normal (dark blue). Western Wisconsin near Eau Claire shows 2–4 inches above normal (green). Far southern Wisconsin show near-normal or slightly below-normal precipitation (yellow/orange). A small area near Lake Superior’s northern shore shows 10+ inches above normal (purple). Data source: PRISM Weather Data via Midwestern Regional Climate Center.
Snowfall Trends
30 Day Snowfall
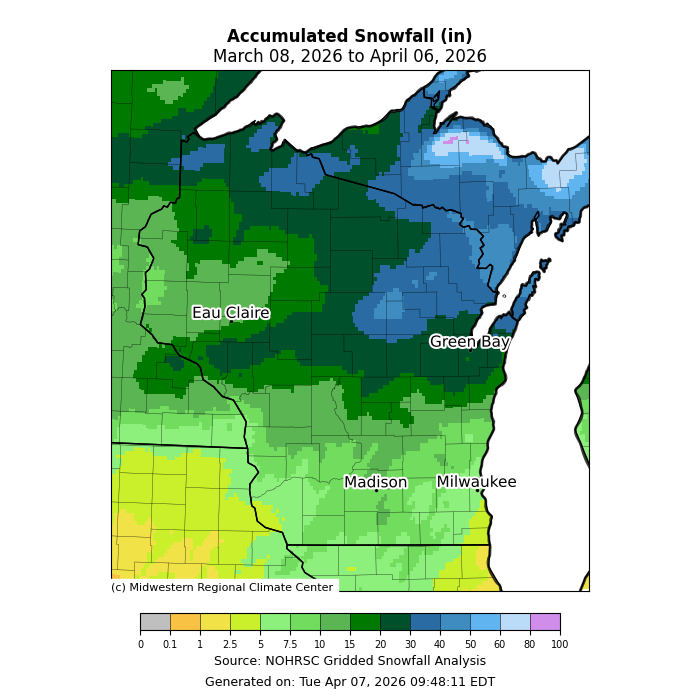
Image Description ↓
NOHRSC gridded snowfall analysis map of Wisconsin and surrounding states showing accumulated snowfall in inches from March 8 to April 6, 2026. Northern Wisconsin received the heaviest snowfall, with 20–40+ inches shown in blue near Green Bay and the Upper Peninsula border. Central Wisconsin, including areas around Eau Claire, received 10–20 inches (dark green). Southern Wisconsin, including Madison and Milwaukee, received 5–10 inches (light green). Far southern portions of Illinois and Iowa show 1–5 inches (yellow-green). A small pink/magenta area in far northeastern Wisconsin indicates 60–100 inches. Color scale ranges from 0 (gray) to 100+ inches (magenta). Map generated April 7, 2026, by the Midwestern Regional Climate Center.
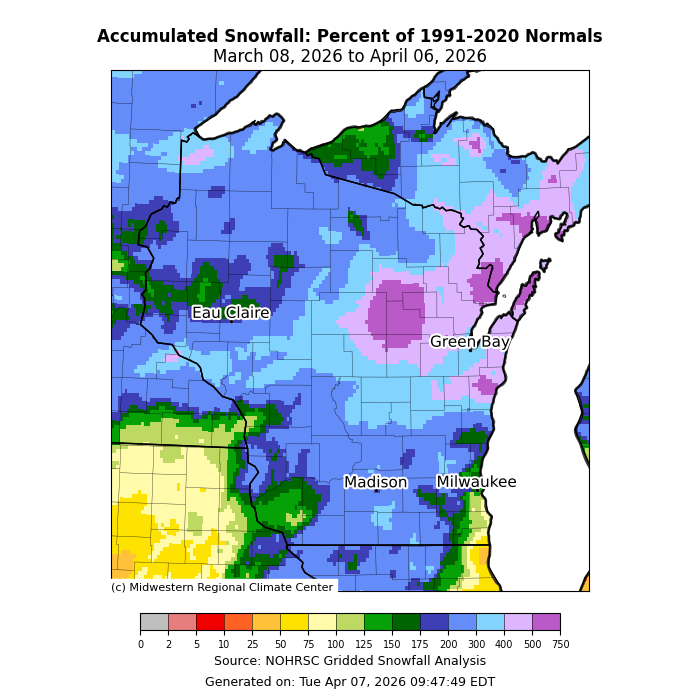
Image Description ↓
Color-coded map of Wisconsin and surrounding areas showing accumulated snowfall as a percent of 1991–2020 normals from March 8 to April 6, 2026. The majority of Wisconsin appears in light blue, indicating 75–125% of normal snowfall. A prominent dark purple/magenta region centered near Green Bay and extending inland shows 200–300%+ of normal. Areas north and west near Eau Claire show mixed blue and green patches (50–75% and 25–50% of normal). Southern Wisconsin near Madison and Milwaukee falls in the 75–100% range. Western border areas display yellow and green, indicating below-normal snowfall (25–50%). Small green patches in far northern Wisconsin and the Upper Peninsula indicate above-normal totals (150–175%). Labeled cities include Eau Claire, Green Bay, Madison, and Milwaukee. Source: NOHRSC Gridded Snowfall Analysis; generated April 7, 2026.
- Snow was abundant over the past 30 days in Wisconsin, as most of the state saw snowfall totals at or above 200% of normal.
- Totals were highest in the northeast counties (30-50”), primarily from the March 14-16 winter storm.
- Elsewhere in Wisconsin, totals ranged from 5-15”.
Seasonal Snowfall
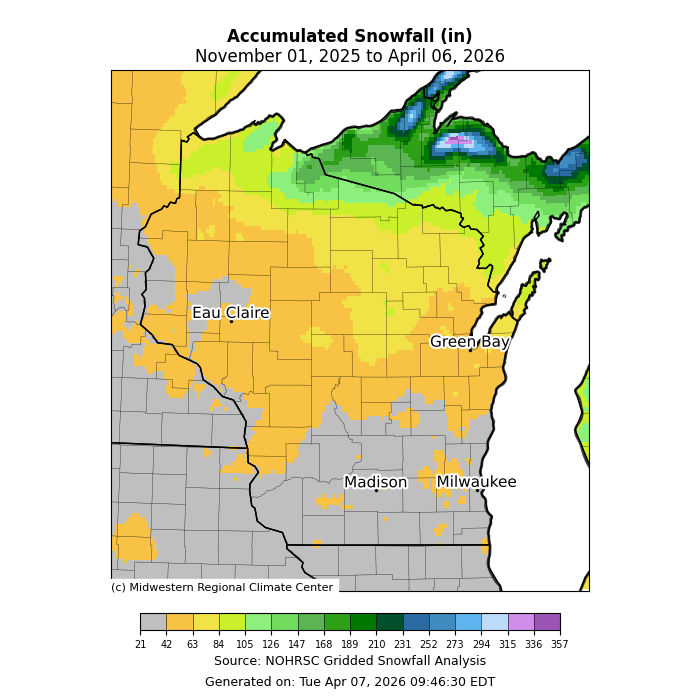
Image Description ↓
Choropleth map of Wisconsin and surrounding states showing seasonal snowfall totals from the NOHRSC Gridded Snowfall Analysis. Northern Wisconsin received the heaviest accumulation, with the far north (particularly around the Lake Superior shoreline) reaching 294–357+ inches. The color scale runs from orange (21–63 inches) in southern Wisconsin — including Madison and Milwaukee — through yellow-green and green in central and northern regions, to blue and purple in the extreme north. Eau Claire and Green Bay fall in the light green range (~105–168 inches). Southern Wisconsin is mostly gray (below 21 inches or no data). Generated April 7, 2026.
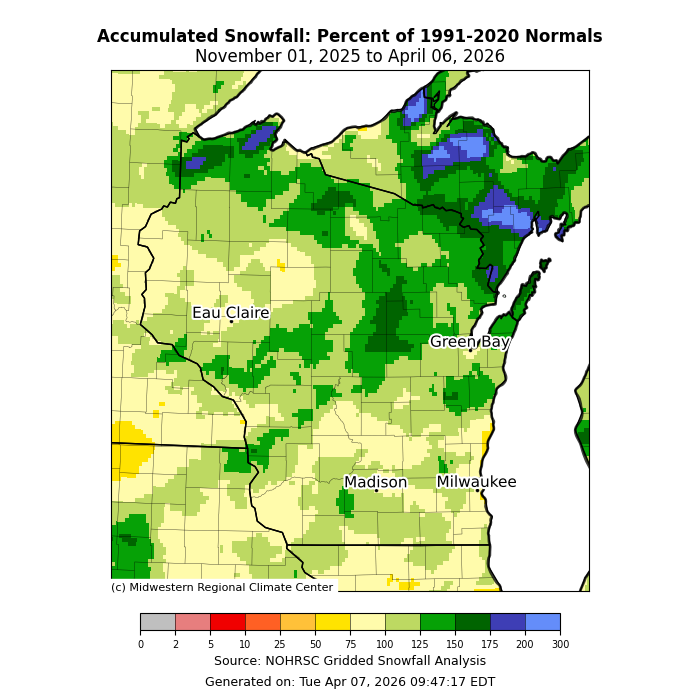
Image Description ↓
Choropleth map from the Midwestern Regional Climate Center showing accumulated snowfall as a percentage of 1991–2020 normals for November 1, 2025 through April 6, 2026, sourced from NOHRSC Gridded Snowfall Analysis. A color scale ranges from gray (0%) through yellow-green, green, dark green, light blue, to dark blue (300%). Northern Wisconsin — particularly areas near Green Bay, the Lake Superior shoreline, and northeast counties — shows 150–300% of normal snowfall (dark green to blue). Central Wisconsin shows 75–125% of normal (medium green). Southern Wisconsin, including Madison and Milwaukee, shows 25–75% of normal (light yellow-green). Western Wisconsin near Eau Claire is mixed, with patches of 50–100%.
Current Snow Depth
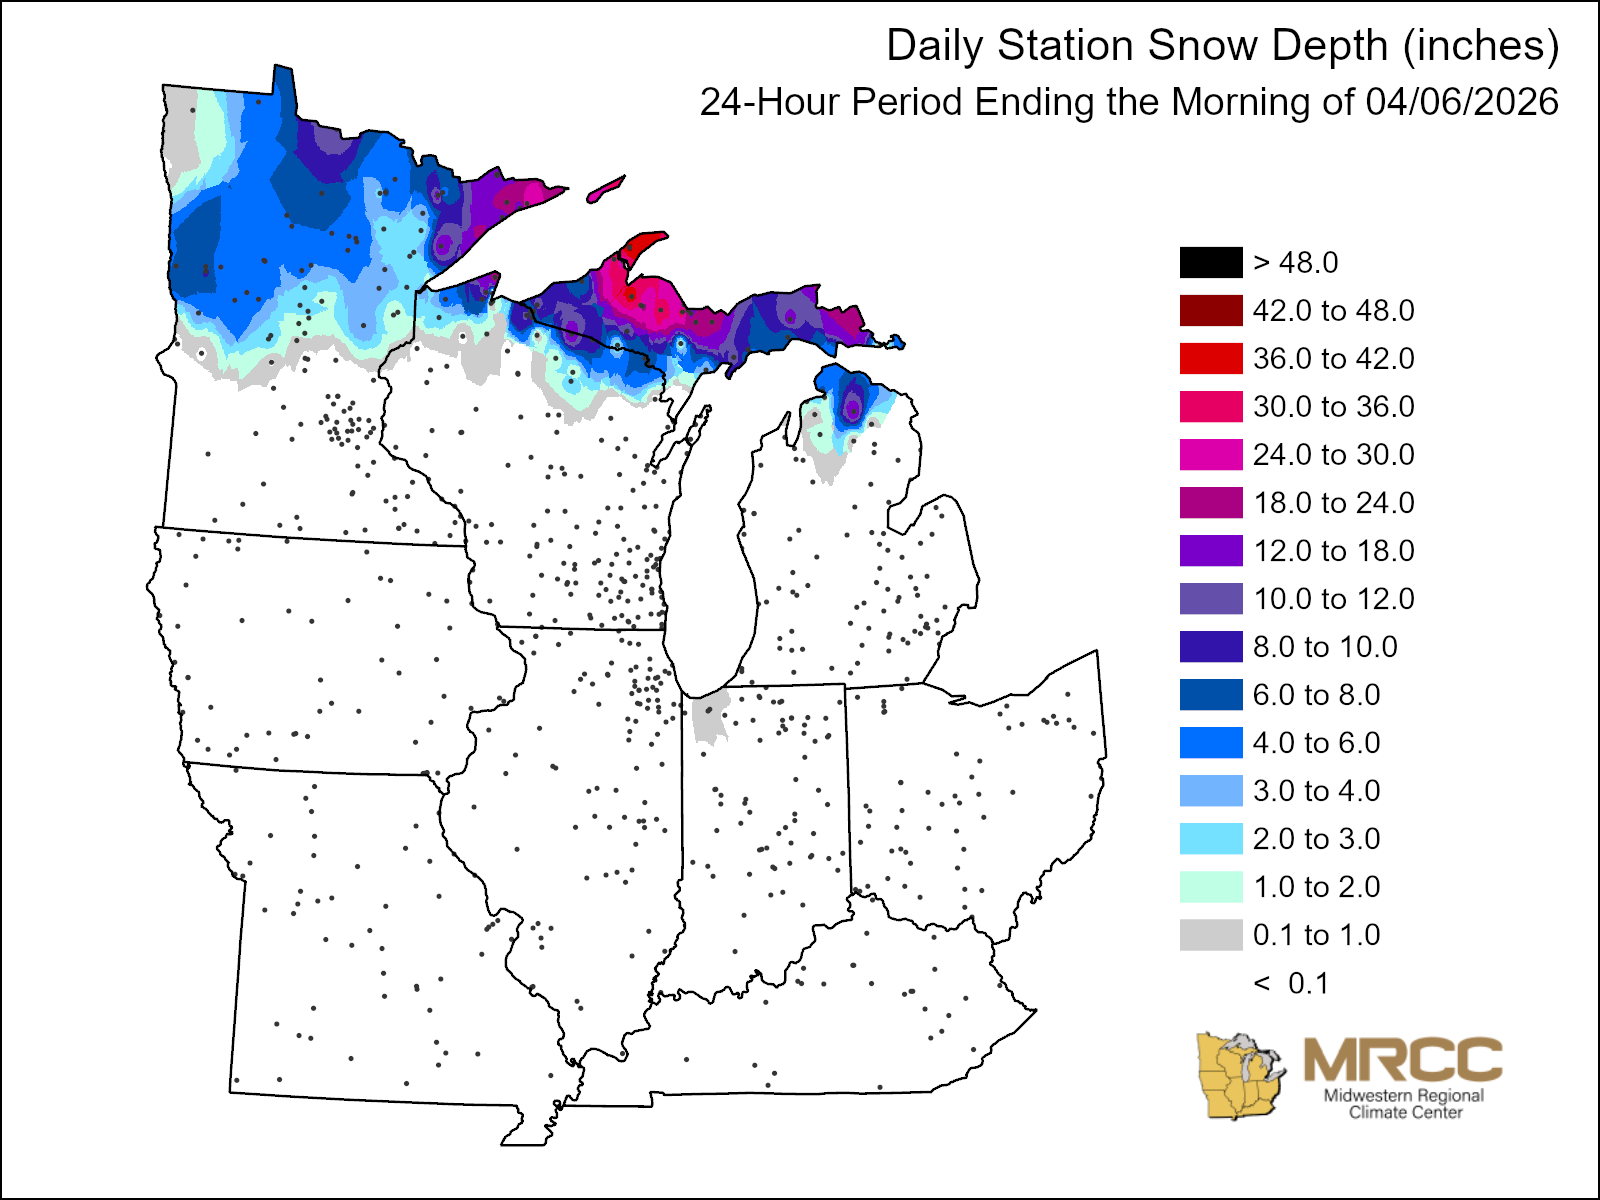
Image Description ↓
A color-coded station snow depth map from the Midwestern Regional Climate Center showing a 24-hour period ending the morning of April 6, 2026. The map covers a multi-state Midwest region including Minnesota, Wisconsin, Michigan, Iowa, Illinois, Indiana, Ohio, and surrounding states. Snow depths are represented by a 16-tier color scale ranging from less than 0.1 inches (white/no color) to greater than 48 inches (black).
The heaviest snow accumulation is concentrated in two areas: northwestern and north-central Minnesota (dark blue to purple, approximately 6–18 inches) and the Upper Peninsula of Michigan and far northern Wisconsin, where the deepest snow appears in red and magenta tones indicating 36–48+ inches. A small area of black (greater than 48 inches) may be present at the northern Minnesota border. The southern and central portions of all states shown — including all of Iowa, Illinois, Indiana, Ohio, and southern Wisconsin — show no measurable snow depth (less than 0.1 inches). Individual station observation dots are visible throughout the map.
Soil Moisture and Temperature Trends
Soil Moisture Models
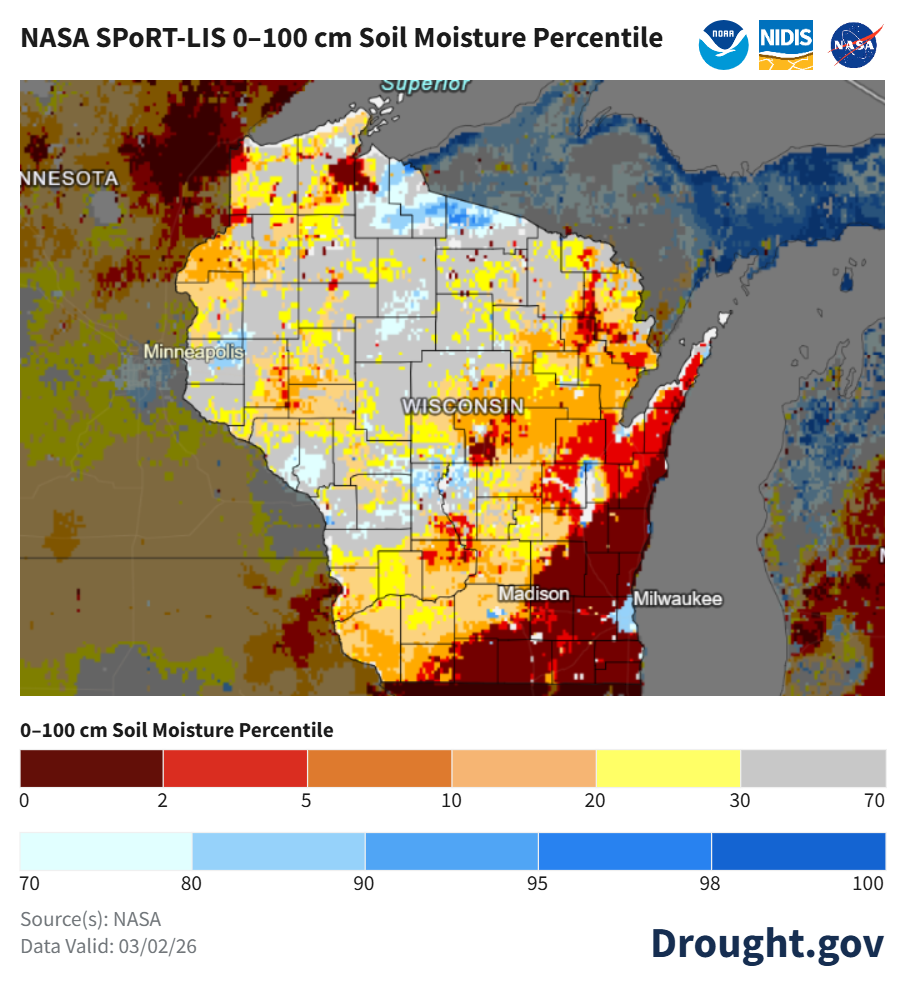
Image Description ↓
NASA SPoRT-LIS 0–100 cm Soil Moisture Percentile map valid March 2, 2026, covering Wisconsin and surrounding states. The color scale runs from dark brown (0th percentile, extreme dryness) through red, orange, and yellow (2–30th percentile), to gray (near normal, ~70th), then light to dark blue (70–100th percentile, extreme wetness).
Wisconsin shows highly variable conditions. Southern and eastern Wisconsin — including the Milwaukee corridor and areas south of Madison — are dominated by dark brown and red tones, indicating soil moisture at the 0–5th percentile (exceptional to extreme drought). Central Wisconsin displays a patchwork of orange, yellow, and gray (10–30th percentile, below normal). Northern Wisconsin trends toward gray and light blue, reflecting near-normal to slightly above-normal moisture. Minnesota to the west is predominantly dark brown, indicating severe to exceptional drought. Lake Superior’s shoreline and Michigan’s Upper Peninsula appear in deep blue, reflecting high moisture at the 95–100th percentile. Source logos: NOAA, NIDIS, and NASA appear in the upper right.
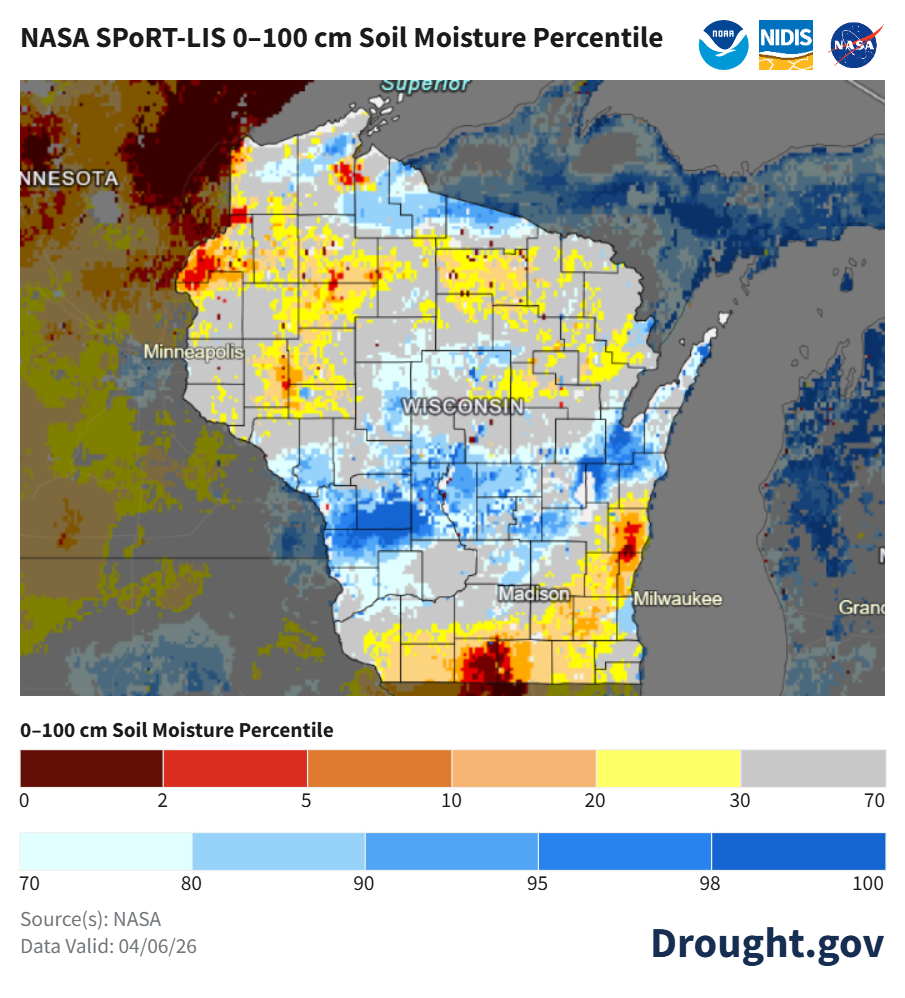
Image Description ↓
NASA SPoRT-LIS 0–100 cm Soil Moisture Percentile map valid April 6, 2026, showing Wisconsin and surrounding states. A color scale ranges from dark red (percentile 0–2, extremely dry) through orange, yellow, gray (near-normal, 30–70), to dark blue (95–100, extremely wet). Central and south-central Wisconsin shows high moisture (blue, 90th–98th percentile). Northern Wisconsin is mixed, with pockets of yellow and orange (10th–20th percentile, drier than normal). Southern Wisconsin near the Illinois border shows dark red and orange areas (below 5th percentile, severely dry). Minnesota to the west is predominantly dark red and brown, indicating extreme drought. Lake Superior and Lake Michigan areas appear dark blue. Logos for NOAA, NIDIS, and NASA appear in the upper right. Source credited to NASA via Drought.gov.
- Widespread improvements in soil moisture in the top 1 meter of soil across central Wisconsin, along with improvements in the southern and eastern dryness.
- Soils in the central counties are now near normal or wetter than normal.
- Minimal change in soil moisture percentile in the northwest counties where precipitation totals over the past 30 days have been lower.
- Notes on how to interpret the maps:
- Red areas = top 5 driest in 100 years.
- Dark red areas = top 2 driest in 100 years.
- Dark blue areas = top 2 wettest in 100 years.
Wisconet Soil Moisture
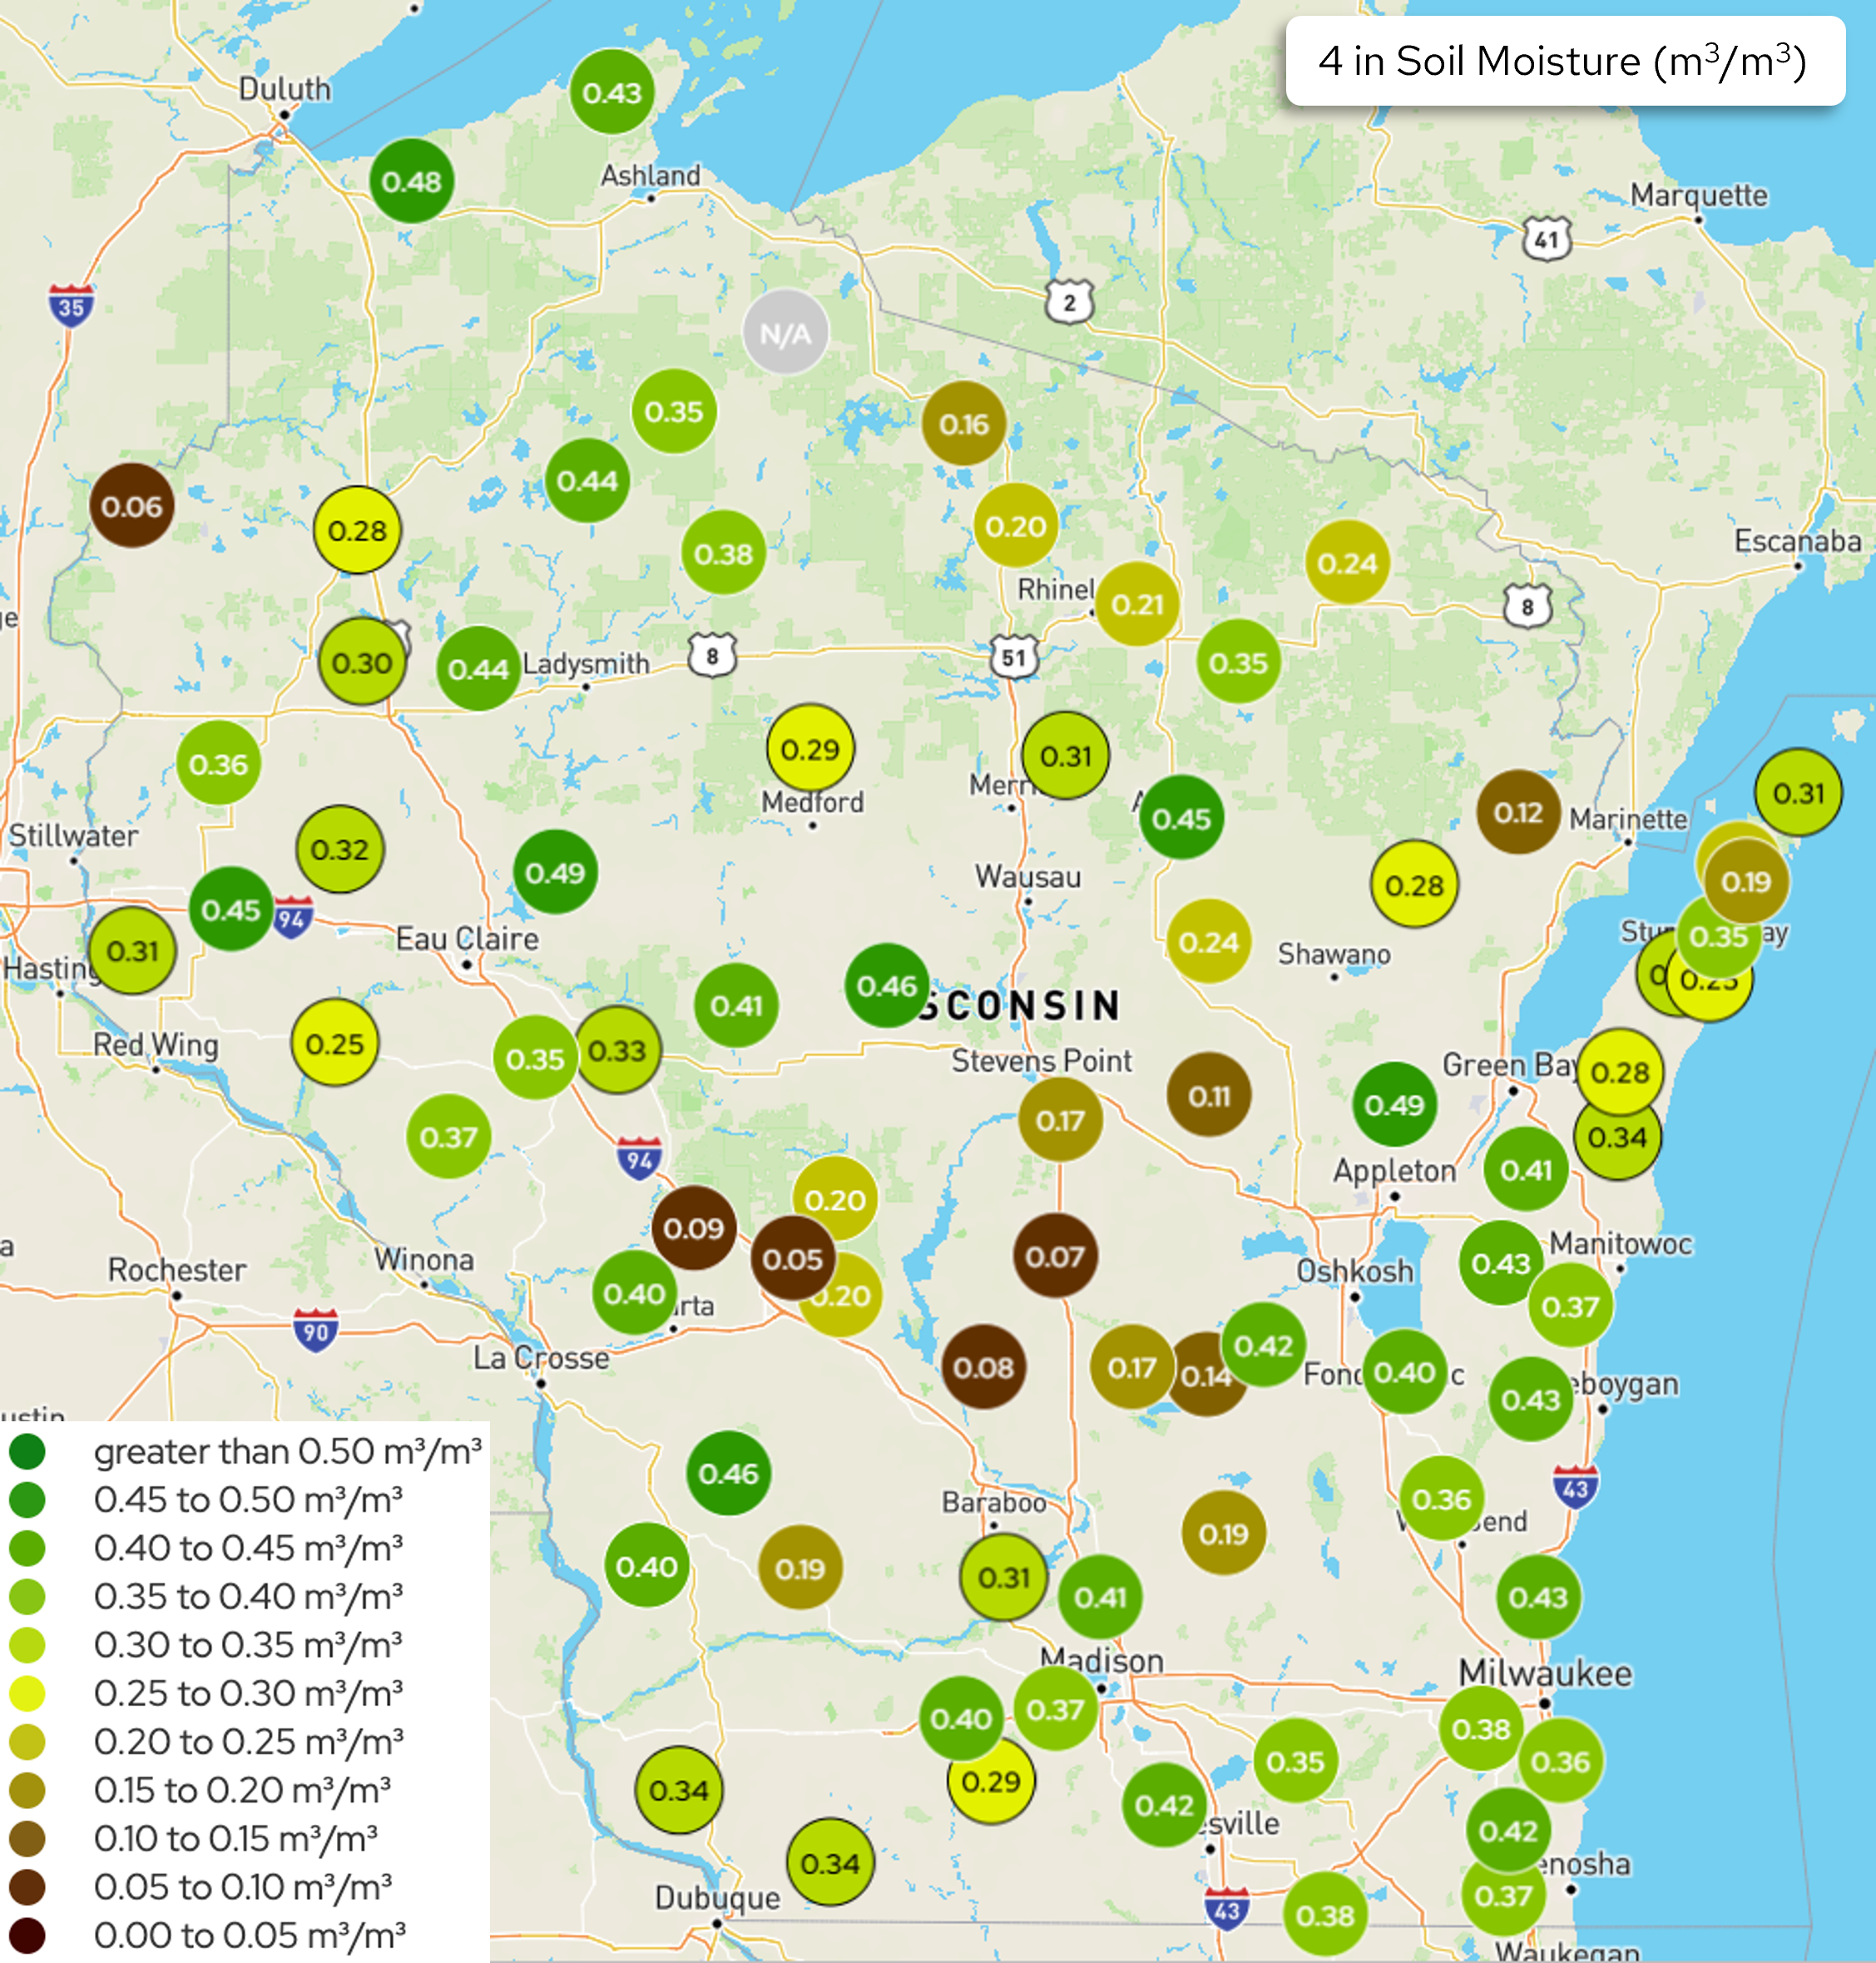
Image Description ↓
Map of Wisconsin showing 4-inch soil moisture readings (m³/m³) at monitoring stations statewide. Values range from near 0 to 0.49. Northern and northwestern Wisconsin stations generally show higher moisture (0.35–0.49, dark green). Central and southern Wisconsin show mixed readings, with notably dry pockets in the south-central region near the Wisconsin River (0.05–0.09, dark brown/maroon). Eastern Wisconsin along Lake Michigan shows moderate moisture (0.28–0.43). One station near Ashland is marked N/A. Color legend runs from dark green (greater than 0.50) through yellow-green, yellow, olive, tan, brown, to dark maroon (0.00–0.05).
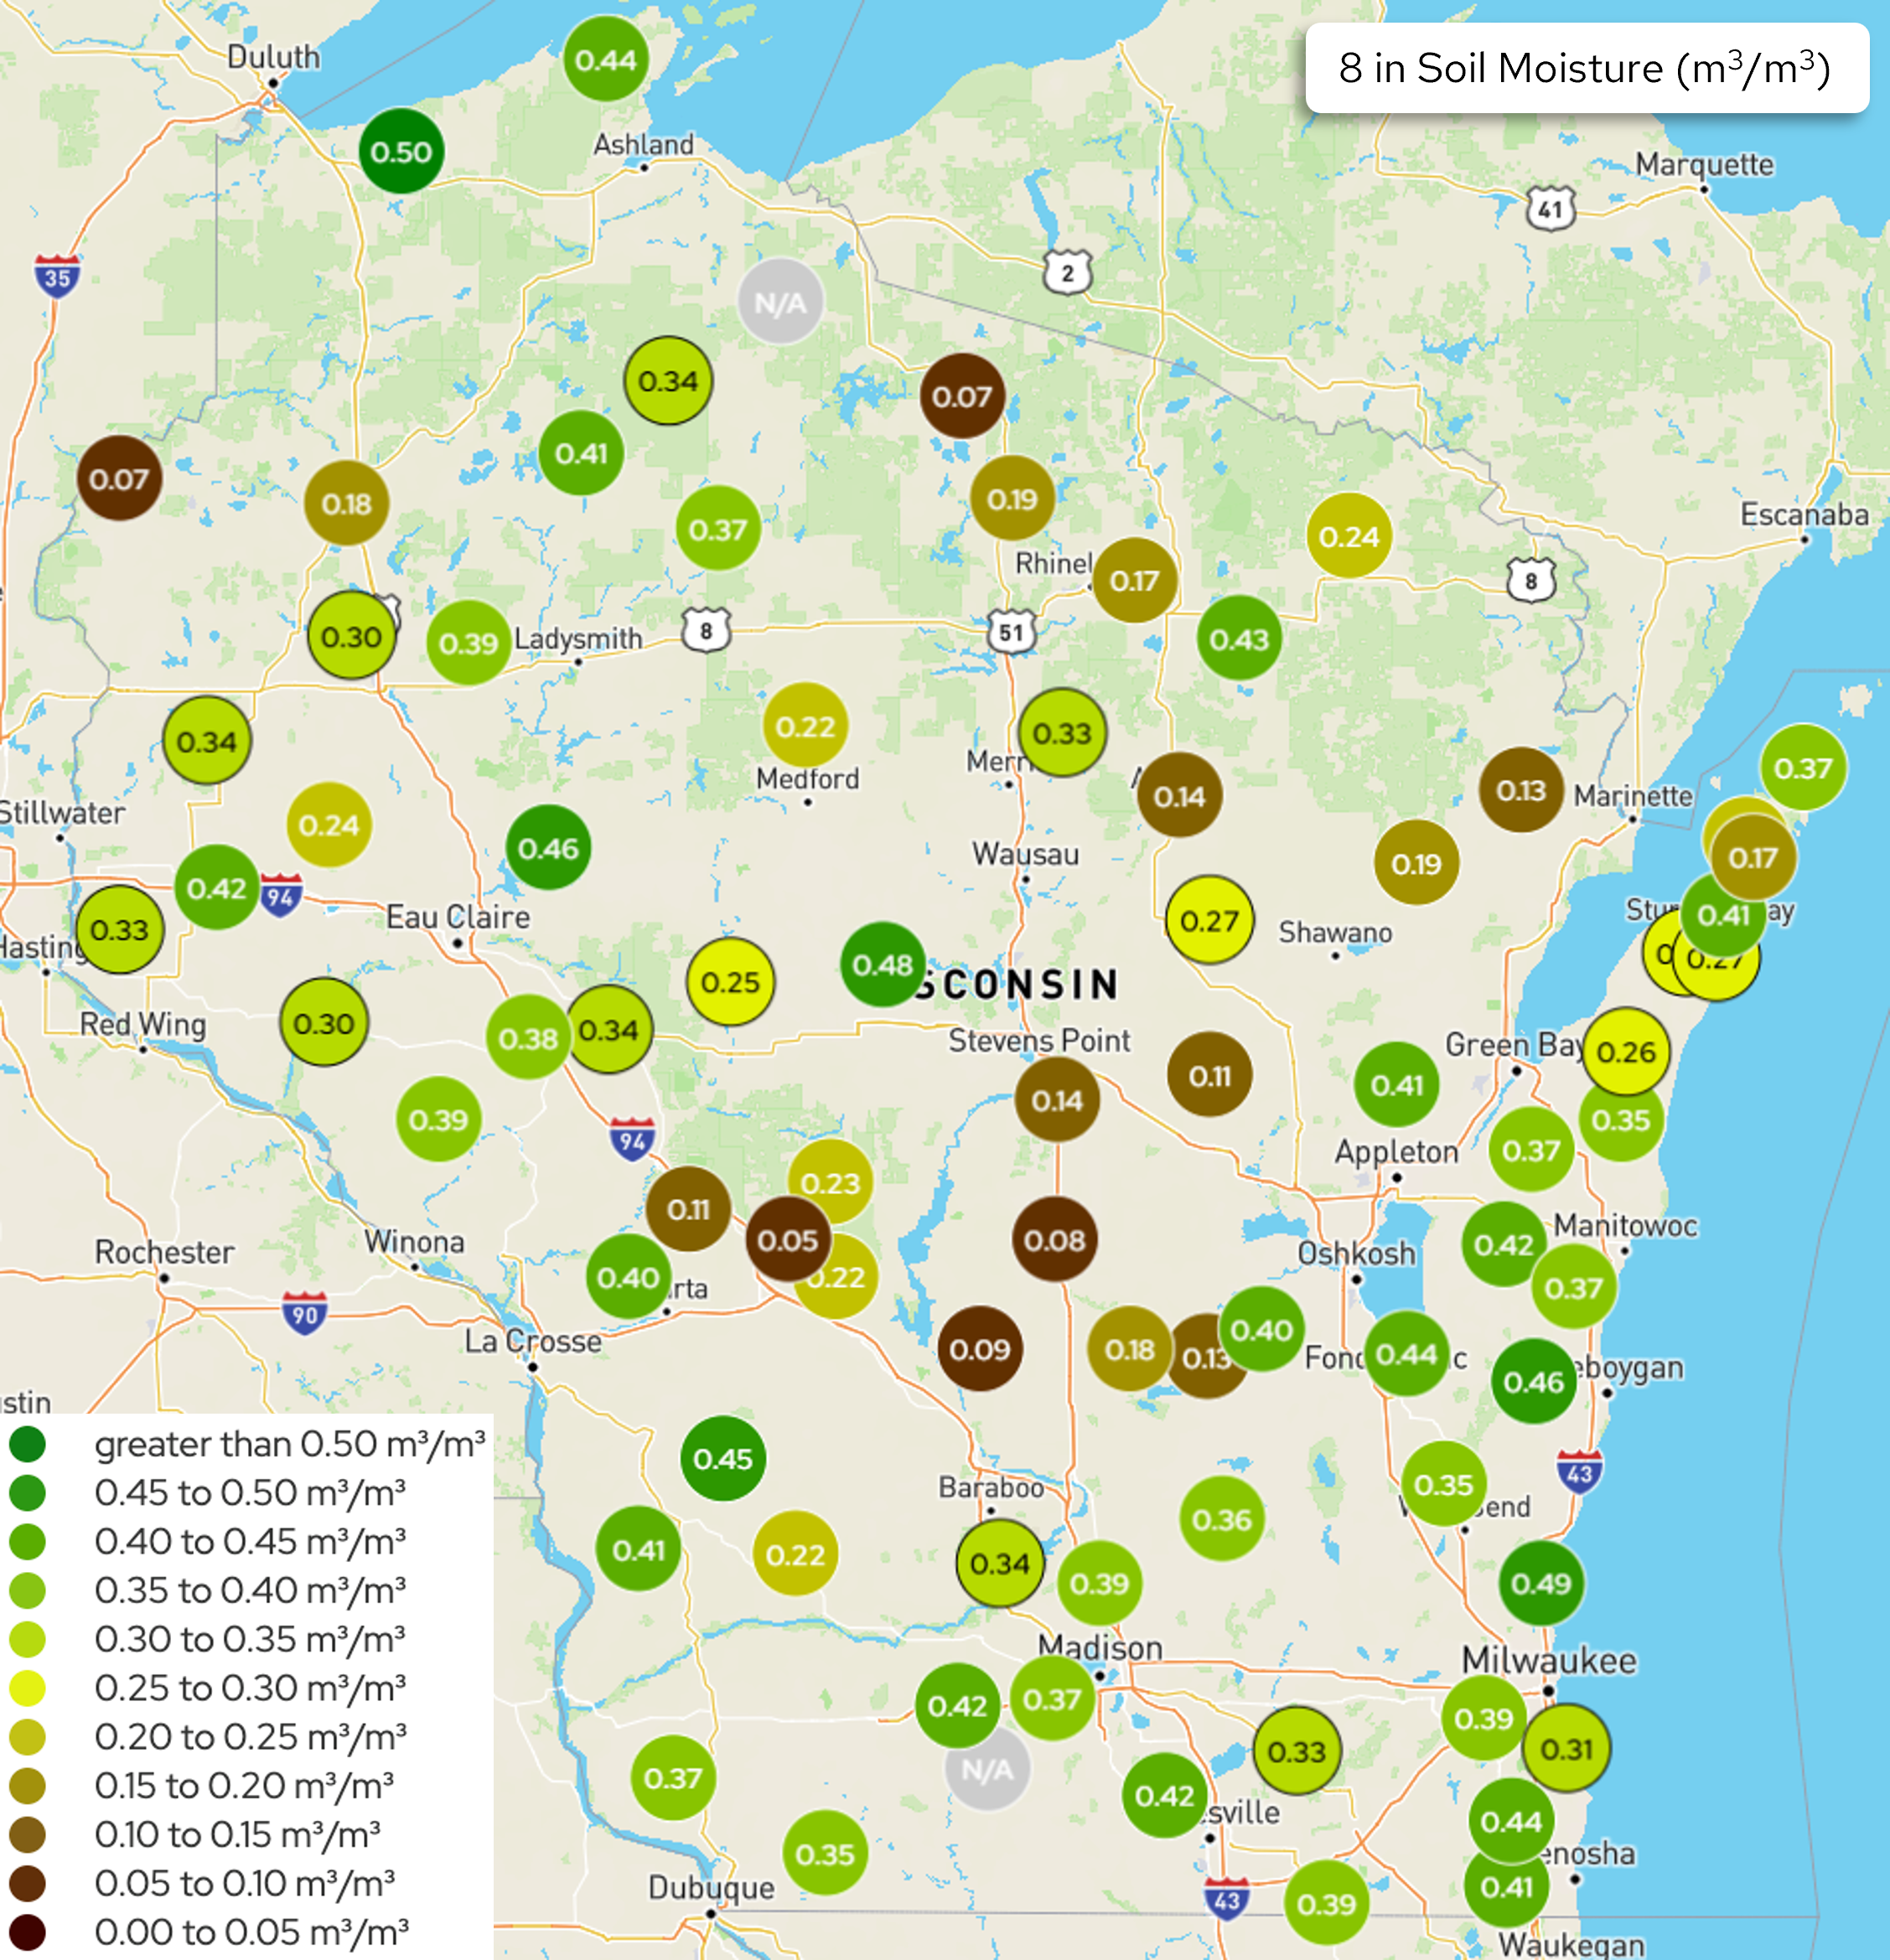
Image Description ↓
A color-coded dot map of Wisconsin displaying 8-inch depth soil moisture readings in m³/m³. Dots range from dark brown (very dry, 0.00–0.10) to dark green (very wet, above 0.50). Northwestern Wisconsin shows higher moisture (0.41–0.50). A central corridor running north to south shows notably dry conditions (0.05–0.14), particularly near Stevens Point and La Crosse. Eastern Wisconsin near Green Bay and the Lake Michigan shoreline shows moderate to high moisture (0.35–0.46). Southern Wisconsin near Madison shows mixed readings (0.33–0.42). One sensor in northern Wisconsin and one near Madison are marked N/A. The legend lists 11 color categories from dark green to dark brown.
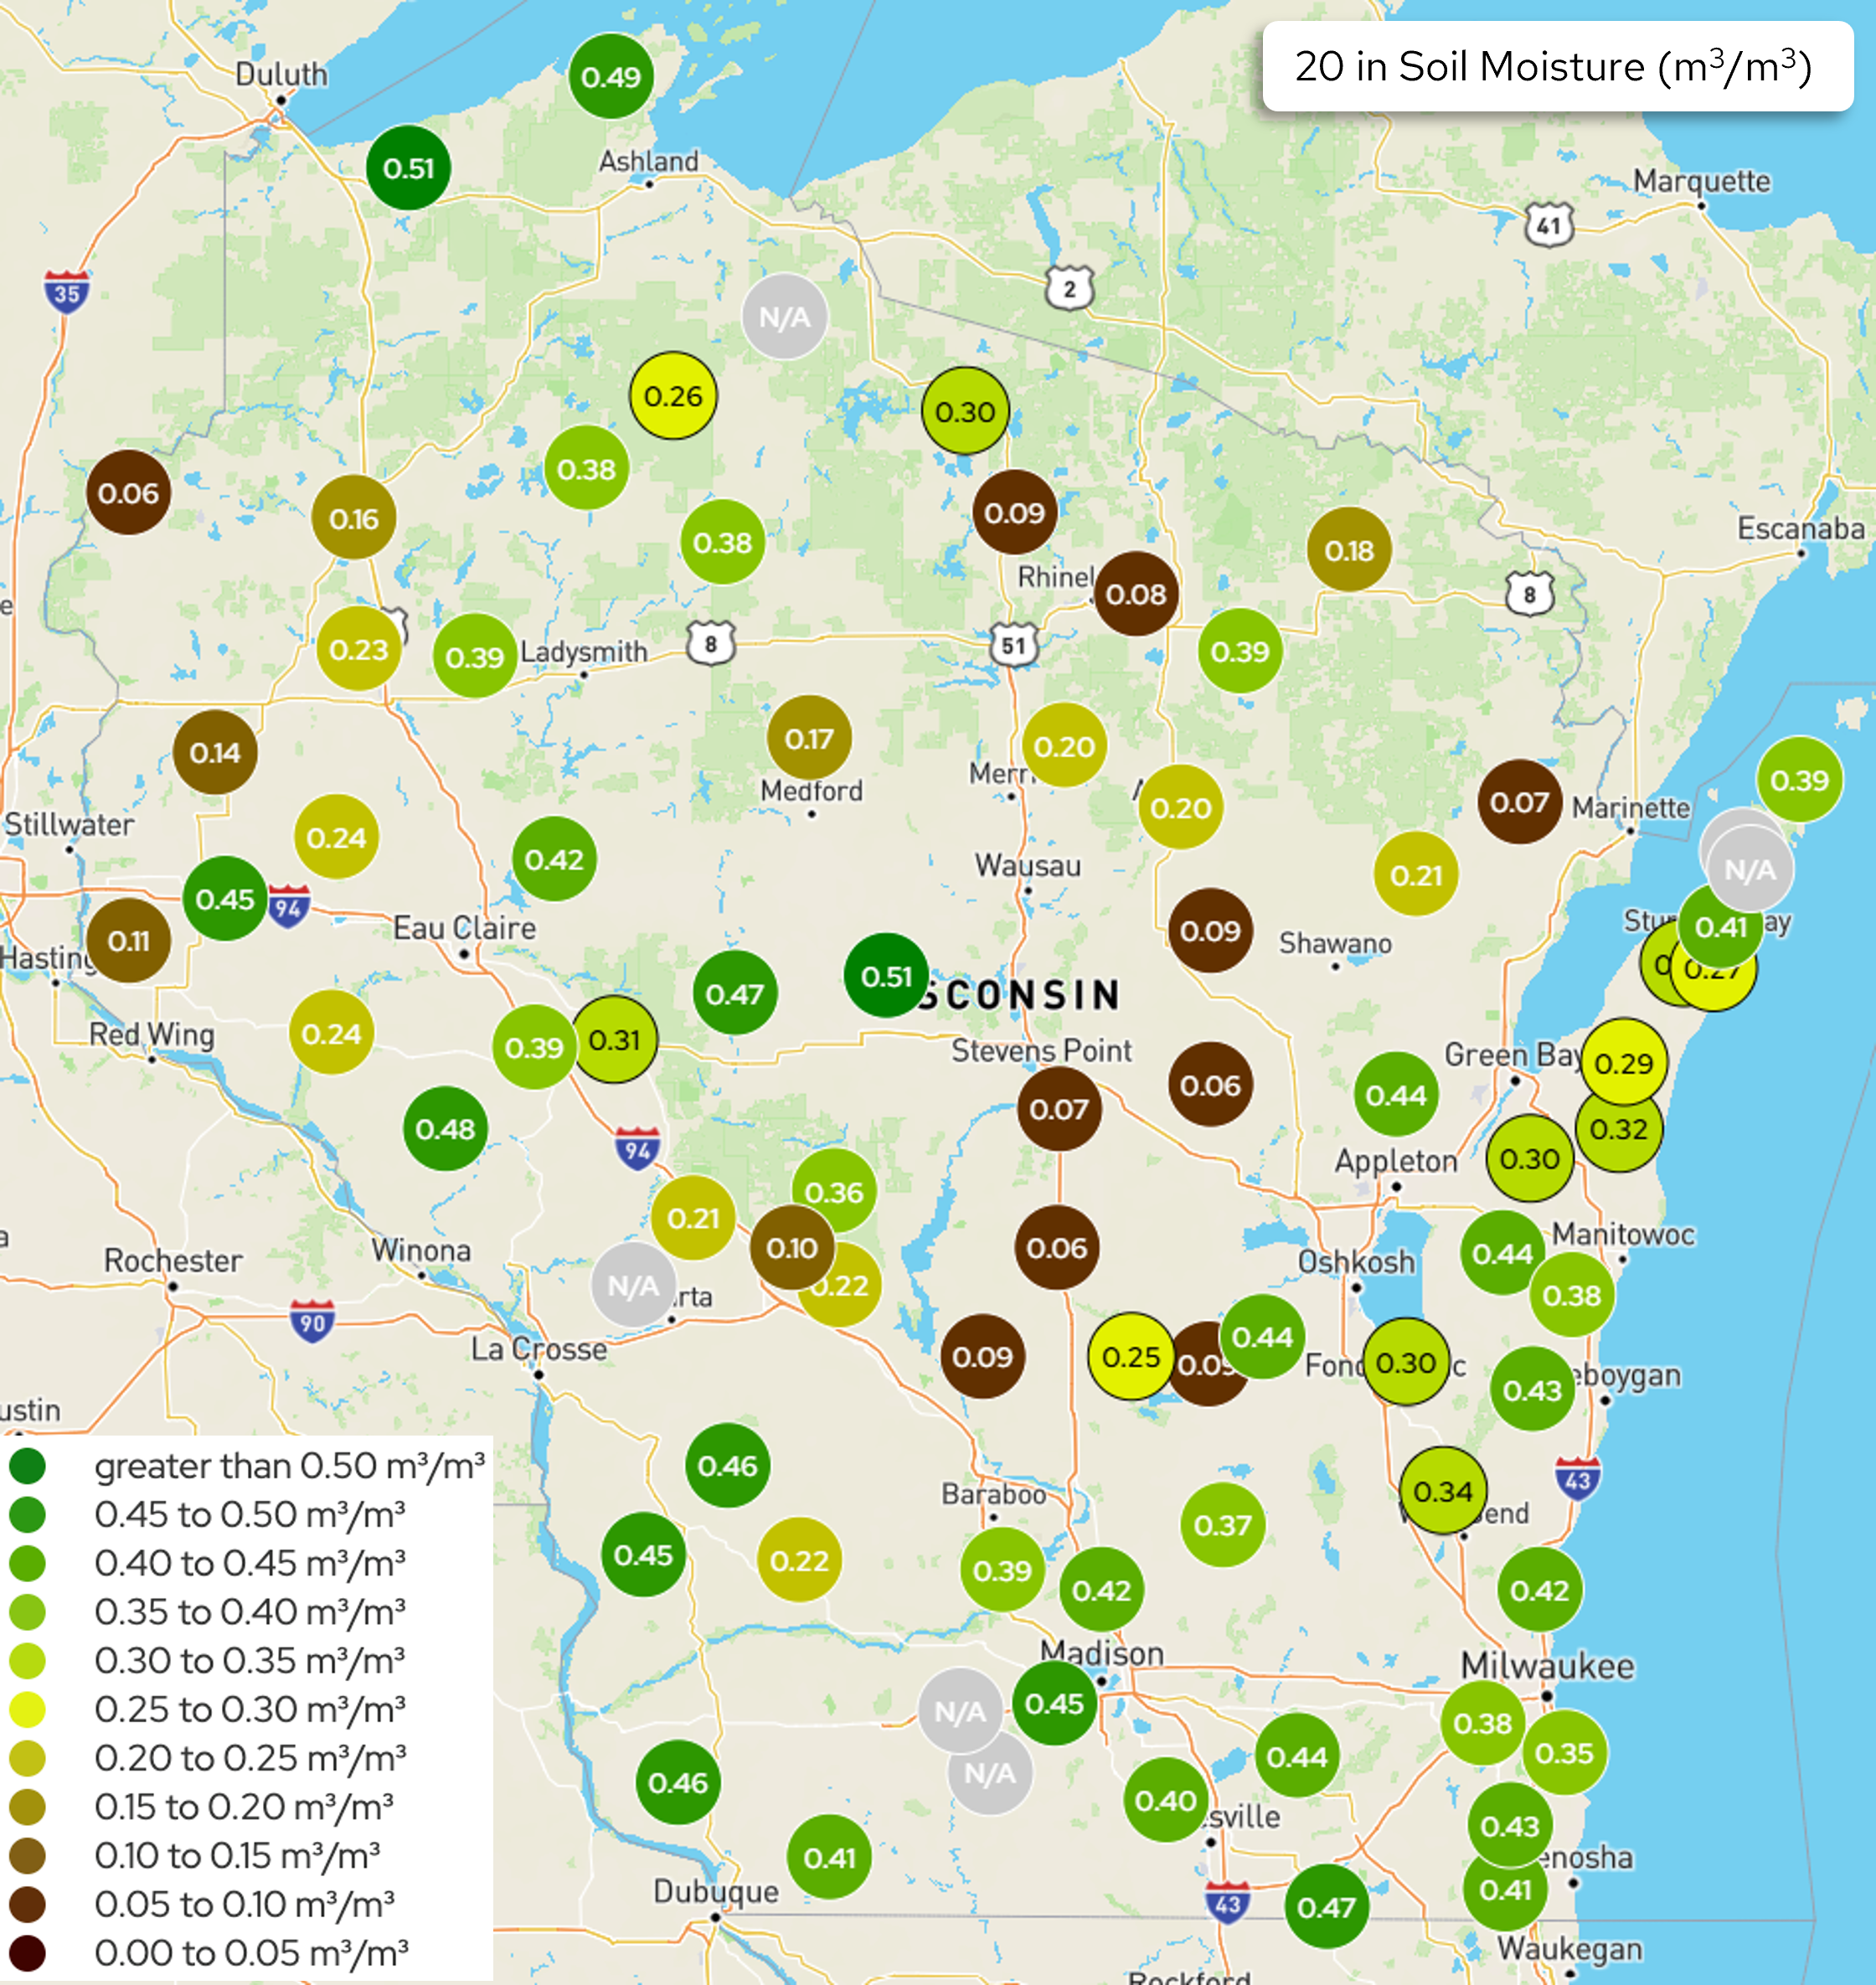
Image Description ↓
A color-coded map of Wisconsin displaying soil moisture readings at 20-inch depth measured in m³/m³. Circular markers are placed at monitoring stations across the state, colored on an 11-tier scale from dark maroon (0.00–0.05) through brown, olive, yellow-green, and multiple shades of green up to dark green (greater than 0.50). Notable patterns: northern Wisconsin near Lake Superior shows the highest moisture (0.49–0.51); western and central Wisconsin display moderate readings (0.20–0.45); scattered stations in north-central and central Wisconsin show very low readings (0.06–0.09, colored dark brown/maroon); southern and eastern Wisconsin trend moderate-to-high (0.30–0.47). Several stations display “N/A” in gray, indicating no data. A legend in the lower left identifies all color categories. The map includes surrounding state and regional geography for context.
- The maps show Wisconet soil moisture conditions on April 7th @ 12:00 pm.
- The table shows total precipitation and changes in soil moisture from March 30th (Start) to April 7th (End).
- Units of map & change values are {Volume of water}/{Volume of soil}.
| Research Farm | County | Total Precipitation (in.) | 4″ Start | 4″ End | 8″ Start | 8″ End | 20″ Start | 20″ End |
|---|---|---|---|---|---|---|---|---|
| Arlington | Columbia | 2.79 | 0.40 | 0.41 | 0.38 | 0.39 | 0.42 | 0.43 |
| Black River Falls | Jackson | 2.73 | 0.08 | 0.12 | 0.10 | 0.15 | 0.19 | 0.23 |
| Dairy Forage ARS | Sauk | 2.21 | 0.28 | 0.32 | 0.33 | 0.35 | 0.38 | 0.40 |
| Hancock | Waushara | 4.27 | 0.06 | 0.09 | 0.07 | 0.09 | 0.06 | 0.07 |
| Kemp | Oneida | 1.37 | 0.24 | 0.23 | 0.21 | 0.21 | 0.09 | 0.10 |
| Lancaster | Grant | 2.79 | 0.31 | 0.35 | 0.35 | 0.38 | 0.45 | 0.46 |
| Marshfield | Marathon | 1.74 | 0.45 | 0.46 | 0.48 | 0.48 | 0.51 | 0.51 |
| O.J. Noer (Turfgrass) | Dane | 2.34 | 0.33 | 0.38 | 0.35 | 0.37 | 0.44 | 0.45 |
| Peninsular | Door | 2.62 | 0.27 | 0.35 | 0.24 | 0.41 | 0.37 | 0.41 |
| Rhinelander | Oneida | 1.12 | 0.20 | 0.24 | 0.17 | 0.19 | 0.07 | 0.09 |
| Spooner | Washburn | 1.51 | 0.29 | 0.29 | 0.19 | 0.19 | 0.15 | 0.17 |
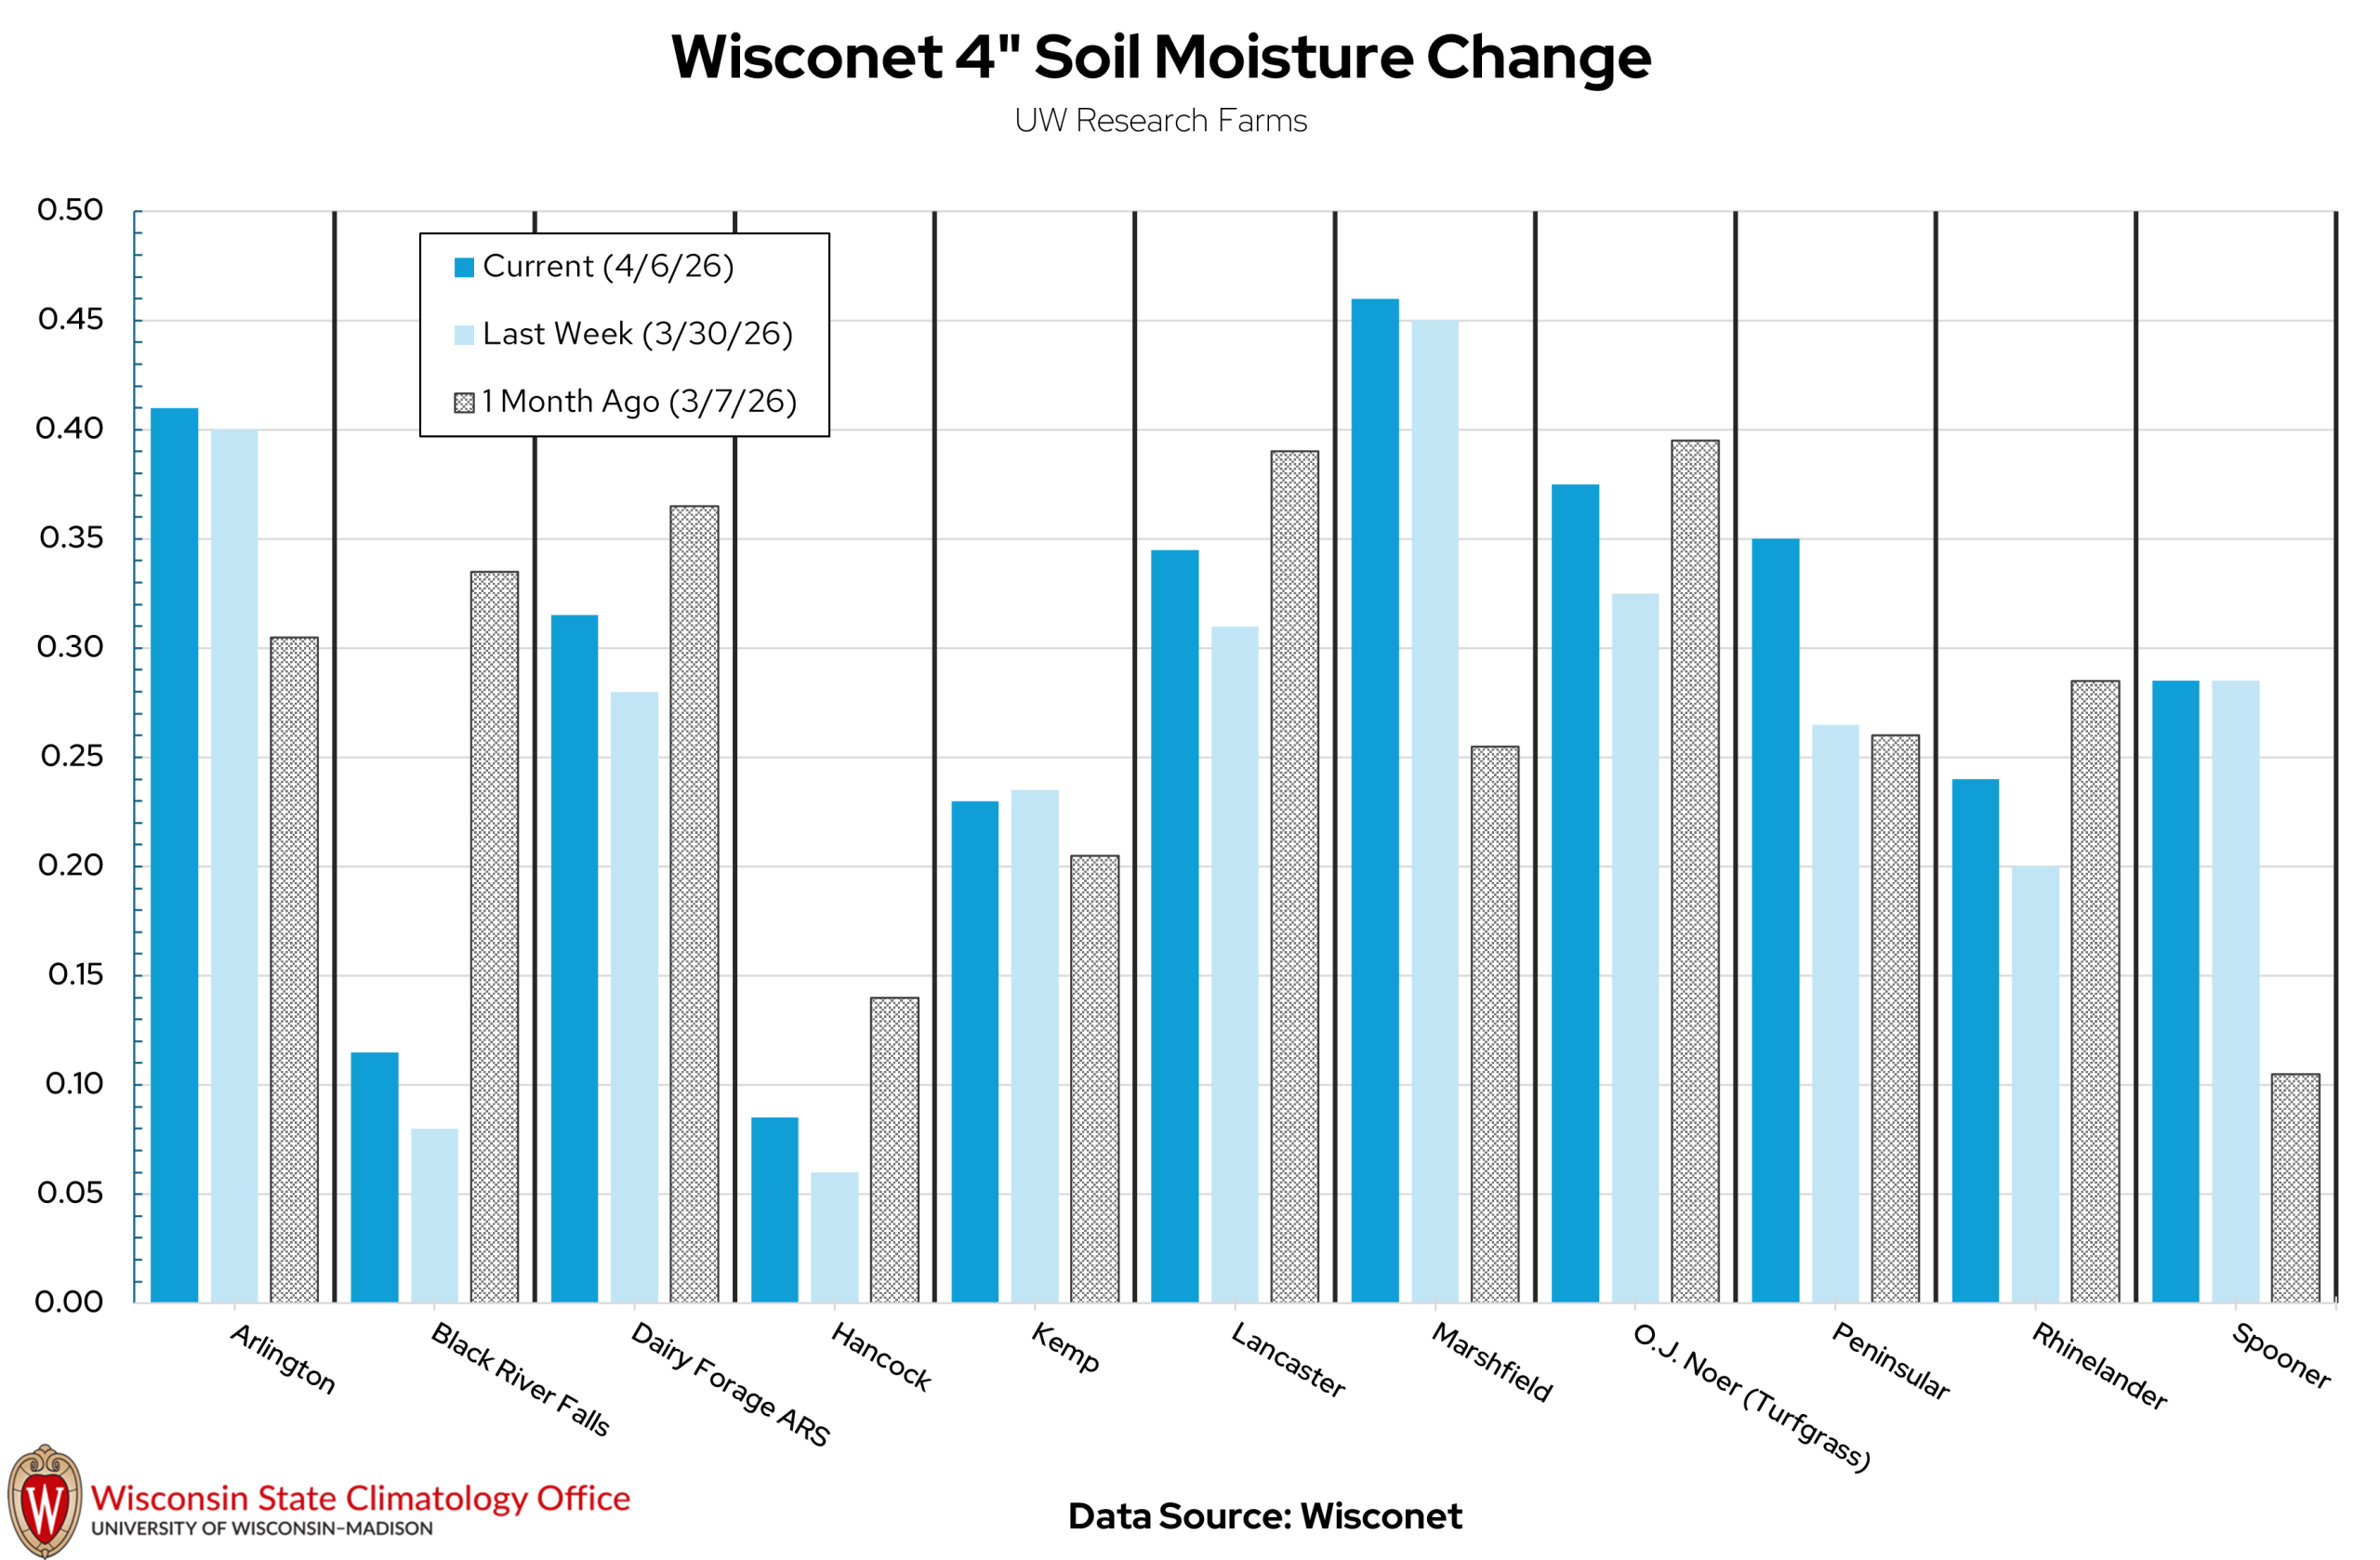
Image Description ↓
Grouped bar chart from the Wisconsin State Climatology Office showing 4-inch soil moisture change (scale 0.00–0.50) at 12 UW Research Farm locations. Three bar colors represent: Current (4/6/26, dark blue), Last Week (3/30/26, light blue), and 1 Month Ago (3/7/26, gray crosshatch).
| Research Farm | Current 4″ Soil Moisture | Last Week’s 4″ Soil Moisture | 1 Month Ago 4″ Soil Moisture |
|---|---|---|---|
| Arlington | 0.41 | 0.40 | 0.31 |
| Black River Falls | 0.12 | 0.08 | 0.34 |
| Dairy Forage ARS | 0.32 | 0.28 | 0.37 |
| Hancock | 0.09 | 0.06 | 0.14 |
| Kemp | 0.23 | 0.24 | 0.21 |
| Lancaster | 0.35 | 0.31 | 0.26 |
| Marshfield | 0.46 | 0.45 | 0.26 |
| O.J. Noer (Turfgrass) | 0.38 | 0.33 | 0.40 |
| Peninsular | 0.35 | 0.27 | 0.26 |
| Rhinelander | 0.24 | 0.20 | 0.29 |
| Spooner | 0.29 | 0.29 | 0.11 |
USDA Soil Moisture Reports
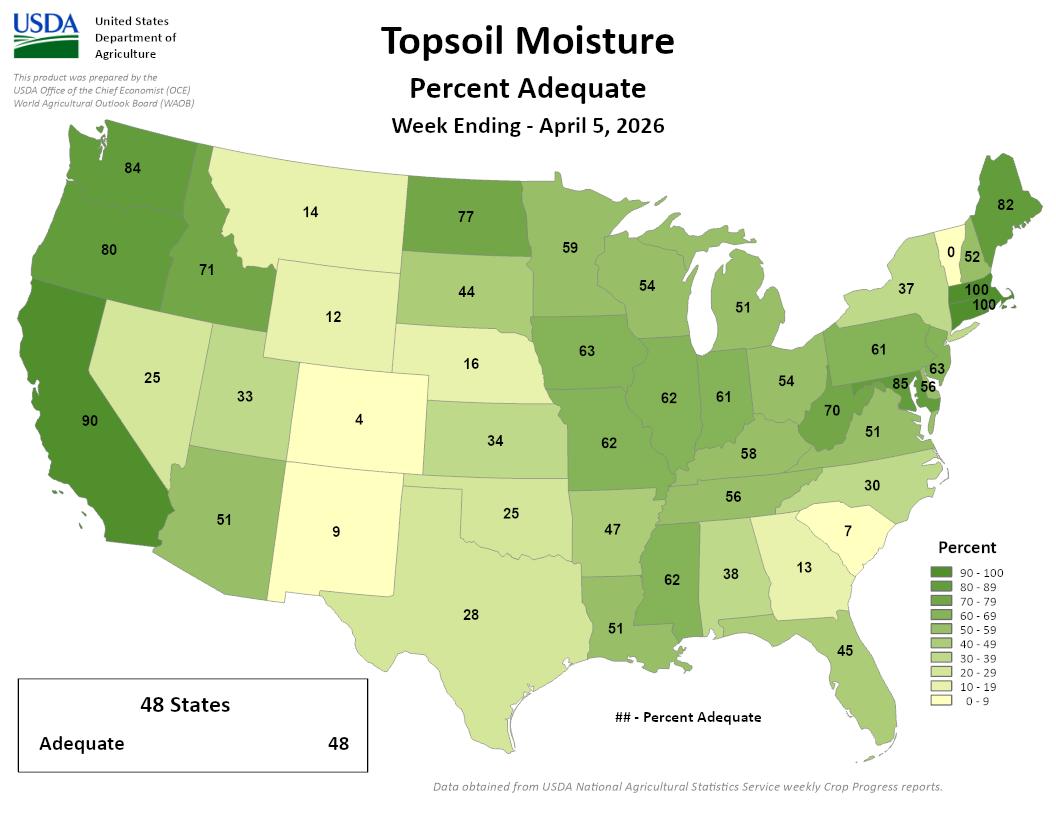
Image Description ↓
USDA choropleth map showing topsoil moisture adequacy across 48 contiguous U.S. states for the week ending April 5, 2026. States are shaded in nine green tones from very light (0–9%) to dark green (90–100%). Notable values: California 90%, Washington 84%, Oregon 80%, North Dakota 77%, Montana 14%, Wyoming 4%, Colorado 12%, New Mexico 9%, South Carolina 13%, Florida 45%, Georgia 38%, Maine 82%, Connecticut/Rhode Island 100%, New Jersey 0%. Most Midwest and mid-Atlantic states range 50–70%. Summary box states all 48 reported states have adequate moisture. Data source: USDA National Agricultural Statistics Service weekly Crop Progress reports.
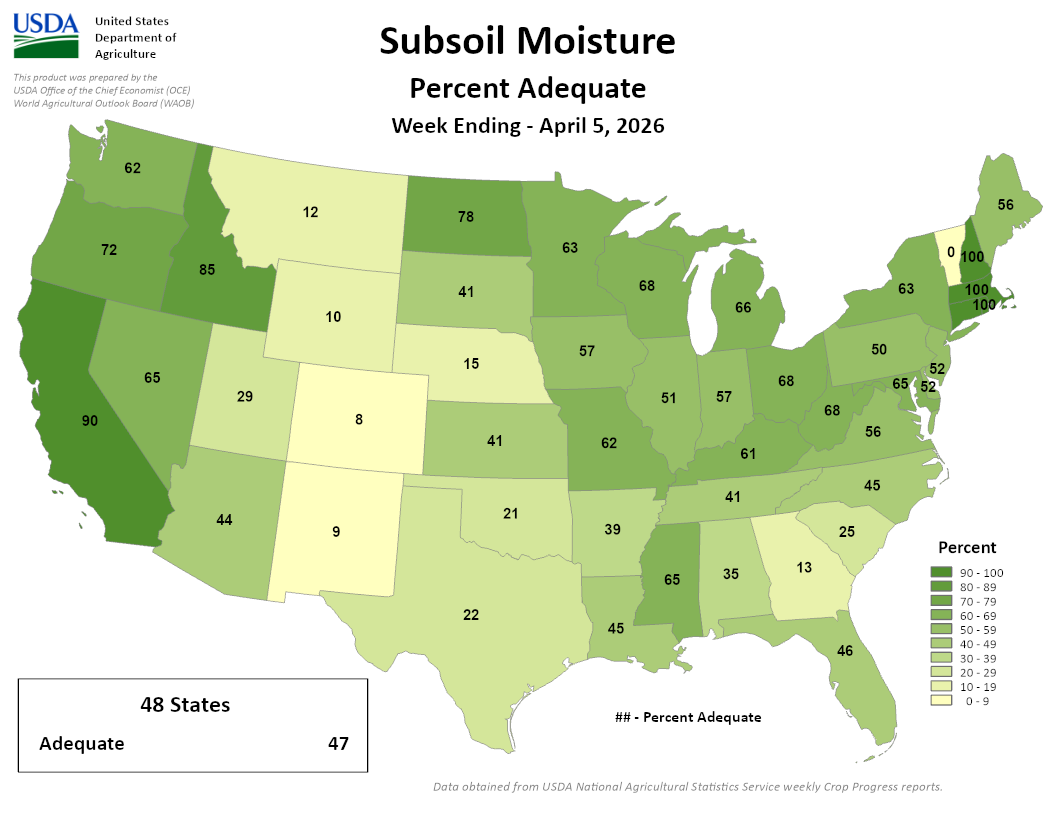
Image Description ↓
USDA choropleth map of the contiguous 48 states showing subsoil moisture percent adequate as of April 5, 2026, produced by the USDA Office of the Chief Economist and World Agricultural Outlook Board. The national summary box reports 47% adequate across 48 states. A green color scale ranges from very light yellow (0–9%) to dark green (90–100%).The driest areas are the central Mountain West (Wyoming, Utah, Colorado, New Mexico) and Alabama. The wettest are California, Oregon, and the Northeast.
- 55-65% of agricultural soils in the state are reported as having adequate topsoil and subsoil moisture.
- 4% of fields in the state are reported as having short to very short topsoil moisture.
Wisconet Soil Temperature
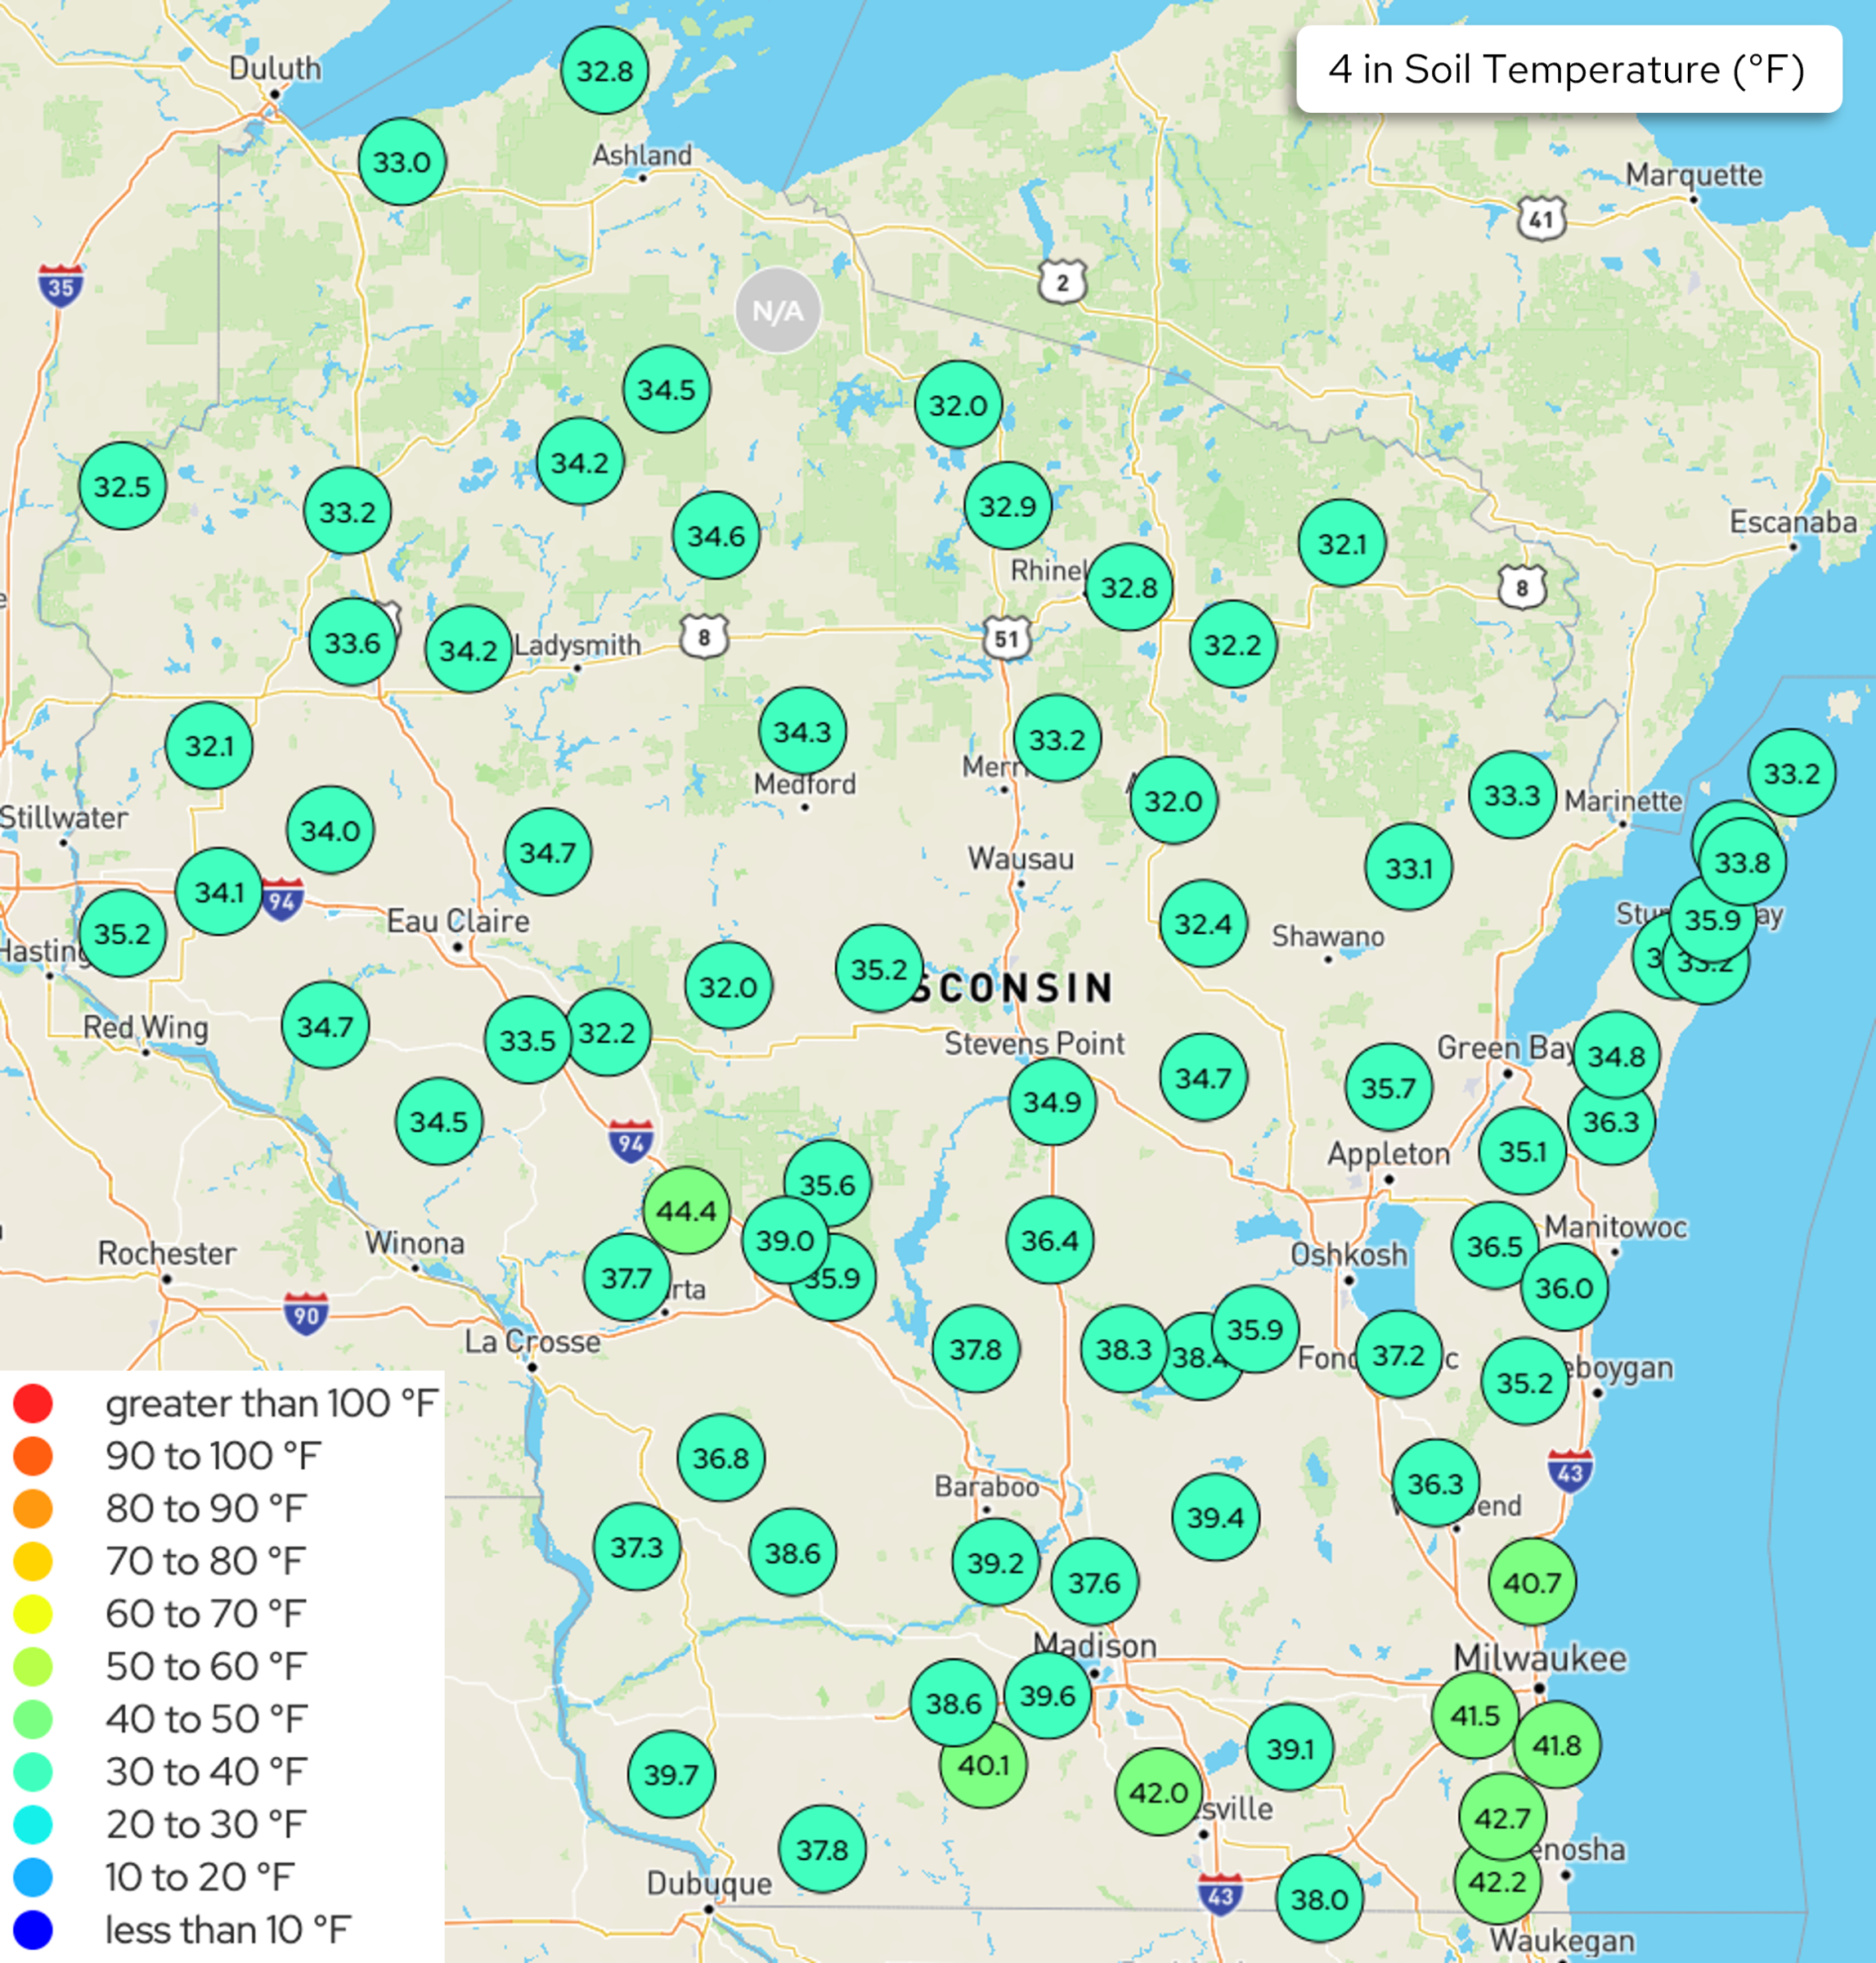
Image Description ↓
A color-coded map of Wisconsin showing 4-inch soil temperatures in °F from weather station monitoring network sites. The majority of readings fall in the 30–40°F range (teal/green circles). Northern Wisconsin stations cluster around 32–35°F. Central Wisconsin ranges from 32–39°F. Southern Wisconsin and the Lake Michigan shoreline show the warmest readings, generally 38–43°F. One outlier near La Crosse reads 44.4°F. A few stations near Green Bay and Milwaukee approach 41–43°F. The legend indicates colors from dark blue (below 10°F) through green shades to red (above 100°F); all visible readings fall in the teal-to-light-green range representing 30–50°F. One station in northern-central Wisconsin is labeled N/A.
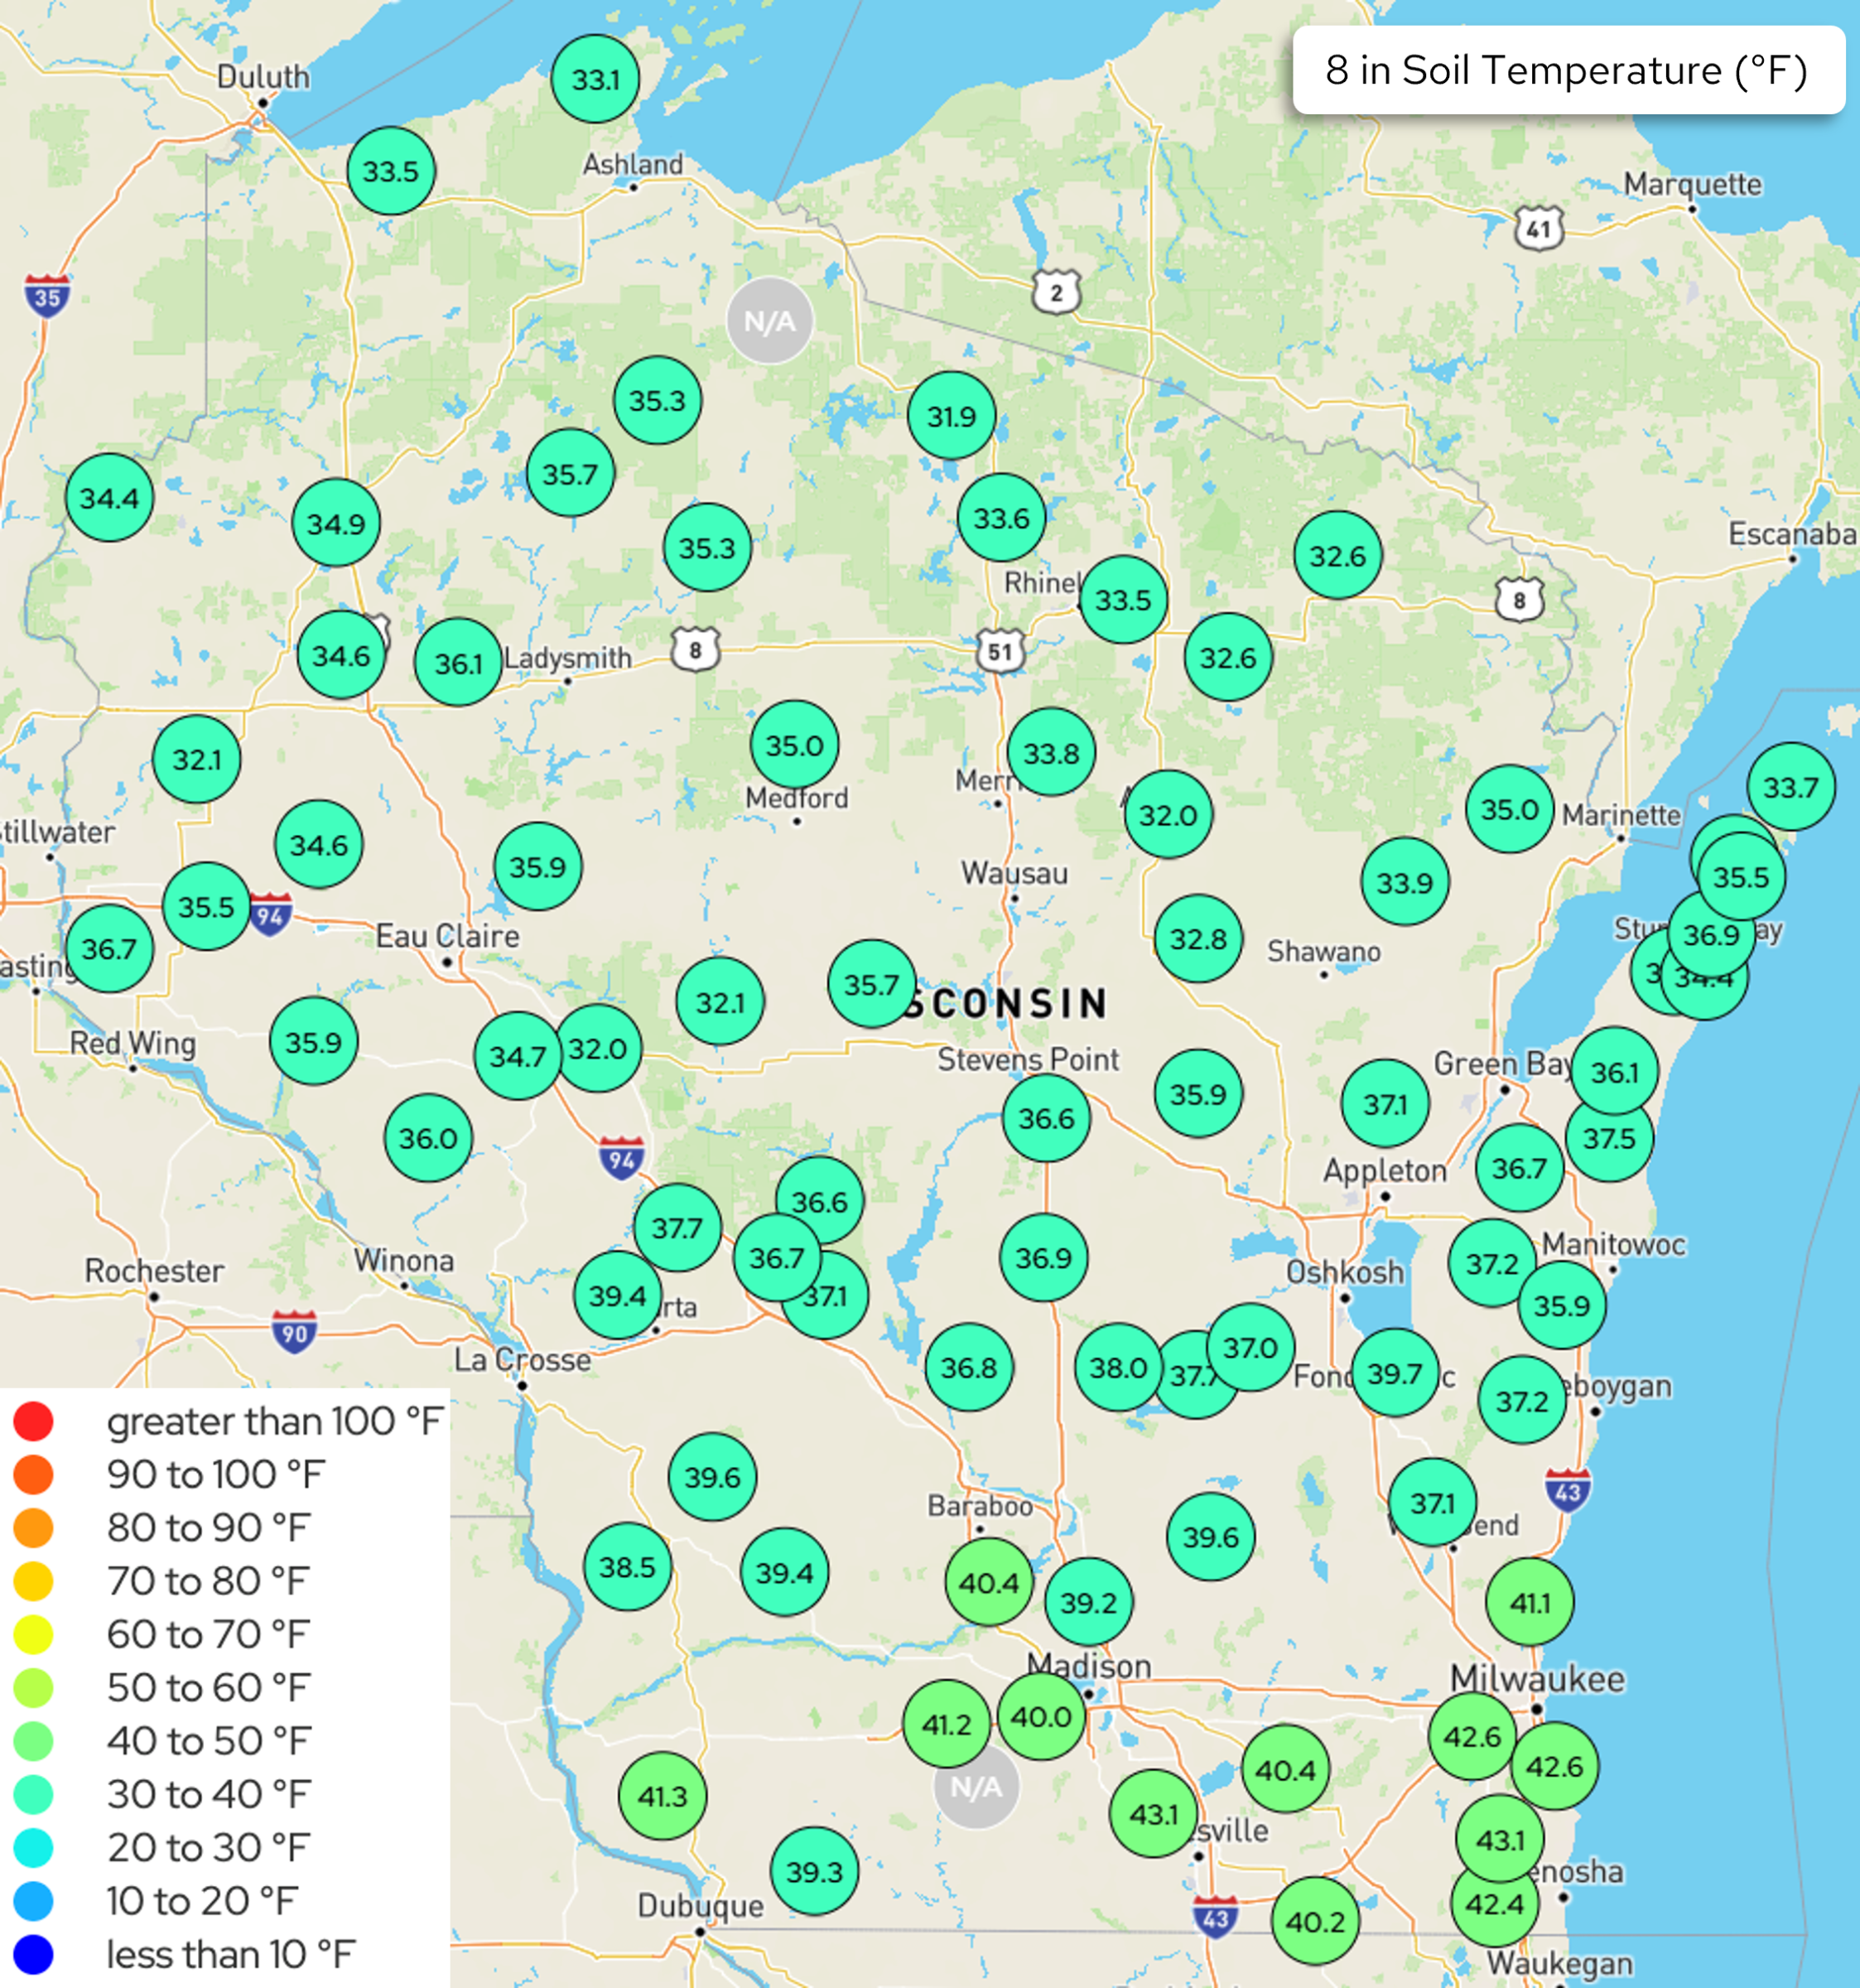
Image Description ↓
Wisconsin state map displaying 8-inch depth soil temperatures in °F from the WNet monitoring network. Temperatures increase from north to south. Northern Wisconsin stations (Ashland, Rhinelander area) show the coldest readings, ranging from 31.9–35.7°F. Central Wisconsin (Wausau, Stevens Point corridor) shows mid-range values of 32.0–37.7°F. Southern Wisconsin (Madison, Milwaukee, La Crosse area) shows the warmest readings, ranging from 39.2–43.1°F. A color-coded legend distinguishes temperature bands from below 10°F (dark blue) through 100°F+ (red); all visible stations fall within the 30–40°F (teal) and 40–50°F (light green) bands. Two stations are marked N/A (north-central region and south-central region).
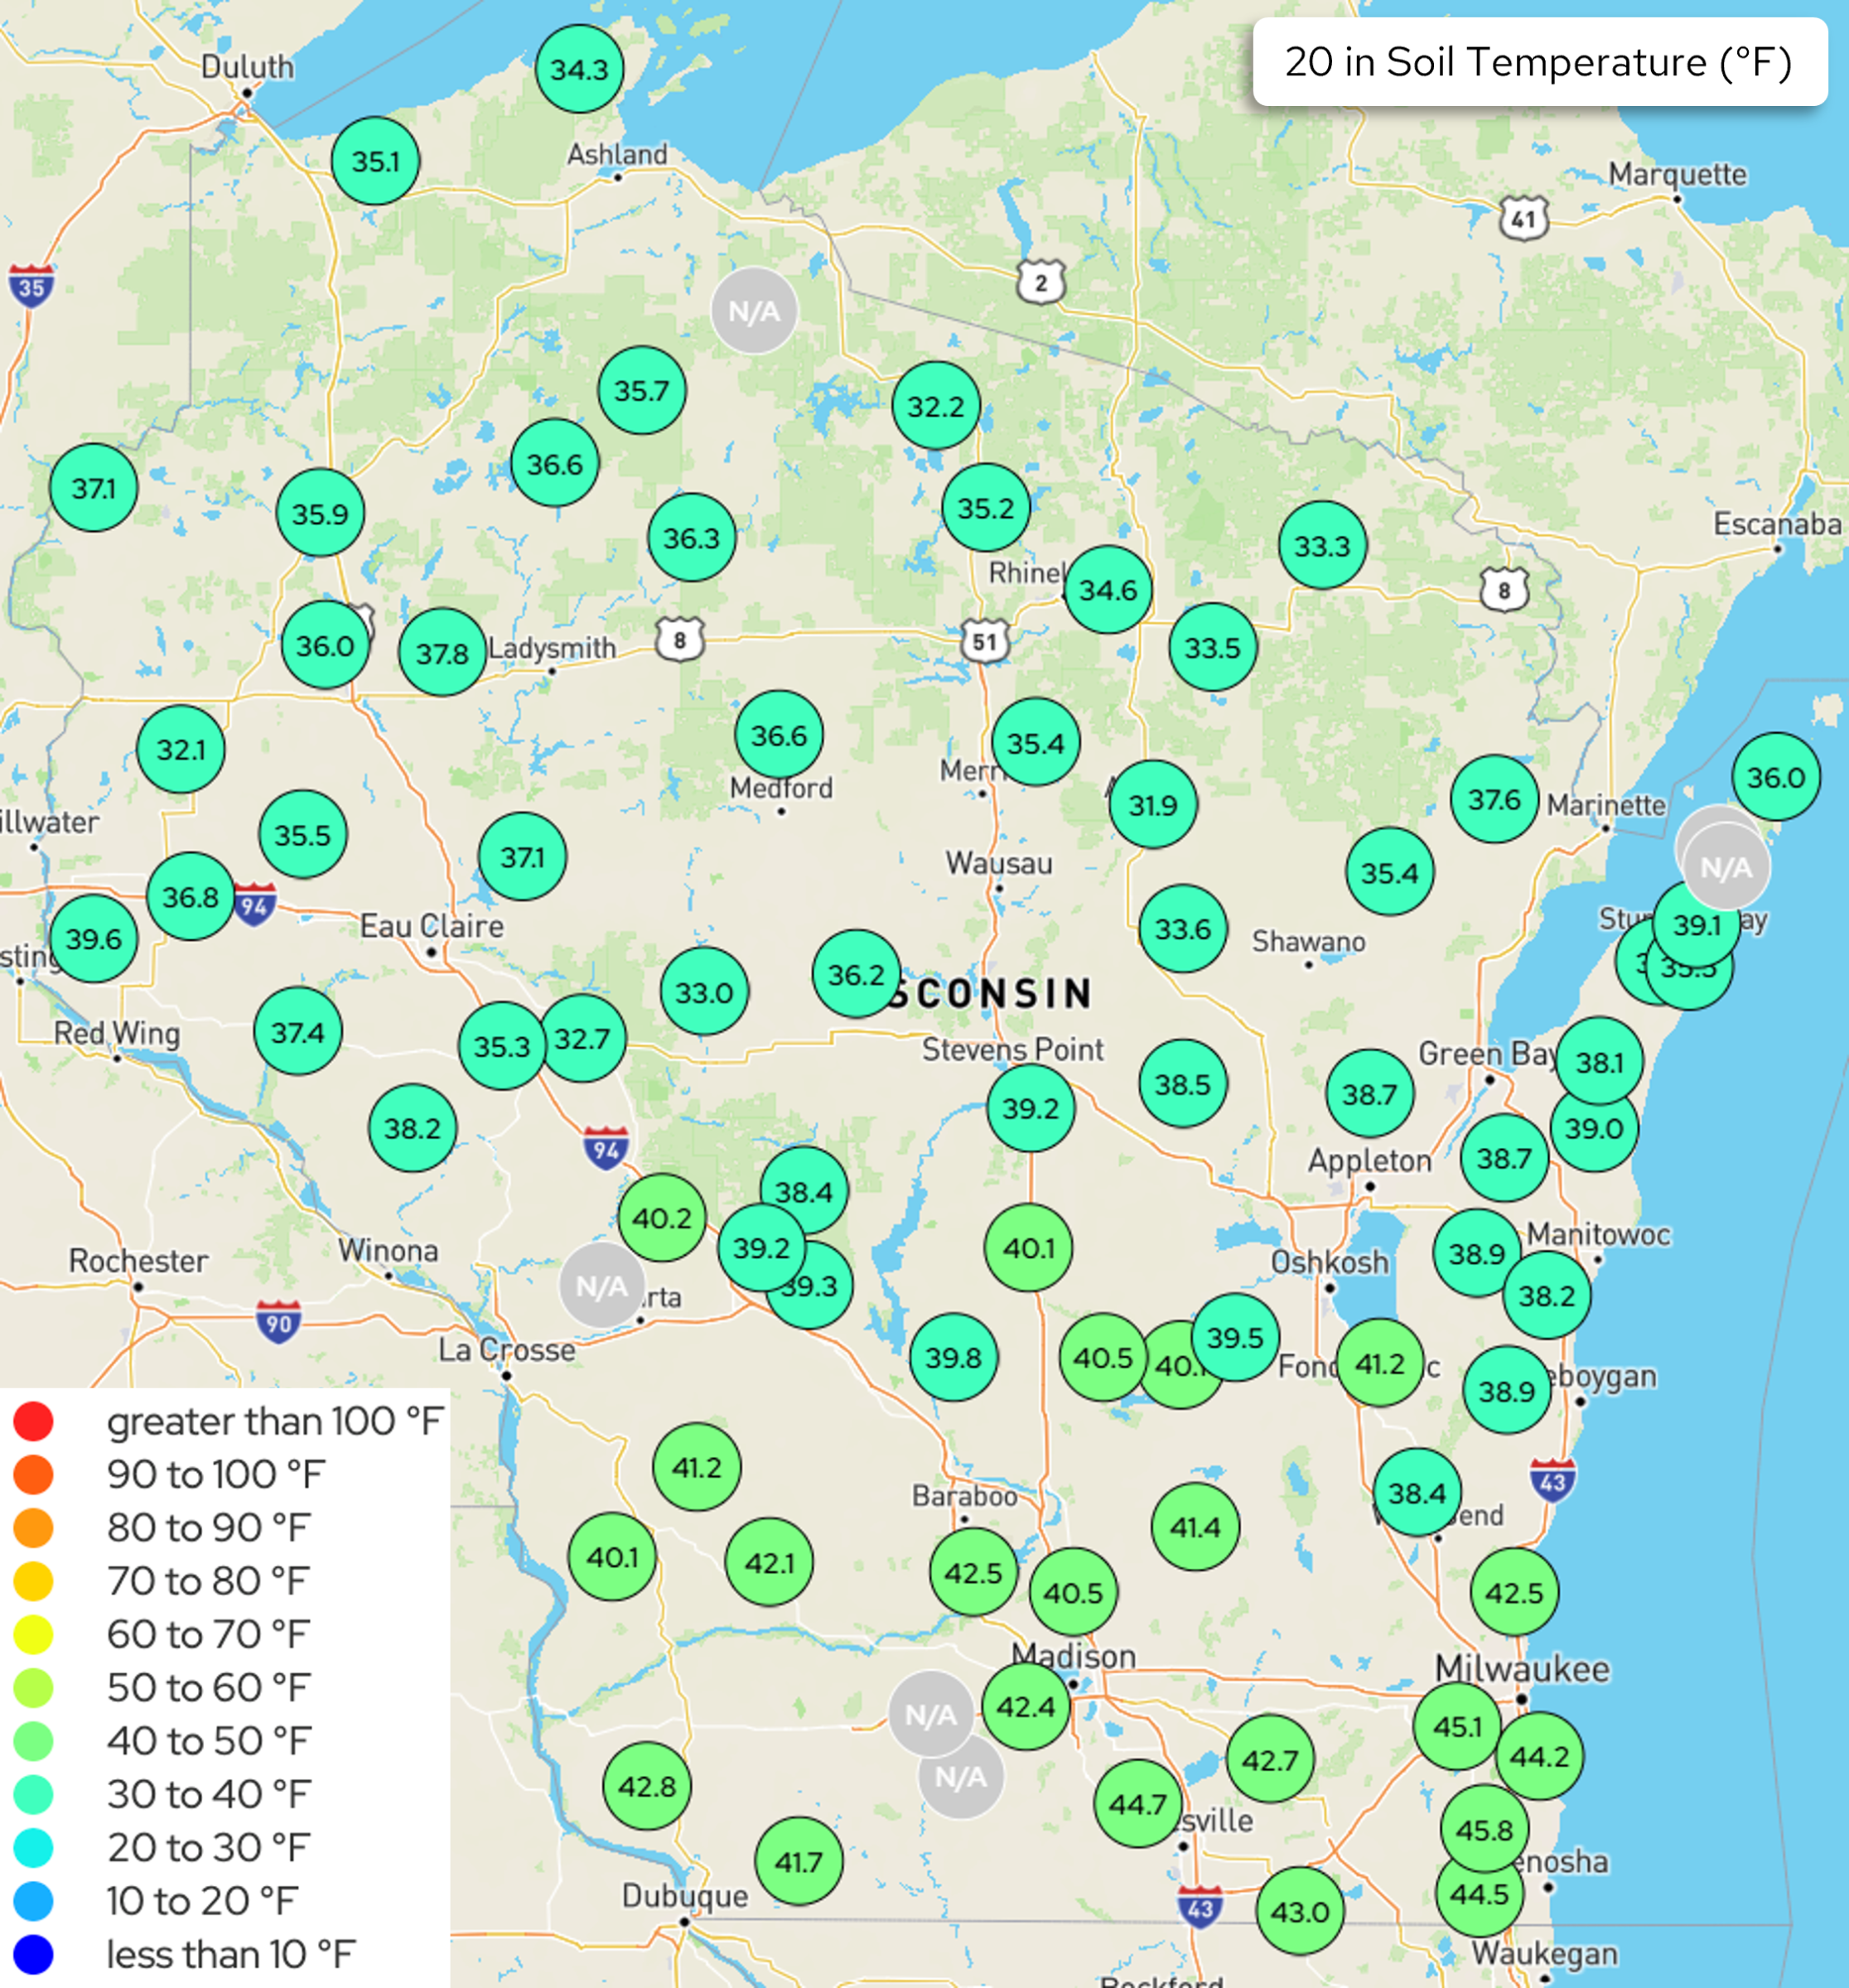
Image Description ↓
A color-coded map of Wisconsin showing 20-inch depth soil temperatures in degrees Fahrenheit. Each monitoring station is represented by a colored circle with a numeric temperature value. The legend indicates temperatures using a spectrum from dark blue (less than 10°F) through cyan, teal, green, yellow, orange, and red (greater than 100°F).
Current readings show two primary temperature bands across the state: (Several stations display “N/A,” indicating no data available.)
Northern Wisconsin (teal circles, 30–40°F range): Values cluster between 31.9°F near Merrill and 39.6°F near the Minnesota border, with readings such as 34.3 (Duluth area), 35.1 (Ashland area), and 36.6 (central north).
Southern Wisconsin (green circles, 40–50°F range): Values range from 40.1 near La Crosse to 45.8°F near Kenosha. Madison-area stations show approximately 42.4–42.5°F. Milwaukee-area stations reach 44.2–45.1°F.
The warmest readings are concentrated in the southeast corner; the coolest in the north-central region.
- The maps show Wisconet soil temperature conditions on April 7th @ 12:00 pm.
U.S. Drought Monitor
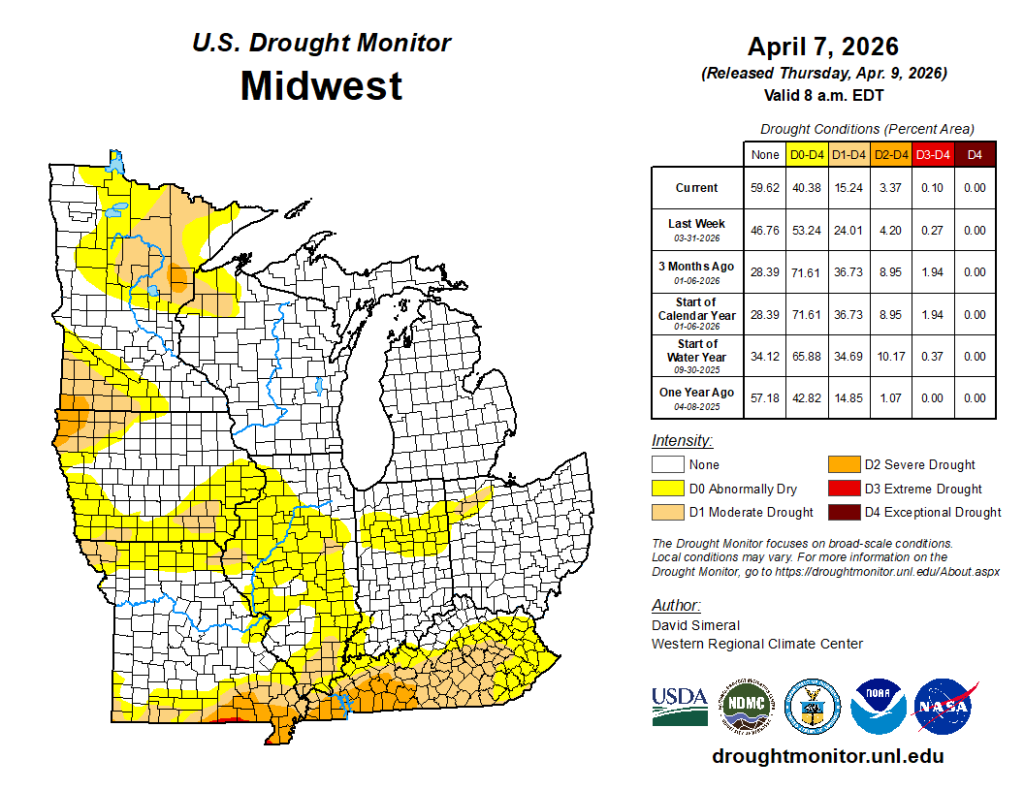
Image Description ↓
Color-coded county-level drought map of the 12-state Midwest region valid April 7, 2026. Approximately 40% of the region experiences some drought (D0–D4), down from 53% the prior week. Drought is most concentrated in northwestern Minnesota (D3 Extreme Drought, shown in red) and portions of Missouri, Arkansas border counties, and western Kansas/Nebraska (D1–D2 Moderate to Severe Drought, shown in tan and orange). The majority of Wisconsin, Michigan, Illinois, Indiana, and Ohio show no drought conditions. A data table shows current drought coverage: None 59.62%, D0–D4 40.38%, D1–D4 15.24%, D2–D4 3.37%, D3–D4 0.10%, D4 0.00%. Comparisons to last week, 3 months ago, start of calendar year, start of water year, and one year ago are also included. Map authored by David Simeral, Western Regional Climate Center. Source: droughtmonitor.unl.edu.
- Compared to last month:
- Midwest: Widespread improvements in drought severity, particularly in Illinois, Indiana, and Ohio. Drought is most prevalent in Minnesota/Iowa, southern Missouri, and Kentucky.
- 84.8% of the Midwest region is drought free (~15.2% in D1-D4).
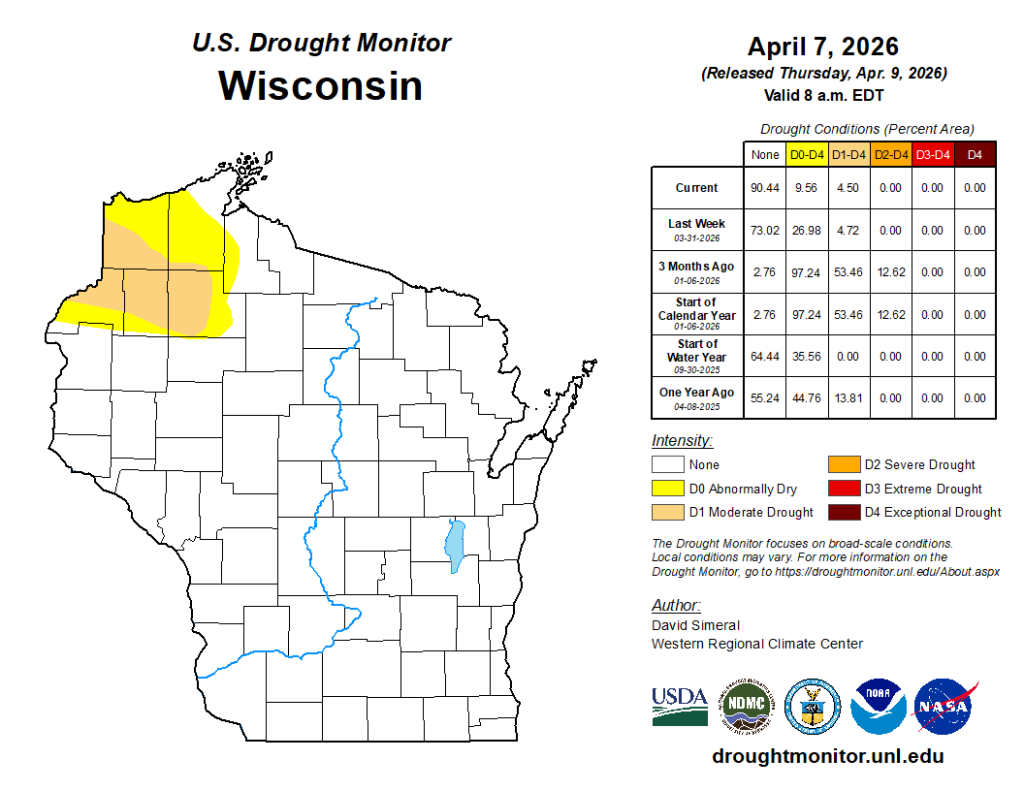
Image Description ↓
U.S. Drought Monitor map of Wisconsin dated April 7, 2026 (released April 9, 2026). The northwestern corner of the state shows two drought classifications: D0 Abnormally Dry (yellow) and D1 Moderate Drought (tan/light orange), affecting approximately 9.56% of the state in some form of dryness. The remainder of the state (90.44%) has no drought designation.
A data table shows drought conditions as percent of area across six time points:
- Current: 90.44% None, 9.56% D0–D4, 4.50% D1–D4
- Last Week (03-31-2026): 73.02% None, 26.98% D0–D4
- 3 Months Ago / Start of Calendar Year (01-06-2026): 2.76% None, 97.24% D0–D4, 53.46% D1–D4, 12.62% D2–D4
- Start of Water Year (09-30-2025): 64.44% None, 35.56% D0–D4
- One Year Ago (04-08-2025): 55.24% None, 44.76% D0–D4, 13.81% D1–D4
No D2, D3, or D4 drought exists currently. Author: David Simeral, Western Regional Climate Center.
Wisconsin: 1-2 class improvement across southern, eastern, and northern counties. Drought remains in some far northwest counties.
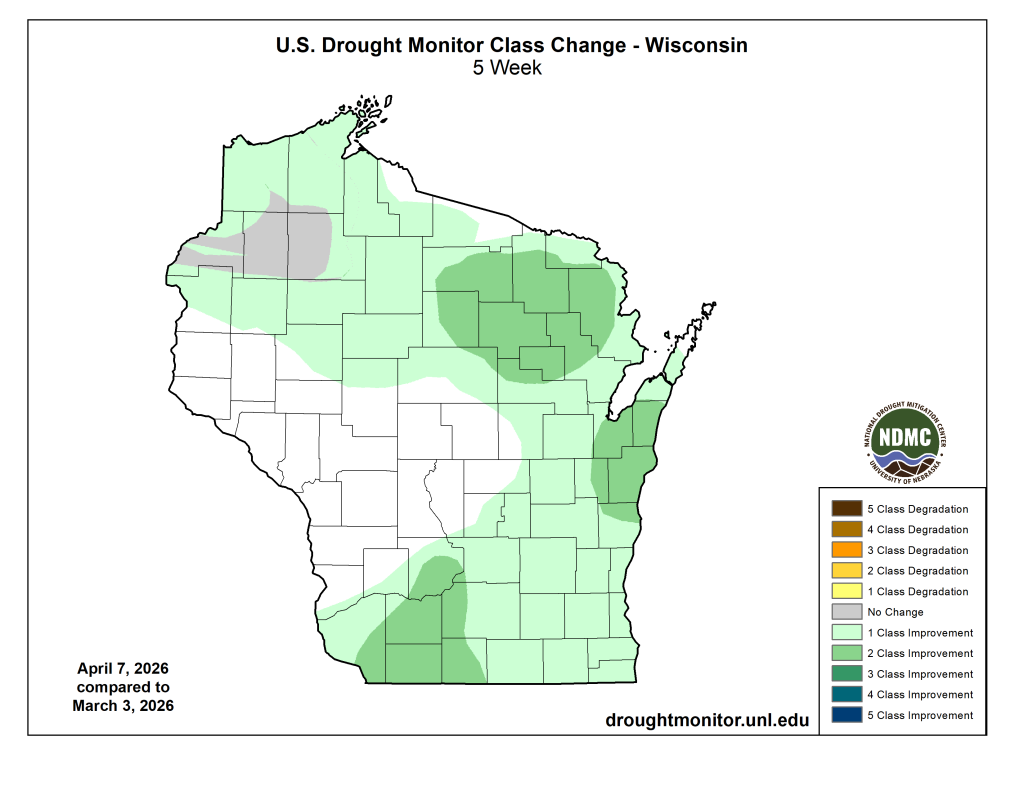
Image Description ↓
U.S. Drought Monitor Class Change map for Wisconsin comparing April 7, 2026 to March 3, 2026. The majority of the state shows drought improvement. Northern and central Wisconsin display widespread 1–2 Class Improvement (light to medium green). A large region in north-central Wisconsin shows 2–3 Class Improvement (medium to dark green), concentrated around the Northwoods and central lake district. The eastern lakeshore counties (Green Bay area south) show 3 Class Improvement (teal green). Southwestern Wisconsin has a notable pocket of 2–3 Class Improvement. A small area in northwestern Wisconsin (Barron/Rusk county area) shows No Change (gray). Southern and western counties are mostly white, indicating no meaningful change in either direction. No degradation of any class is visible anywhere in the state.
- Drought changes in Wisconsin:
- D1-D4: 22.1% decrease in drought area
- D2-D4: 1.4% decrease in drought area
- D3-D4: 0%
- D4: 0%
U.S. Drought Monitor Time Series
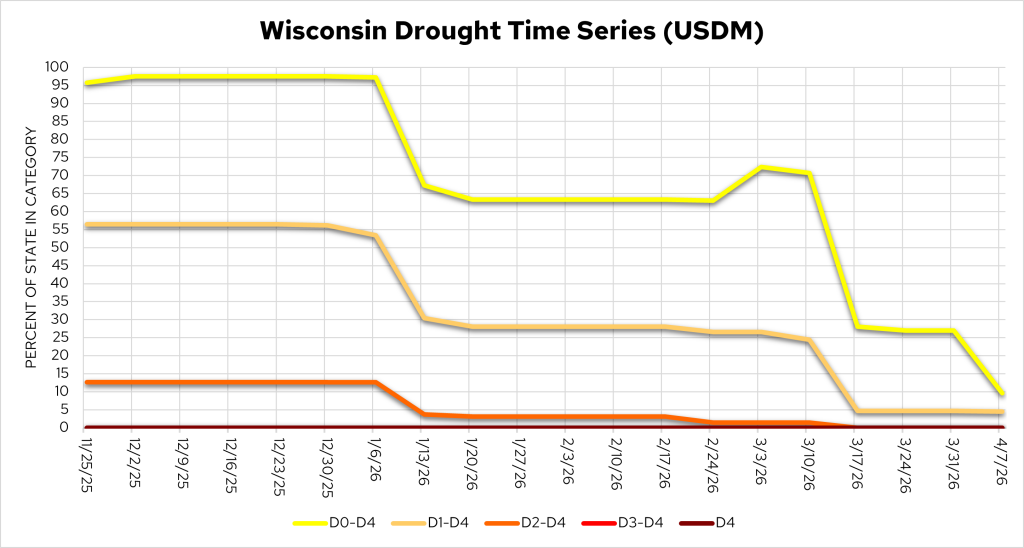
Image Description ↓
Line chart titled “Wisconsin Drought Time Series (USDM)” tracking five drought severity categories (D0–D4 through D4 only) from 11/25/25 to 4/7/26, measured as percent of state in each category. In late November 2025, D0-D4 (yellow) covered ~95% of the state, D1-D4 (tan) ~55%, and D2-D4 (orange) ~12%, with D3-D4 (red) and D4 (dark red) near 0% throughout. All categories declined sharply in early January 2026. By April 7, 2026, D0-D4 fell to ~10%, D1-D4 to ~4%, and D2-D4 to ~4%, indicating significant drought improvement across Wisconsin.
- Large reduction in D0 coverage from early March, with a 22% decrease in D1 and D2 coverage.
Temperature Trends
30 Day Temperatures
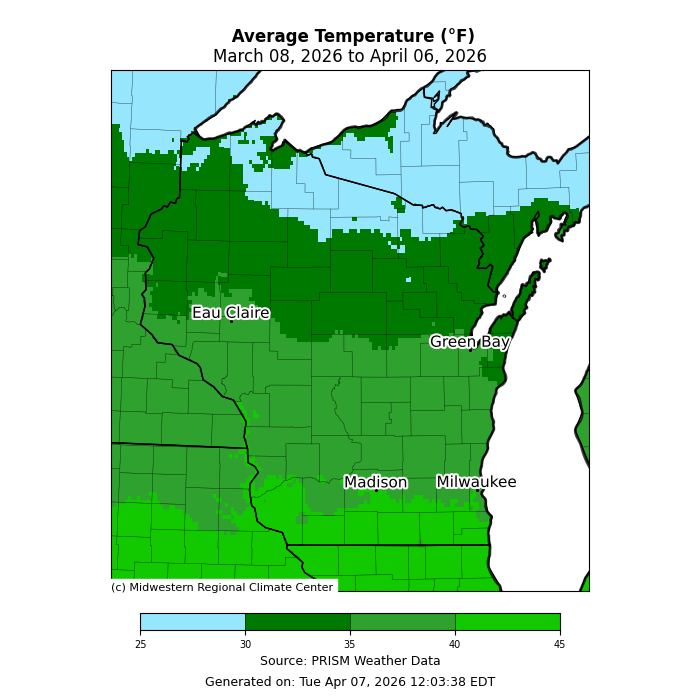
Image Description ↓
PRISM climate map showing 30-day average temperatures across Wisconsin and neighboring states (March 8–April 6, 2026). Southern Wisconsin, including Madison and Milwaukee, shows warmer averages in the 40–45°F range (bright green). Central and northern Wisconsin, including Eau Claire and Green Bay, show cooler averages of 30–40°F (dark green). The Upper Peninsula of Michigan and far northern areas show the coldest averages, 25–30°F (light blue). A color scale runs along the bottom from 25°F (light blue) to 45°F (bright green). Source credited to PRISM Weather Data; generated April 7, 2026.
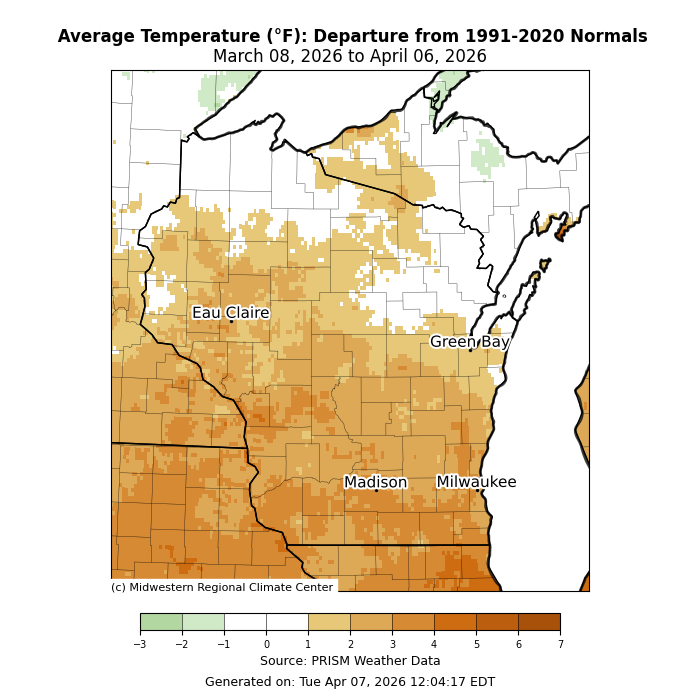
Image Description ↓
Choropleth map from the Midwestern Regional Climate Center showing average temperature departure from 1991–2020 normals across Wisconsin and neighboring states for March 8–April 6, 2026. Nearly all of Wisconsin is shaded in warm orange tones indicating departures of +2°F to +6°F above normal. Southern Wisconsin, including Madison and Milwaukee, shows the warmest anomalies (+5–7°F). Northern Wisconsin and the Upper Peninsula show slightly lower but still positive departures (+2–4°F). Small patches of green (below normal, –1 to 0°F) appear in far northern Minnesota and Michigan’s Upper Peninsula. Data source: PRISM Weather Data.
- Average temperatures ranged from 40-45°F in the southern counties; to 25-30°F in the northern counties.
- Temperatures were 2-4°F above normal across southern and central Wisconsin. Further to the north, temperatures were closer to average.
- Since March 8th, southern and western counties have had multiple days that have topped 70°F.
Chilling Hour Accumulation for Wisconsin Fruit
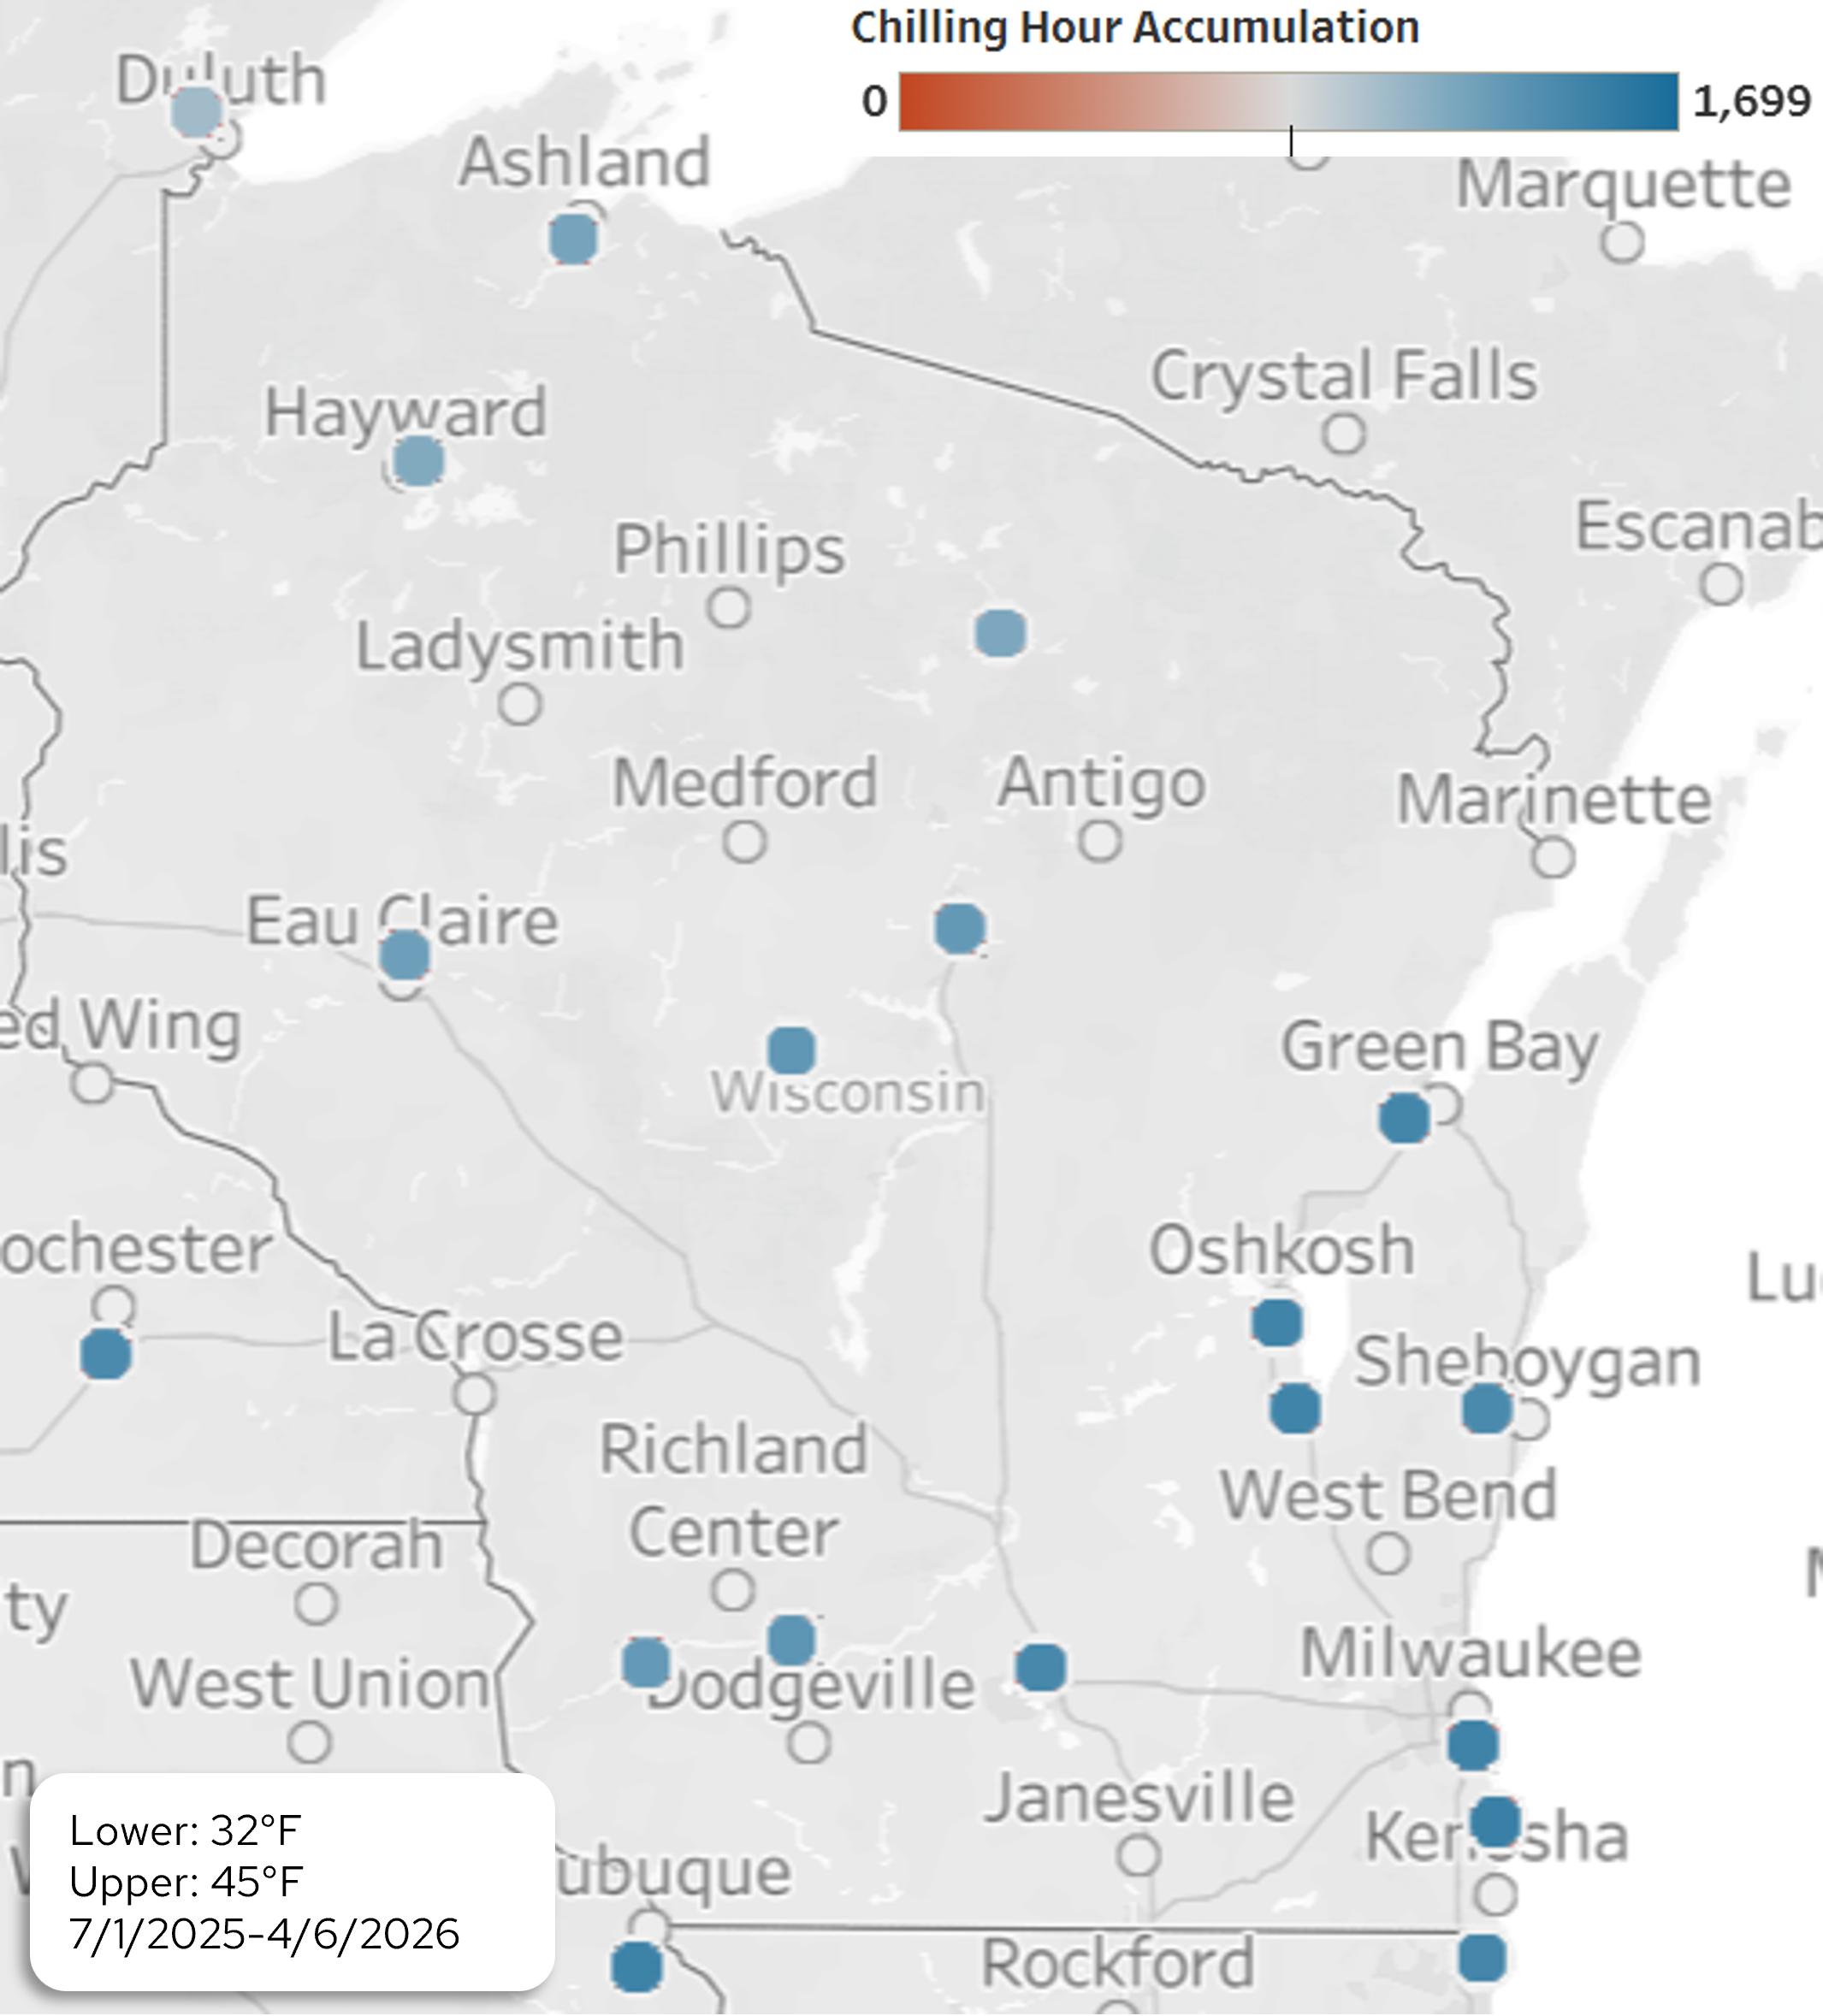
Image Description ↓
A color-coded map of Wisconsin and surrounding border areas showing chilling hour accumulation at weather station locations between July 1, 2025 and April 6, 2026. The temperature range used is 32°F (lower) to 45°F (upper). A legend shows a gradient from red (0 hours) to dark teal-blue (1,699 hours). Approximately 15–20 station markers are plotted across the state; northern and eastern stations (near Ashland, Hayward, Phillips, Green Bay, Oshkosh, and Sheboygan) appear in darker blue, indicating higher chilling hour accumulation. Southern and western stations appear in lighter blue or mid-range tones. No exact numeric values per station are labeled on the map.
- Chilling hours for Wisconsin’s perennial fruits range from 1182 to 1515 accumulated hours.
- To view fruit-specific chilling hour requirements, please visit the MRCC Chilling Hours Tool.
Forecasts and Outlooks
7 Day Precipitation Forecast
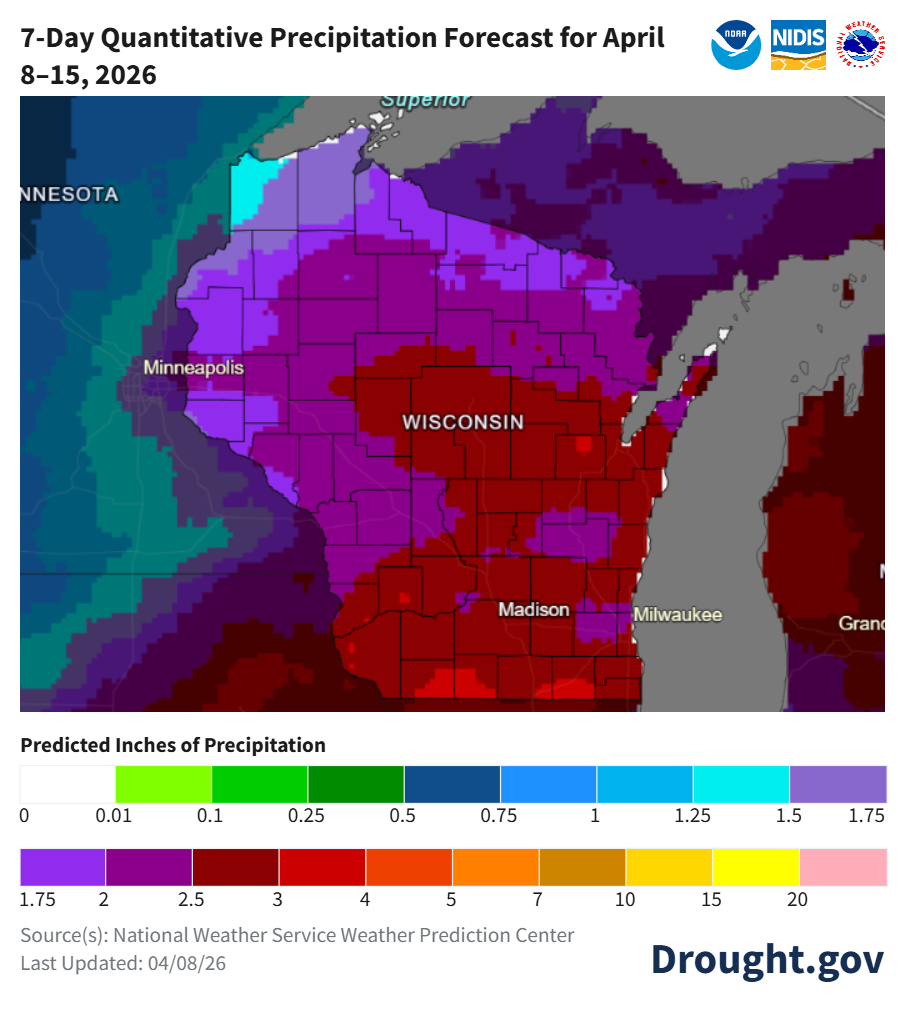
Image Description ↓
NOAA/NWS 7-Day Quantitative Precipitation Forecast for April 8–15, 2026, covering Wisconsin and surrounding states. Madison is forecast to receive 3–5 inches of precipitation, shown in deep red. Much of central and southern Wisconsin falls in the 2.5–5 inch range. Northern Wisconsin shows 1.75–2.5 inches (purple). The Lake Superior shoreline near Superior shows 1–1.5 inches (cyan/teal). Minnesota to the west shows lighter totals of 0.5–1.75 inches. Michigan’s Upper Peninsula appears in dark maroon, indicating 2.5–3+ inches. Source: National Weather Service Weather Prediction Center. Last updated 04/08/26.
- When? – an unseasonably wet few days are on tap with multiple chances for rain statewide.
- Where? – best chances for rain are in the southern and central counties.
- Check your local forecast for details on totals and timing.
- Average precip (1991-2020) for this week: 0.73”
8-14 Day Temperature and Precipitation Outlook
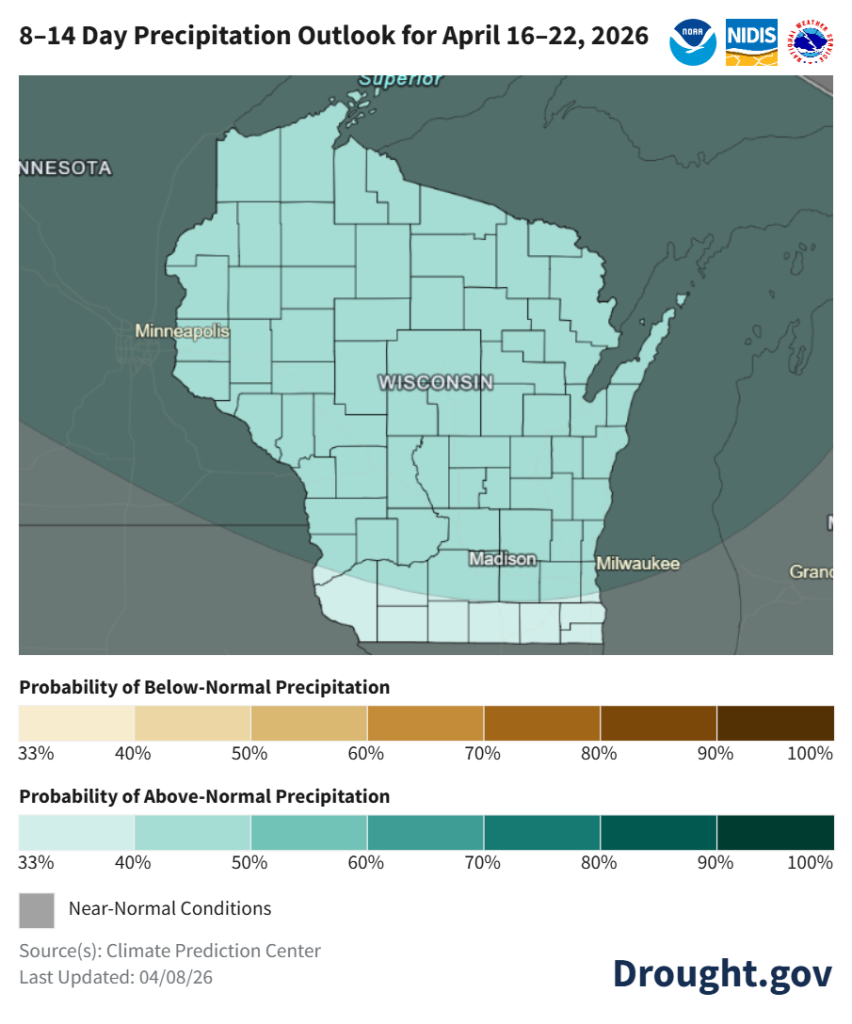
Image Description ↓
A color-coded map from NOAA’s Climate Prediction Center (via Drought.gov, updated 04/08/26) showing Wisconsin’s 8–14 day precipitation outlook for April 16–22, 2026. Nearly all of Wisconsin is shaded in light teal, indicating a 33–40% probability of above-normal precipitation. A small area in the far southwest corner of the state transitions to light gray/white, indicating near-normal conditions. No areas show below-normal precipitation probability. The color scale ranges from 33% to 100% for both above-normal (teal) and below-normal (tan/brown) categories.
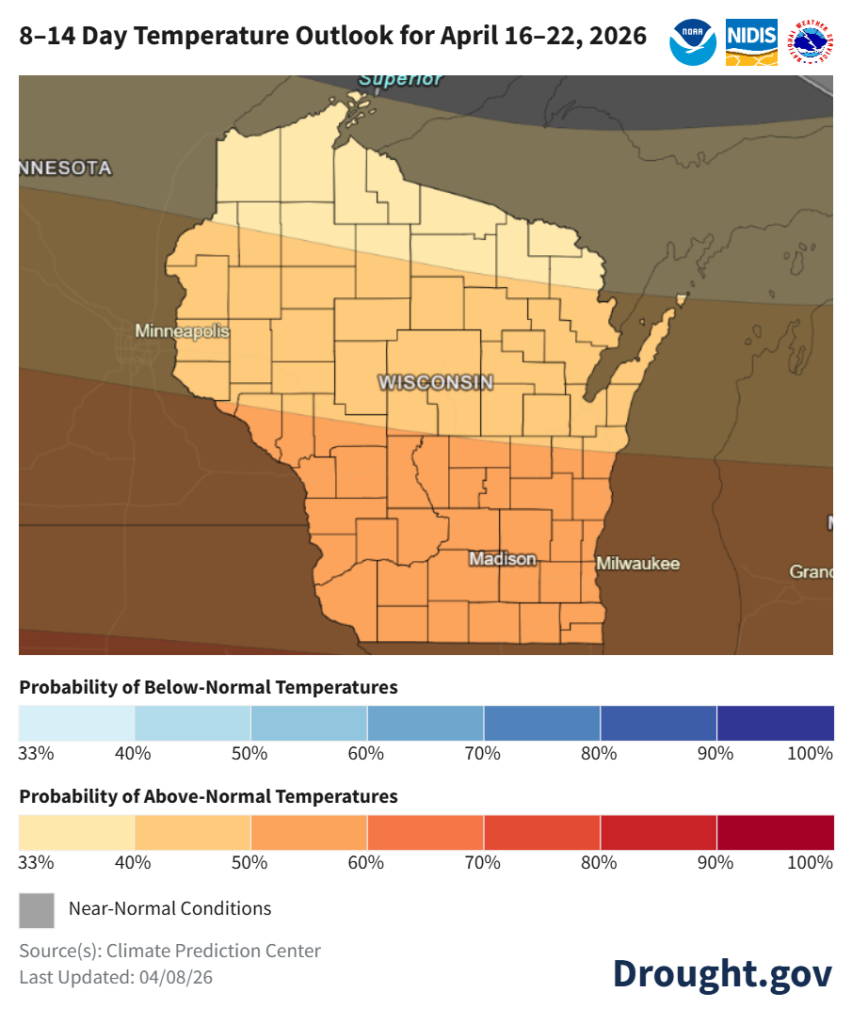
Image Description ↓
NOAA Climate Prediction Center map showing above-normal temperature probabilities across Wisconsin for April 16–22, 2026. Northern Wisconsin shows 40–50% probability of above-normal temperatures (light orange). Central Wisconsin shows 50–60% probability (medium orange). Southern Wisconsin, including Madison and Milwaukee, shows 60–70% probability (deeper orange). Surrounding states show near-normal conditions (gray) to the northwest and higher above-normal probabilities (dark brown, 80–100%) to the south and east. Source: Drought.gov, last updated 04/08/26.
- Mid-to-Late April: Statewide leans for above normal temperatures (50-60% odds south; 33-50% odds north) and above normal precipitation (40-50% odds for most).
- Statewide normals (1991-2020) for April 16-22 are 44.5°F and 0.78”.
30 Day Temperature and Precipitation Outlook
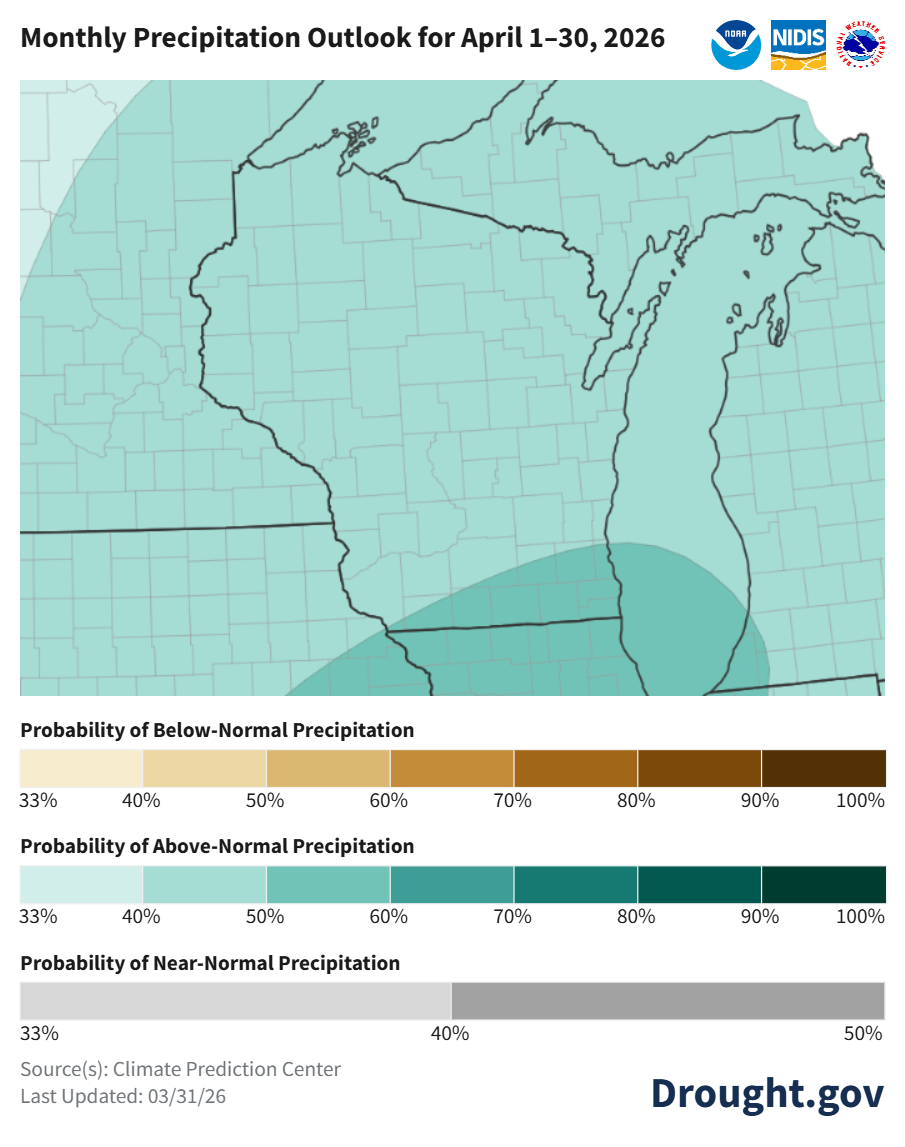
Image Description ↓
A Climate Prediction Center map cropped to the Great Lakes and upper Midwest region. The majority of the visible area — including Wisconsin, Michigan, Minnesota, and surrounding states — is shaded in light teal, indicating a 33–40% probability of above-normal precipitation for April 2026. A darker teal circular region overlaps parts of Illinois, Indiana, Ohio, and lower Michigan, indicating a higher probability (approximately 50–60%) of above-normal precipitation in that zone. No areas in the visible map show below-normal or near-normal probability shading. Three color scale legends appear below the map: brown tones for below-normal (33–100%), teal tones for above-normal (33–100%), and gray for near-normal (33–50%). Source is the Climate Prediction Center, last updated 03/31/26. Drought.gov logo appears in the lower right.
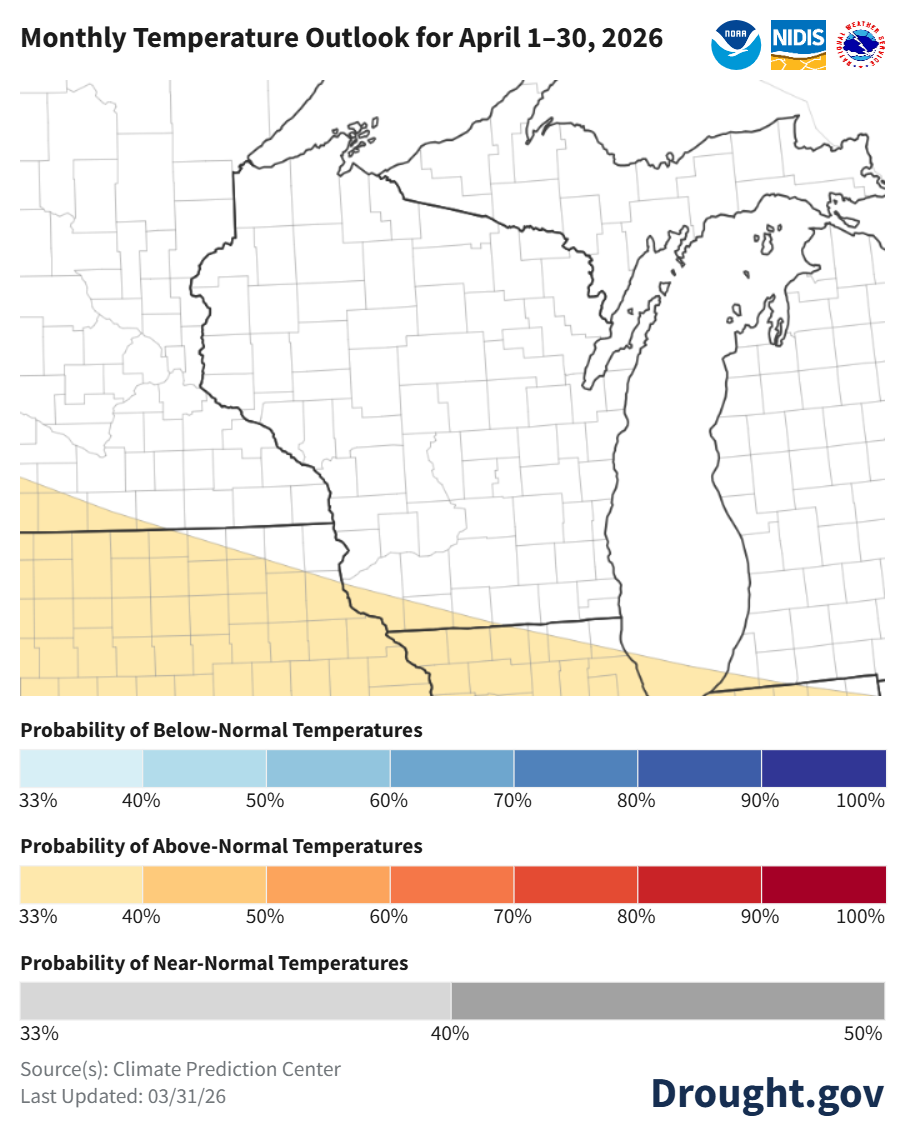
Image Description ↓
NOAA/NIDIS Climate Prediction Center map covering the Great Lakes region for April 1–30, 2026. The southern portion of the mapped area — including the southern tier of Wisconsin and neighboring states — is shaded in light tan/yellow, indicating a 33–40% probability of above-normal temperatures. The northern portion of the region, including northern Wisconsin, the Upper Peninsula of Michigan, and Michigan’s Lower Peninsula, is unshaded (white), indicating equal chances of below-, near-, or above-normal temperatures. A diagonal boundary line separates the two zones, running roughly southwest to northeast across central Wisconsin. The color scales shown below the map indicate: blue shades for below-normal probability (33–100%), orange-red shades for above-normal probability (33–100%), and gray shades for near-normal probability (33–50%). Source: Climate Prediction Center. Last updated 03/31/26.
- April: Temperatures are uncertain with equal chances for above, near, or below normal conditions. Precipitation is leaning above normal statewide (40-50% chances), with a stronger lean in the south.
- Statewide normals (1991-2020) for April 1-31 are 43.1°F and 3.20”.
90 Day Temperature and Precipitation Outlook
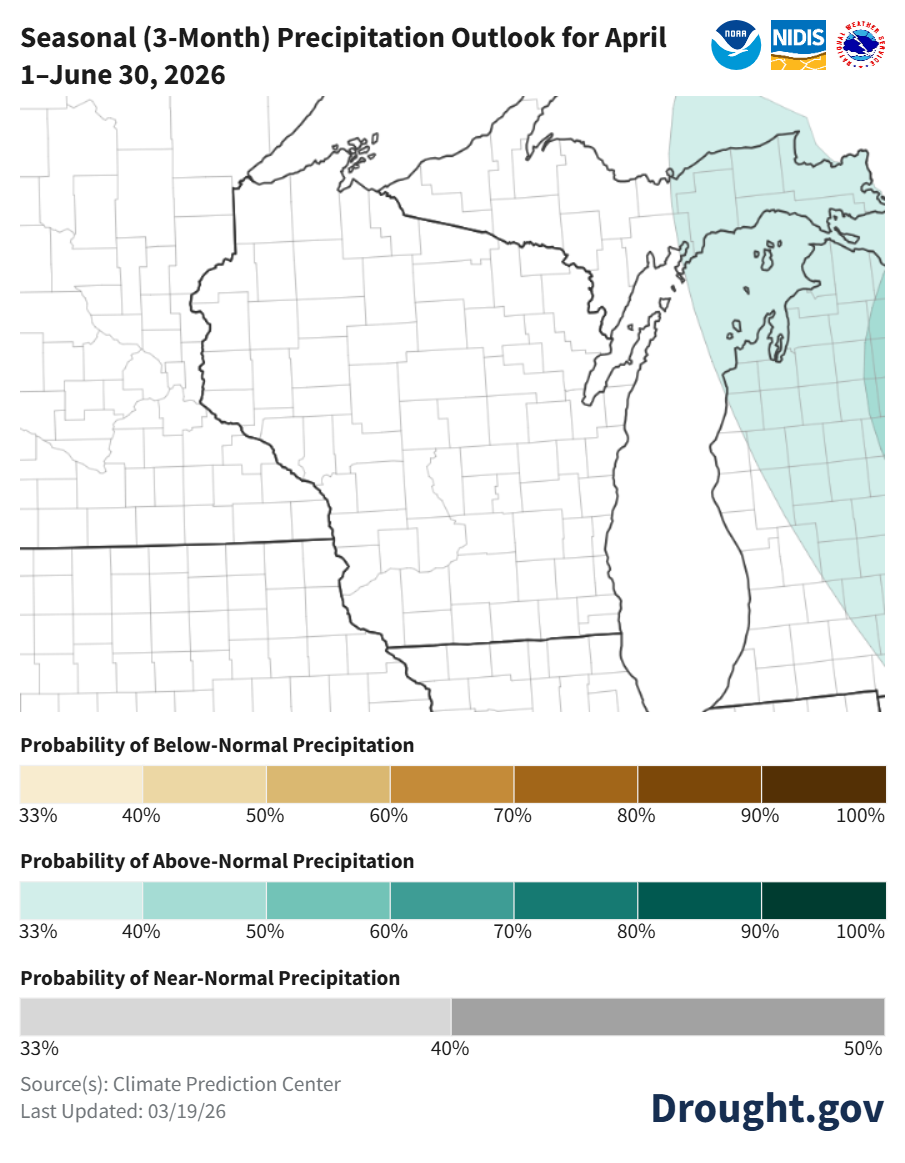
Image Description ↓
NOAA/NIDIS Climate Prediction Center map showing the 3-month precipitation outlook for April 1–June 30, 2026, covering the Great Lakes region (Wisconsin, Michigan, Illinois, Indiana, and surrounding states). The majority of the mapped area is unshaded (white), indicating equal chances of below-, near-, or above-normal precipitation. A light teal/cyan shaded area appears along the eastern edge of the map — covering eastern Michigan, including the Lower Peninsula’s eastern shore- indicating a 33–40% probability of above-normal precipitation. No areas show below-normal shading. The legend shows brown tones for below-normal (33–100%) and teal tones for above-normal (33–100%), and gray tones for near-normal (33–50%). Source: Climate Prediction Center, last updated 03/19/26.
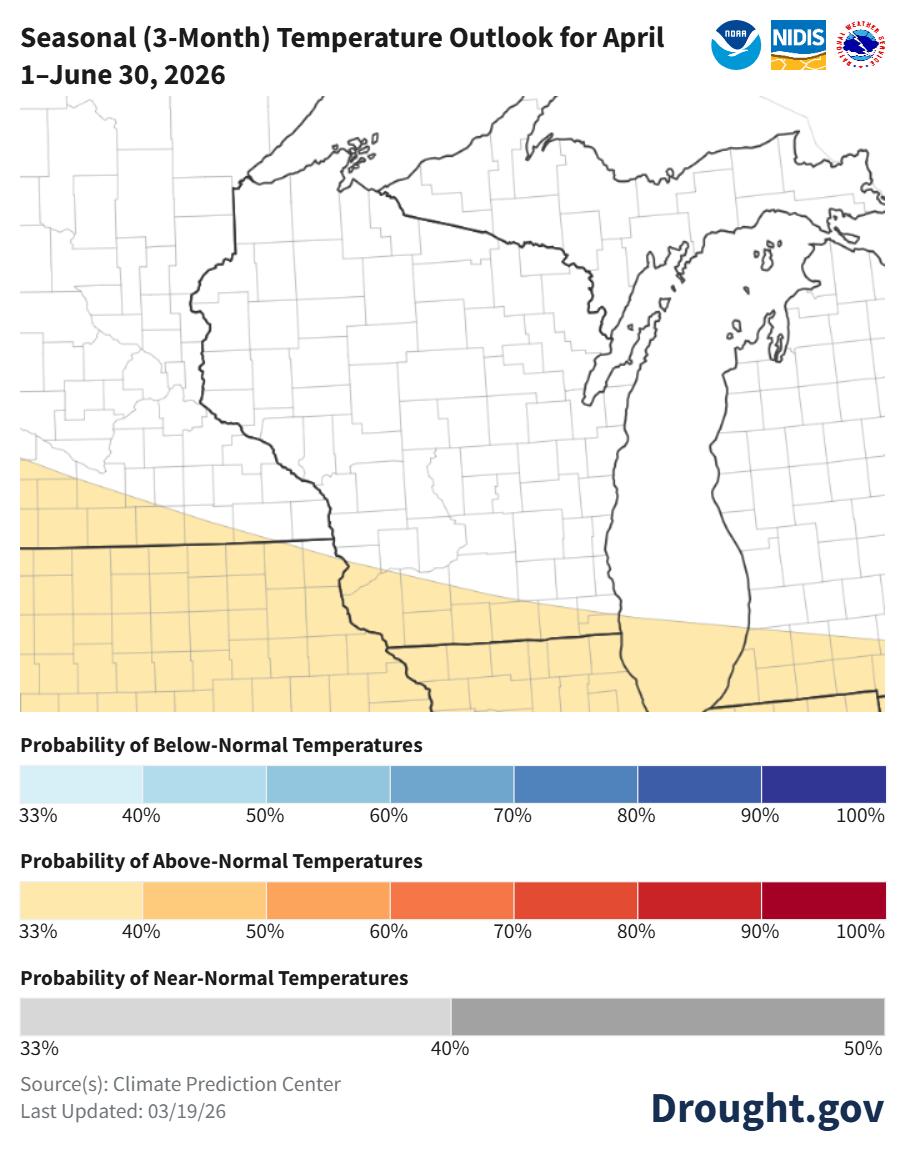
Image Description ↓
NOAA/NIDIS Climate Prediction Center map showing the 3-month seasonal temperature outlook for April 1–June 30, 2026, covering the Upper Midwest and Great Lakes region. A light tan/yellow shading covers the southern portion of the map — including southern Wisconsin, Illinois, Iowa, and Indiana — indicating a 33–40% probability of above-normal temperatures. The northern portion of the map, including northern Wisconsin, Michigan’s Upper Peninsula, and Minnesota, is unshaded (white), indicating equal chances of below-, near-, or above-normal temperatures. A bold diagonal boundary line separates the two zones, running roughly southwest to northeast. Three color scale legends appear below the map: blue shades for below-normal probability (33–100%), orange-to-red shades for above-normal probability (33–100%), and gray shades for near-normal probability (33–50%). Source is listed as the Climate Prediction Center, last updated 03/19/26.
- April-June: Temperatures are uncertain except for the far south (above normal lean). Precipitation is also uncertain with equal chances.
- Statewide normals (1991-2020) for April-June are 54.7°F and 11.83”.
If you would like to obtain a PDF or PowerPoint copy of this report, please email anastasia.kurth@wisc.edu.
User Survey
Are you a regular user of the Ag Weather Outlook for Wisconsin (AgWOW)? Or maybe you are viewing these slides for the first time this week? Either way, we want to hear your feedback on this resource! Please take a few minutes and fill out this survey. Your feedback will help us better serve your ag-weather data needs through AgWOW.
If you have any trouble accessing or filling out the survey, please email Josh Bendorf at jbendorf@wisc.edu. Thank you!