
Weather and climate conditions this week in Wisconsin
Here are this week’s take-home points about the weather. As a reminder, AgWOW reports will be published weekly throughout the growing season. Scroll down for the full report.
Additionally, we’re collecting user feedback. Regardless of whether it’s your first time here or if you are a regular user, we’d love to hear from you!
Key Points
One Month Conditions
- Temperatures were 2-4°F above normal across southern counties, with near normal conditions elsewhere. Wisconet stations recorded daily high temperatures at or above 80°F at several locations.
- Precipitation was well above normal across eastern, central, and northeast counties. Totals in northeast and north-central counties were totals at or above 200% of normal.
Impact
- Soil moisture levels at 4” depth at UW research farm stations (Wisconet) are near to or slightly above last week’s levels. Satellite-based soil moisture models indicate that counties in the northeast region saw substantial gains in soil moisture percentile.
- Corn planting is underway in a small percentage of Wisconsin fields. Soybean planting has not been reported yet.
- There was no change in drought coverage or severity from last week. Drought remains in some far northwest counties.
Outlook
- Precipitation chances over the next 7 days are highest on Friday into Saturday (4/17-4/18) with higher totals in the central and north-central counties.
- Climate probabilities for late April indicate near normal temperatures and precipitation for most of Wisconsin. Southern and far western counties are leaning toward above normal precipitation (33-40% odds).
- Outlooks for the month of May and for late spring into summer (May-July) indicate uncertainty about temperatures and precipitation with equal chances for above, near, or below normal conditions.
Agronomic and Vegetable Considerations
Field Conditions
- Avoid trafficking fields in wet conditions to prevent compaction and rutting, especially with recent heavy precipitation.
- Check alfalfa for any signs of winterkill.
- Keep livestock out of critical and sensitive areas with soft, muddy ground, see this article on the value of keeping cattle clean.
- 2-4″ soil temperatures are warming with increased temperatures, especially in the southern half of the state. Soil temperatures should be consistently at 50 degrees F to reduce the risk of imbibitional chilling and soil-borne pathogens. Nightly low temperatures are still cool in the days ahead.
Manure Applications
- Reminder of Wisconsin’s NR 151 Runoff Rules with the timing of manure spreading and current runoff levels. Check DATCP Runoff Risk Advisory Forecast.
Small Grains
- Assess winter grain stands. Check winter wheat for any signs of winterkill.
- Avoid fertilizer applications in wet and cool conditions. Nitrogen loss is greater in wet conditions. Review small grain fertility.
Fruit Considerations
- Wisconsin fruit growers can reference the Midwest Fruit Pest Management Guide, which is available for viewing online: 2026-27 MWFPMG (Purdue University Extension).
- Reference the NEWA weather station network for past and forecasted disease infection events. Check out your nearest weather station: NEWA Weather Station Network (Cornell).
- Rain in the past week has driven disease infection events for several fruit crops. Reminder: Many protectants will wash off after 1 inch of rain.
- Tree fruit growers with historic populations of European red mite or rosy apple aphid should begin scouting and may consider using oil between half-inch green and pink.
- Apple growers may consider using Promalin (gibberellin, cytokinin) as a frost rescue between pink and 10mm fruit and should be applied as soon as possible after a frost event.
Vegetable Considerations
- Avoid tillage when fields are wet as this can worsen compaction and lead to large soil clods.
- Monitor lettuce for symptoms of bottom rot. Rhizcotonia solani which also causes damping off in seedlings, can also infect older plants. Symptoms start on the oldest leaves as rusty brown patches. When favorable conditions are present- warm and wet- the rot can spread to midribs and leaf blades. Management options include choosing varieties that grow more upright to reduce soil contact, planting into raised beds to help with moisture management, and weed management to reduce the number of alternative hosts. Chemical options can be found in the Commercial Vegetable Production Guide.
- Risk from the first generation of adult seed corn maggots is now very high in southern WI and will start increasing in central WI in the next week as GDDs approach 300 in some areas. Peak activity is expected at 360 GDD. Use the Vegetable Disease and Insect Forecasting Network to view GDDs for your area. This first generation overwinters in WI. When flies emerge, they are attracted to fields with high organic matter. If possible, terminate and incorporate cover crops 2-3 weeks before planting your cash crop to reduce the attractiveness of these fields as egg laying sites.
- Starting with healthy transplants is an important part of your IPM plan. Many tomato and pepper viruses are transmitted by aphids and thrips which love the warm environment of your greenhouse. Be sure to scout transplants regularly to look for these pests. Their populations can grow quickly and be difficult to control with chemical or biological methods. Therefore, it is important to limit potential sources of these viruses by not starting ornamentals in the same greenhouse as your vegetables. More information on control methods can be found here.
Dive deeper into each report section by clicking a topic below.
Precipitation Trends
7 Day Precipitation
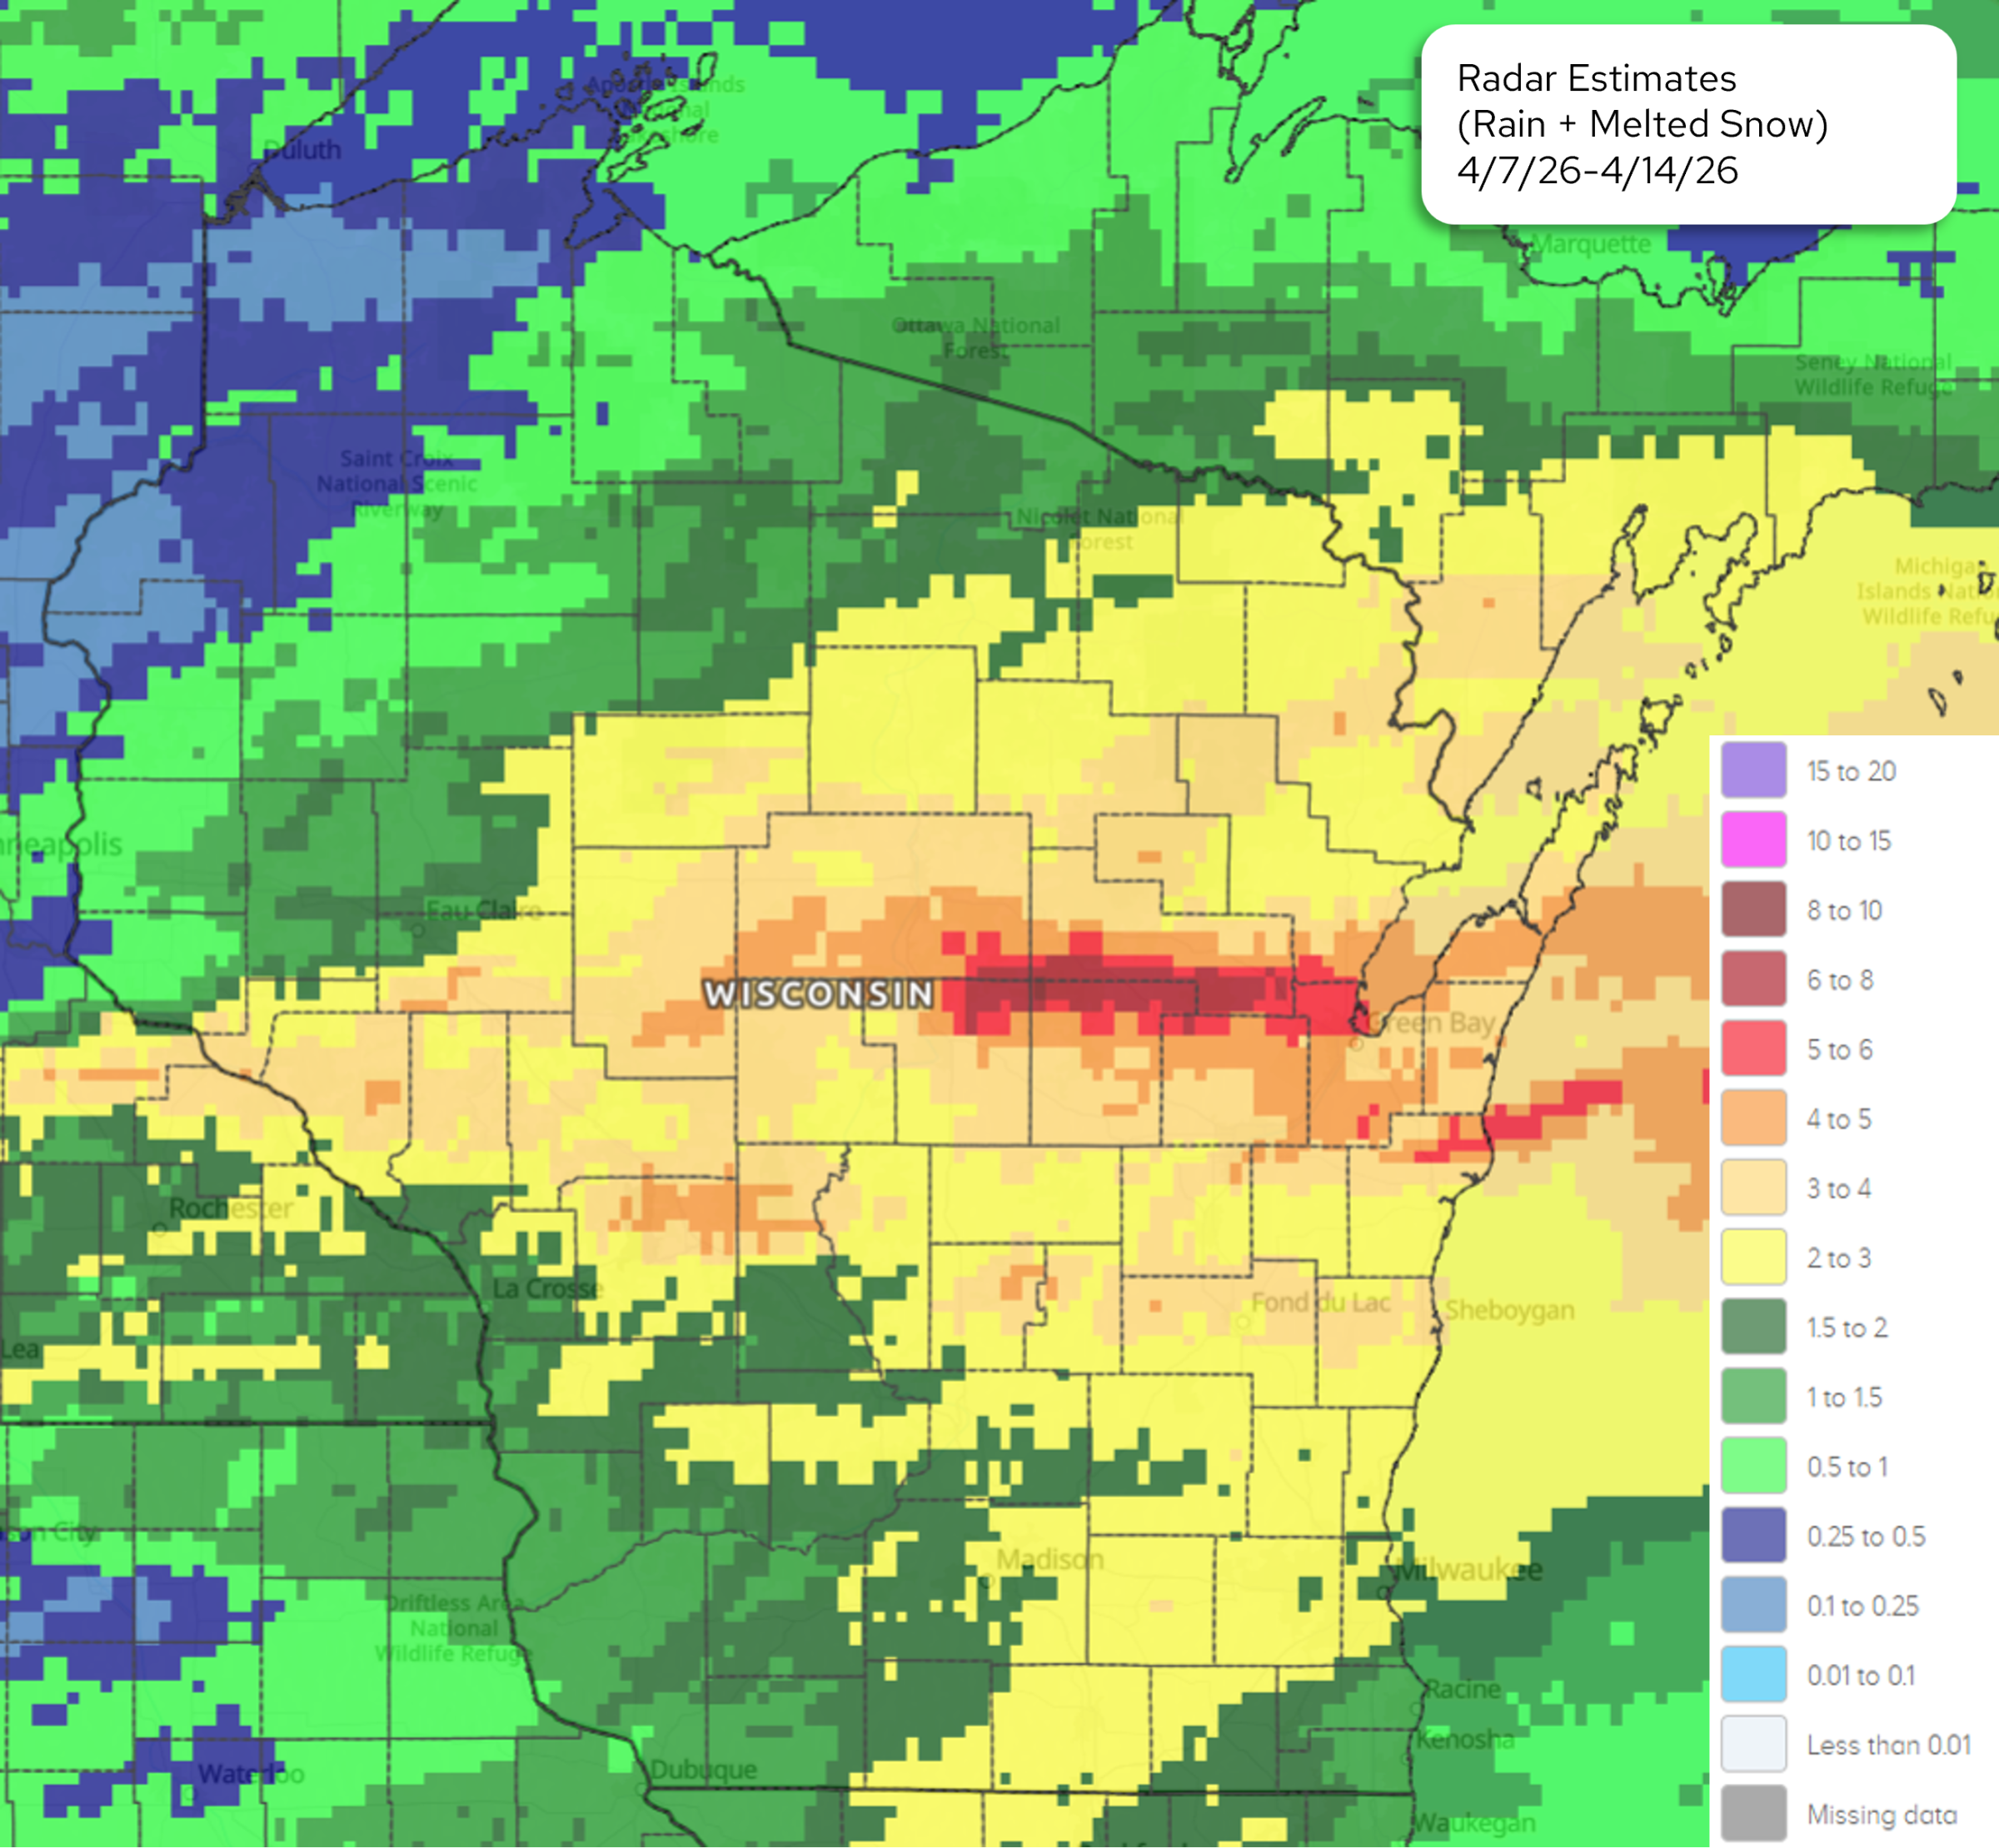
Image Description ↓
The image is a color-coded map titled “Radar Estimates (Rain + Melted Snow) 4/7/26–4/14/26,” showing accumulated precipitation across Wisconsin and surrounding regions. A horizontal band of red and dark orange crosses central Wisconsin, indicating the highest totals, approximately 6–8 inches. Surrounding areas show lower amounts: yellow and light orange (about 3–5 inches) across much of southern and eastern Wisconsin, and green shades (about 1–3 inches) to the west and north. A vertical legend on the right displays precipitation ranges from less than 0.01 inches up to 15–20 inches, using a gradient from light gray and blue through green, yellow, orange, red, and purple.
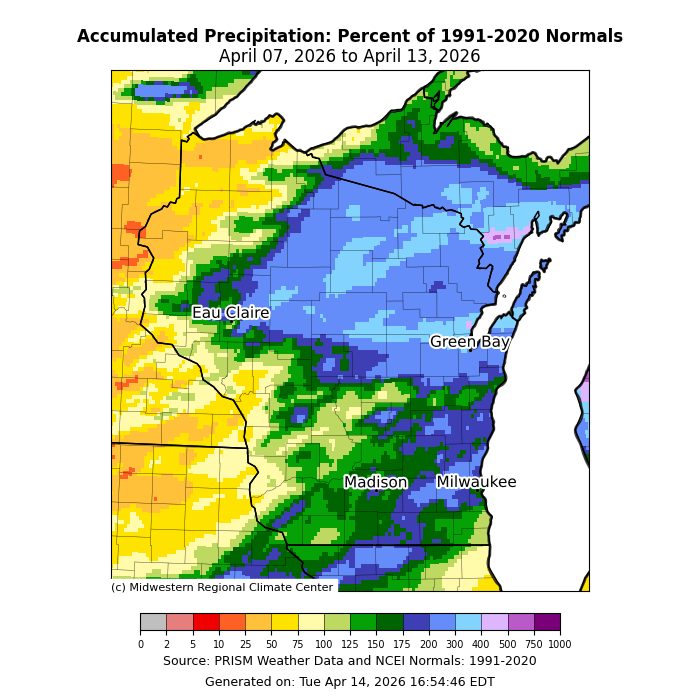
Image Description ↓
The map is titled “Accumulated Precipitation: Percent of 1991–2020 Normals, April 07, 2026 to April 13, 2026.” Colors represent precipitation as a percentage of normal: blues and purples indicate below-normal precipitation (roughly 25–75%), greens near normal (100–125%), and yellows, oranges, and reds above normal (150–300%+). Most of central and eastern Wisconsin, including Green Bay and Milwaukee, appears in blue shades, indicating below-normal precipitation. Western Wisconsin shows more greens and yellows, indicating near to above-normal totals. A legend at the bottom shows percentages from near 0 up to 1000%. Text at the bottom credits the Midwestern Regional Climate Center, PRISM Weather Data, and NCEI Normals (1991–2020), generated April 14, 2026.
- The heaviest precipitation was in a narrow band from Stevens Point to Green Bay, where 5-8” fell.
- Across central, eastern, and northeast counties, 2-5” of precipitation was common. These weekly totals were 150-300% of normal, with pockets of >300% of normal.
- On the western side of the state, totals were below normal (less than 2”).
- April 15 & 16: another 1-3” fell across southern WI, with localized areas of 3-5”.
- Flood warnings are in effect for several rivers as of April 16. Check the National Weather Service website for details.
30 Day Precipitation Total and Percent of Average
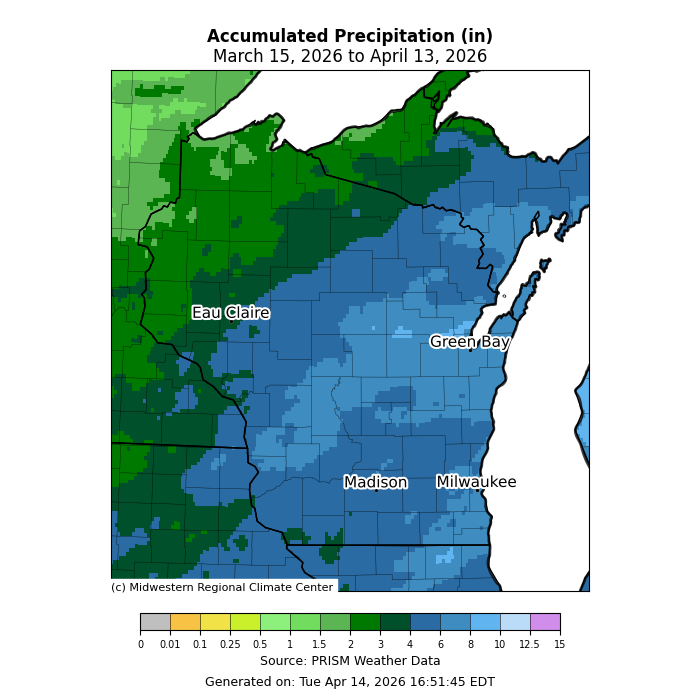
Image Description ↓
The map is titled “Accumulated Precipitation (in) March 15, 2026 to April 13, 2026.” A color scale indicates precipitation totals in inches, ranging from near 0 to 15+. Western and northern Wisconsin appear in darker green shades, representing higher totals (about 4–8+ inches). Central, eastern, and southern Wisconsin are shown mostly in blue tones, indicating lower totals (roughly 2–4 inches). The graphic credits the Midwestern Regional Climate Center and PRISM Weather Data, generated April 14, 2026.
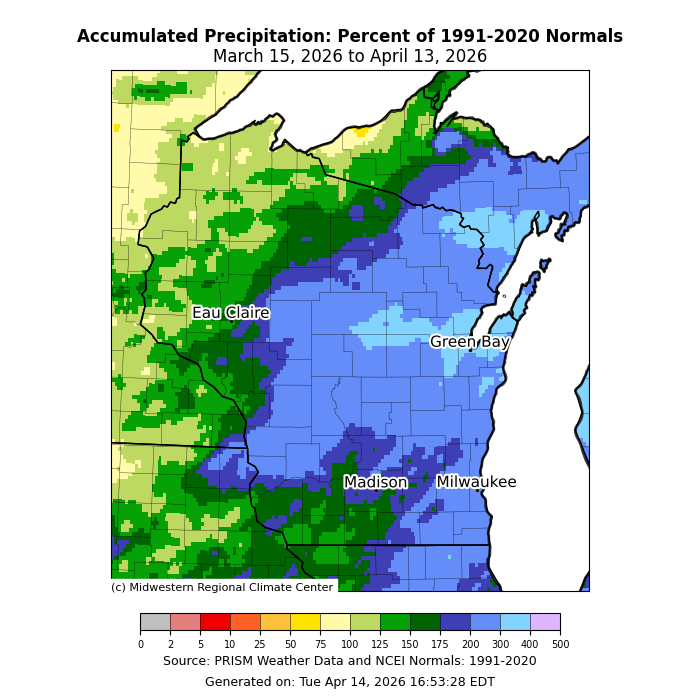
Image Description ↓
The map is titled “Accumulated Precipitation: Percent of 1991–2020 Normals, March 15, 2026 to April 13, 2026.” Colors indicate precipitation as a percentage of normal. Blues and light blues (about 50–100%) dominate central and eastern Wisconsin, including Green Bay, Madison, and Milwaukee, indicating below-normal precipitation. Greens (around 125–175%) appear mainly in western and northern Wisconsin, showing above-normal totals in those areas. A legend along the bottom ranges from near 0% to 500%. Credits include the Midwestern Regional Climate Center, PRISM Weather Data, and NCEI Normals (1991–2020), generated April 14, 2026.
- The heaviest precipitation was in a band stretching from Crawford to Door County, with totals of 6-10”.
- The far southeast corner of Wisconsin also received 6-10”.
- Northwest counties received 2-4”.
- A large portion of Wisconsin experienced precipitation totals that were 200-400% of average. Elsewhere, totals were at or above normal.
90 Day Precipitation Total and Percent of Average
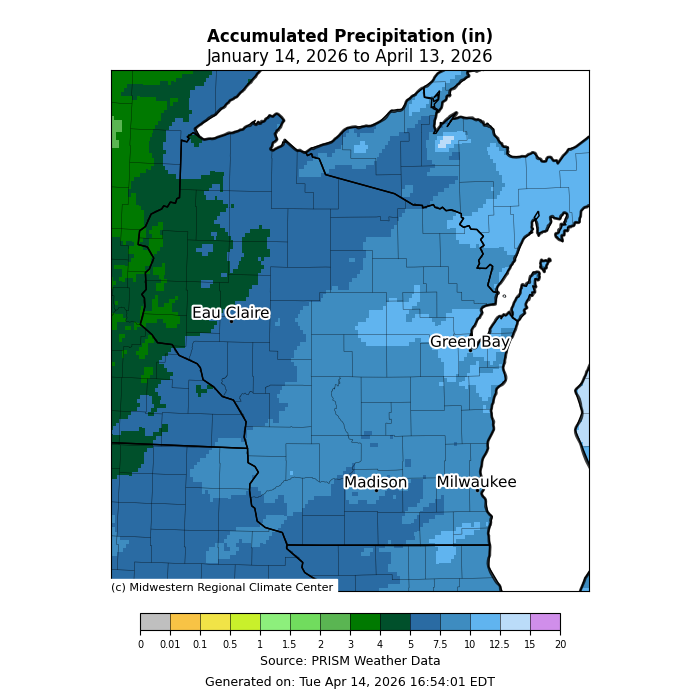
Image Description ↓
The map is titled “Accumulated Precipitation (in) January 14, 2026 to April 13, 2026.” Precipitation totals are represented by a color scale ranging from near 0 to about 20 inches. Most of Wisconsin appears in medium to darker blue shades, corresponding to roughly 4–8 inches of accumulated precipitation over the 90-day period. Portions of far western and northwestern Wisconsin show greener shades, indicating higher totals around 8–12 inches. The eastern and southeastern parts of the state, including Green Bay, Madison, and Milwaukee, show more uniform blue tones, indicating lower totals relative to the west. The map credits the Midwestern Regional Climate Center and PRISM Weather Data and notes it was generated on April 14, 2026.
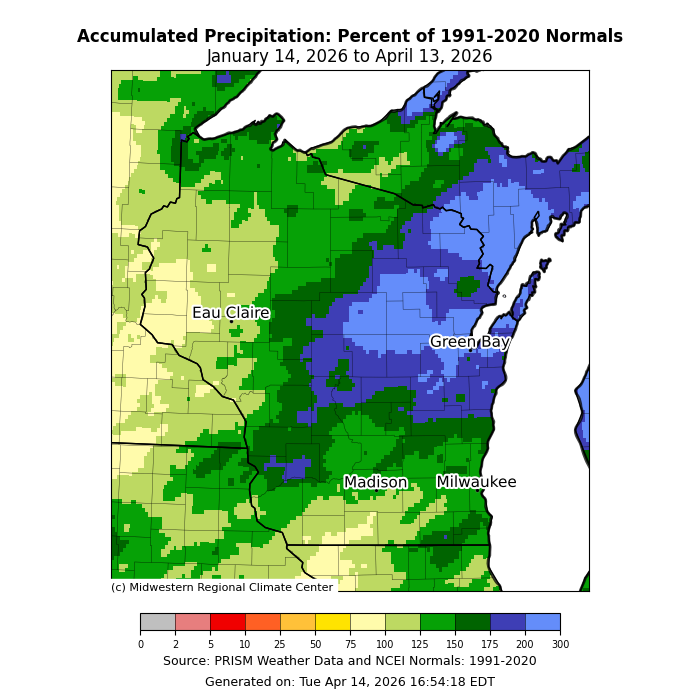
Image Description ↓
The map is titled “Accumulated Precipitation: Percent of 1991–2020 Normals, January 14, 2026 to April 13, 2026.” Colors represent precipitation as a percentage of normal, ranging from near 0% to 300%+ per the legend. Central and eastern Wisconsin, including Green Bay, Madison, and Milwaukee, appear mostly in blue shades, indicating below-normal precipitation (roughly 50–100%). Western and northern Wisconsin show green shades, indicating near to above-normal precipitation (about 125–175%). Lighter yellow-green tones appear in parts of southwestern Wisconsin, indicating near-normal totals. The legend and credits note PRISM Weather Data and NCEI Normals (1991–2020), with the map generated April 14, 2026 by the Midwestern Regional Climate Center.
- The highest precipitation totals were in the northeast and far southeast counties (10” or more). A large portion of the state received 5-10”.
- Precipitation totals were lowest in the northwest (3-5”).
- Totals in the northeast were 175-300% of normal. Most of Wisconsin experienced totals that were at or above normal.
2026 Precipitation
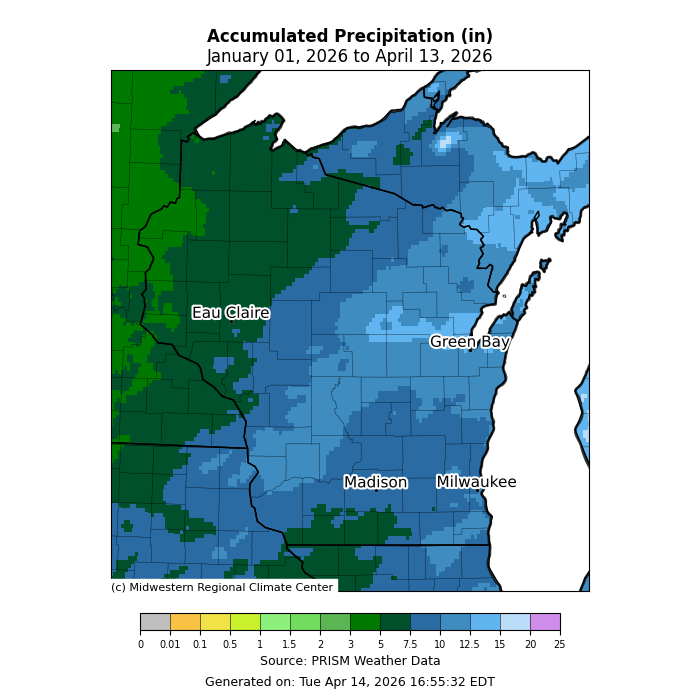
Image Description ↓
The map is titled “Accumulated Precipitation (in) January 01, 2026 to April 13, 2026.” Precipitation totals are shown using a color scale ranging from near 0 to 25 inches. Most of the state appears in blue shades, indicating roughly 5–10 inches of accumulated precipitation over this period. Western and northwestern Wisconsin show greener shades, indicating higher totals, approximately 10–15 inches. Central, eastern, and southeastern Wisconsin, including Green Bay, Madison, and Milwaukee, are dominated by blue tones, reflecting lower totals than the west. The bottom of the graphic credits the Midwestern Regional Climate Center and PRISM Weather Data and notes it was generated on April 14, 2026.
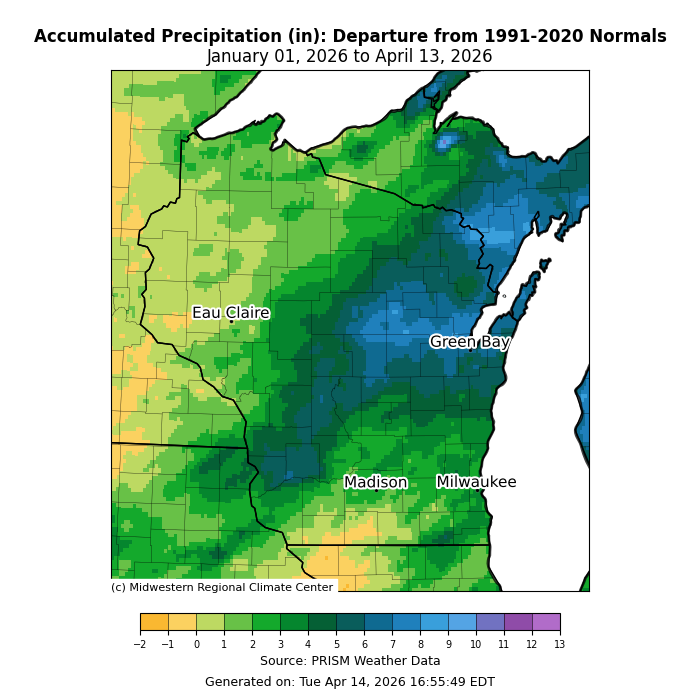
Image Description ↓
The map is titled “Accumulated Precipitation (in): Departure from 1991–2020 Normals, January 01, 2026 to April 13, 2026.” Colors represent inches above or below normal. Blues indicate below-normal precipitation, dominating central and eastern Wisconsin, including Green Bay, Madison, and Milwaukee, with departures roughly 1–4 inches below normal. Greens indicate near to moderately above-normal precipitation in much of western and northwestern Wisconsin, around 0 to 4 inches above normal. Yellow shades in parts of southwestern Wisconsin indicate slightly below-normal areas. A legend at the bottom ranges from −2 to +13 inches. Credits list the Midwestern Regional Climate Center, PRISM Weather Data, and generation date of April 14, 2026.
Soil Moisture and Temperature Trends
Soil Moisture Models
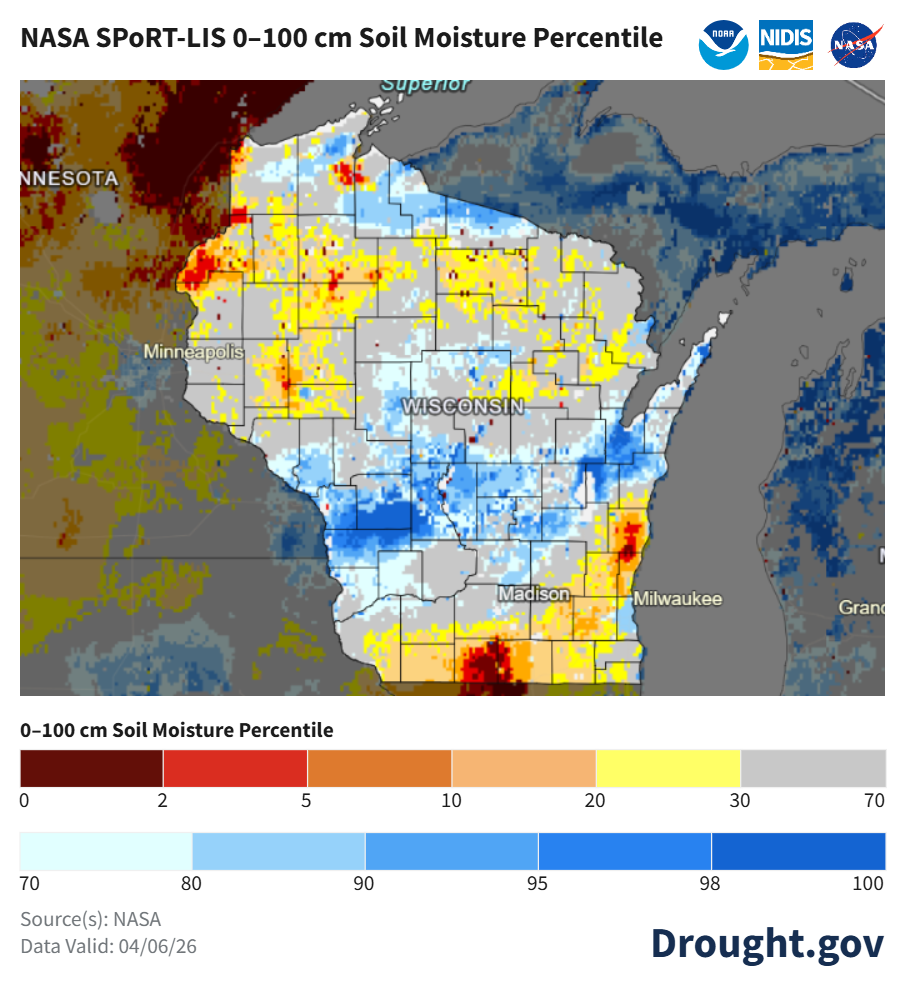
Image Description ↓
The map is titled “NASA SPoRT‑LIS 0–100 cm Soil Moisture Percentile” and covers Wisconsin and nearby regions. Colors represent soil moisture percentiles from 0 to 100: dark red and orange indicate very dry soils (0–10th percentile), yellow indicates below normal (10–30th), light gray near normal, and light to dark blue indicate above‑normal to very wet soils (70–100th percentile). Central Wisconsin shows widespread blue shades, indicating above‑normal to very wet soil moisture. Northwestern Wisconsin and parts of southern Wisconsin show red and orange areas, indicating very dry soils. The legend appears at the bottom with percentile ranges, and logos for NASA, NOAA, and NIDIS appear at the top right. The bottom notes “Source(s): NASA,” “Data Valid: 04/06/26,” and “Drought.gov.”
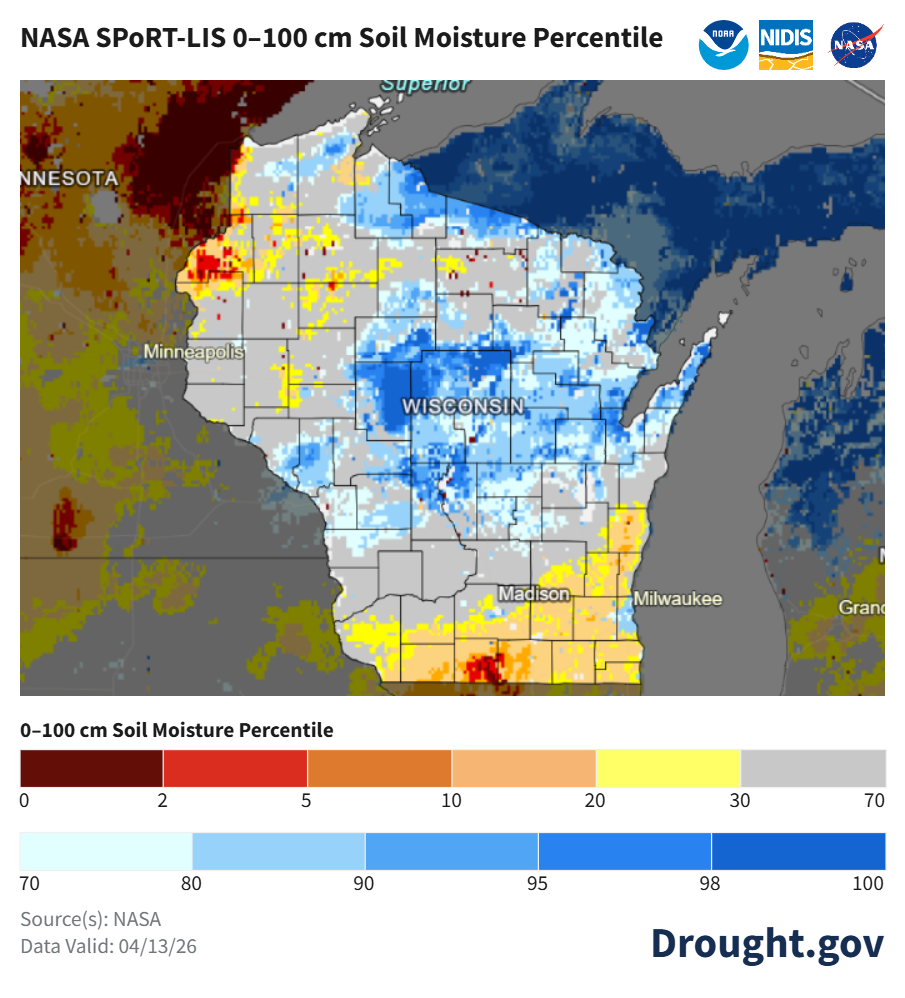
Image Description ↓
The map is titled “NASA SPoRT‑LIS 0–100 cm Soil Moisture Percentile” and covers Wisconsin and nearby regions. Colors represent soil moisture percentiles: dark red to orange indicates very dry soils (0–10th percentile), yellow shows below‑normal moisture (10–30th), light gray is near normal, and light to dark blue indicates above‑normal to very wet soils (70–100th percentile). Central Wisconsin is dominated by blues, indicating wetter‑than‑normal soil moisture. Northwestern Wisconsin and parts of southern Wisconsin show red and orange areas, indicating very dry conditions. The legend at the bottom shows percentile ranges from 0 to 100. Text below the legend reads “Source(s): NASA” and “Data Valid: 04/13/26,” and “Drought.gov” appears at bottom right. NASA, NOAA, and NIDIS logos appear at the top right.
- Soil moisture levels increased across northeast Wisconsin following a very wet week in those counties.
- Soils in the central, northeast, and north-central counties are near normal or wetter than normal.
- Abnormal dryness remains in place across the far southern counties and in parts of the northwest.
- Notes on how to interpret the maps:
- Red areas = top 5 driest in 100 years.
- Dark red areas = top 2 driest in 100 years.
- Dark blue areas = top 2 wettest in 100 years.
Wisconet Soil Moisture
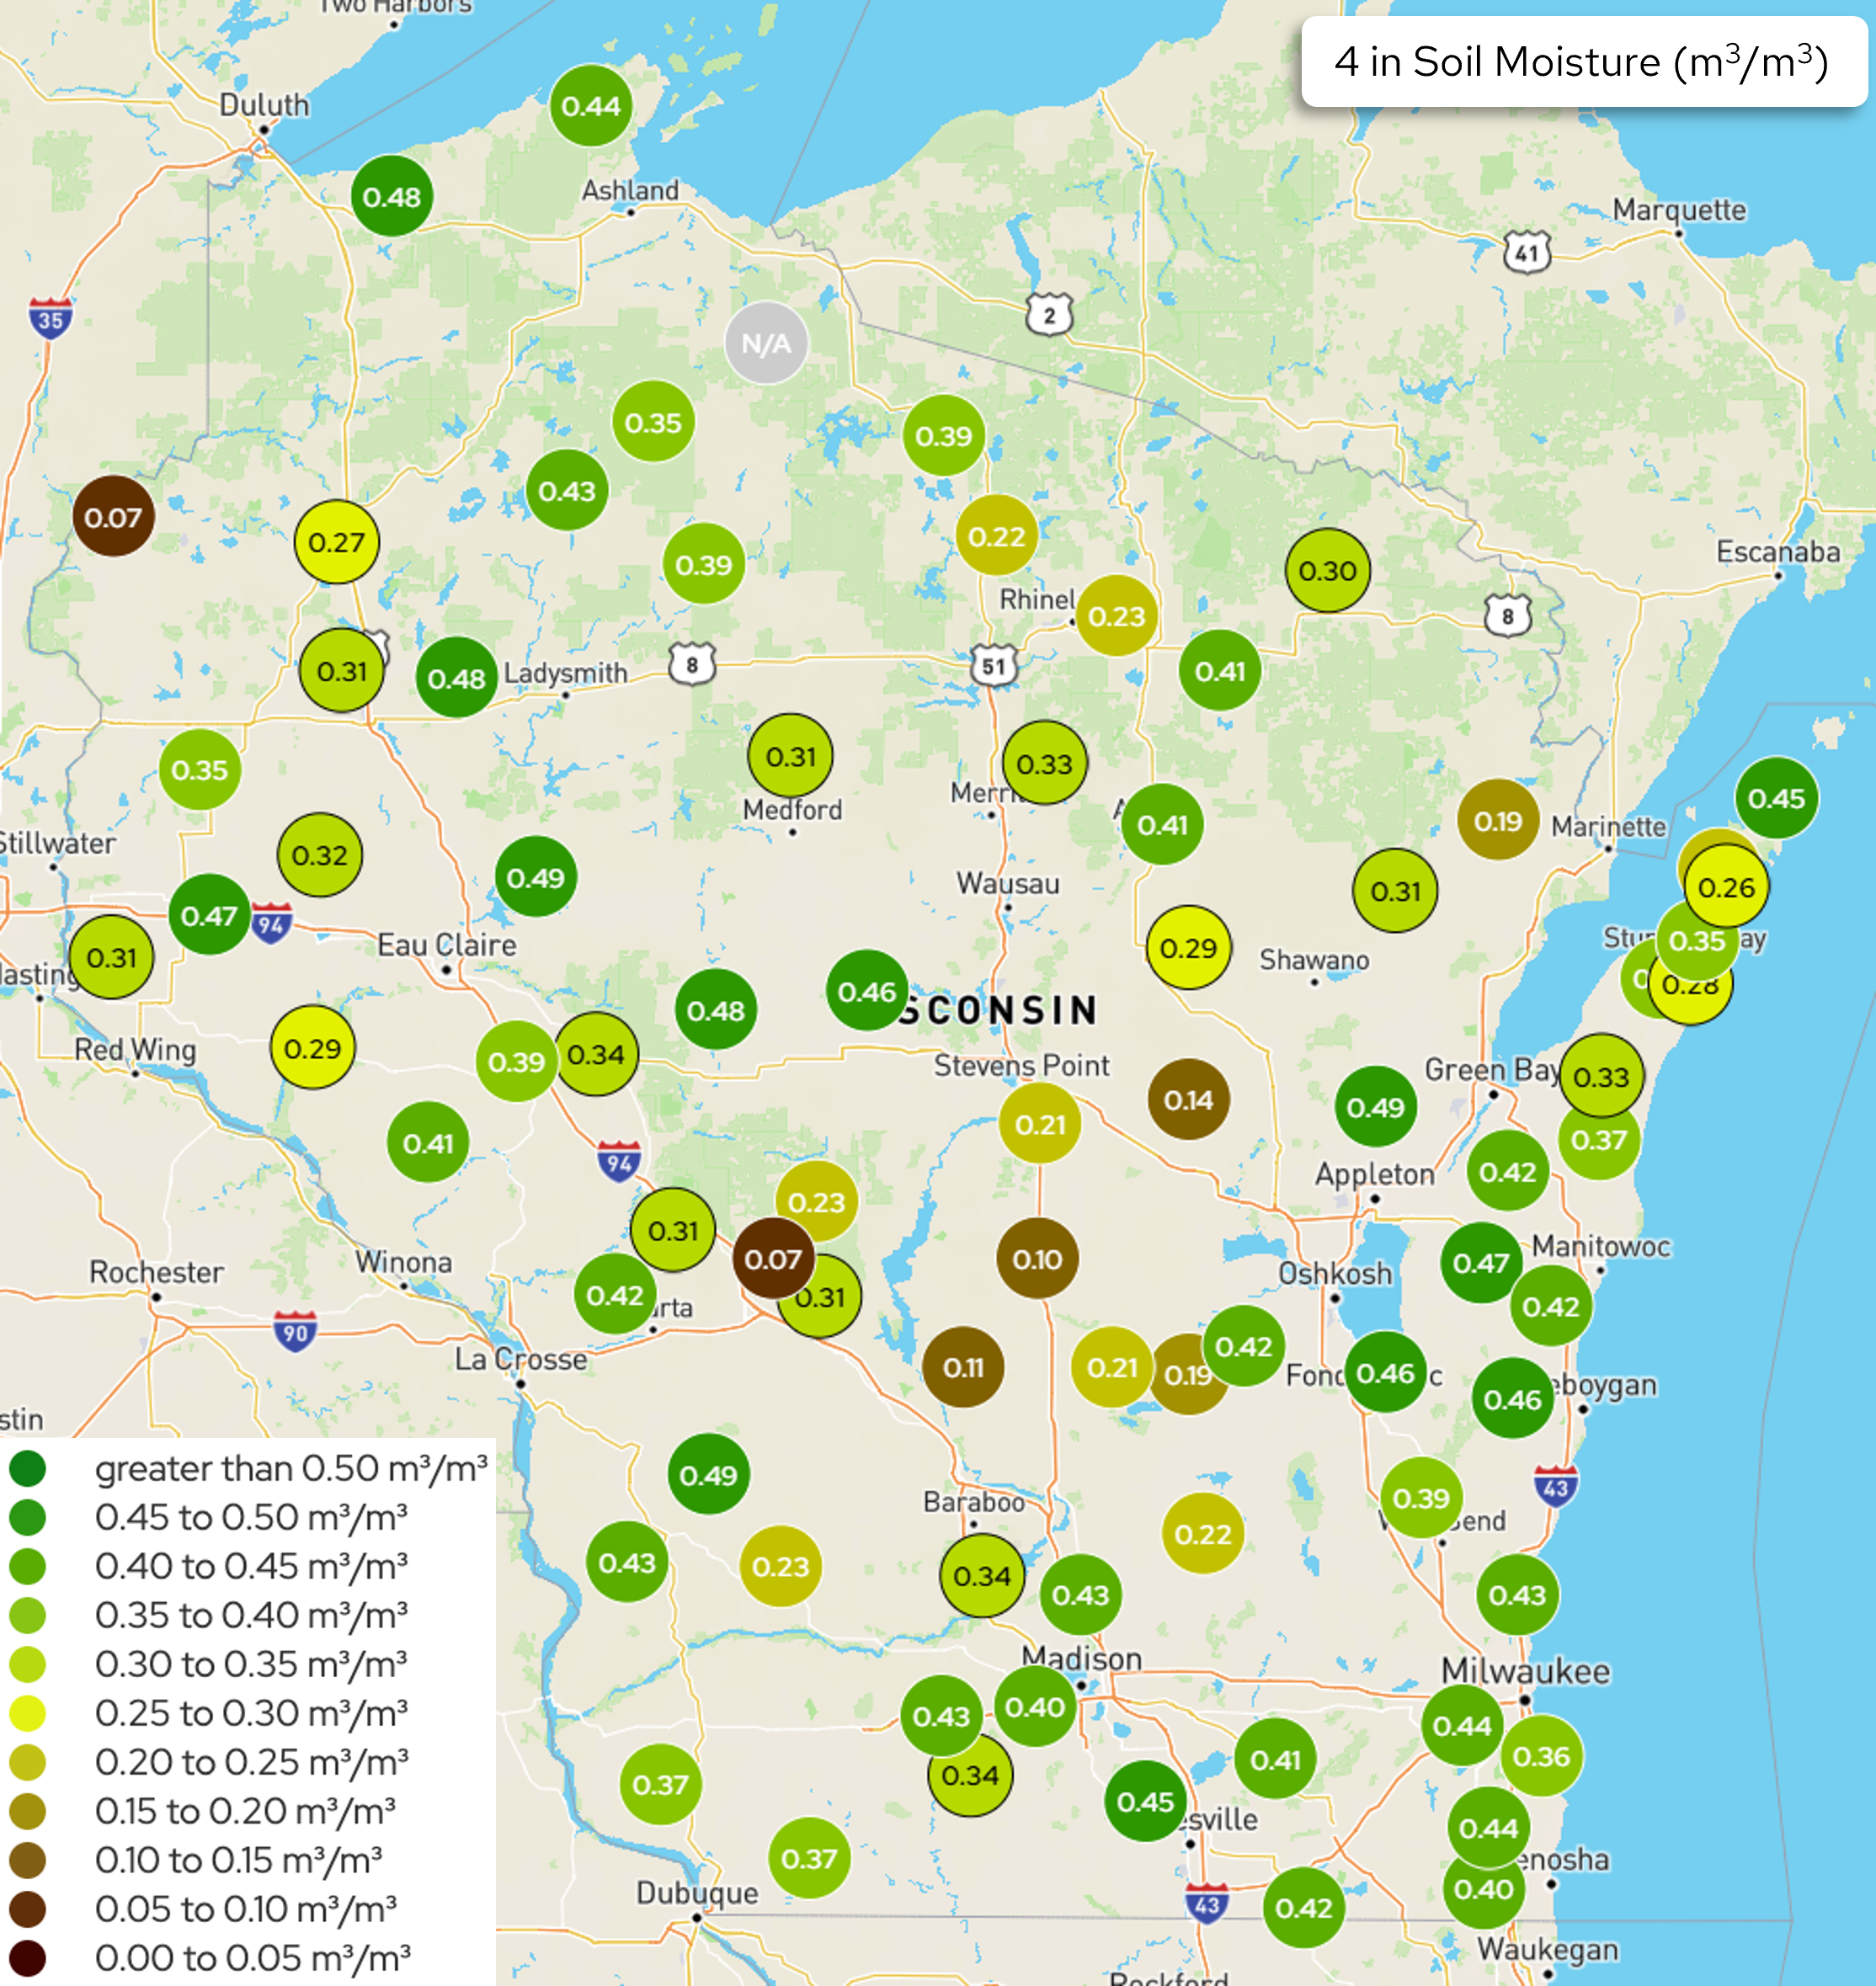
Image Description ↓
The image is a map of Wisconsin titled “4 in Soil Moisture (m³/m³).” Circular markers are placed across the state, each labeled with a numeric soil moisture value at 4 inches depth. Colors indicate moisture categories: dark red and brown show very low moisture (0.00–0.10 m³/m³), yellow to light green show moderate moisture (0.20–0.35), and dark green shows higher moisture (0.40–greater than 0.50). Values vary statewide, with several low readings (around 0.07–0.14) in south‑central Wisconsin, while many central, western, and eastern locations show moderate to high values around 0.35–0.49. A legend in the lower left lists soil moisture ranges from 0.00 to greater than 0.50 m³/m³.
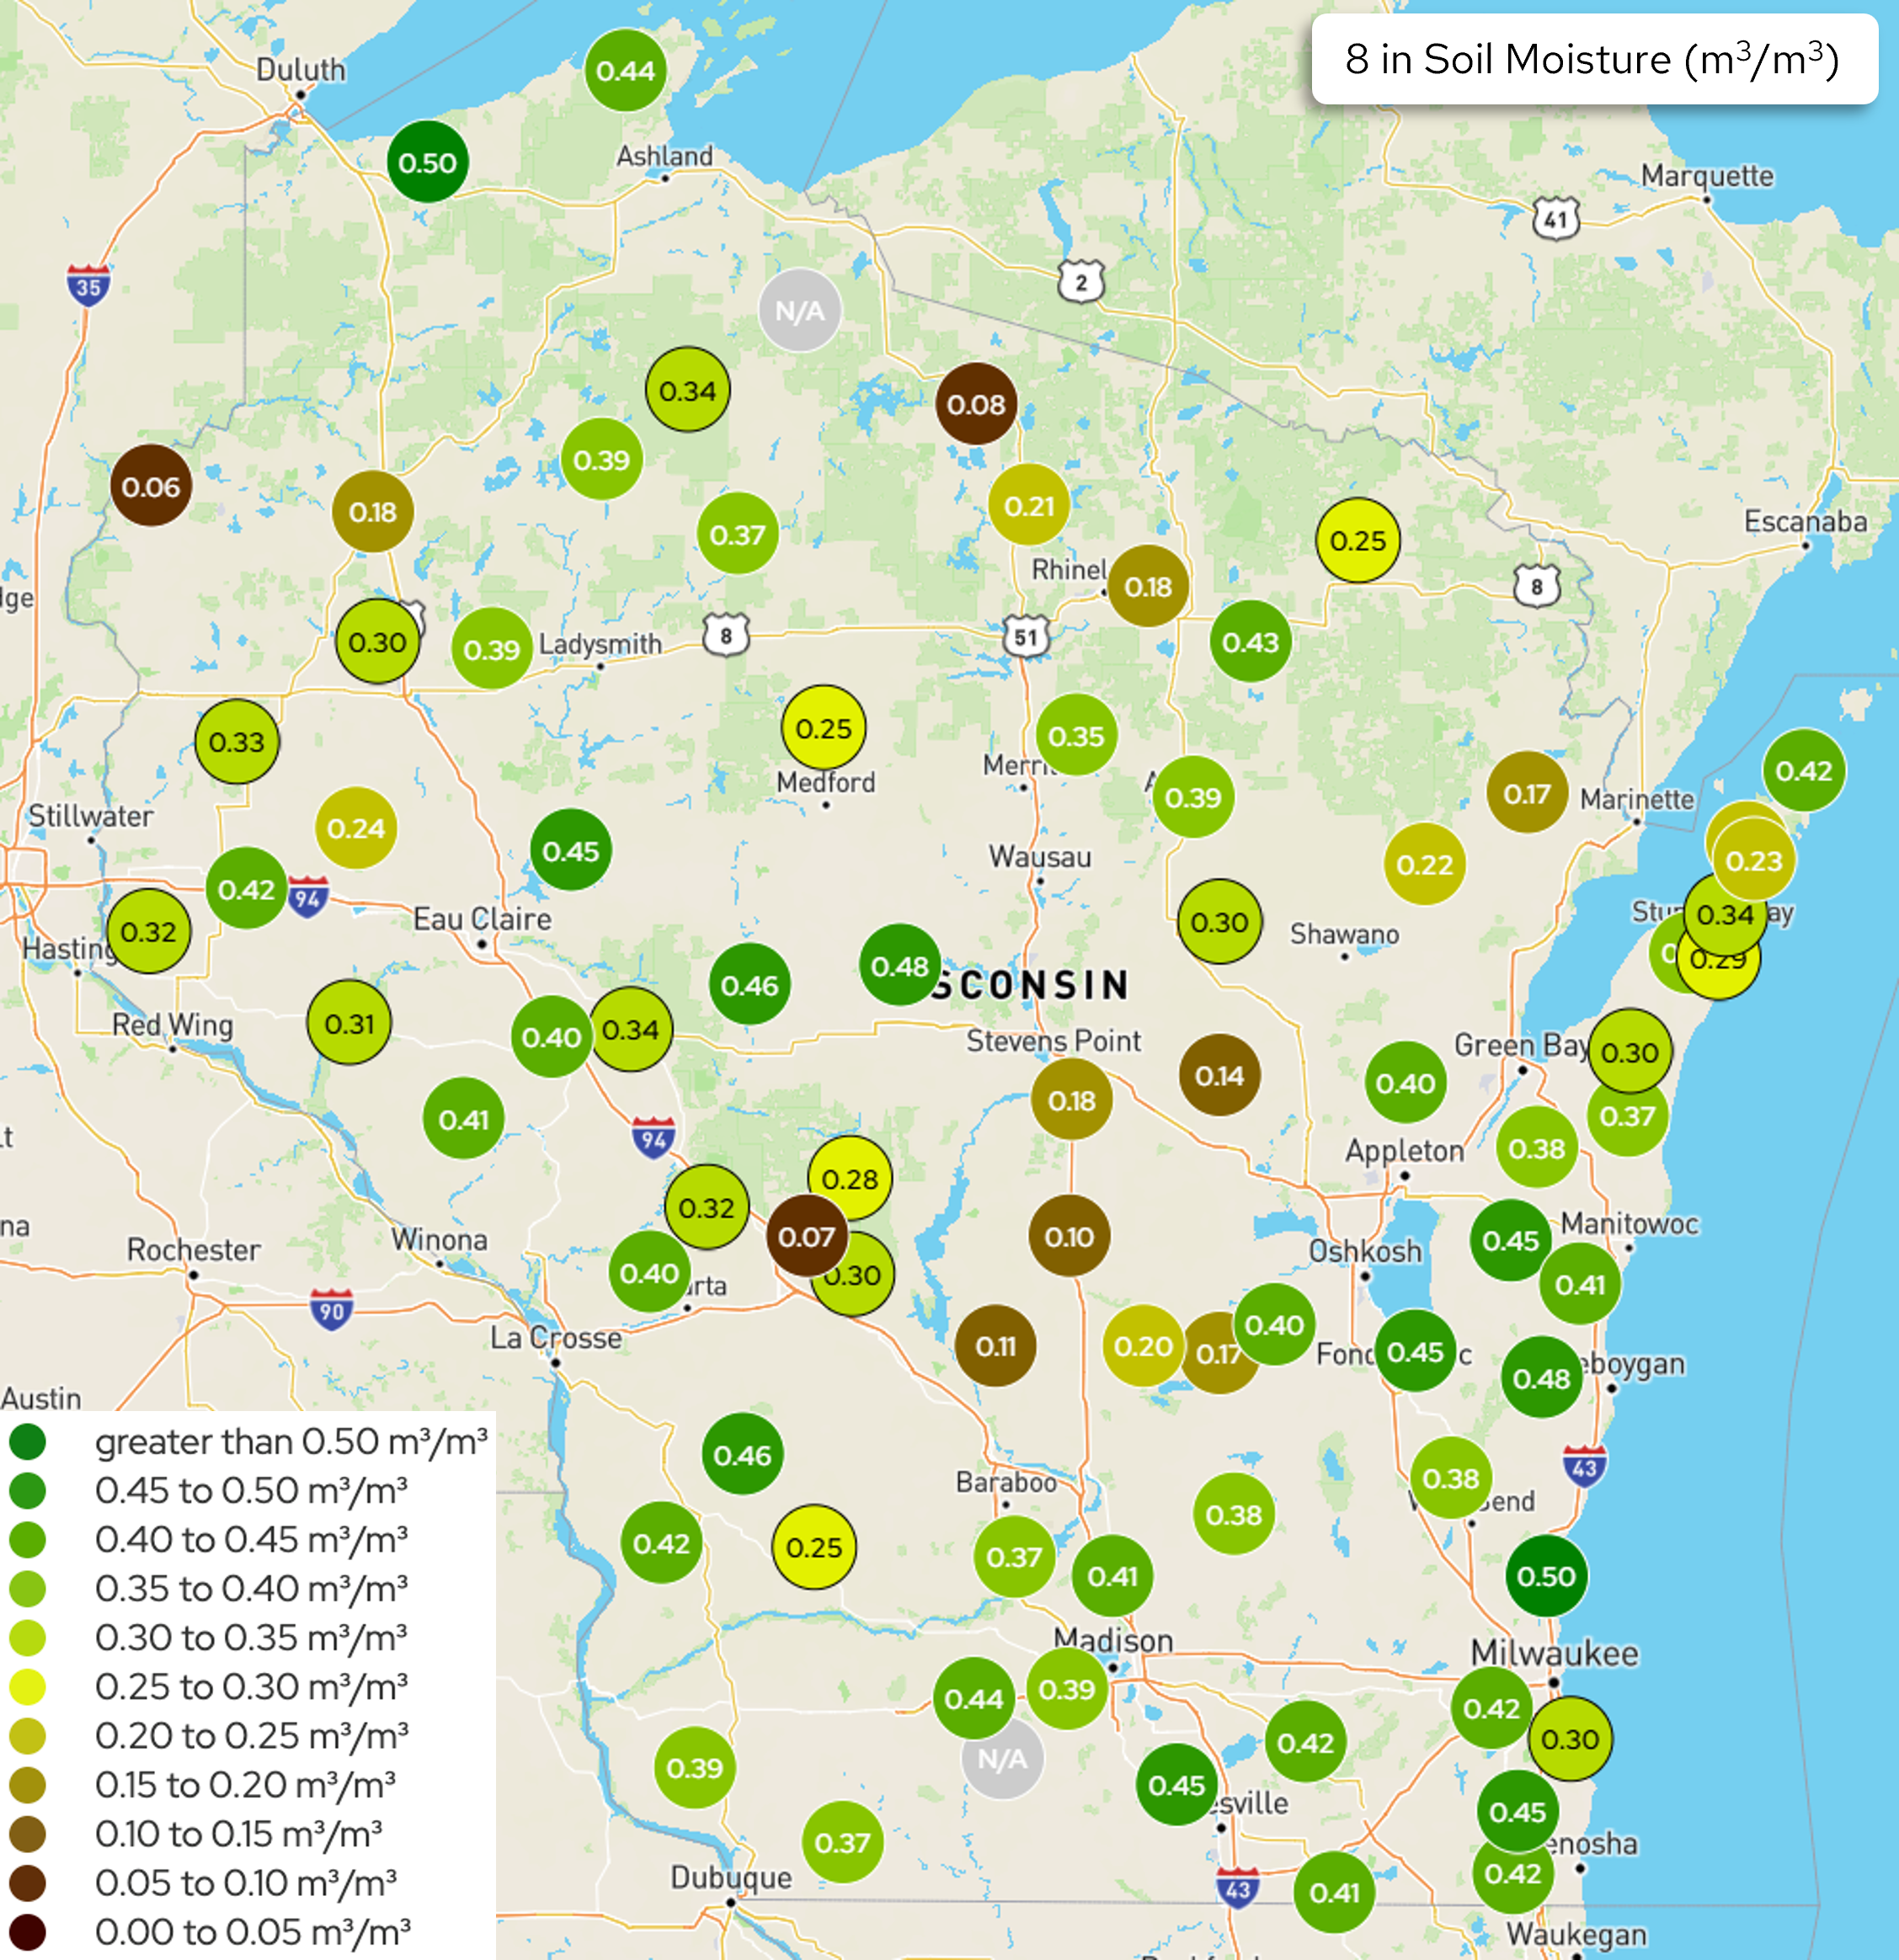
Image Description ↓
The image is a map of Wisconsin titled “8 in Soil Moisture (m³/m³).” Circular station markers are distributed across the state, each labeled with a numeric soil moisture value at 8 inches depth. Marker colors correspond to moisture ranges shown in a legend at lower left: dark red and brown indicate very low moisture (0.00–0.10 m³/m³), yellow indicates low to moderate moisture (0.20–0.30), light green shows moderate moisture (0.30–0.40), and dark green indicates high moisture (0.40–greater than 0.50). Soil moisture values vary across the state. Several south‑central locations show low values around 0.07–0.14, while many central, western, and eastern stations show moderate to high values around 0.35–0.48.
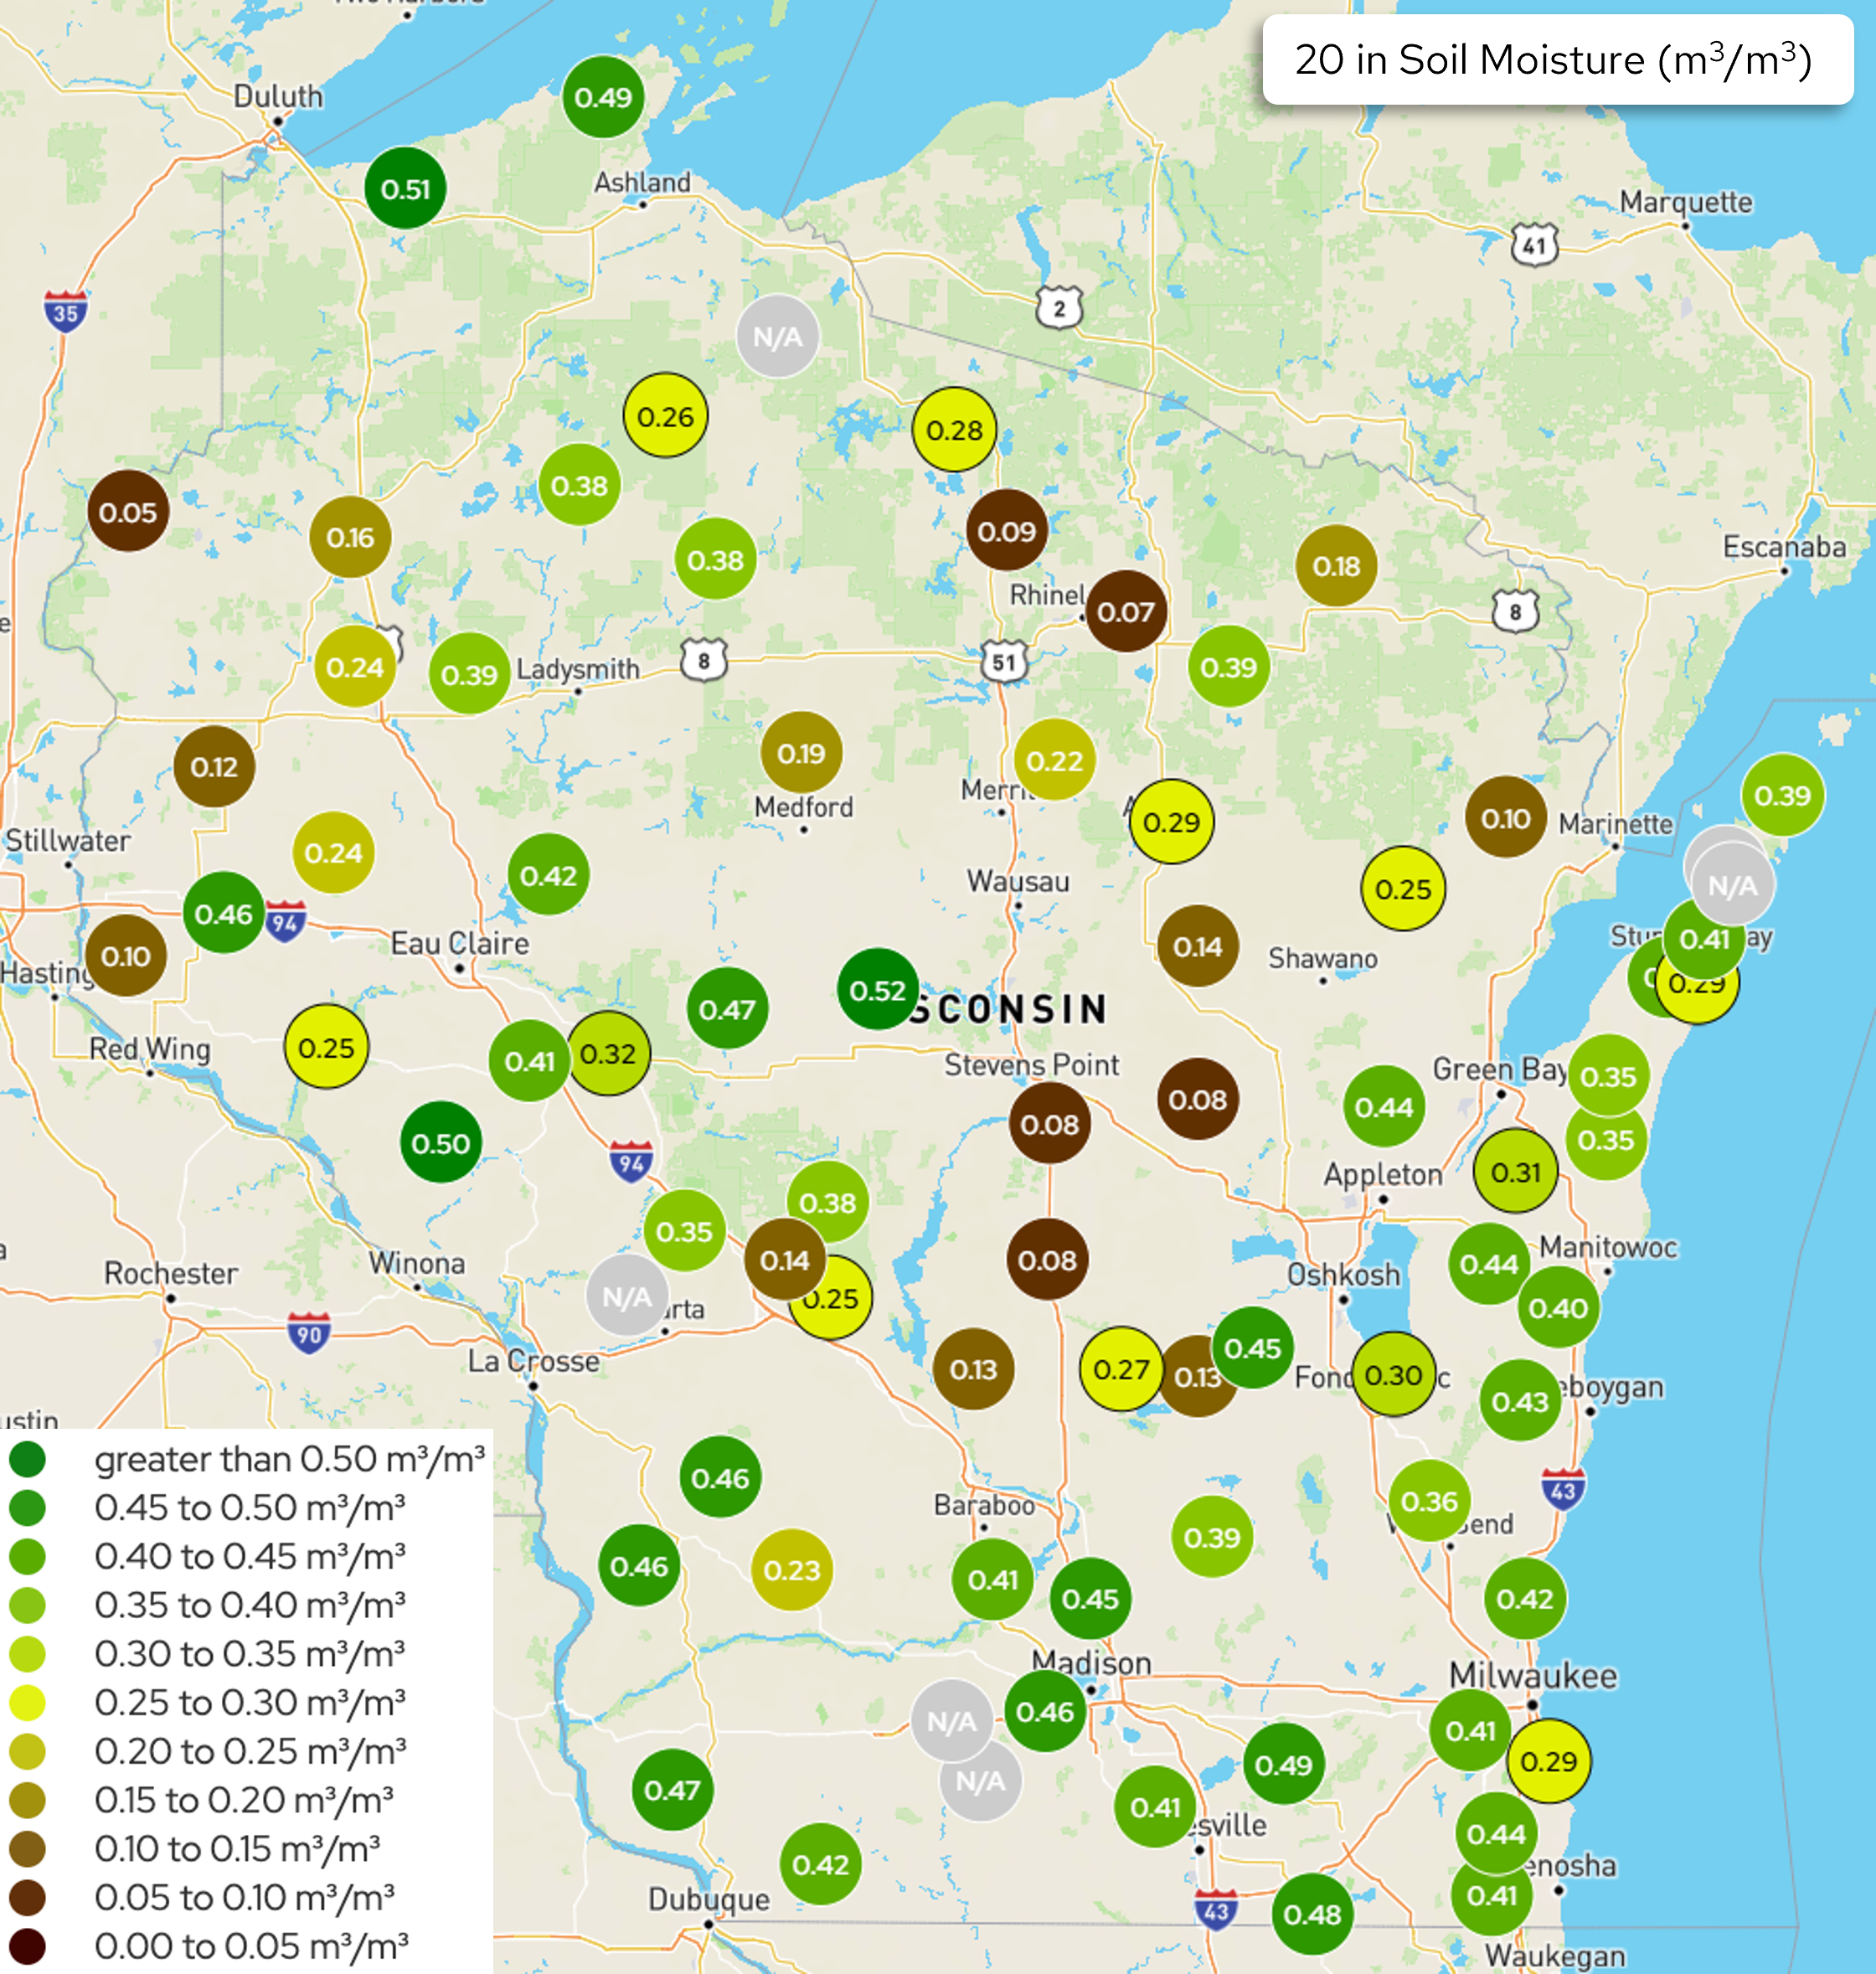
Image Description ↓
The map is titled “20 in Soil Moisture (m³/m³).” Circular markers indicate station‑based soil moisture measurements at 20 inches depth, each labeled with a numeric value. Marker colors correspond to ranges shown in a legend at lower left: dark red and brown represent very low moisture (0.00–0.10 m³/m³); yellow indicates low to moderate moisture (0.20–0.30); light green shows moderate moisture (0.30–0.40); and dark green indicates high moisture (0.40 to greater than 0.50). Values vary statewide, with several very low readings (around 0.05–0.14) scattered across central and northern areas, while many southern, western, and eastern stations show moderate to high values between about 0.35 and 0.50. Some stations are marked “N/A.”
- The maps show Wisconet soil moisture conditions on April 14th @ 12:00 pm.
- The table shows total precipitation and changes in soil moisture from April 6th (Start) to April 13th (End).
- Units of map & change values are {Volume of water}/{Volume of soil}.
| Research Farm | County | Total Precipitation (in.) | 4″ Start | 4″ End | 8″ Start | 8″ End | 20″ Start | 20″ End |
|---|---|---|---|---|---|---|---|---|
| Arlington | Columbia | 1.25 | 0.41 | 0.43 | 0.39 | 0.41 | 0.43 | 0.45 |
| Black River Falls | Jackson | 2.44 | 0.12 | 0.20 | 0.15 | 0.21 | 0.23 | 0.24 |
| Dairy Forage ARS | Sauk | 1.12 | 0.32 | 0.34 | 0.35 | 0.37 | 0.40 | 0.41 |
| Hancock | Waushara | 1.95 | 0.09 | 0.15 | 0.09 | 0.13 | 0.07 | 0.09 |
| Kemp | Oneida | 1.97 | 0.23 | 0.24 | 0.21 | 0.21 | 0.10 | 0.10 |
| Lancaster | Grant | 0.97 | 0.35 | 0.37 | 0.38 | 0.39 | 0.46 | 0.47 |
| Marshfield | Marathon | 3.06 | 0.46 | 0.46 | 0.48 | 0.48 | 0.51 | 0.52 |
| O.J. Noer (Turfgrass) | Dane | 1.41 | 0.38 | 0.40 | 0.37 | 0.39 | 0.45 | 0.46 |
| Peninsular | Door | 3.48 | 0.35 | 0.35 | 0.41 | 0.34 | 0.41 | 0.41 |
| Rhinelander | Oneida | 1.98 | 0.24 | 0.23 | 0.19 | 0.19 | 0.09 | 0.08 |
| Spooner | Washburn | 0.34 | 0.29 | 0.28 | 0.19 | 0.18 | 0.17 | 0.16 |
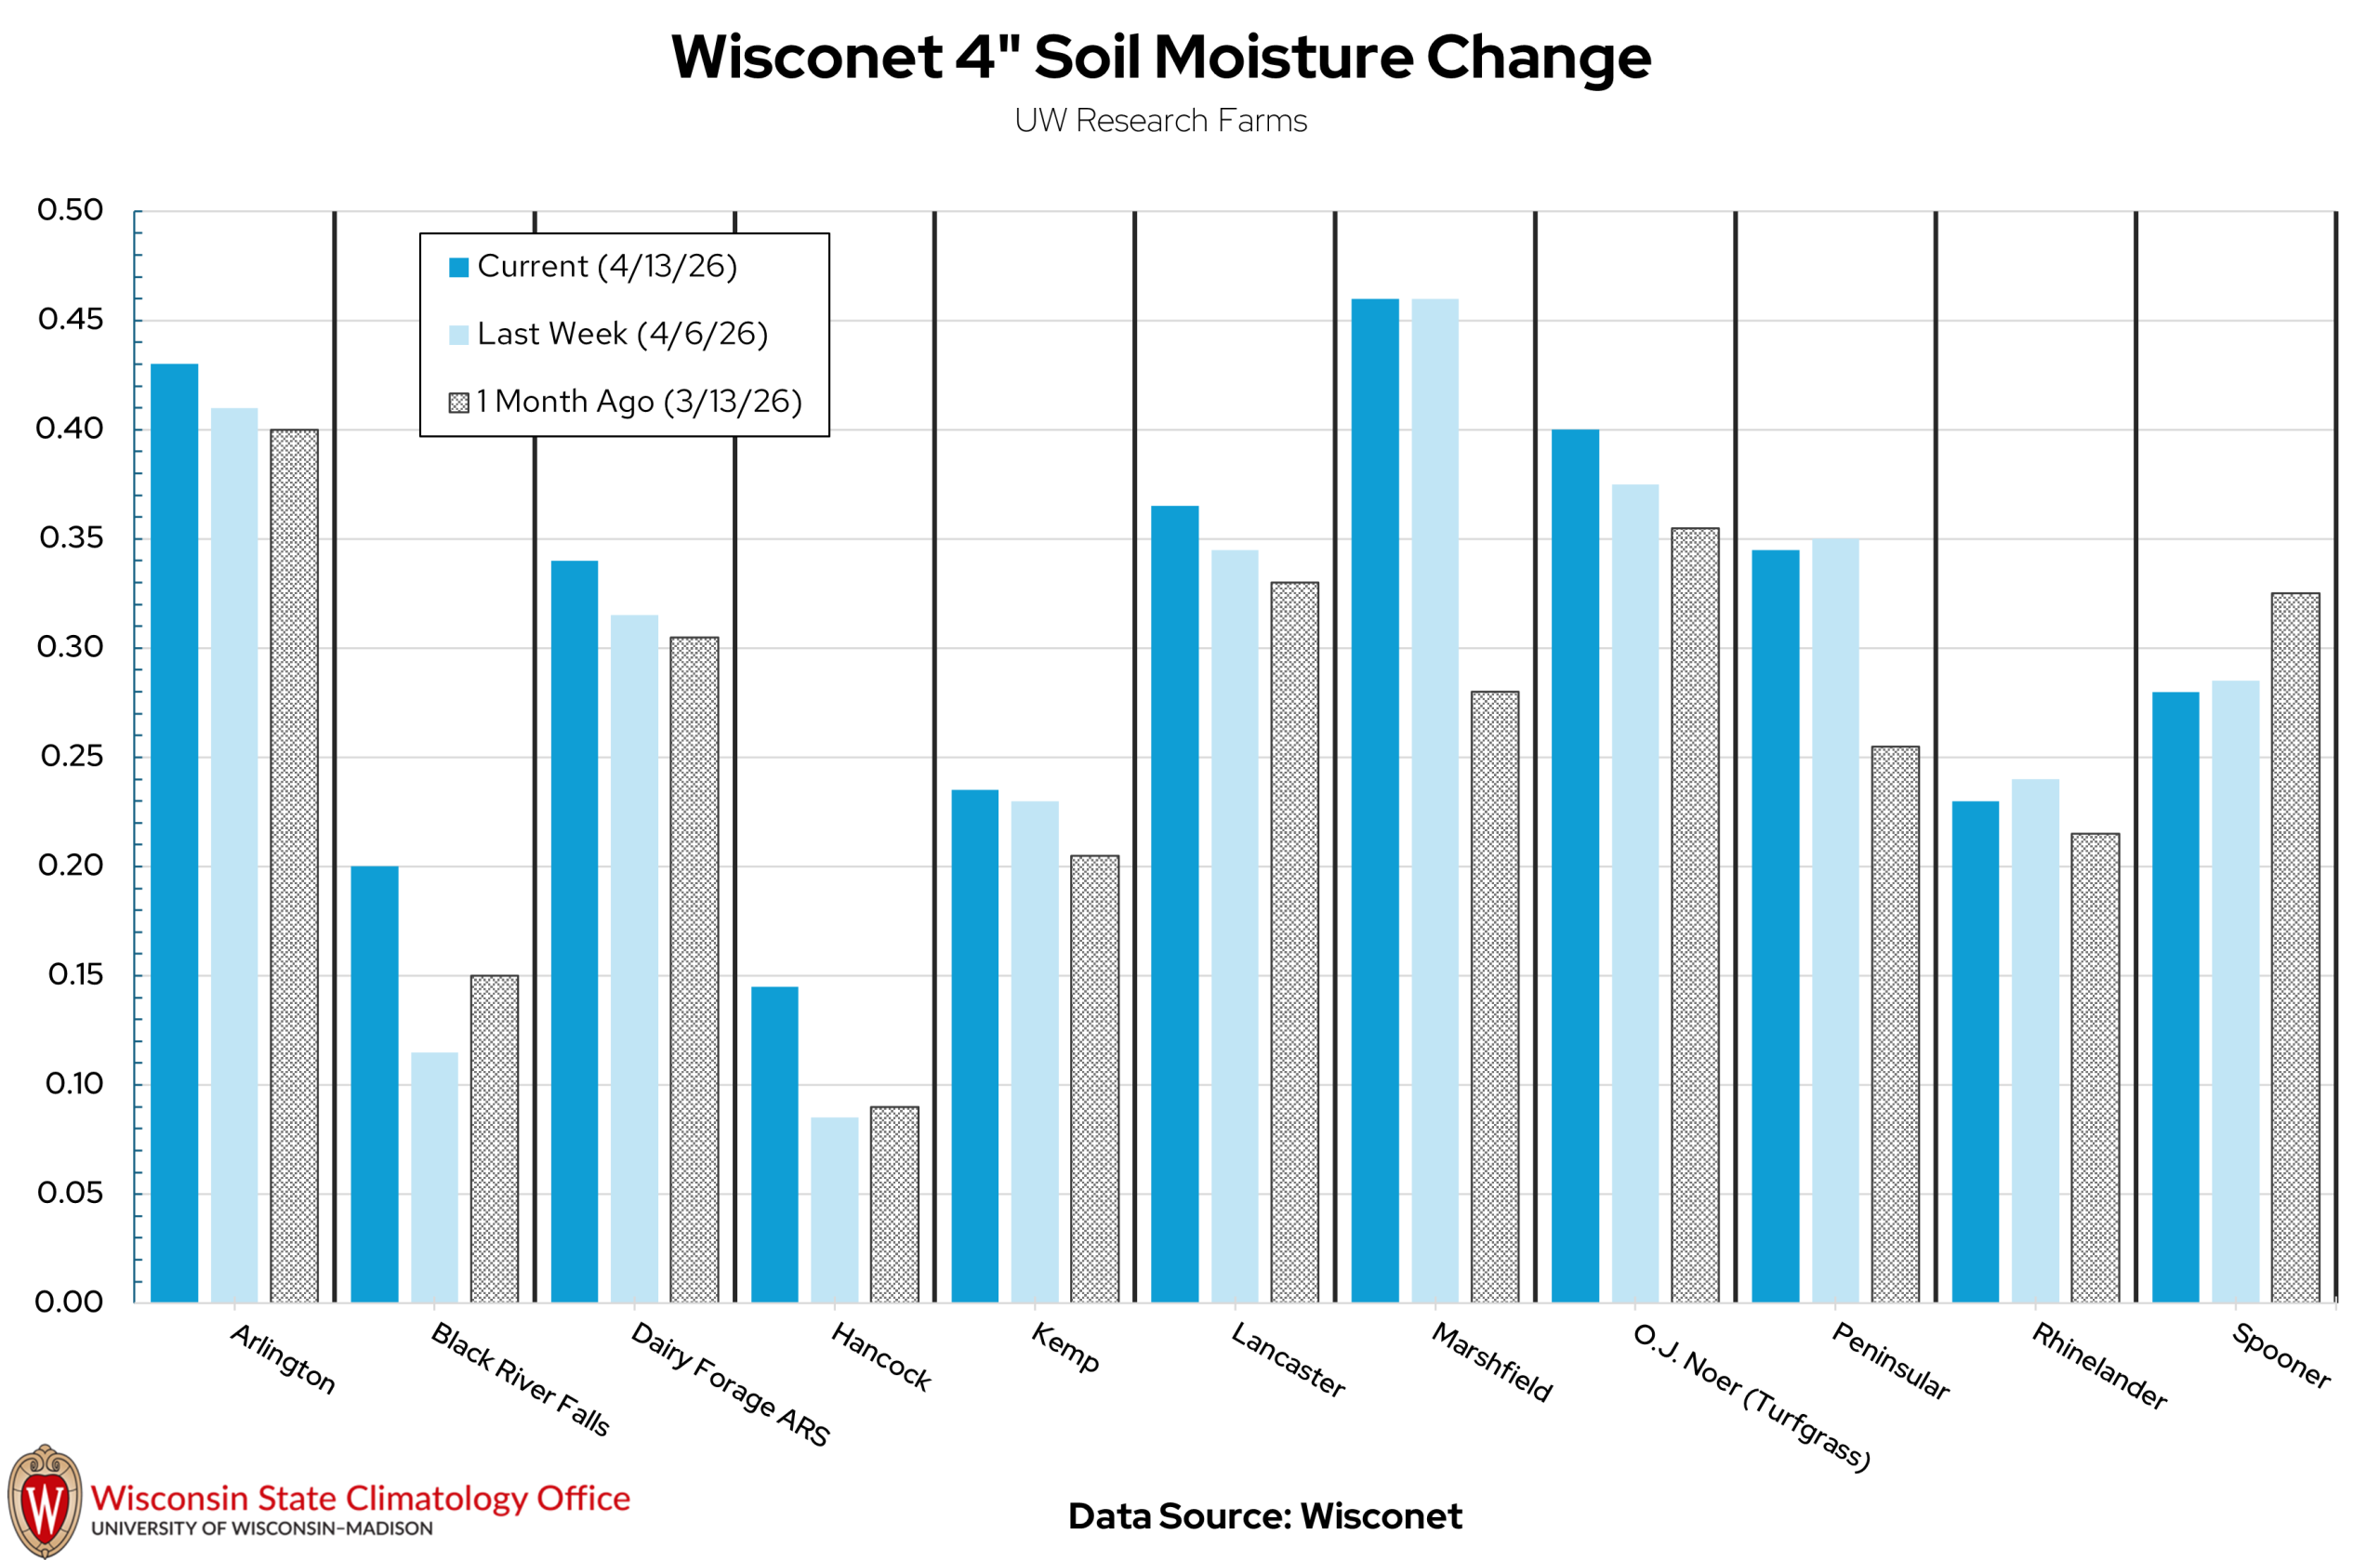
Image Description ↓
The chart is titled “Wisconet 4″ Soil Moisture Change” with a subtitle “UW Research Farms.” It displays grouped vertical bars for multiple locations along the horizontal axis, including Arlington, Black River Falls, Dairy Forage ARS, Hancock, Kewaunee, Lancaster, Marshfield, O.J. Noer (Turfgrass), Peninsula, Rhinelander, and Spooner. The vertical axis ranges from 0.00 to 0.50 (m³/m³). Each location has three bars: dark blue labeled “Current (4/13/26),” light blue labeled “Last Week (4/6/26),” and gray labeled “1 Month Ago (3/13/26).” Most sites show current soil moisture between about 0.20 and 0.45, with higher values at Marshfield and Arlington and lower values at Hancock and Peninsula. A legend appears near the top left. At the bottom left is the Wisconsin State Climatology Office logo, and centered text reads “Data Source: Wisconet.”
| Research Farm | Current 4″ Soil Moisture | Last Week’s 4″ Soil Moisture | 1 Month Ago 4″ Soil Moisture |
|---|---|---|---|
| Arlington | 0.43 | 0.41 | 0.40 |
| Black River Falls | 0.20 | 0.12 | 0.15 |
| Dairy Forage ARS | 0.34 | 0.32 | 0.31 |
| Hancock | 0.15 | 0.09 | 0.09 |
| Kemp | 0.24 | 0.23 | 0.21 |
| Lancaster | 0.37 | 0.35 | 0.33 |
| Marshfield | 0.46 | 0.46 | 0.28 |
| O.J. Noer (Turfgrass) | 0.40 | 0.38 | 0.36 |
| Peninsular | 0.35 | 0.35 | 0.26 |
| Rhinelander | 0.23 | 0.24 | 0.22 |
| Spooner | 0.28 | 0.29 | 0.33 |
USDA Soil Moisture Reports
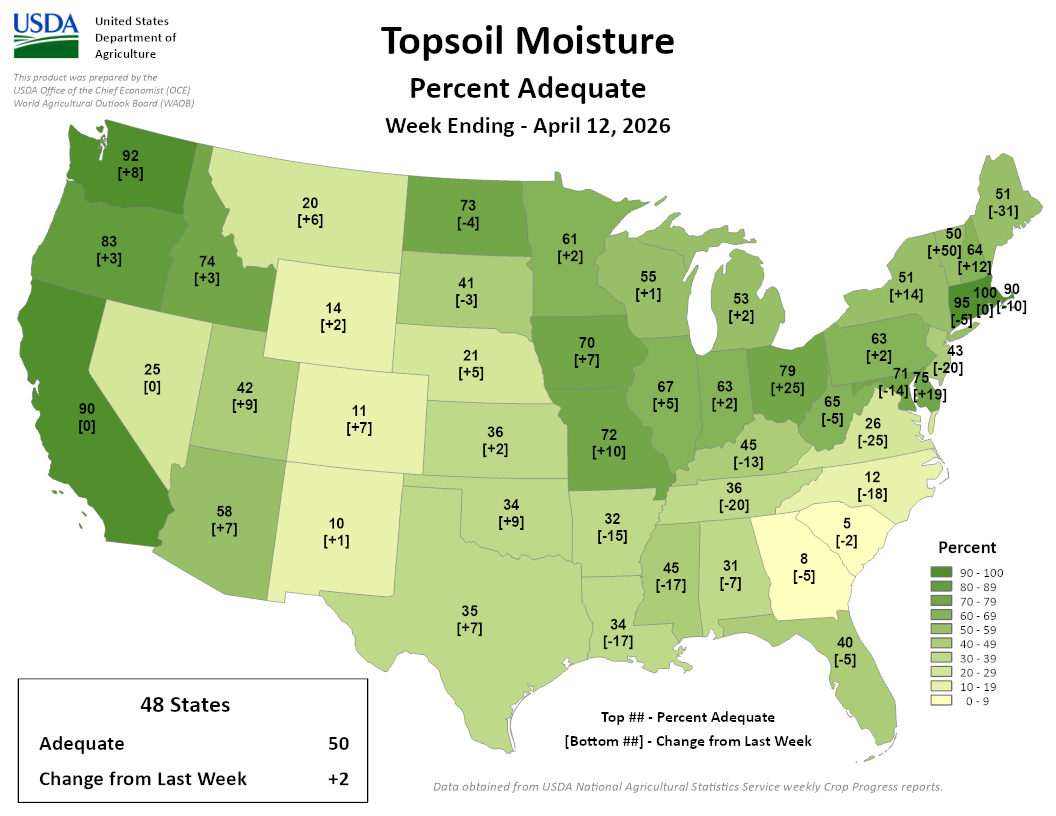
Image Description ↓
The graphic is titled “Topsoil Moisture – Percent Adequate, Week Ending April 12, 2026” from the United States Department of Agriculture. It shows a map of the contiguous United States with each state shaded from light to dark green to represent the percentage of topsoil rated “adequate.” A legend indicates categories from 0–9% (very light) to 90–100% (dark green). Each state contains a numeric percentage and a bracketed change from the previous week. Examples include Wisconsin at 63% [+2], Minnesota at 61% [+2], Iowa at 70% [+7], Illinois at 67% [+5], and California at 90% [0]. Eastern and Upper Midwest states generally show moderate to high adequacy, while parts of the Southeast and Rockies show lower percentages. A summary box at lower left reads “48 States: Adequate 50; Change from Last Week +2.” Data source notes USDA National Agricultural Statistics Service weekly Crop Progress reports.
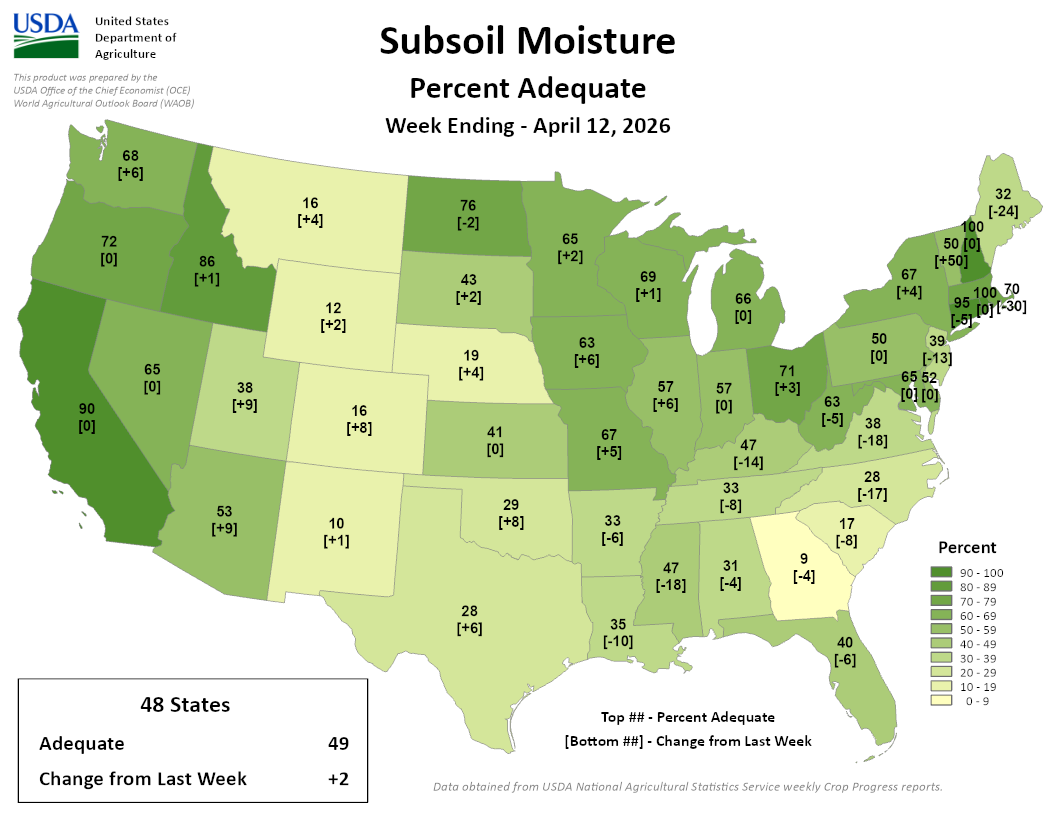
Image Description ↓
The graphic is titled “Subsoil Moisture – Percent Adequate, Week Ending April 12, 2026” and is produced by the United States Department of Agriculture. It shows a map of the contiguous United States with each state shaded from light to dark green, representing the percentage of subsoil moisture rated “adequate.” A legend indicates ranges from 0–9% (lightest shade) to 90–100% (darkest shade). Each state displays a numeric percentage and a bracketed change from the previous week. Examples include Wisconsin at 57% [0], Minnesota at 65% [+2], Iowa at 63% [+6], Illinois at 57% [0], and California at 90% [0]. Much of the Midwest shows moderate adequacy levels, while some southeastern and western states show lower percentages. A summary box at the lower left reads “48 States: Adequate 49; Change from Last Week +2.” The data source is USDA National Agricultural Statistics Service weekly Crop Progress reports.
- 55-70% of agricultural soils in the state are reported as having adequate topsoil and subsoil moisture.
- 3% of fields in the state are reported as having short to very short topsoil moisture.
Wisconet Soil Temperature
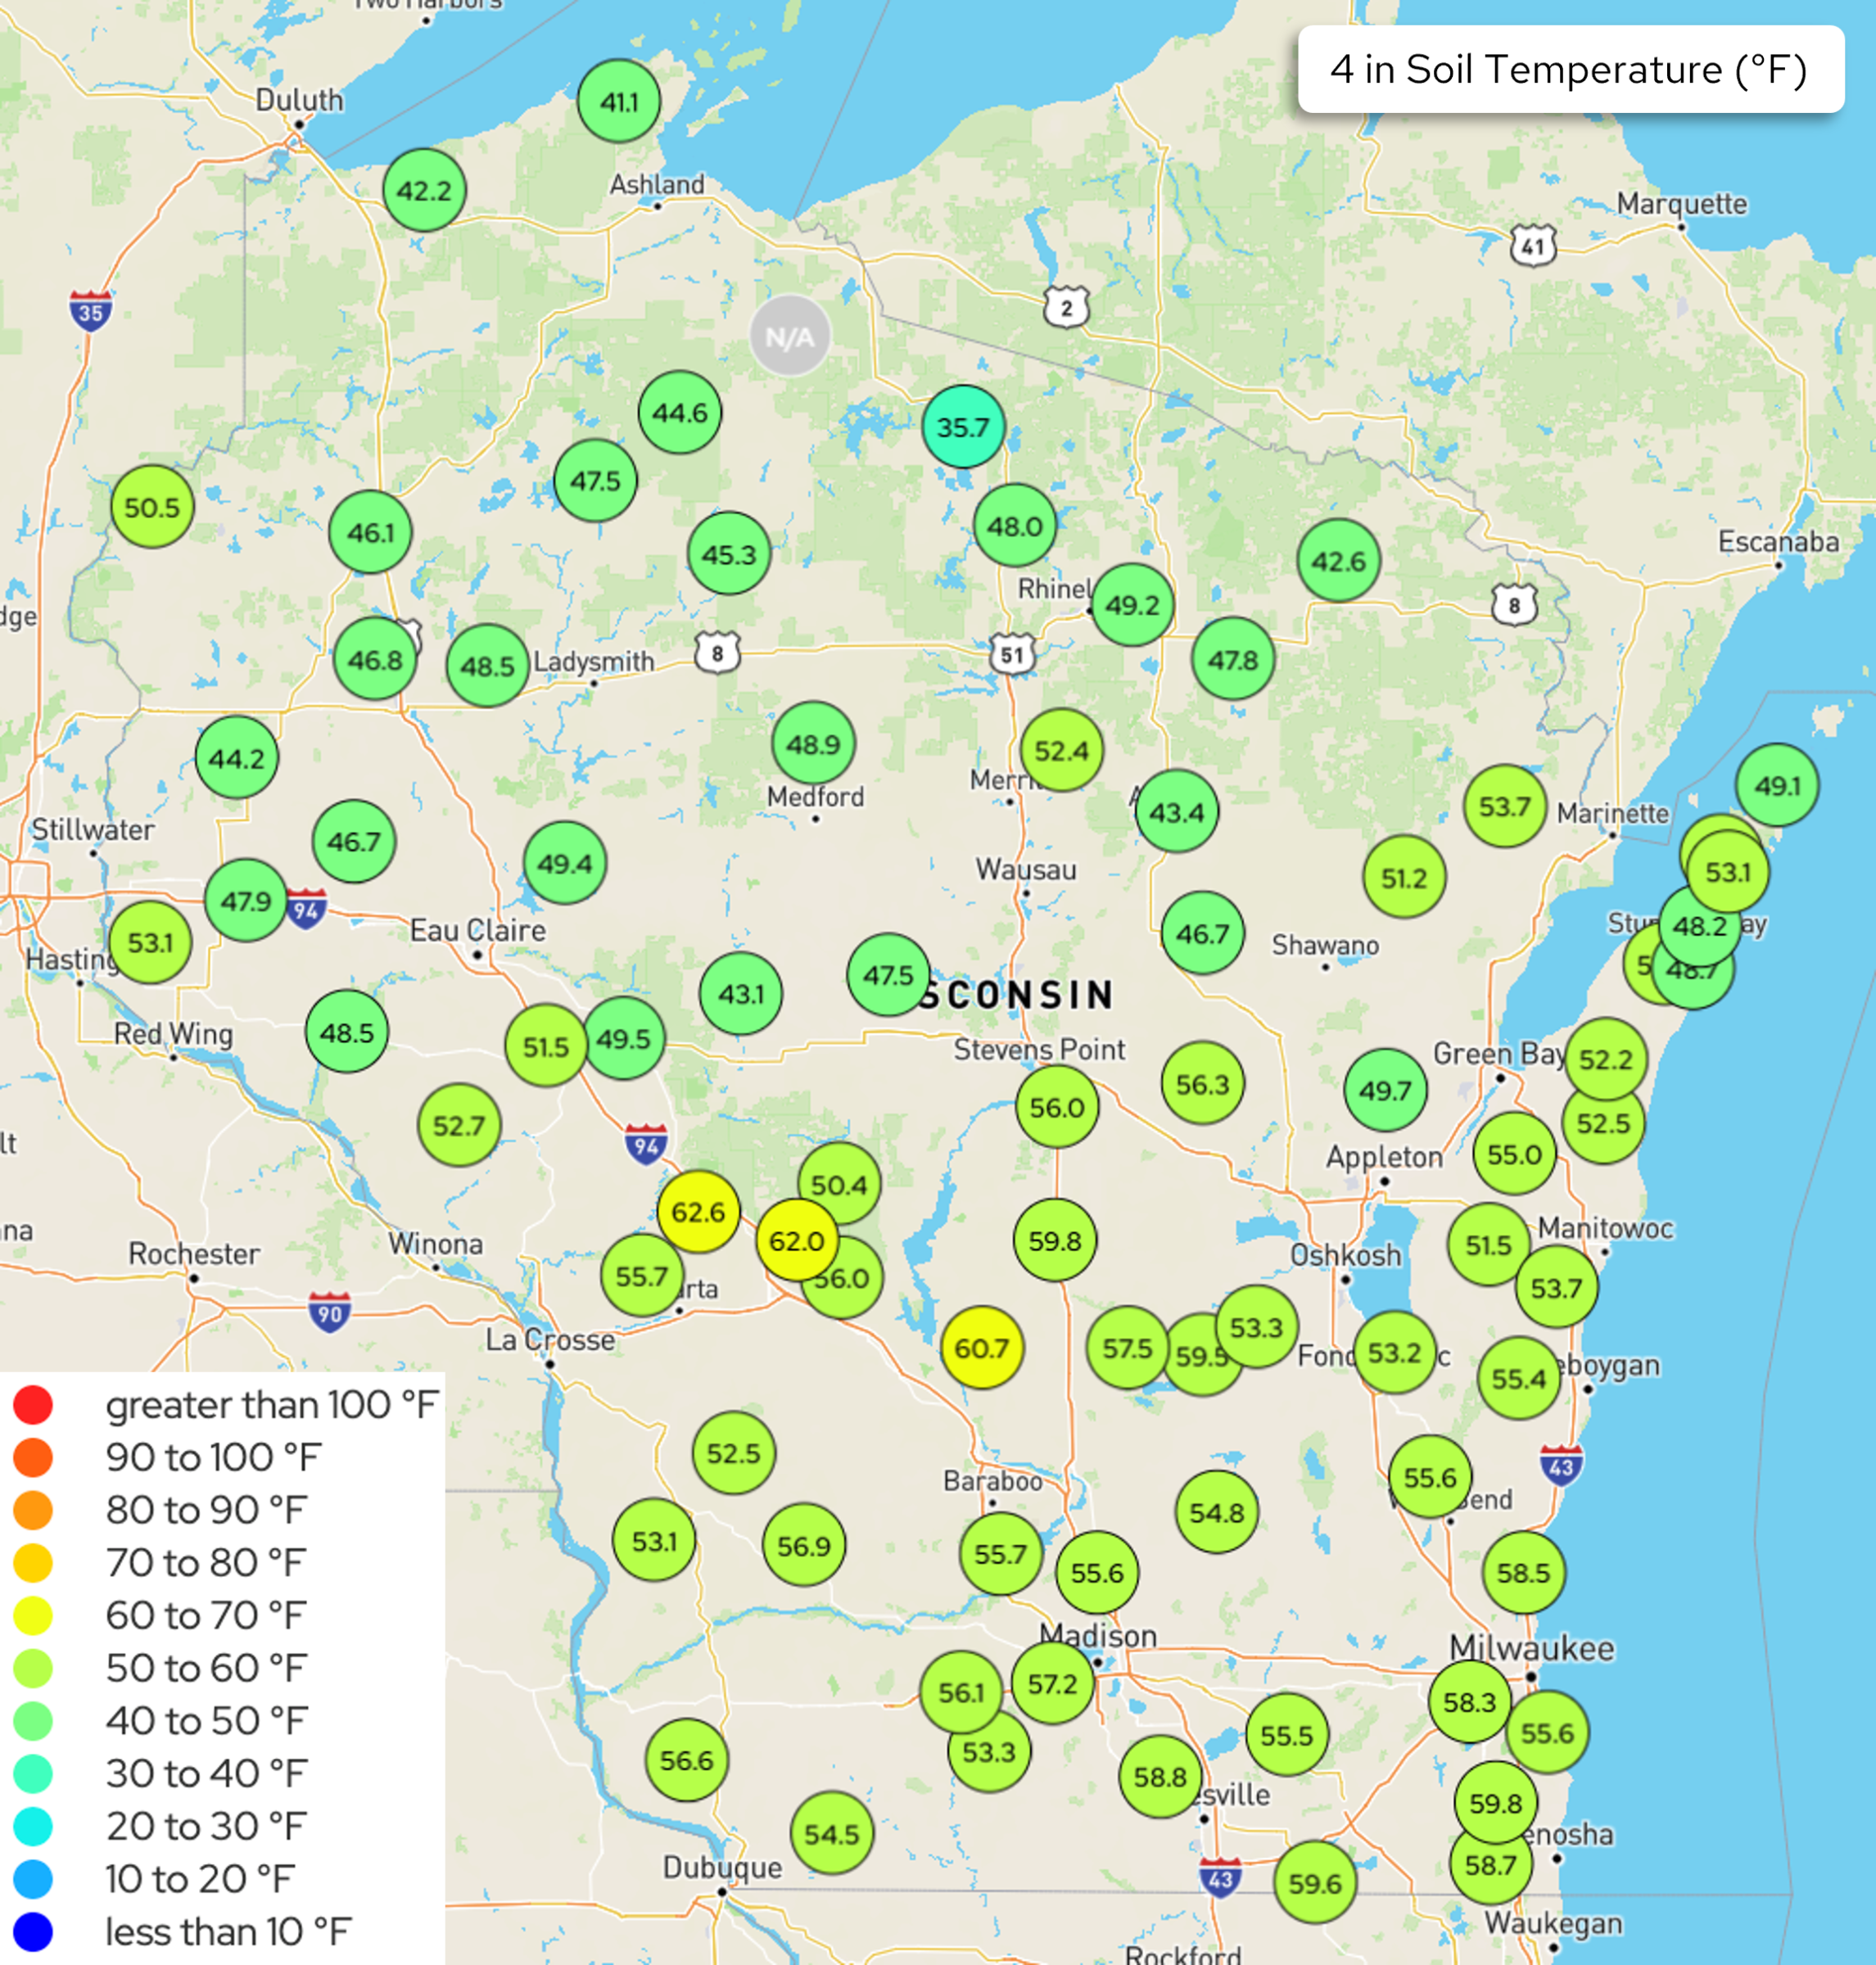
Image Description ↓
The image is a map of Wisconsin titled “4 in Soil Temperature (°F).” Circular markers are placed across the state, each labeled with a numeric soil temperature at a 4‑inch depth. Colors correspond to temperature ranges shown in a legend at the lower left, from less than 10 °F (dark blue) through 90–100 °F (red). Most stations show green to yellow‑green colors, indicating temperatures roughly between 45 and 60 °F. Southern Wisconsin, including areas near Madison, Milwaukee, and La Crosse, shows warmer readings in the mid‑50s to low‑60s °F. Northern Wisconsin stations, including near Ashland and Rhinelander, show cooler values in the low‑40s to upper‑40s °F. City labels such as Eau Claire, Green Bay, Madison, and Milwaukee are visible, along with roads and lakes for geographic context. A few stations display “N/A.”
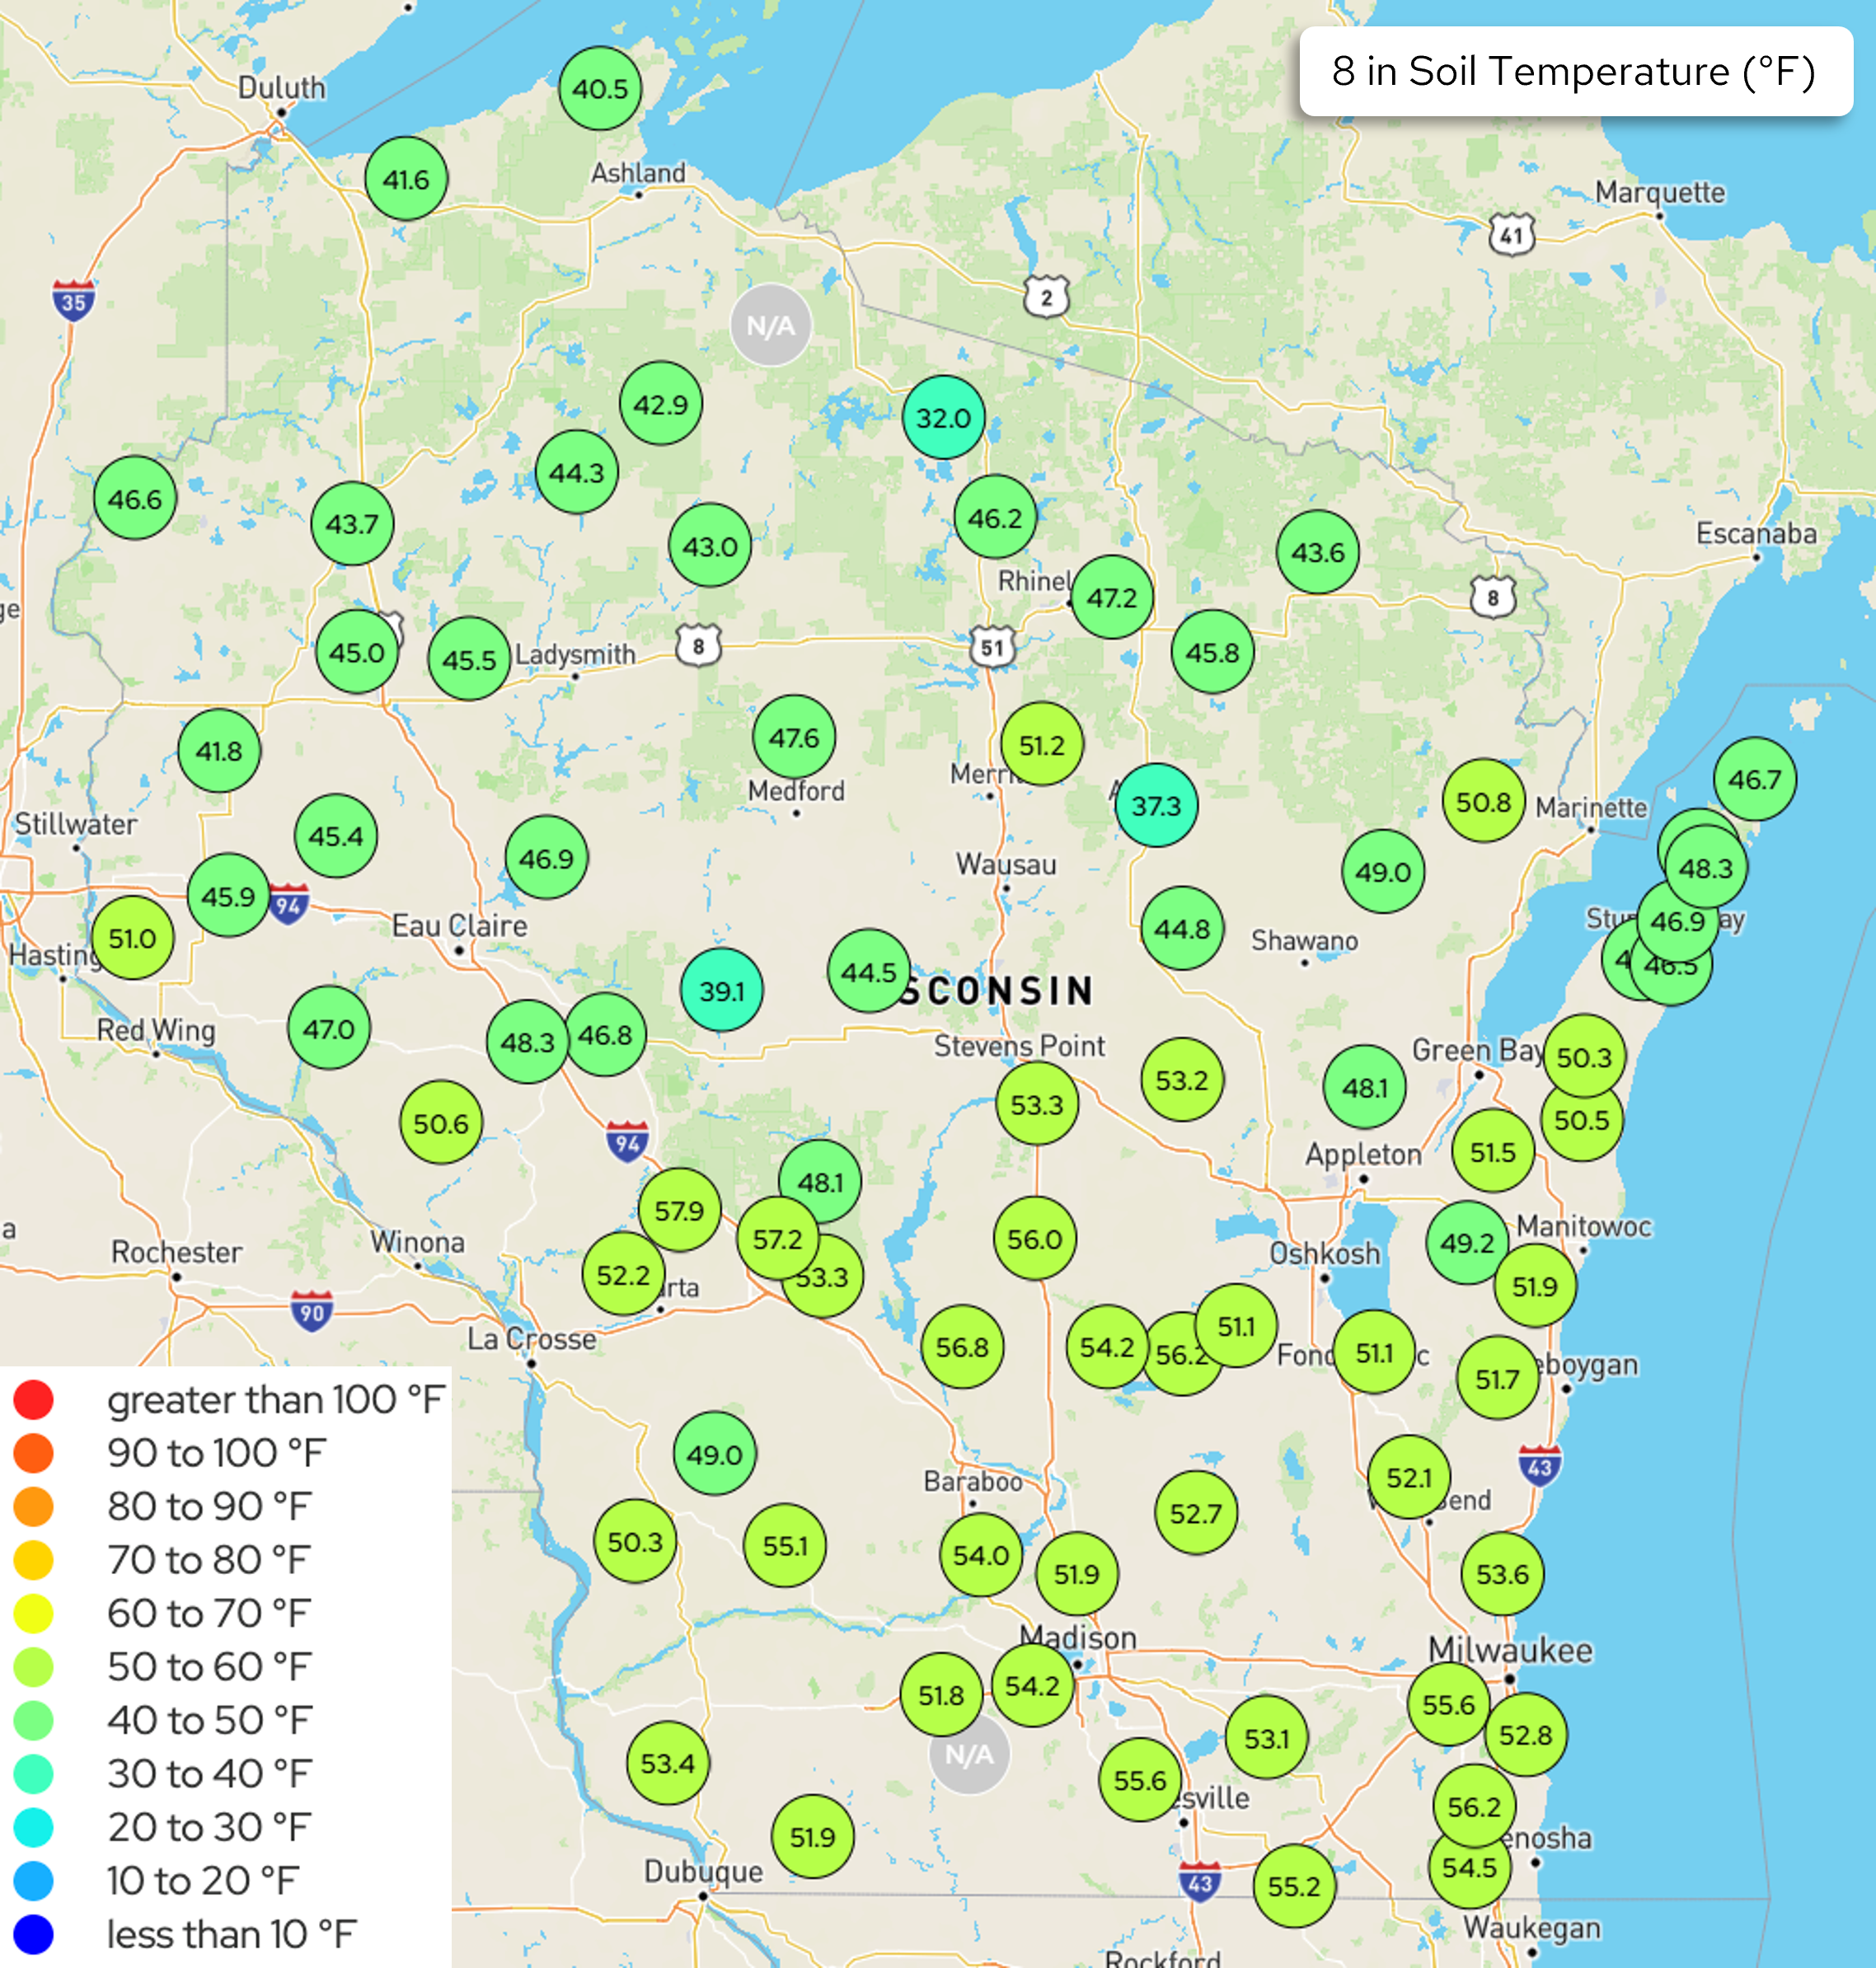
Image Description ↓
The map is titled “8 in Soil Temperature (°F).” It displays Wisconsin with city labels including Duluth, Ashland, Eau Claire, Green Bay, Madison, and Milwaukee. Circular station markers show numeric soil temperatures at an 8‑inch depth. A legend at the lower left shows temperature ranges from less than 10 °F (dark blue) to greater than 100 °F (red). Most markers are green to yellow‑green, indicating temperatures generally between about 45 and 55 °F. Northern Wisconsin stations, including near Ashland and Rhinelander, show cooler readings mostly in the low‑40s °F. Central Wisconsin ranges from low‑ to upper‑40s °F. Southern Wisconsin, including areas near Madison, Milwaukee, and La Crosse, shows warmer readings in the low‑ to mid‑50s °F. Some locations are labeled “N/A.”
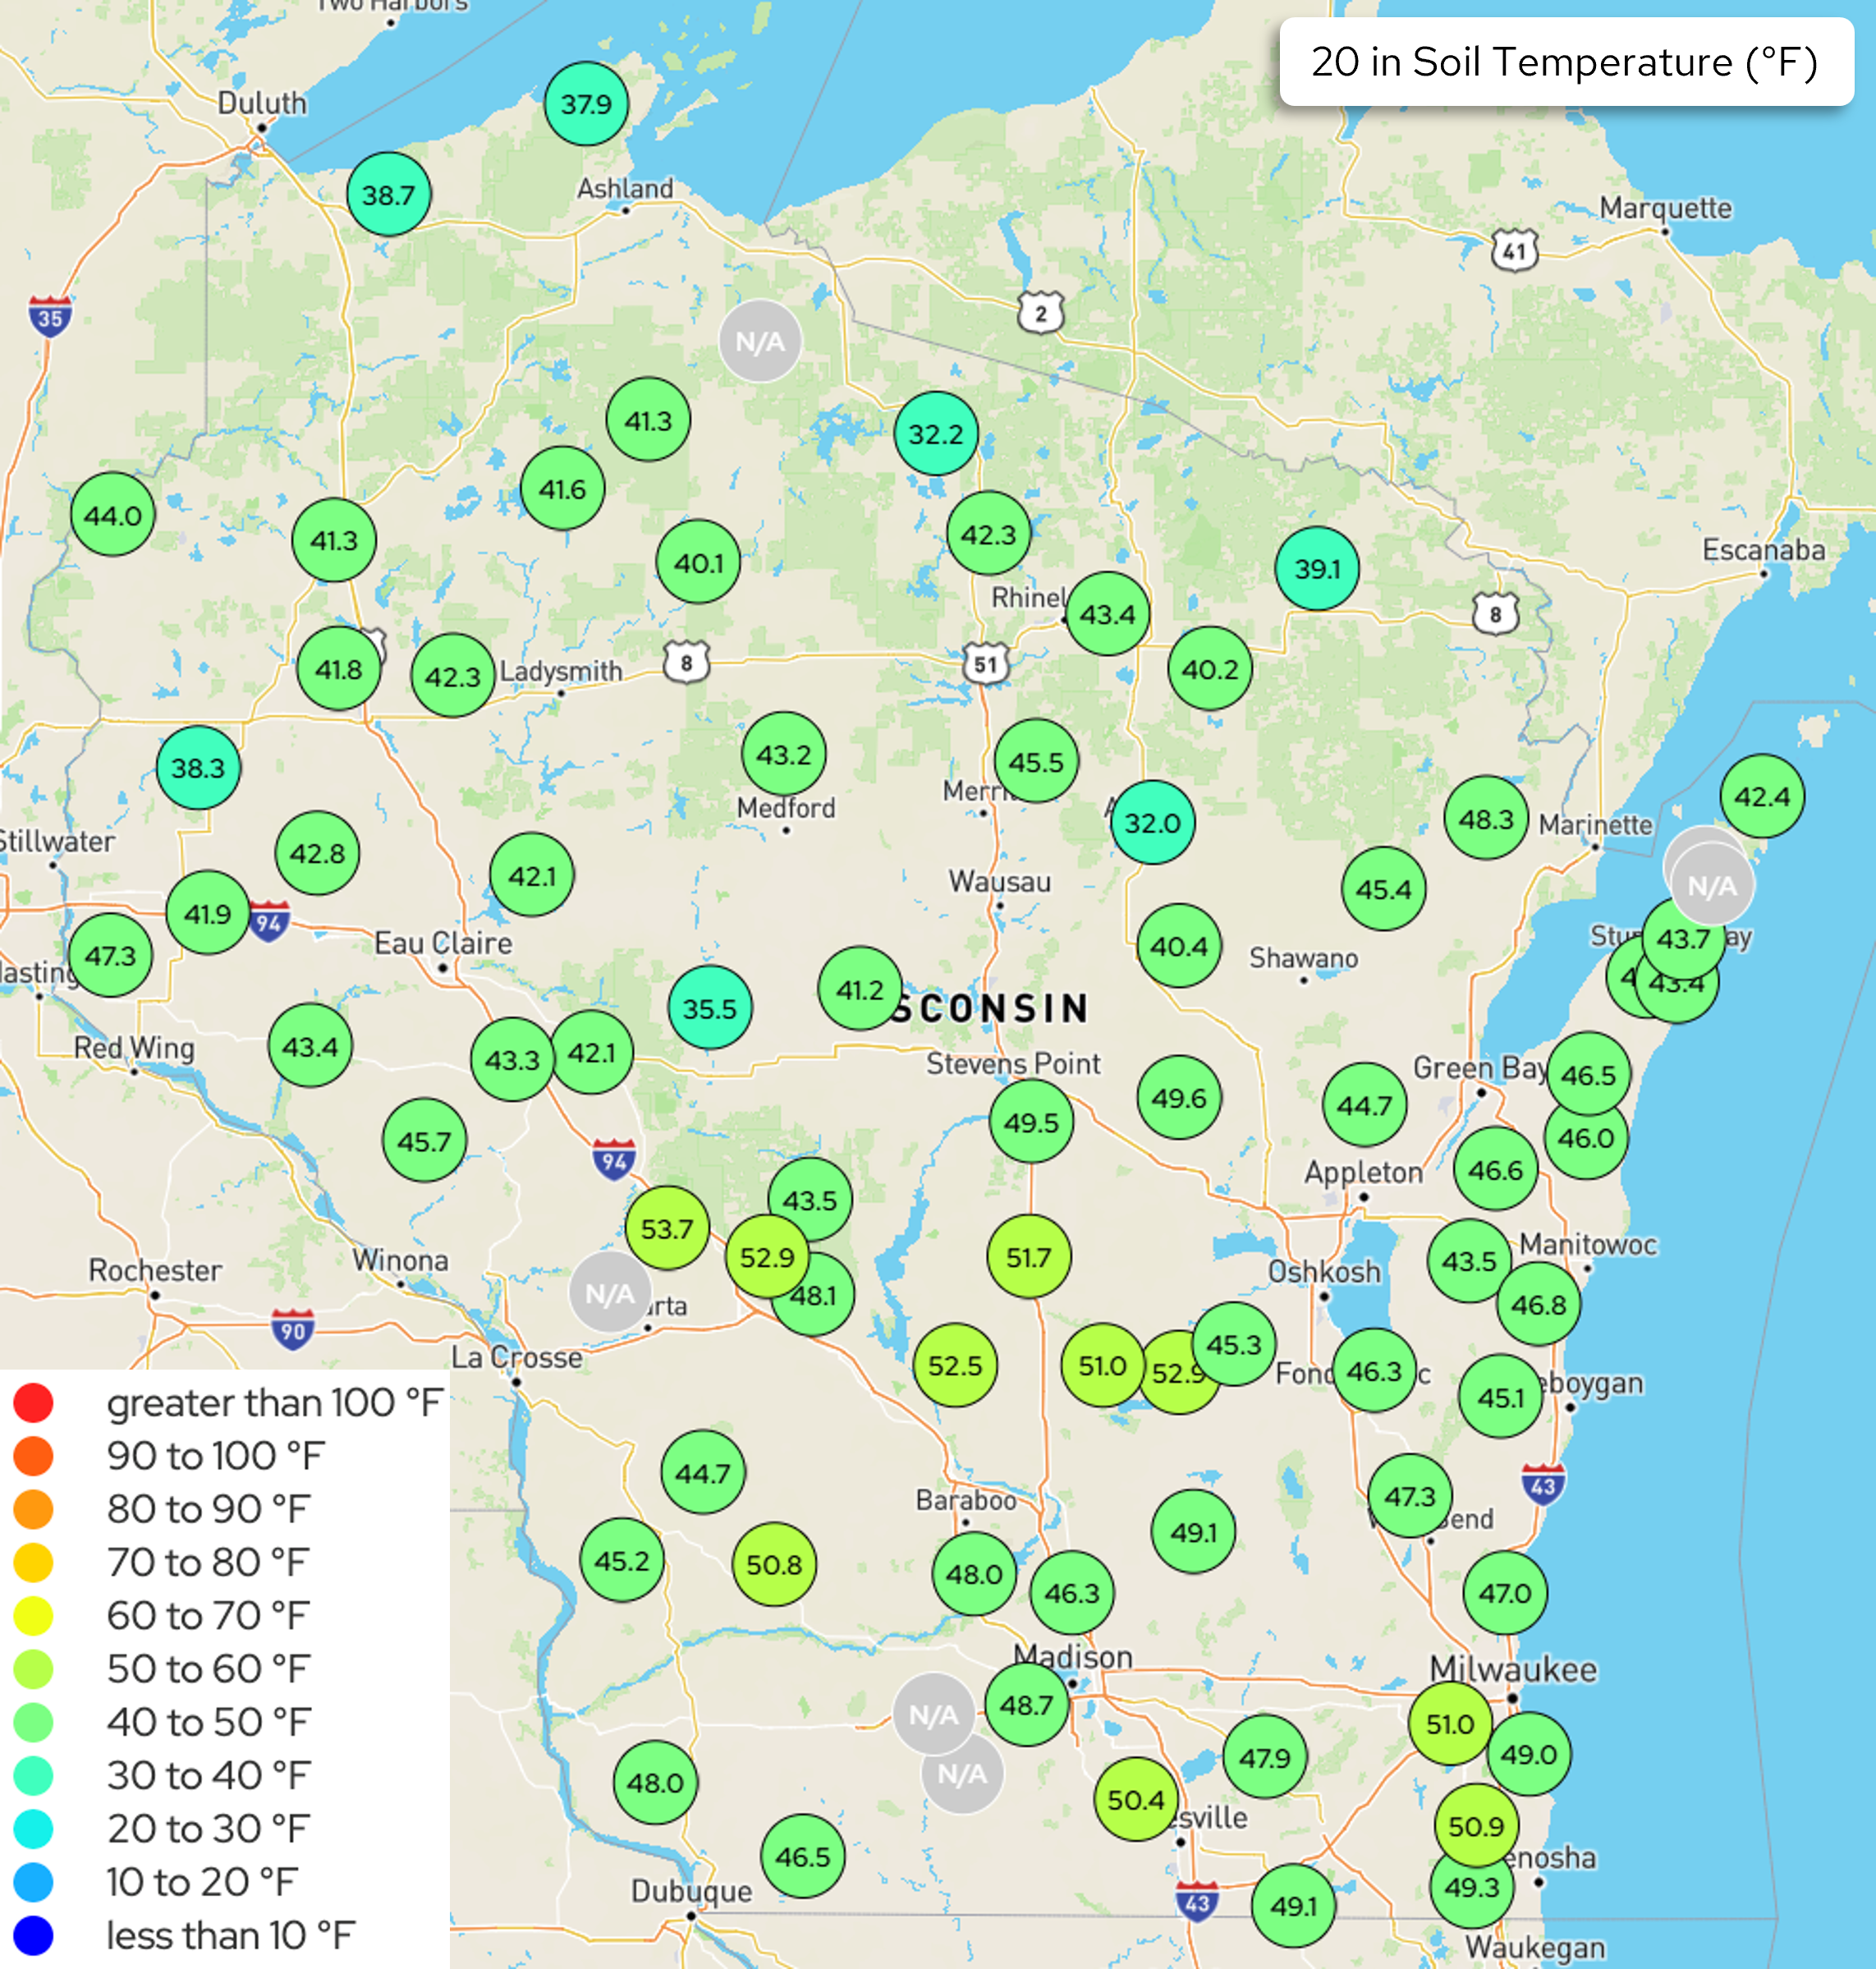
Image Description ↓
The map is titled “20 in Soil Temperature (°F).” Circular station markers show numeric soil temperature values measured at a 20‑inch depth. A legend at the lower left shows temperature categories ranging from less than 10 °F (dark blue) to greater than 100 °F (red). Most stations appear in green to light‑green shades, indicating temperatures roughly between 40 and 50 °F. Northern Wisconsin locations, including near Ashland and Rhinelander, show cooler readings mostly in the upper‑30s to low‑40s °F. Central Wisconsin ranges from the low‑40s to mid‑40s °F. Southern Wisconsin, including areas near Madison, Milwaukee, and La Crosse, shows warmer readings generally from the upper‑40s to low‑50s °F. Several locations are marked “N/A.”
- The maps show Wisconet soil temperature conditions on April 14th @ 12:00 pm.
U.S. Drought Monitor
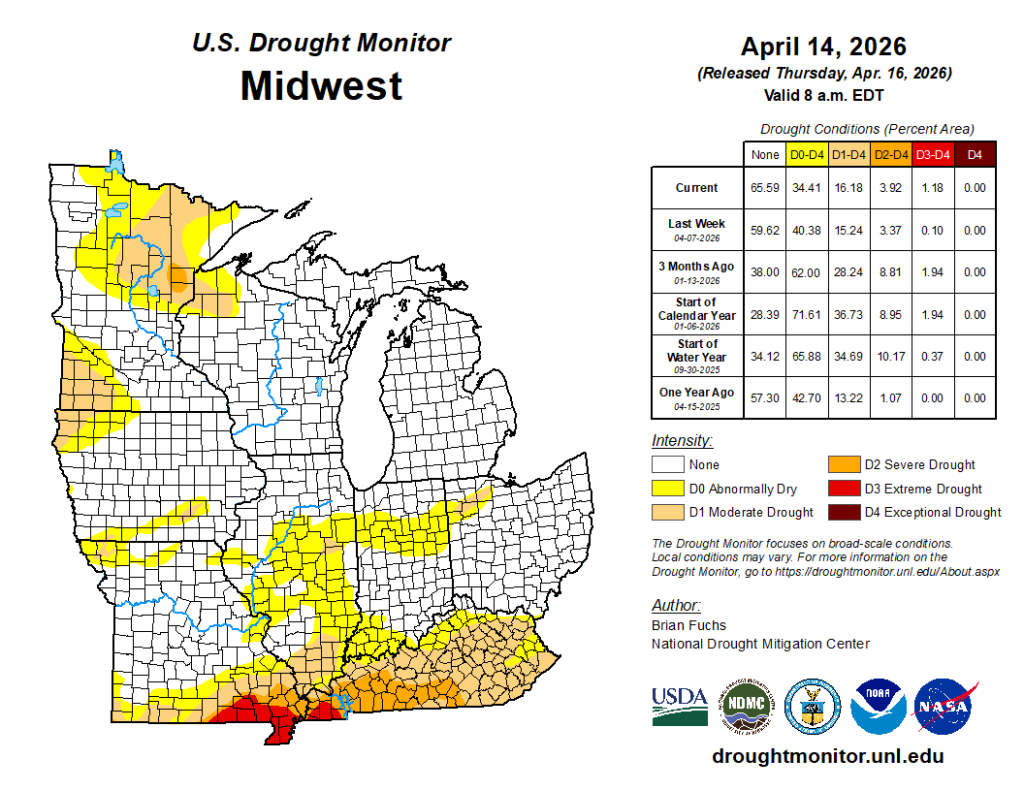
Image Description ↓
The graphic is titled “U.S. Drought Monitor – Midwest” and is dated April 14, 2026 (released April 16, valid 8 a.m. EDT). It shows a county‑level map of the Midwest with drought categories color‑coded: yellow for D0 (Abnormally Dry), tan for D1 (Moderate Drought), orange for D2 (Severe Drought), red for D3 (Extreme Drought), and dark red for D4 (Exceptional Drought). Large portions of the region show no drought, while southern areas—especially parts of Missouri, Illinois, Indiana, and Kentucky—show D1 to D3 conditions, with a small area of D3 indicated in deep red. A table on the right lists “Drought Conditions (Percent Area)” with values for current conditions and comparisons to last week, three months ago, start of calendar year, start of water year, and one year ago. USDA, NDMC, NOAA, and NASA logos appear at the bottom, with the website droughtmonitor.unl.edu.
Compared to last week:
- Drought severity improved by 1-2 classes across Iowa and neighboring states. Across the south, drought became more widespread or increased in severity. Parts of southeast Missouri and Kentucky are in D3-D4 drought. 83.8% of the Midwest region is drought free (~16.2% in D1-D4).
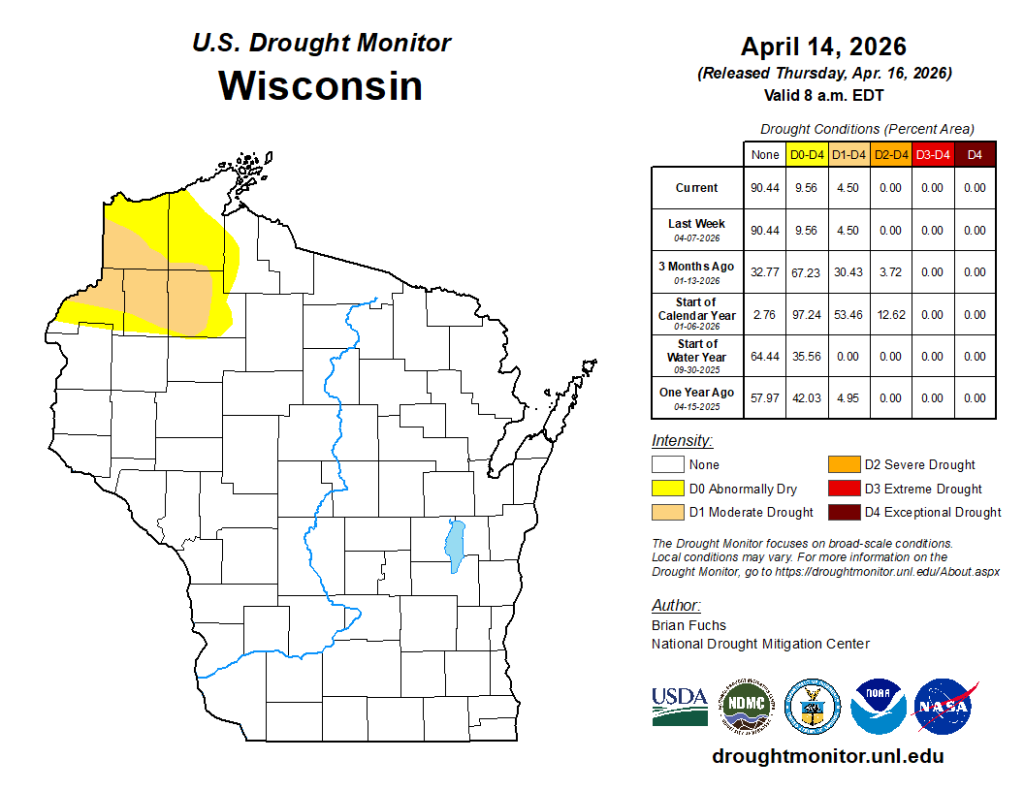
Image Description ↓
The graphic is titled “U.S. Drought Monitor – Wisconsin” and dated April 14, 2026 (released April 16; valid 8 a.m. EDT). It shows a county‑level map of Wisconsin with drought categories color‑coded: yellow for D0 (Abnormally Dry), tan for D1 (Moderate Drought), orange for D2 (Severe Drought), red for D3 (Extreme Drought), and dark red for D4 (Exceptional Drought). Most of Wisconsin appears white, indicating no drought. Northwestern Wisconsin shows patches of yellow and tan, indicating abnormally dry to moderate drought conditions. No severe, extreme, or exceptional drought areas appear in the state. Major rivers are marked in blue. A table at right labeled “Drought Conditions (Percent Area)” lists category percentages for current conditions and prior periods. Logos for USDA, NDMC, NOAA, and NASA appear at the bottom, along with the Drought Monitor website.
Wisconsin: No change from last week. Drought remains in some far northwest counties.
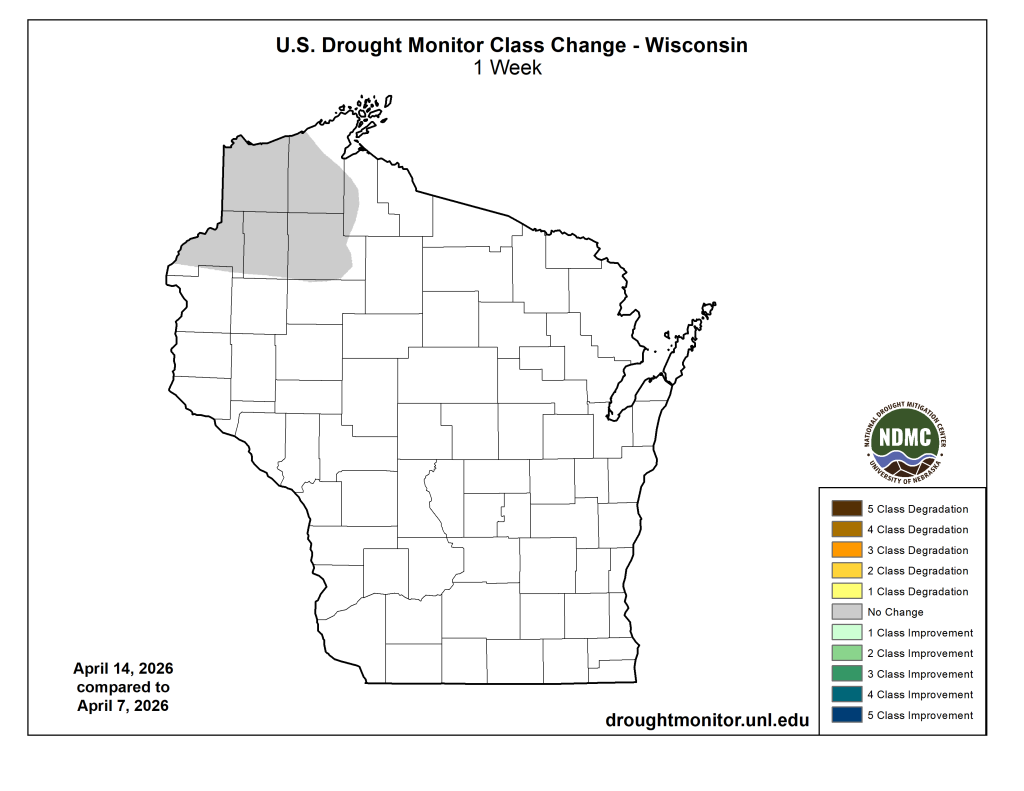
Image Description ↓
The map is titled “U.S. Drought Monitor Class Change – Wisconsin, 1 Week” and compares conditions from April 7 to April 14, 2026. It shows a county‑level outline of Wisconsin. Most counties are white, indicating no change in drought status over the past week. A small area in northwestern Wisconsin is shaded gray, indicating a 1‑class degradation in drought conditions. The legend on the right explains class changes, ranging from 5‑class degradation (brown) through no change (white) to 5‑class improvement (dark blue). The National Drought Mitigation Center (NDMC) logo appears on the right, and the website droughtmonitor.unl.edu is listed at the bottom. No areas show improvement or multi‑class changes.
No change since last week.
U.S. Drought Monitor Time Series
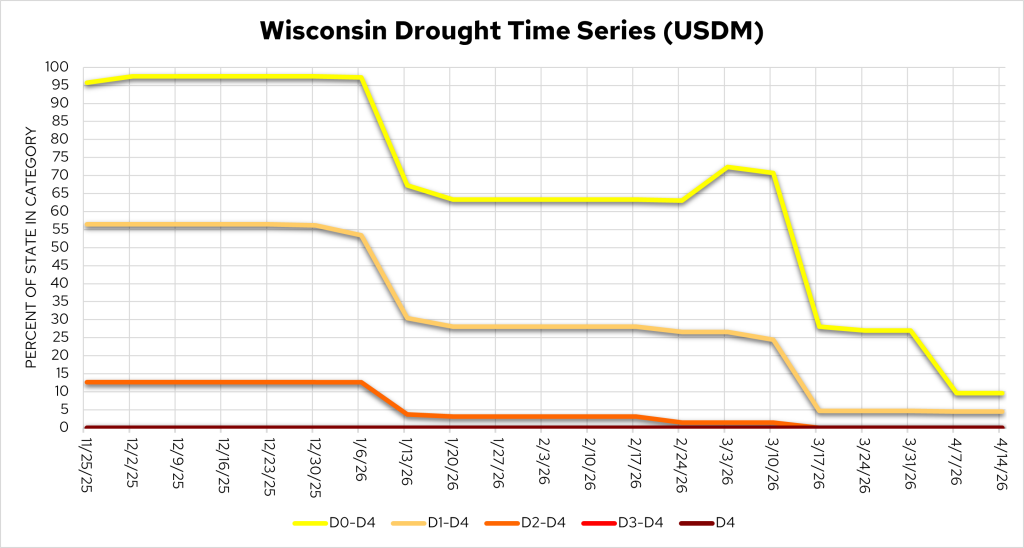
Image Description ↓
The graphic titles read “Wisconsin Drought Time Series (USDM).” Two identical charts are shown. The horizontal axis lists weekly dates from November 25, 2025, through April 14, 2026. The vertical axis shows percent of Wisconsin in each drought category (0–100%). Lines represent drought categories: D0–D4 (yellow), D1–D4 (light orange), D2–D4 (orange), D3–D4 (red), and D4 (dark red).
From late November through early January, about 95–100% of Wisconsin is classified as D0 or worse, about 55% as D1 or worse, and around 12–14% as D2 or worse. In mid‑January, all categories show sharp declines. By late January through February, D0–D4 stabilizes near 60–65%, and D1–D4 near 25–30%, with minimal D2 or worse. In mid‑March, another sharp drop occurs. By April 14, 2026, D0–D4 is near 10–12%, D1–D4 near 5%, and D2–D4 and higher categories are near zero.
- Less than 10% of the state is abnormally dry or is in moderate drought.
Temperature Trends
7 Day Temperatures
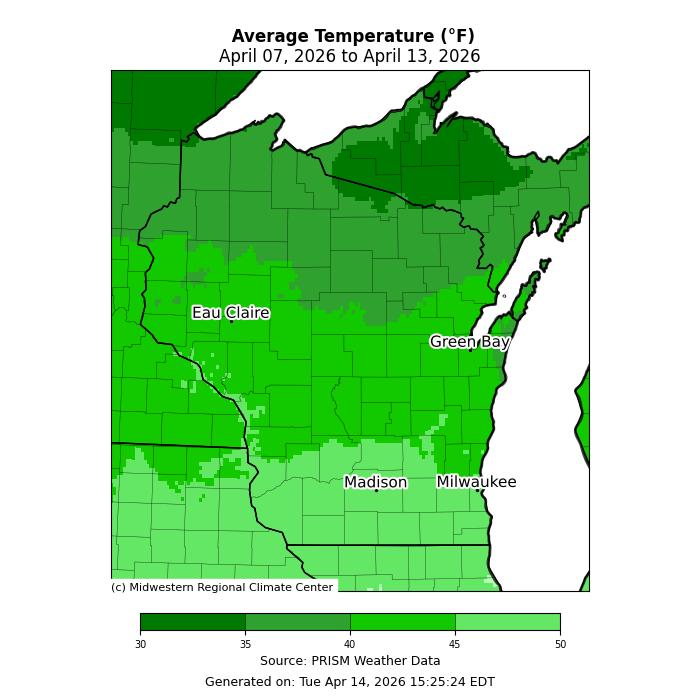
Image Description ↓
The map is titled “Average Temperature (°F), April 07, 2026 to April 13, 2026.” It shows Wisconsin shaded by average temperature, with a color scale from 30 to 50 °F. Darker green shades in northern Wisconsin indicate cooler averages near 30–35 °F. Central Wisconsin appears medium green, around 38–42 °F. Southern Wisconsin is lighter green, indicating warmer averages near 45–50 °F. A legend bar at the bottom shows temperature intervals, and text indicates the source as PRISM Weather Data, generated April 14, 2026 by the Midwestern Regional Climate Center.
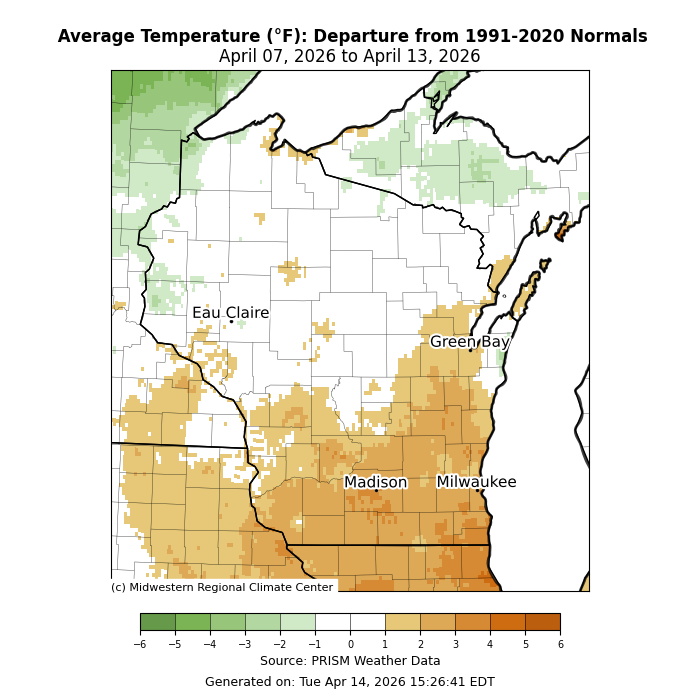
Image Description ↓
The map is titled “Average Temperature (°F): Departure from 1991–2020 Normals, April 07, 2026 to April 13, 2026.” It shows Wisconsin shaded by temperature departure from normal, using a color scale from about −6 °F (green) to +6 °F (brown). Northern Wisconsin appears mostly light to medium green, indicating cooler-than-normal conditions of roughly 2–5 °F below normal. Central Wisconsin is largely near white, indicating near‑normal temperatures. Southern and southeastern Wisconsin, including areas around Madison and Milwaukee, are shaded tan to light brown, indicating warmer-than-normal conditions of about 2–5 °F above normal. A legend at the bottom shows the numeric departure ranges. The source is PRISM Weather Data, generated April 14, 2026 by the Midwestern Regional Climate Center.
- Average temperatures ranged from 45-50°F in the southern counties to 35-40°F in the northern counties.
- Temperatures were 2-4°F above normal across southern Wisconsin. Further to the north, temperatures were commonly within 1°F of normal.
- Highest Wisconet temperature recorded last week: Grantsburg, Burnett County (80.8°F).
- Lowest Wisconet temperature recorded last week: Knight, Iron County (0.7°F).
30 Day Temperatures
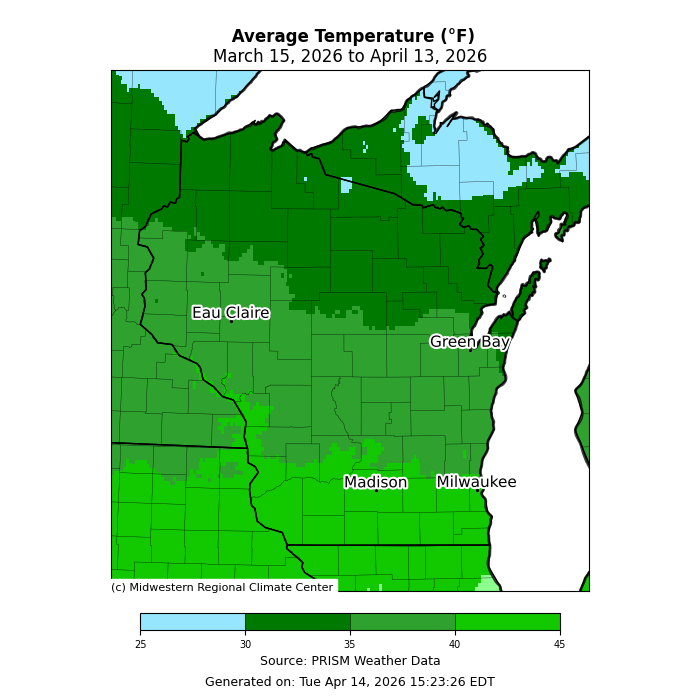
Image Description ↓
The map is titled “Average Temperature (°F), March 15, 2026 to April 13, 2026.” It shows Wisconsin shaded by 30‑day average temperature. A color scale at the bottom ranges from about 25 °F (light blue) to 45 °F (bright green). Northern Wisconsin, especially near Lake Superior, appears in darker green to blue‑green shades, indicating cooler averages around 30–35 °F. Central Wisconsin is medium green, around 35–40 °F. Southern Wisconsin, including areas near Madison and Milwaukee, is brighter green, indicating warmer averages near 40–45 °F. The source is PRISM Weather Data, with generation noted as April 14, 2026 by the Midwestern Regional Climate Center.
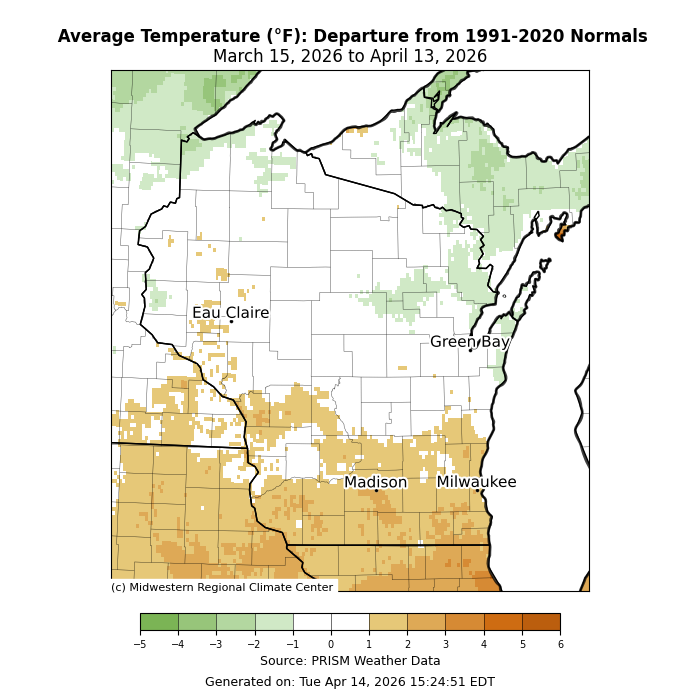
Image Description ↓
The map is titled “Average Temperature (°F): Departure from 1991–2020 Normals, March 15, 2026 to April 13, 2026.” It shows Wisconsin shaded by temperature departure from the 1991–2020 average, with a color scale ranging from −5 °F (green) to +6 °F (brown). Northern Wisconsin appears mostly light green, indicating temperatures about 1–4 °F below normal. Central Wisconsin is largely white to light tan, indicating near-normal to slightly above-normal temperatures. Southern and southeastern Wisconsin, including areas around Madison and Milwaukee, are shaded tan to brown, indicating warmer-than-normal conditions of roughly 2–5 °F above normal. The legend bar at the bottom shows numeric departure categories. The source is PRISM Weather Data, generated April 14, 2026 by the Midwestern Regional Climate Center.
Last Spring Freeze
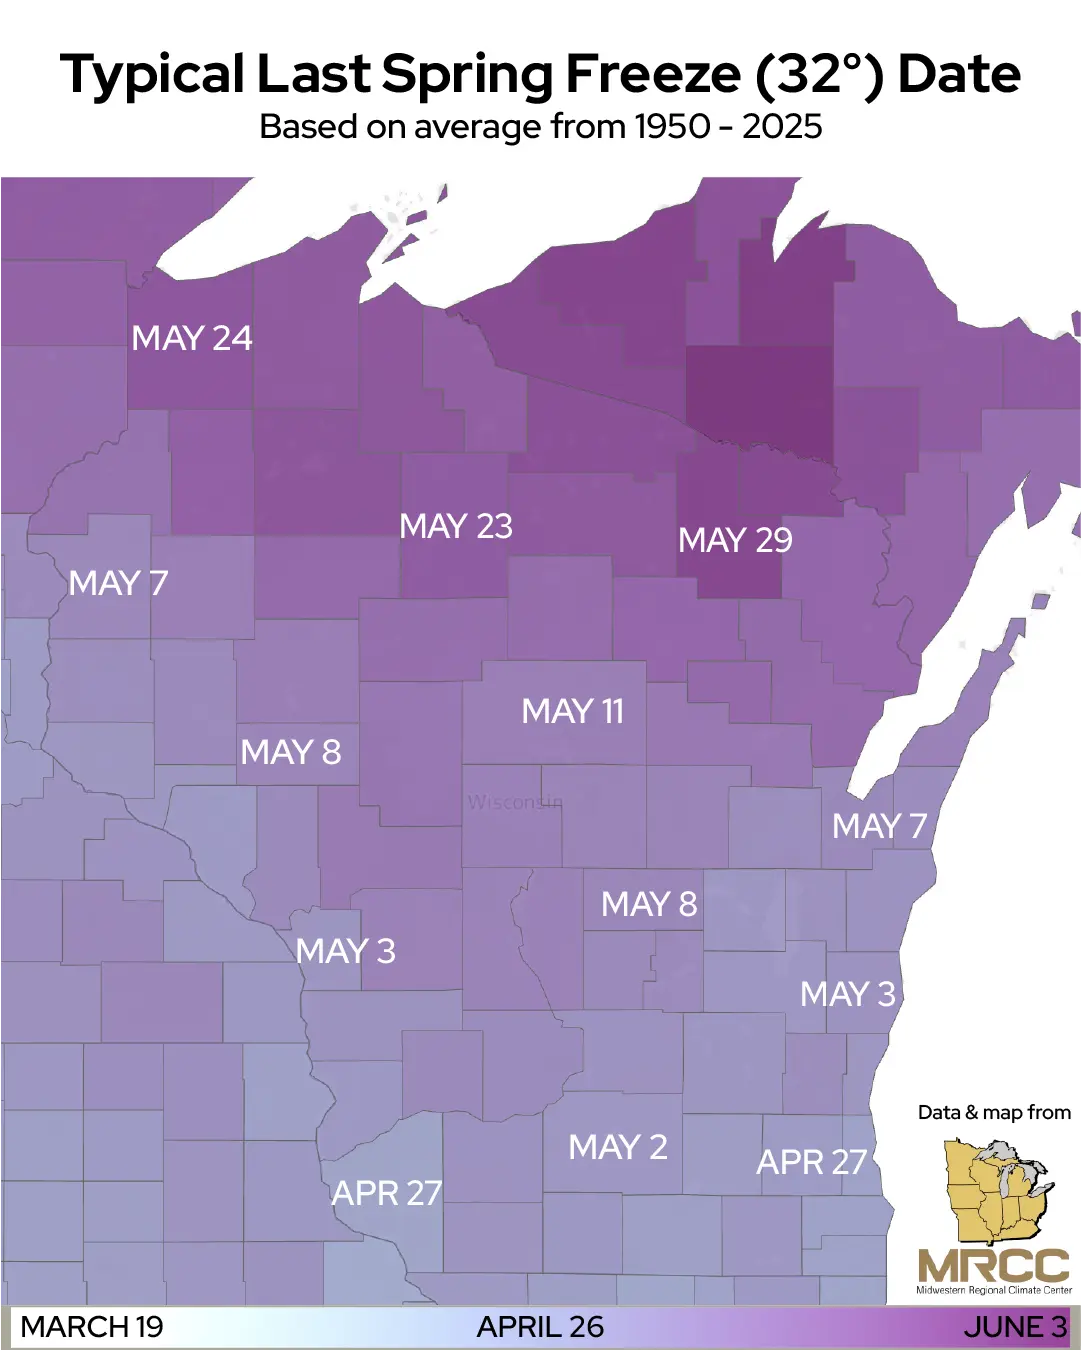
Image Description ↓
The map is titled “Typical Last Spring Freeze (32°) Date” with a subtitle stating it is based on averages from 1950–2025. It shows Wisconsin divided by counties, shaded in a purple gradient indicating the average date of the last 32°F spring freeze. Dates are labeled across the state. Southern Wisconsin shows earlier last freeze dates, mainly late April (for example, April 26–27 and May 2–3). Central Wisconsin shows early to mid‑May dates, such as May 7, May 8, and May 11. Northern Wisconsin, including areas near Lake Superior, shows later dates from mid‑ to late May, including May 23, May 24, and May 29. A color bar at the bottom indicates a progression from March 19 on the early end to June 3 on the late end. The Midwestern Regional Climate Center (MRCC) logo and a small Wisconsin locator map appear at the lower right.
- To explore data on when the last spring freeze typically occurs in your county, please check out the interactive MRCC Freeze Date Tool.
Crop Progress and Condition
Crop Progress Report for Wisconsin for the Week Ending on April 12th
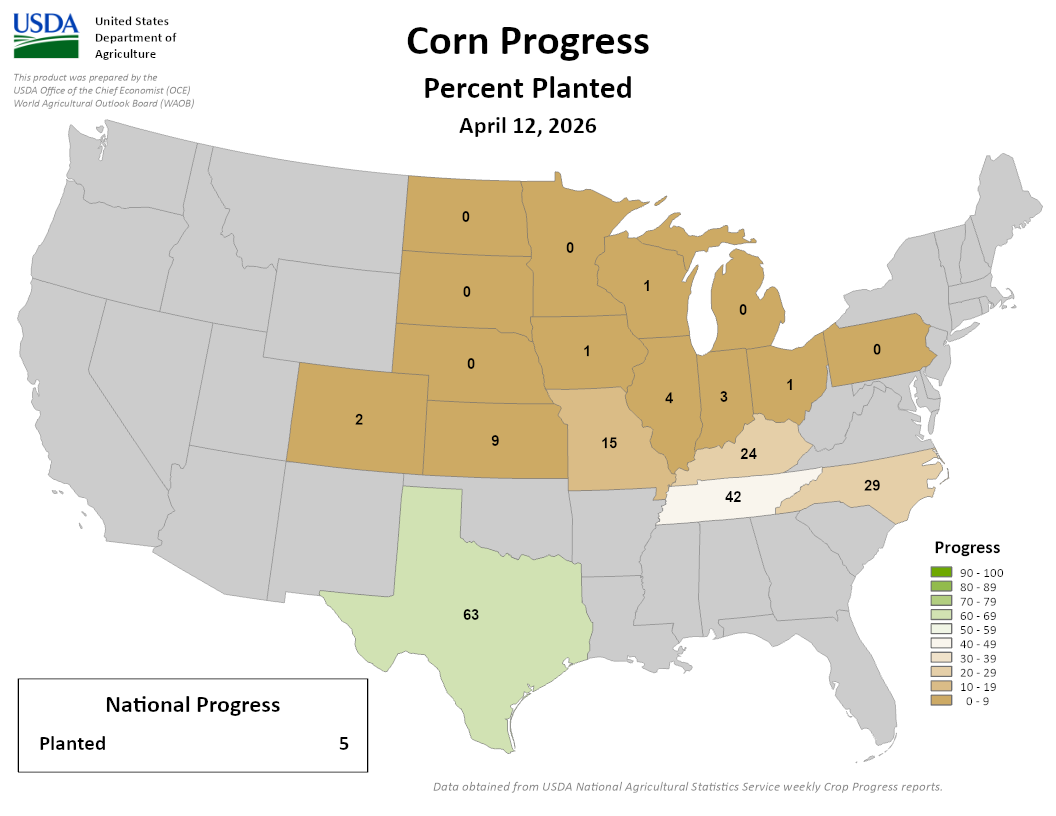
Image Description ↓
The image is titled “Corn Progress – Percent Planted, April 12, 2026” and is produced by the U.S. Department of Agriculture. It shows a U.S. map with states shaded by the percentage of corn planted. A legend on the right shows ranges from 0–9% (tan) up to 90–100% (dark green). Numeric percentages are printed inside many states. Texas is shaded light green and labeled 63%, indicating the highest planting progress. Tennessee shows 42%, Kentucky 24%, Missouri 15%, and Kansas 9%. Several Midwest and Northern Plains states, including Minnesota, North Dakota, South Dakota, and Michigan, show 0–1% planted. Wisconsin appears in the lowest category (0%). A box at lower left reads “National Progress: Planted 5.” Gray states indicate limited or no data or minimal planting. Small text at the bottom notes data are from USDA National Agricultural Statistics Service weekly Crop Progress reports.
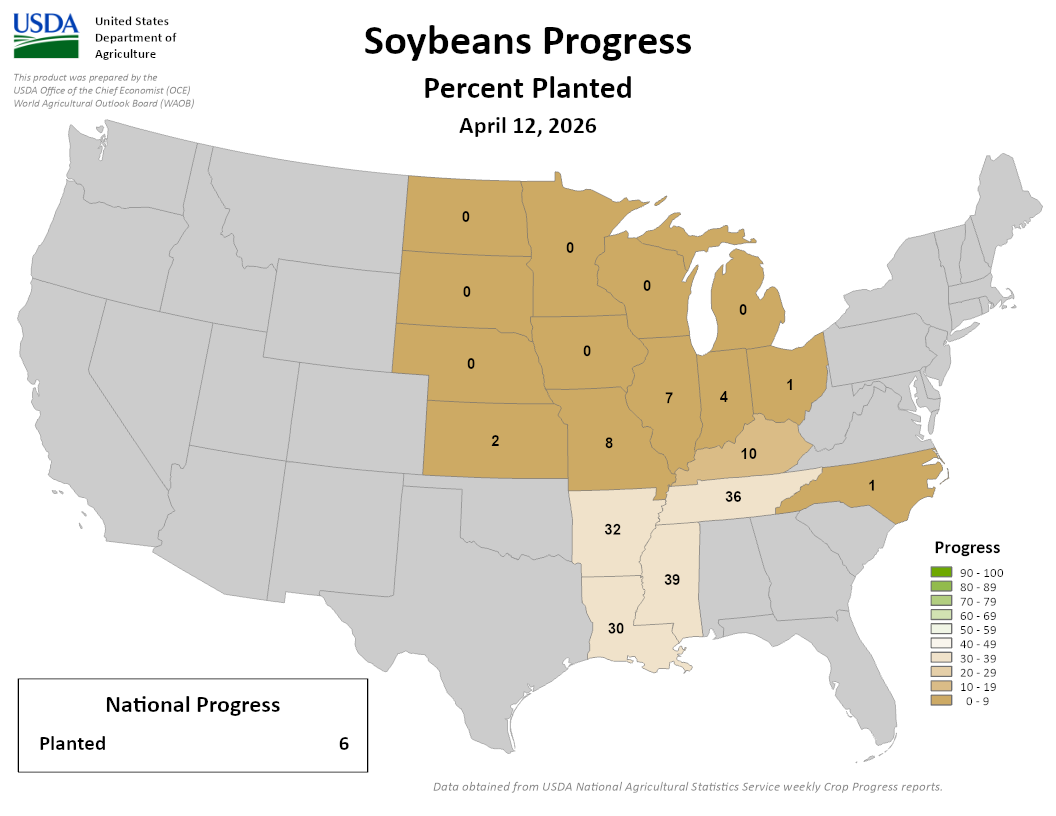
Image Description ↓
The image is titled “Soybeans Progress – Percent Planted, April 12, 2026” and is produced by the United States Department of Agriculture. It shows a U.S. map with states shaded by soybean planting progress. A legend on the right indicates percentage ranges from 0–9% (tan) to 90–100% (dark green). Numeric percentages appear inside many states. Southern states show the most progress: Louisiana is labeled 39%, Arkansas 32%, Mississippi 30%, and Tennessee 36%. Kentucky shows 10%, Missouri 8%, and Illinois 7%. Several Midwest and Northern Plains states, including Wisconsin, Minnesota, North Dakota, South Dakota, Michigan, and Ohio, show 0–1% planted or are in the lowest category. A box at the lower left reads “National Progress: Planted 6.” Gray states indicate little or no reported progress. Small text at the bottom cites USDA National Agricultural Statistics Service weekly Crop Progress reports.
- Corn planting was 1 percent complete.
- Oat planting was 4 percent complete.
- Pasture and range are rated 38 percent good to excellent, up 3 percentage points from last week.
- Winter wheat is rated 48 percent good to excellent, down 3 percentage points from last week.
- Read the full USDA report
Forecasts and Outlooks
7 Day Precipitation Forecast
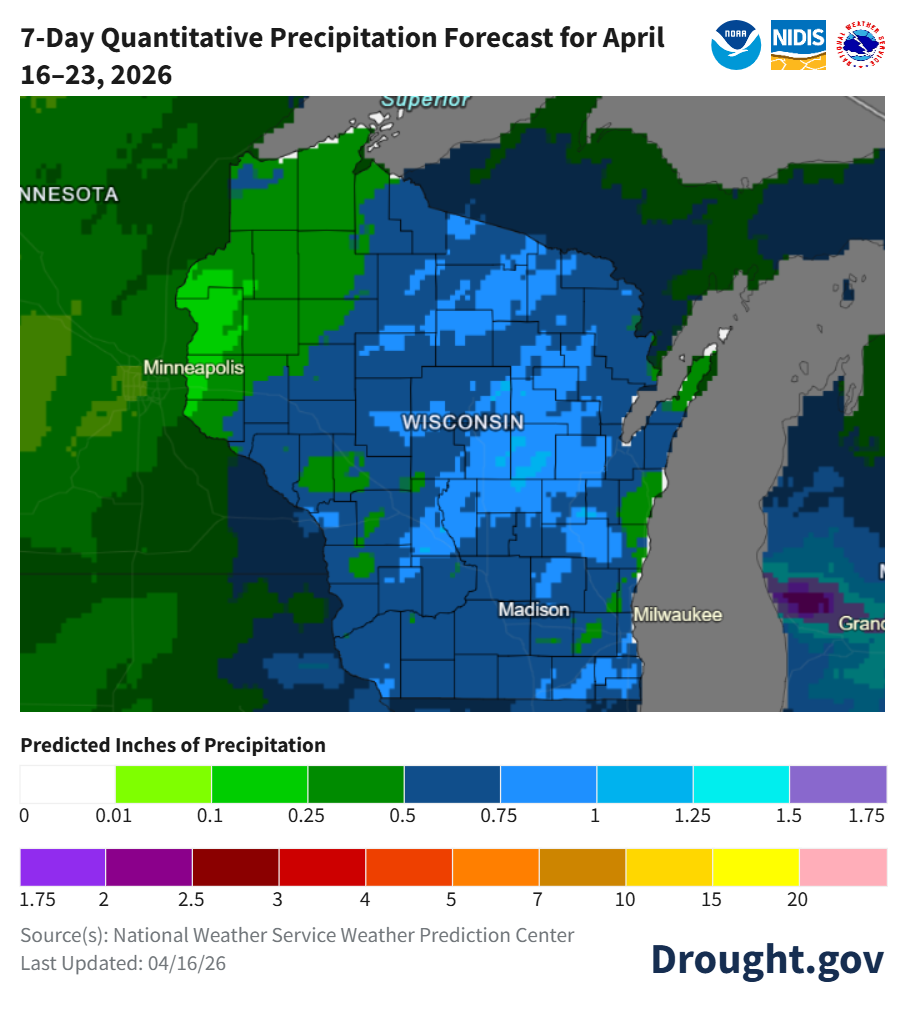
Image Description ↓
The map is titled “7‑Day Quantitative Precipitation Forecast for April 16–23, 2026” and covers Wisconsin and nearby states. County‑level shading shows predicted inches of precipitation. Most of Wisconsin appears in dark to medium blue shades, indicating forecast totals of approximately 0.75 to 1.25 inches. Lighter blue and green patches in central and eastern Wisconsin suggest locally higher amounts approaching 1.25 inches, while far western areas show some green shading indicating lower totals near 0.25–0.5 inches. A color legend at the bottom labeled “Predicted Inches of Precipitation” ranges from 0 to over 2 inches. Logos for NOAA, NIDIS, National Weather Service, and Drought.gov appear at the top and bottom. The map notes the source as the National Weather Service Weather Prediction Center and was last updated April 16, 2026.
- When? – best chances for precipitation are on Friday afternoon (4/17) through Saturday morning (4/18).
- Where? – highest precipitation totals are predicted for the central and north-central counties.
- Check your local forecast for details on totals and timing.
- Average precip (1991-2020) for this week: 0.78”.
8-14 Day Temperature and Precipitation Outlook
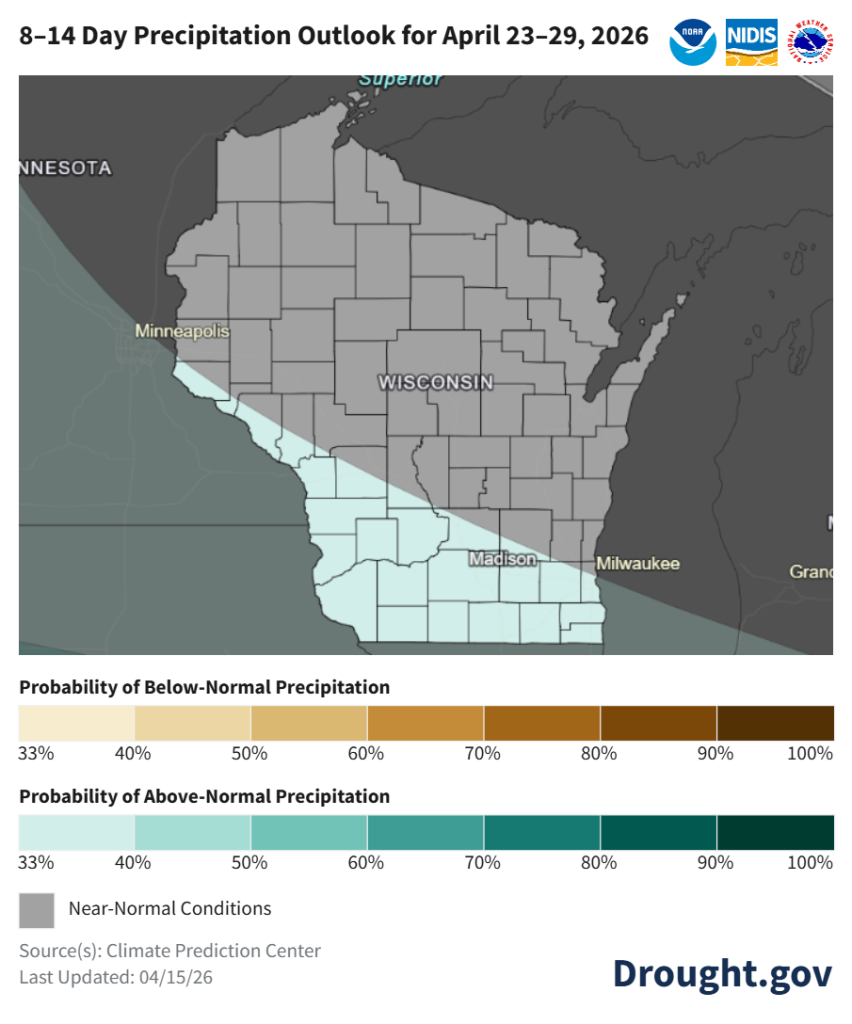
Image Description ↓
The map is titled “8–14 Day Precipitation Outlook for April 23–29, 2026.” It displays Wisconsin with county outlines. Most of the state is shaded gray, indicating near‑normal precipitation. A light teal swath runs from southwestern to southeastern Wisconsin, including areas near Madison and Milwaukee, indicating an increased probability of above‑normal precipitation (about 40–60%). No areas are shaded for below‑normal precipitation. Legends below show probability ranges for below‑normal (tan/brown) and above‑normal (teal/green) precipitation, each from 33% to 100%, plus a gray legend for near‑normal conditions. Logos for NOAA, NIDIS, and Drought.gov appear, with the source listed as the Climate Prediction Center and last updated April 15, 2026.
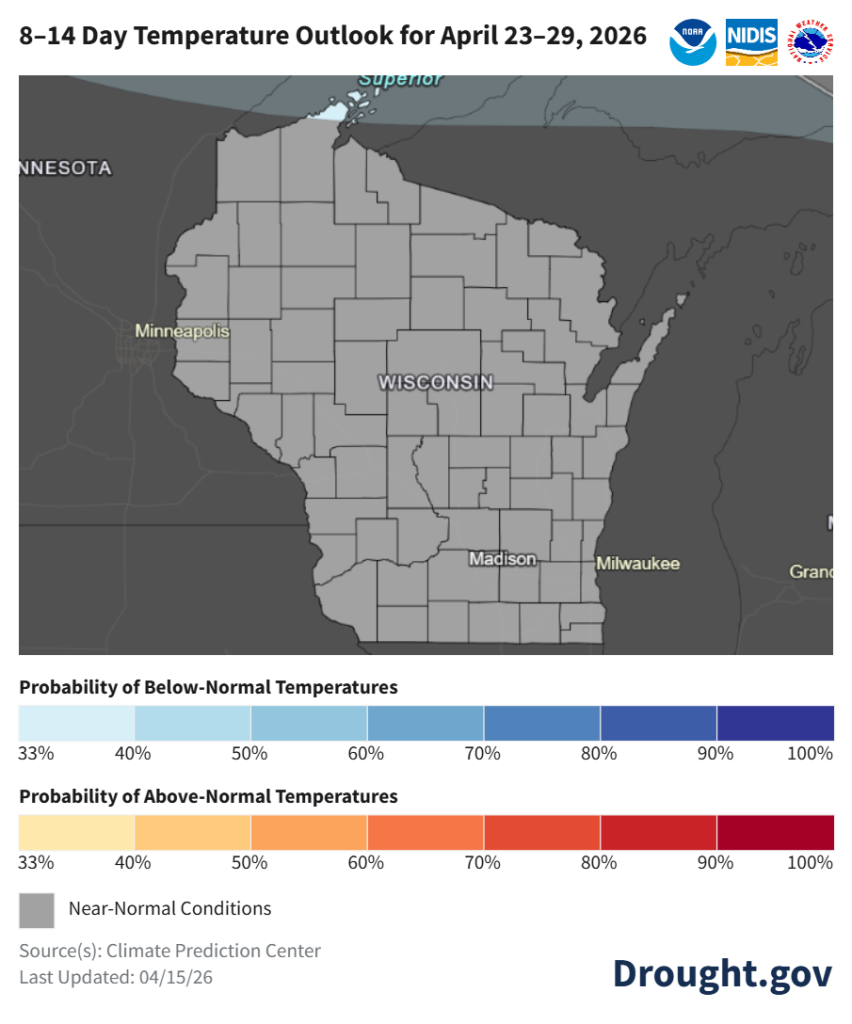
Image Description ↓
The map is titled “8–14 Day Temperature Outlook for April 23–29, 2026.” The entire state is shaded gray, indicating near‑normal temperature conditions are favored across Wisconsin during the forecast period. No areas are shaded in blue (below‑normal temperatures) or red/orange (above‑normal temperatures). Legends below the map show probability ranges for below‑normal temperatures (blue shades, 33–100%) and above‑normal temperatures (orange to red shades, 33–100%), along with gray for near‑normal conditions. Logos for NOAA, NIDIS, and Drought.gov appear on the map. The data source is the Climate Prediction Center, with the map last updated April 15, 2026.
- Late April: temperature probabilities are leaning towards near normal statewide, with precipitation leaning towards near normal for most of Wisconsin. Southern and far western counties are leaning toward above normal precipitation (33-40% odds).
- Statewide normals (1991-2020) for April 23-29 are 47.5°F and 0.82”.
30 Day Temperature and Precipitation Outlook
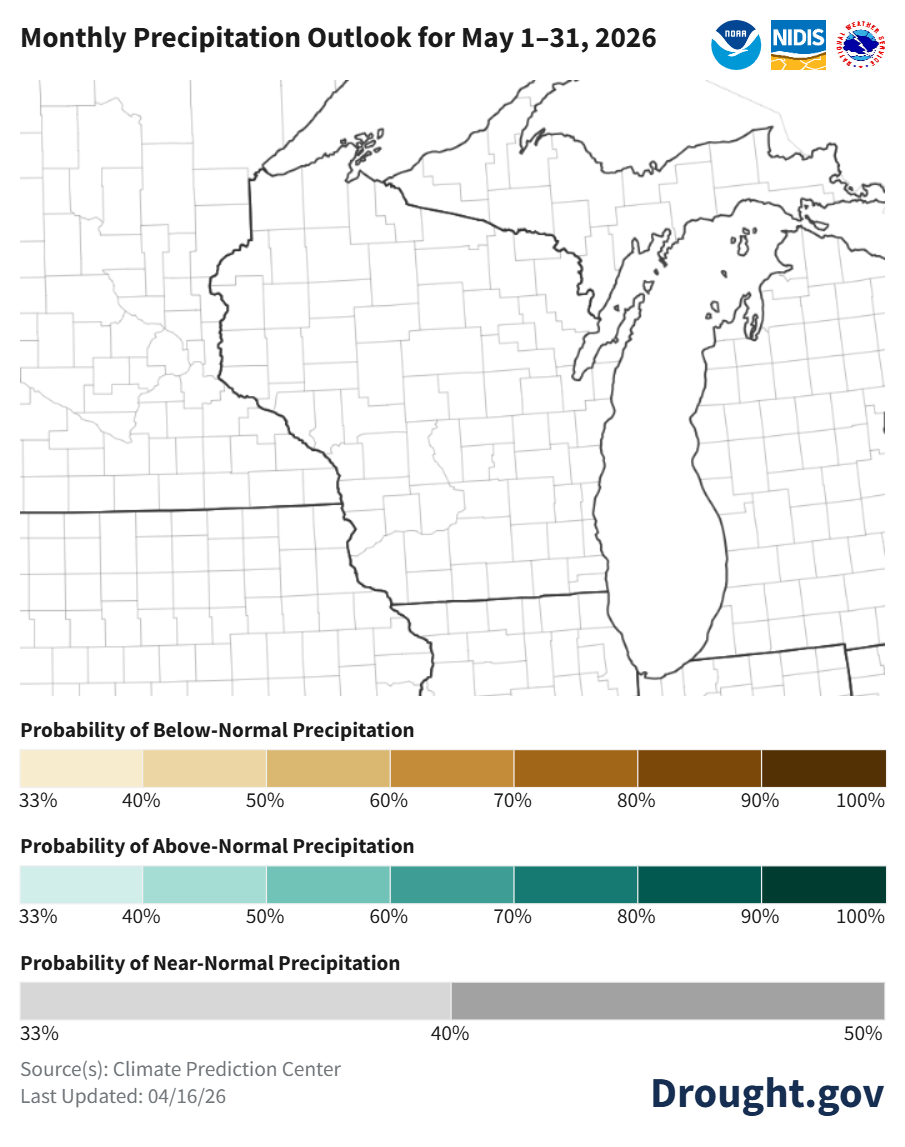
Image Description ↓
The map is titled “Monthly Precipitation Outlook for May 1–31, 2026.” It shows Wisconsin and surrounding Great Lakes states with county outlines only; Wisconsin counties are unshaded. The lack of shading indicates equal chances for below‑normal, near‑normal, or above‑normal precipitation across Wisconsin during May. Three legends below the map show probability scales for below‑normal precipitation (brown shades, 33–100%), above‑normal precipitation (teal shades, 33–100%), and near‑normal precipitation (gray, 33–50%). No colored areas appear on the map, reinforcing that no category is favored. The source is the Climate Prediction Center, last updated April 16, 2026. NOAA, NIDIS, and Drought.gov branding appears at the top and bottom.
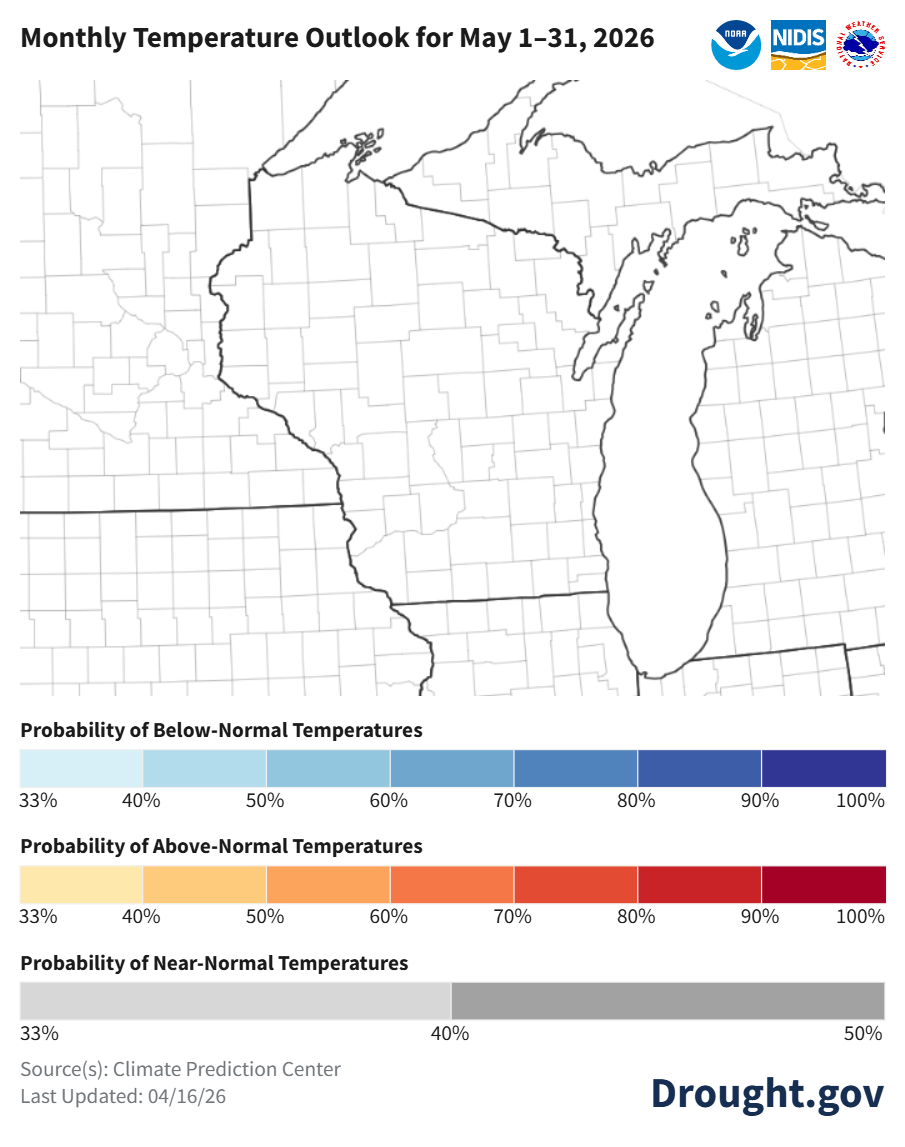
Image Description ↓
The map is titled “Monthly Temperature Outlook for May 1–31, 2026.” It shows Wisconsin and nearby Great Lakes states with county outlines but no colored shading over Wisconsin. The absence of color indicates equal chances for below‑normal, near‑normal, and above‑normal temperatures across the state for May. Below the map are three legends: probability of below‑normal temperatures (blue scale, 33–100%), probability of above‑normal temperatures (orange‑to‑red scale, 33–100%), and probability of near‑normal temperatures (gray scale, 33–50%). Wisconsin is not highlighted in any probability color, confirming no favored temperature outcome. Branding for NOAA, NIDIS, and Drought.gov appears, with the source listed as the Climate Prediction Center and last updated April 16, 2026.
- May: uncertainty for temperatures and precipitation statewide with equal chances for above, near, or below normal conditions.
- Statewide normals (1991-2020) for May 1-31 are 55.4°F and 3.93”.
90 Day Temperature and Precipitation Outlook
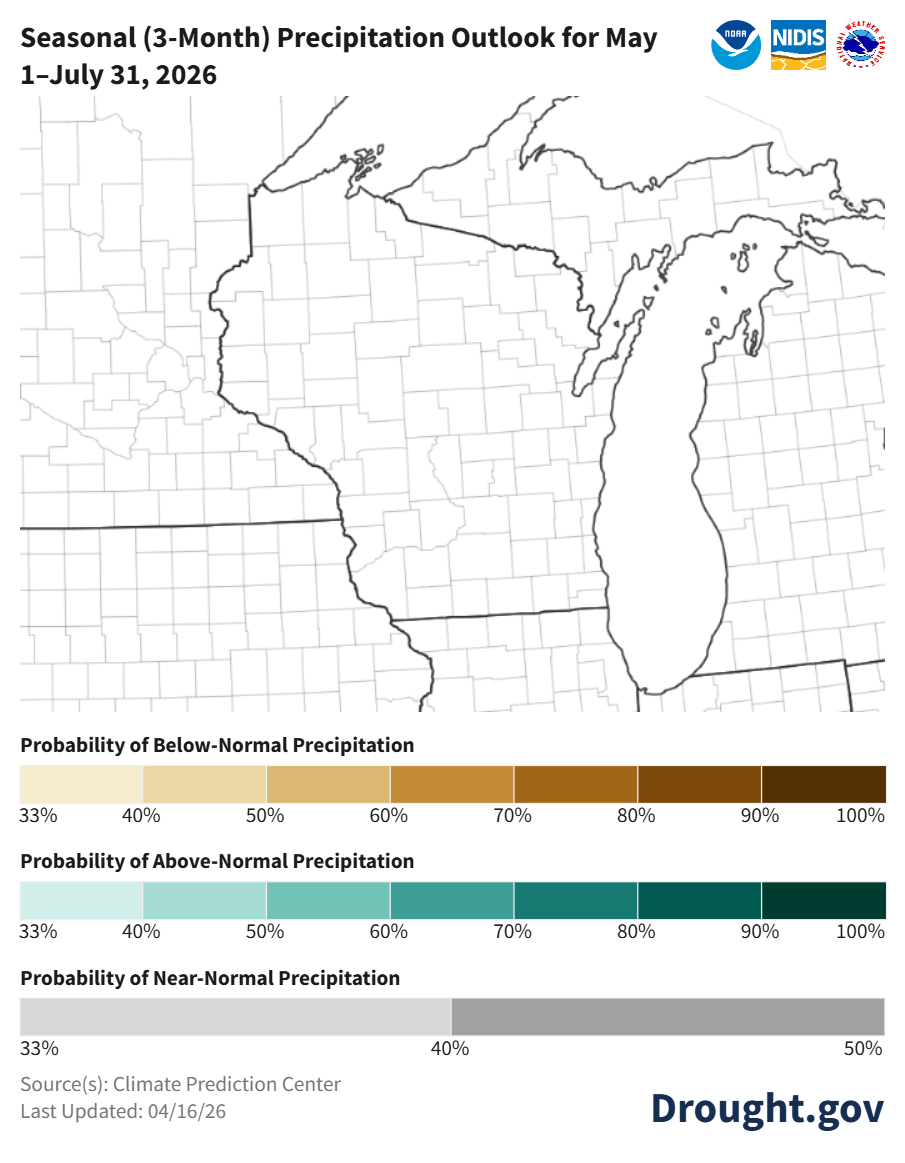
Image Description ↓
The map is titled “Seasonal (3‑Month) Precipitation Outlook for May 1–July 31, 2026.” It shows Wisconsin and surrounding Great Lakes states with county outlines only; Wisconsin counties are not shaded. The absence of color indicates equal chances for below‑normal, near‑normal, and above‑normal precipitation across Wisconsin for the three‑month period. Below the map are three legends: probability of below‑normal precipitation (brown scale, 33–100%), probability of above‑normal precipitation (teal scale, 33–100%), and probability of near‑normal precipitation (gray scale, 33–50%). Wisconsin is not highlighted in any probability category, confirming no favored precipitation outcome. Branding for NOAA, NIDIS, and Drought.gov appears on the graphic. The source is the Climate Prediction Center, last updated April 16, 2026.
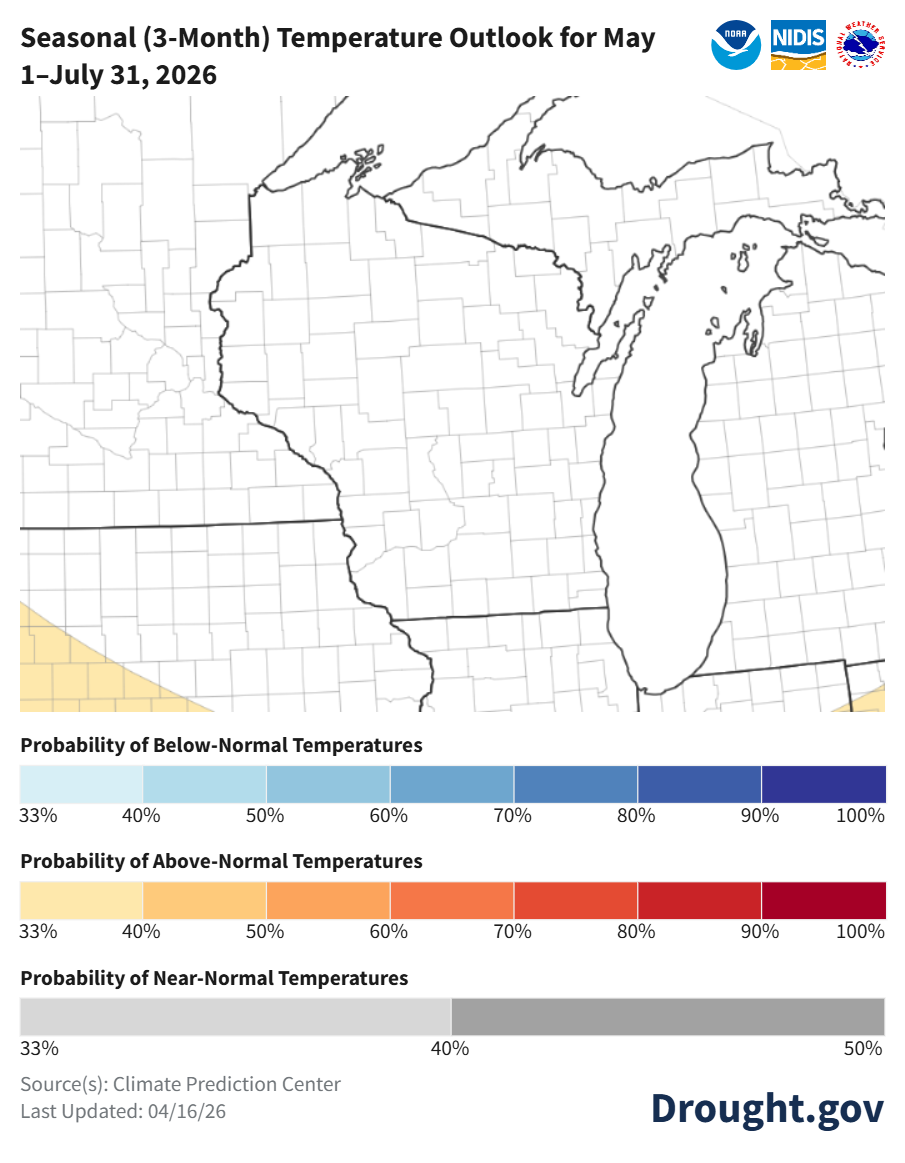
Image Description ↓
The map is titled “Seasonal (3‑Month) Temperature Outlook for May 1–July 31, 2026.” It shows Wisconsin and surrounding Great Lakes states with county outlines. Wisconsin is not shaded with probability colors, indicating equal chances for below‑normal, near‑normal, and above‑normal temperatures across the state for the three‑month period. Probability legends below the map show scales for below‑normal temperatures (blue, 33–100%), above‑normal temperatures (orange to red, 33–100%), and near‑normal temperatures (gray, 33–50%). NOAA, NIDIS, and Drought.gov logos appear on the graphic. The source is the Climate Prediction Center, last updated April 16, 2026.
- May-July: uncertainty for temperatures and precipitation statewide with equal chances for above, near, or below normal conditions.
- Statewide normals (1991-2020) for May-July are 63.2°F and 12.67”.
User Survey
Are you a regular user of the Ag Weather Outlook for Wisconsin (AgWOW)? Or maybe you are viewing these slides for the first time this week? Either way, we want to hear your feedback on this resource! Please take a few minutes and fill out this survey. Your feedback will help us better serve your ag-weather data needs through AgWOW.
If you have any trouble accessing or filling out the survey, please email Josh Bendorf at jbendorf@wisc.edu. Thank you!