Weather and climate conditions this month in Wisconsin
Here are this month’s take-home points about the weather. As a reminder, AgWOW reports will be published monthly until spring. Scroll down for the full report.
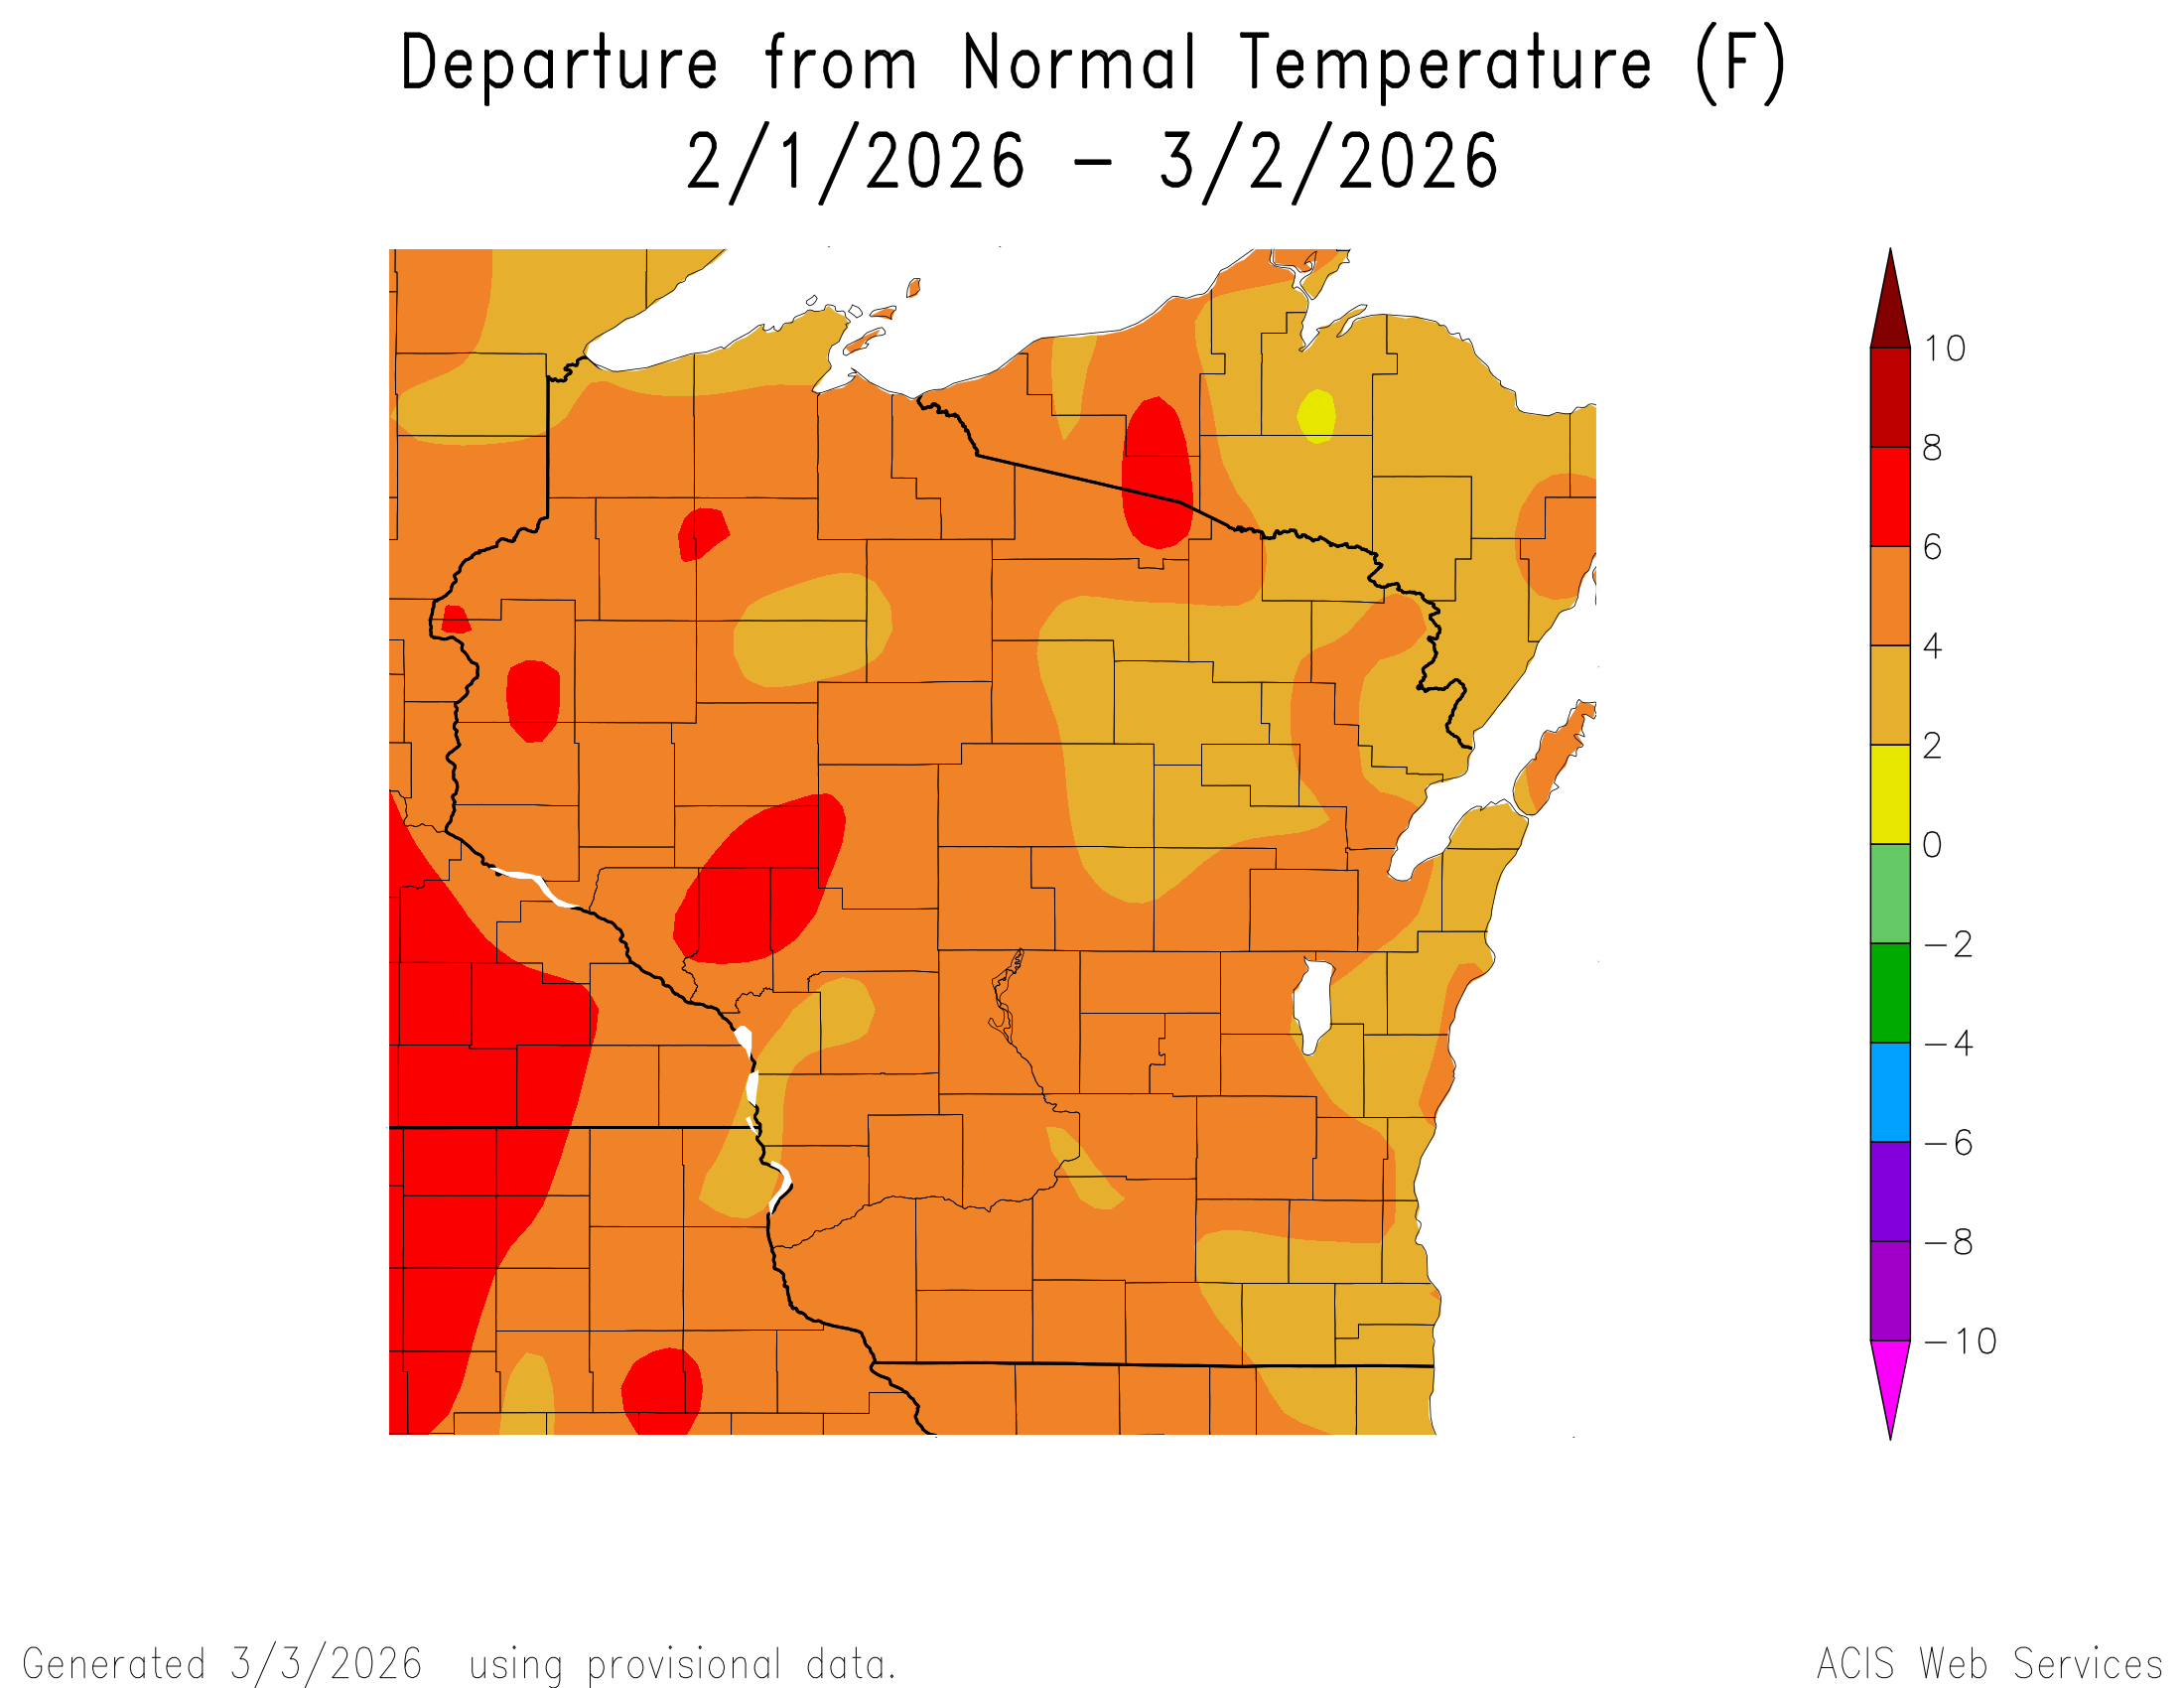
Temperatures were 2-6°F above normal across the state, with several days topping 50°F in the south.
Precipitation was well below normal across south and west, with above normal totals in the NE counties.
Impact
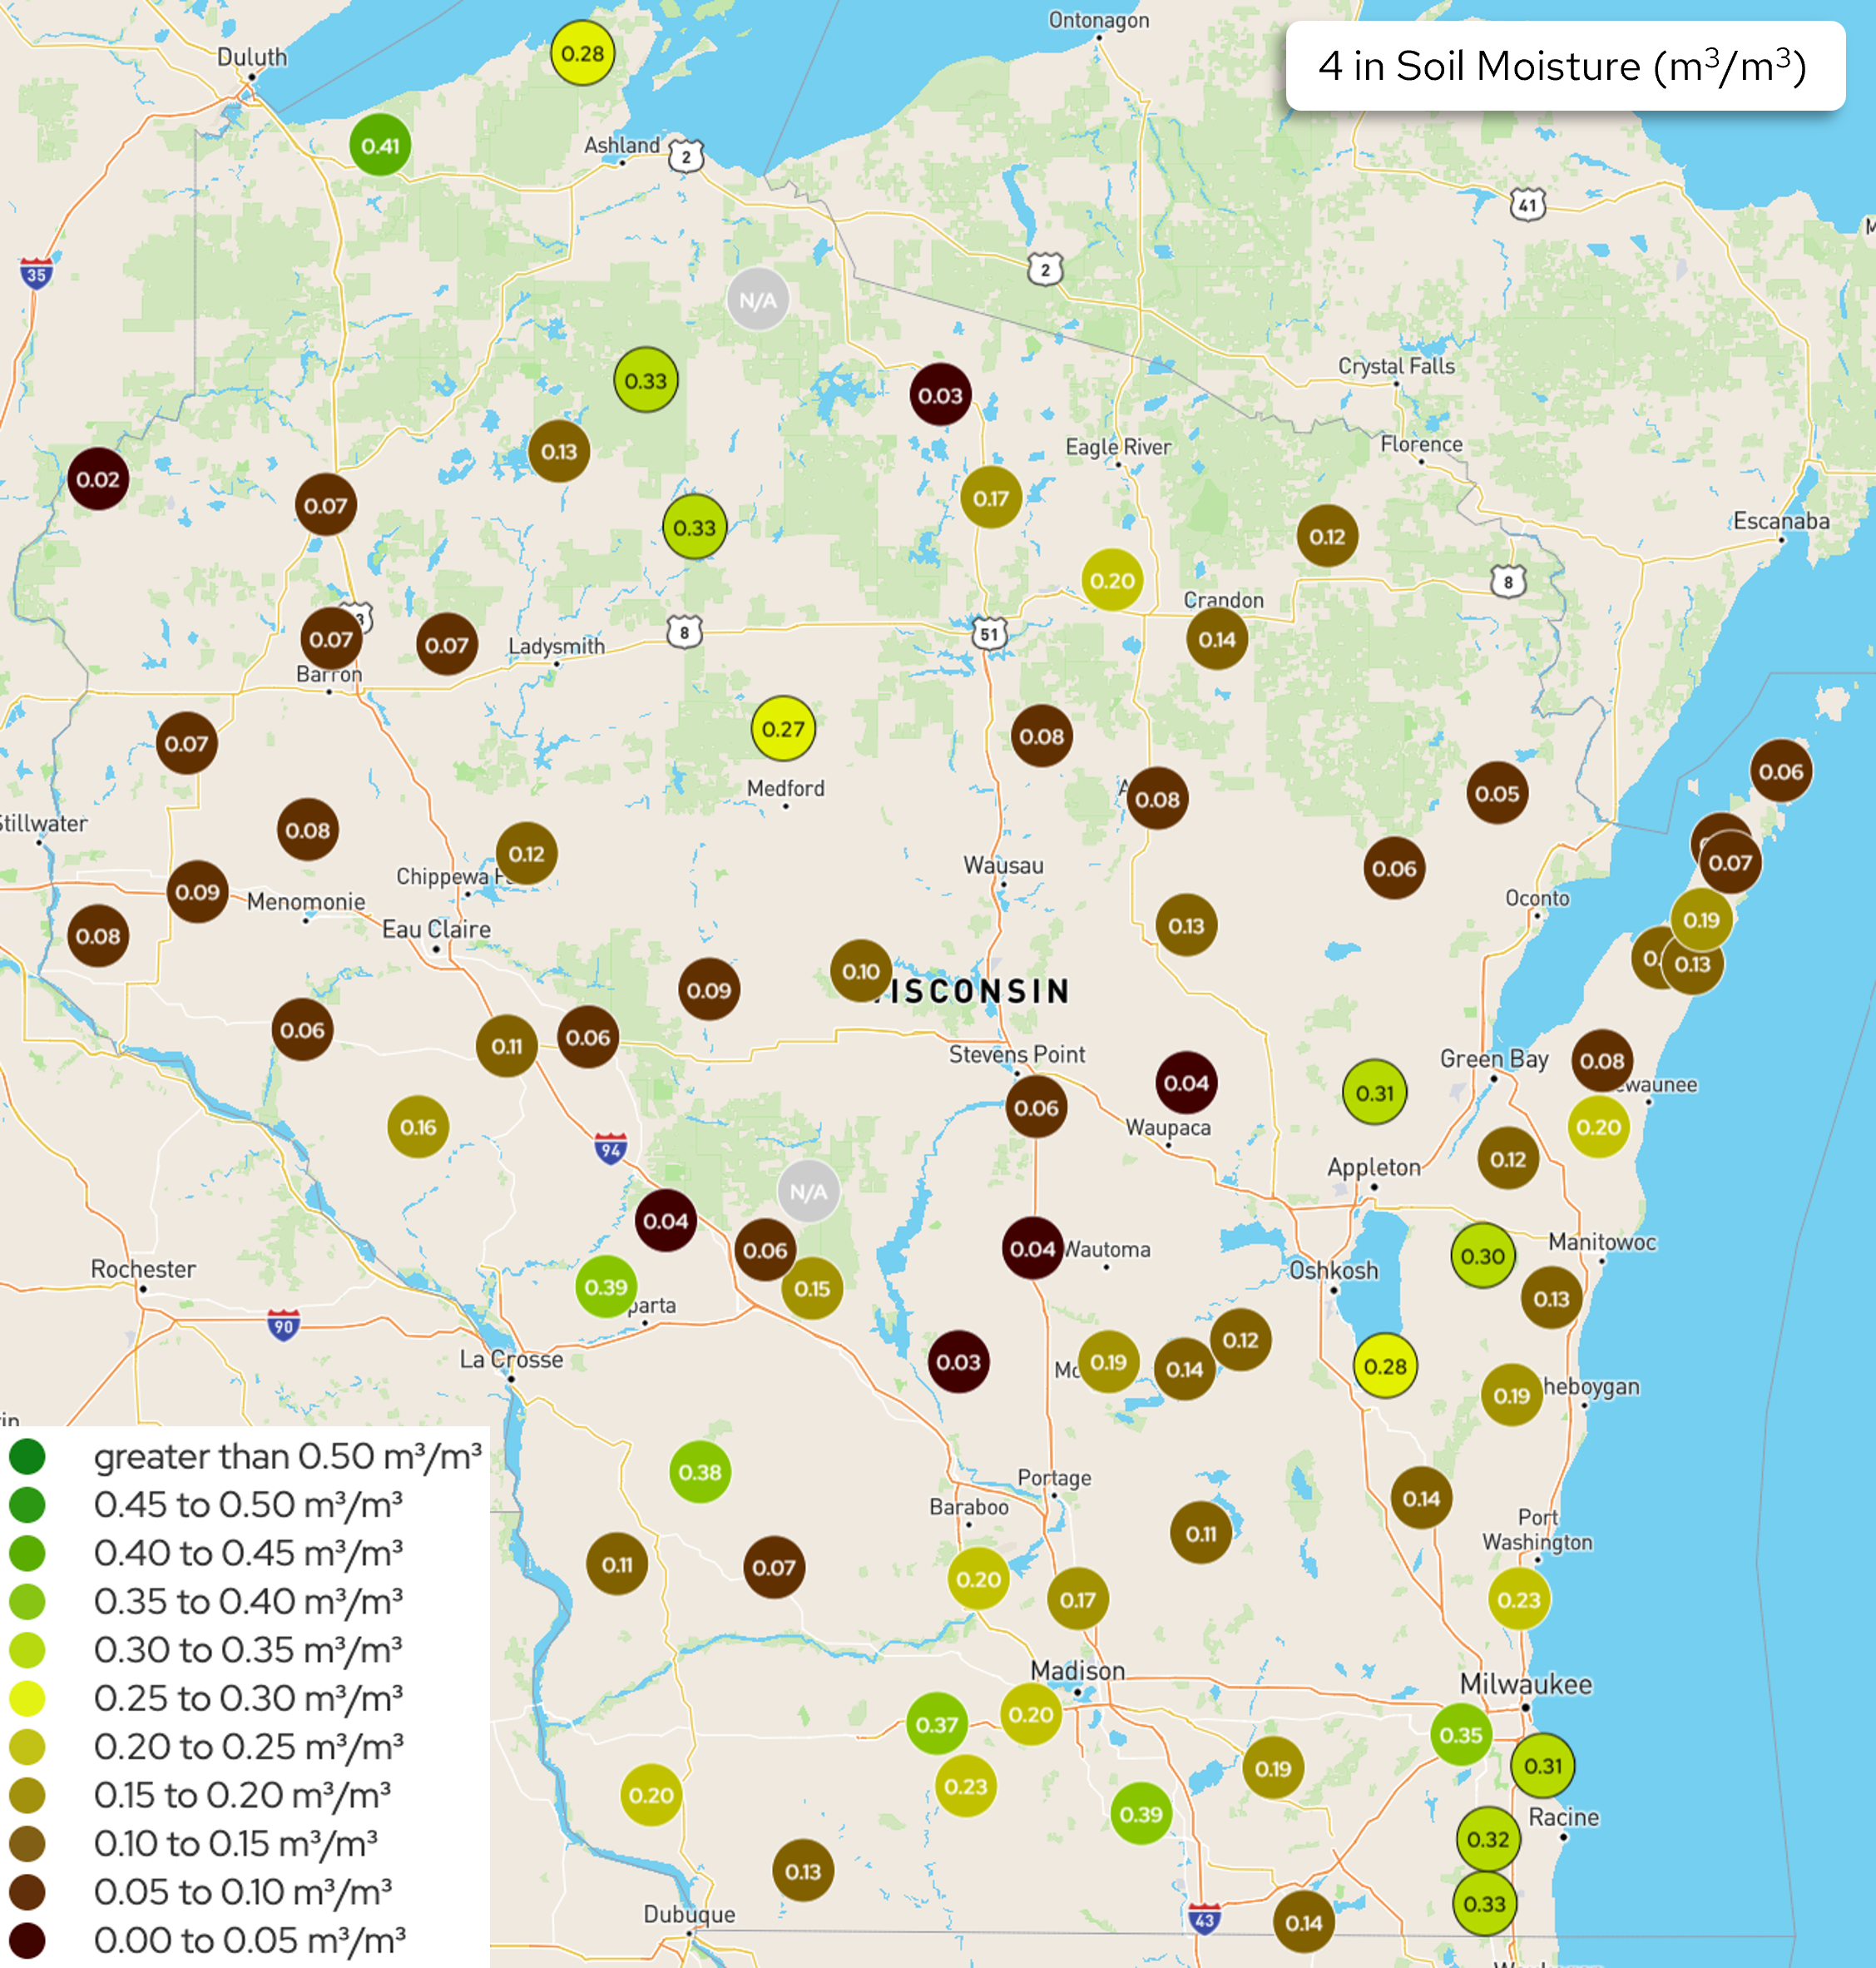
Soil moisture levels at 4” depth showed an increase from early February levels across UW research farm stations (Wisconet). The east and southeast remain abnormally dry for this time of year.
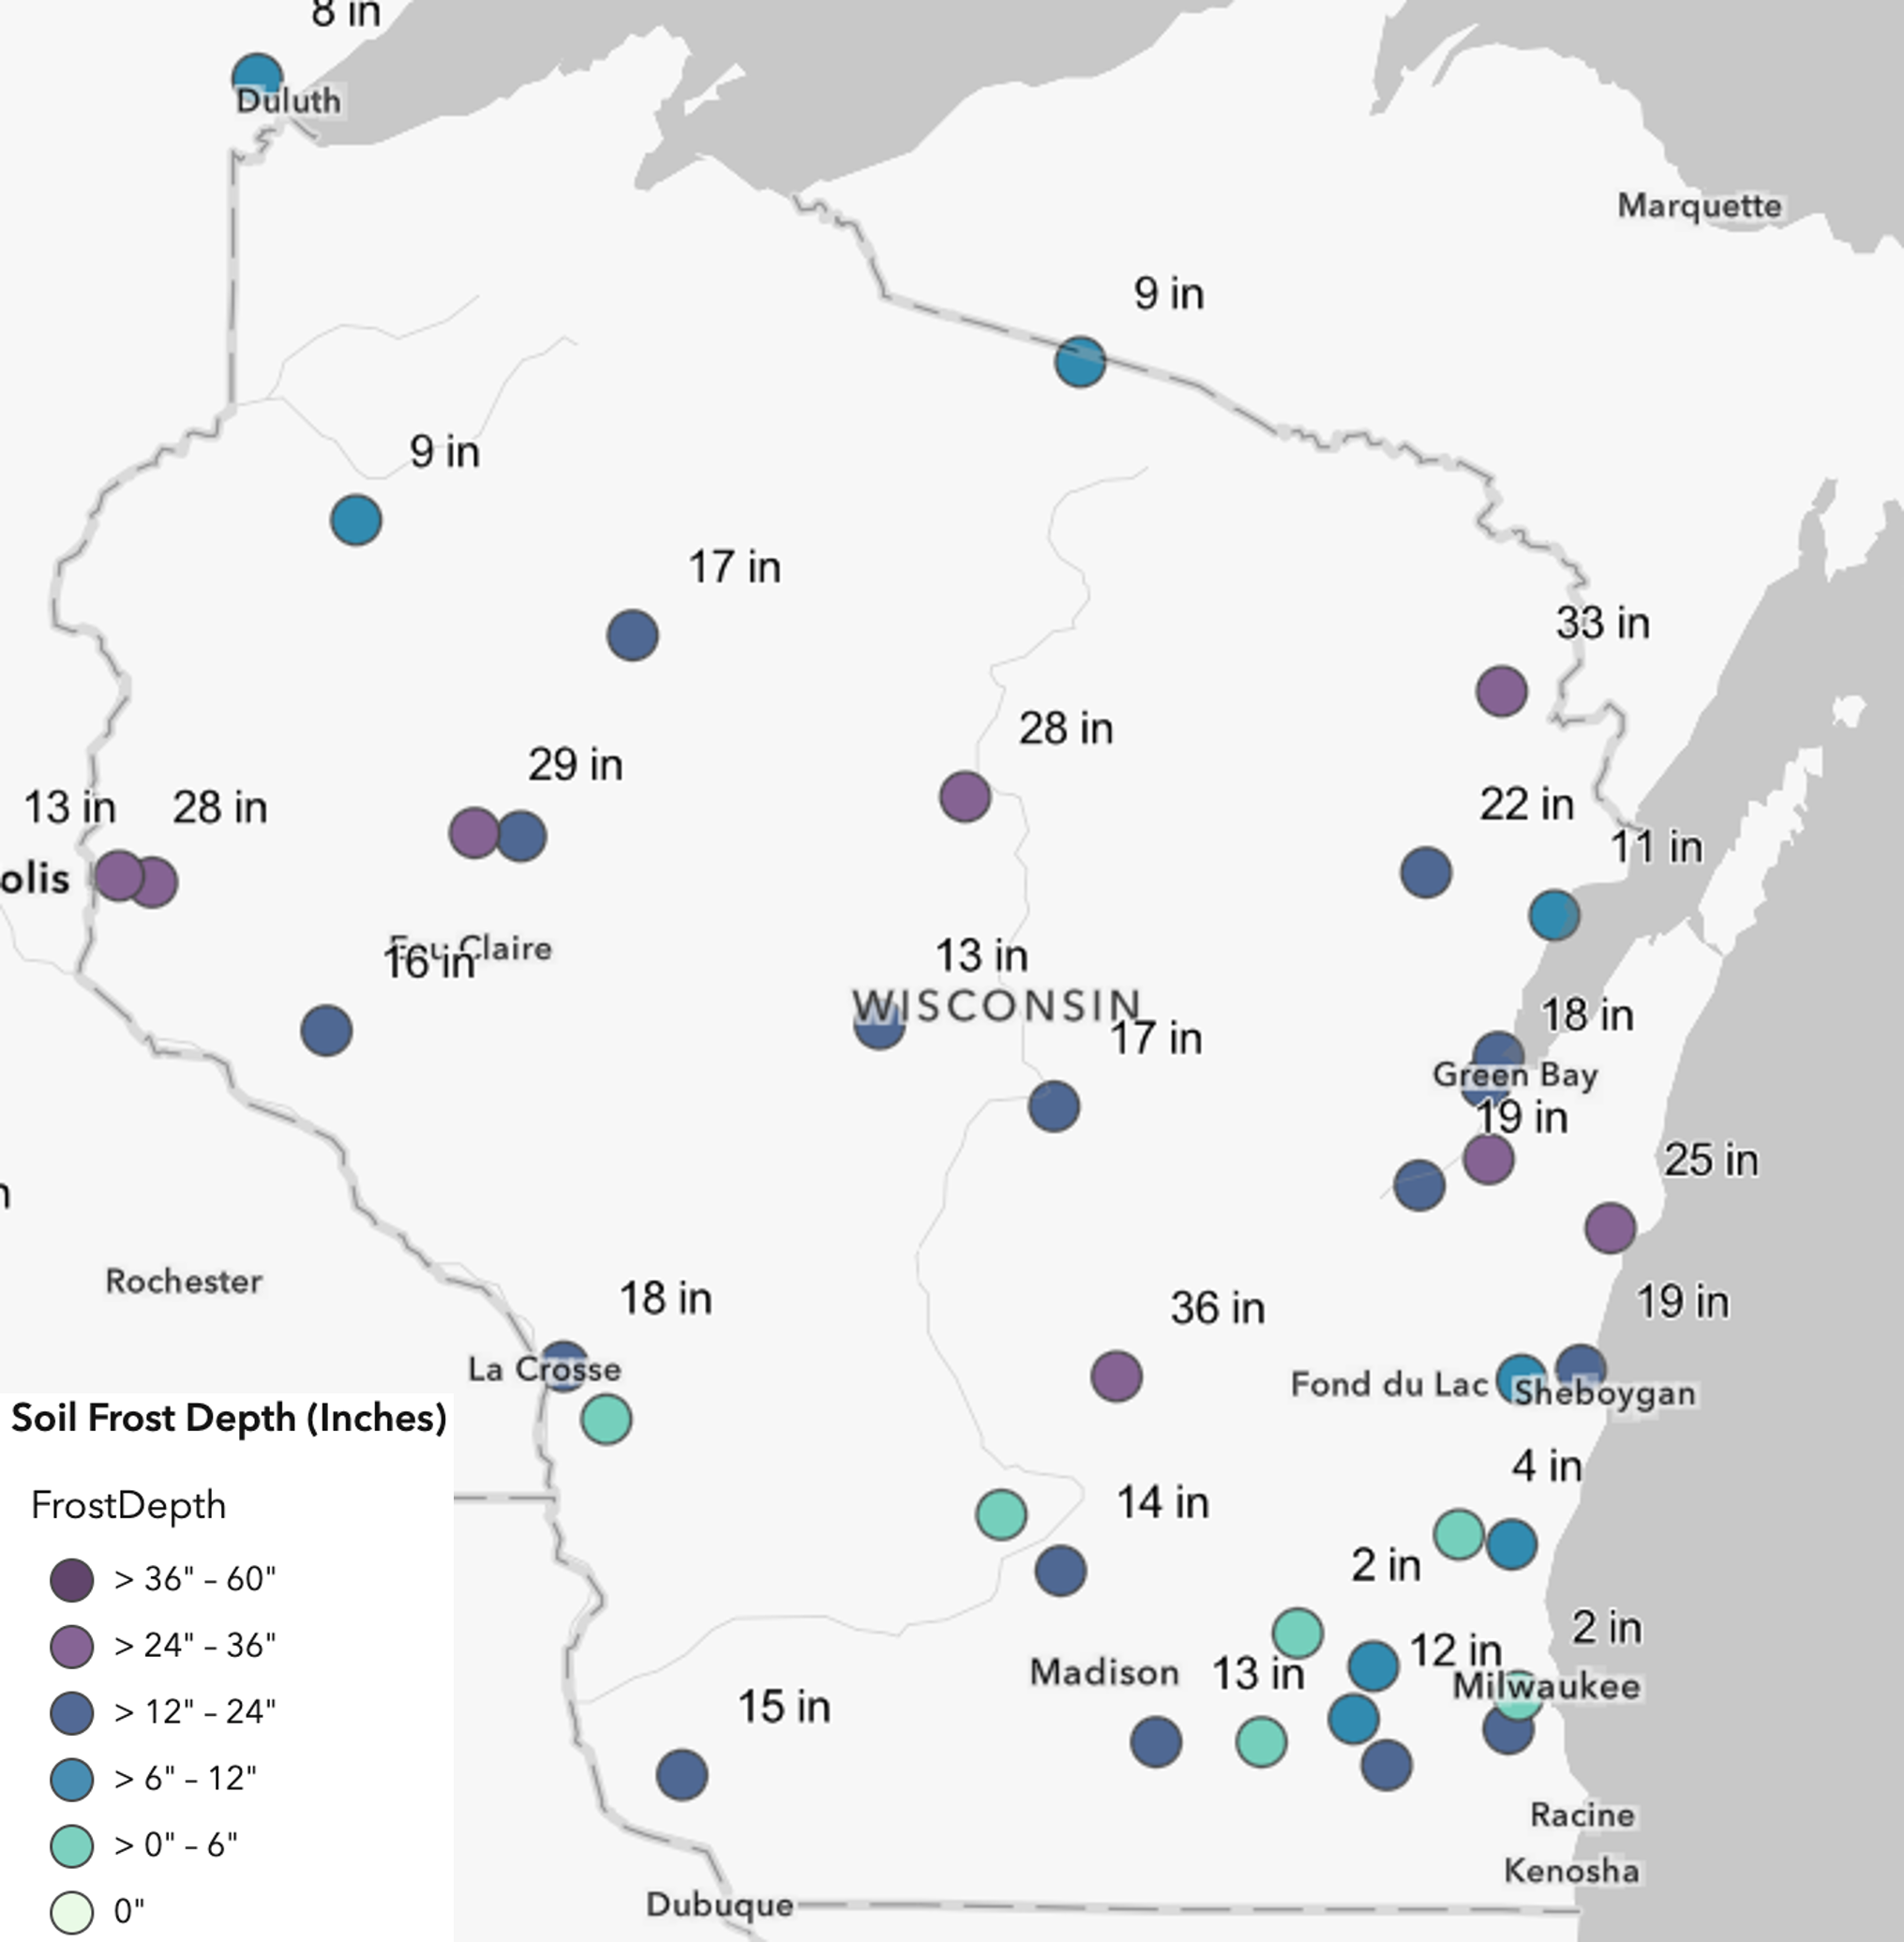
Frost in the top 12” of soil is common across WI, with some northern stations reporting a frost depth deeper than 2 feet.
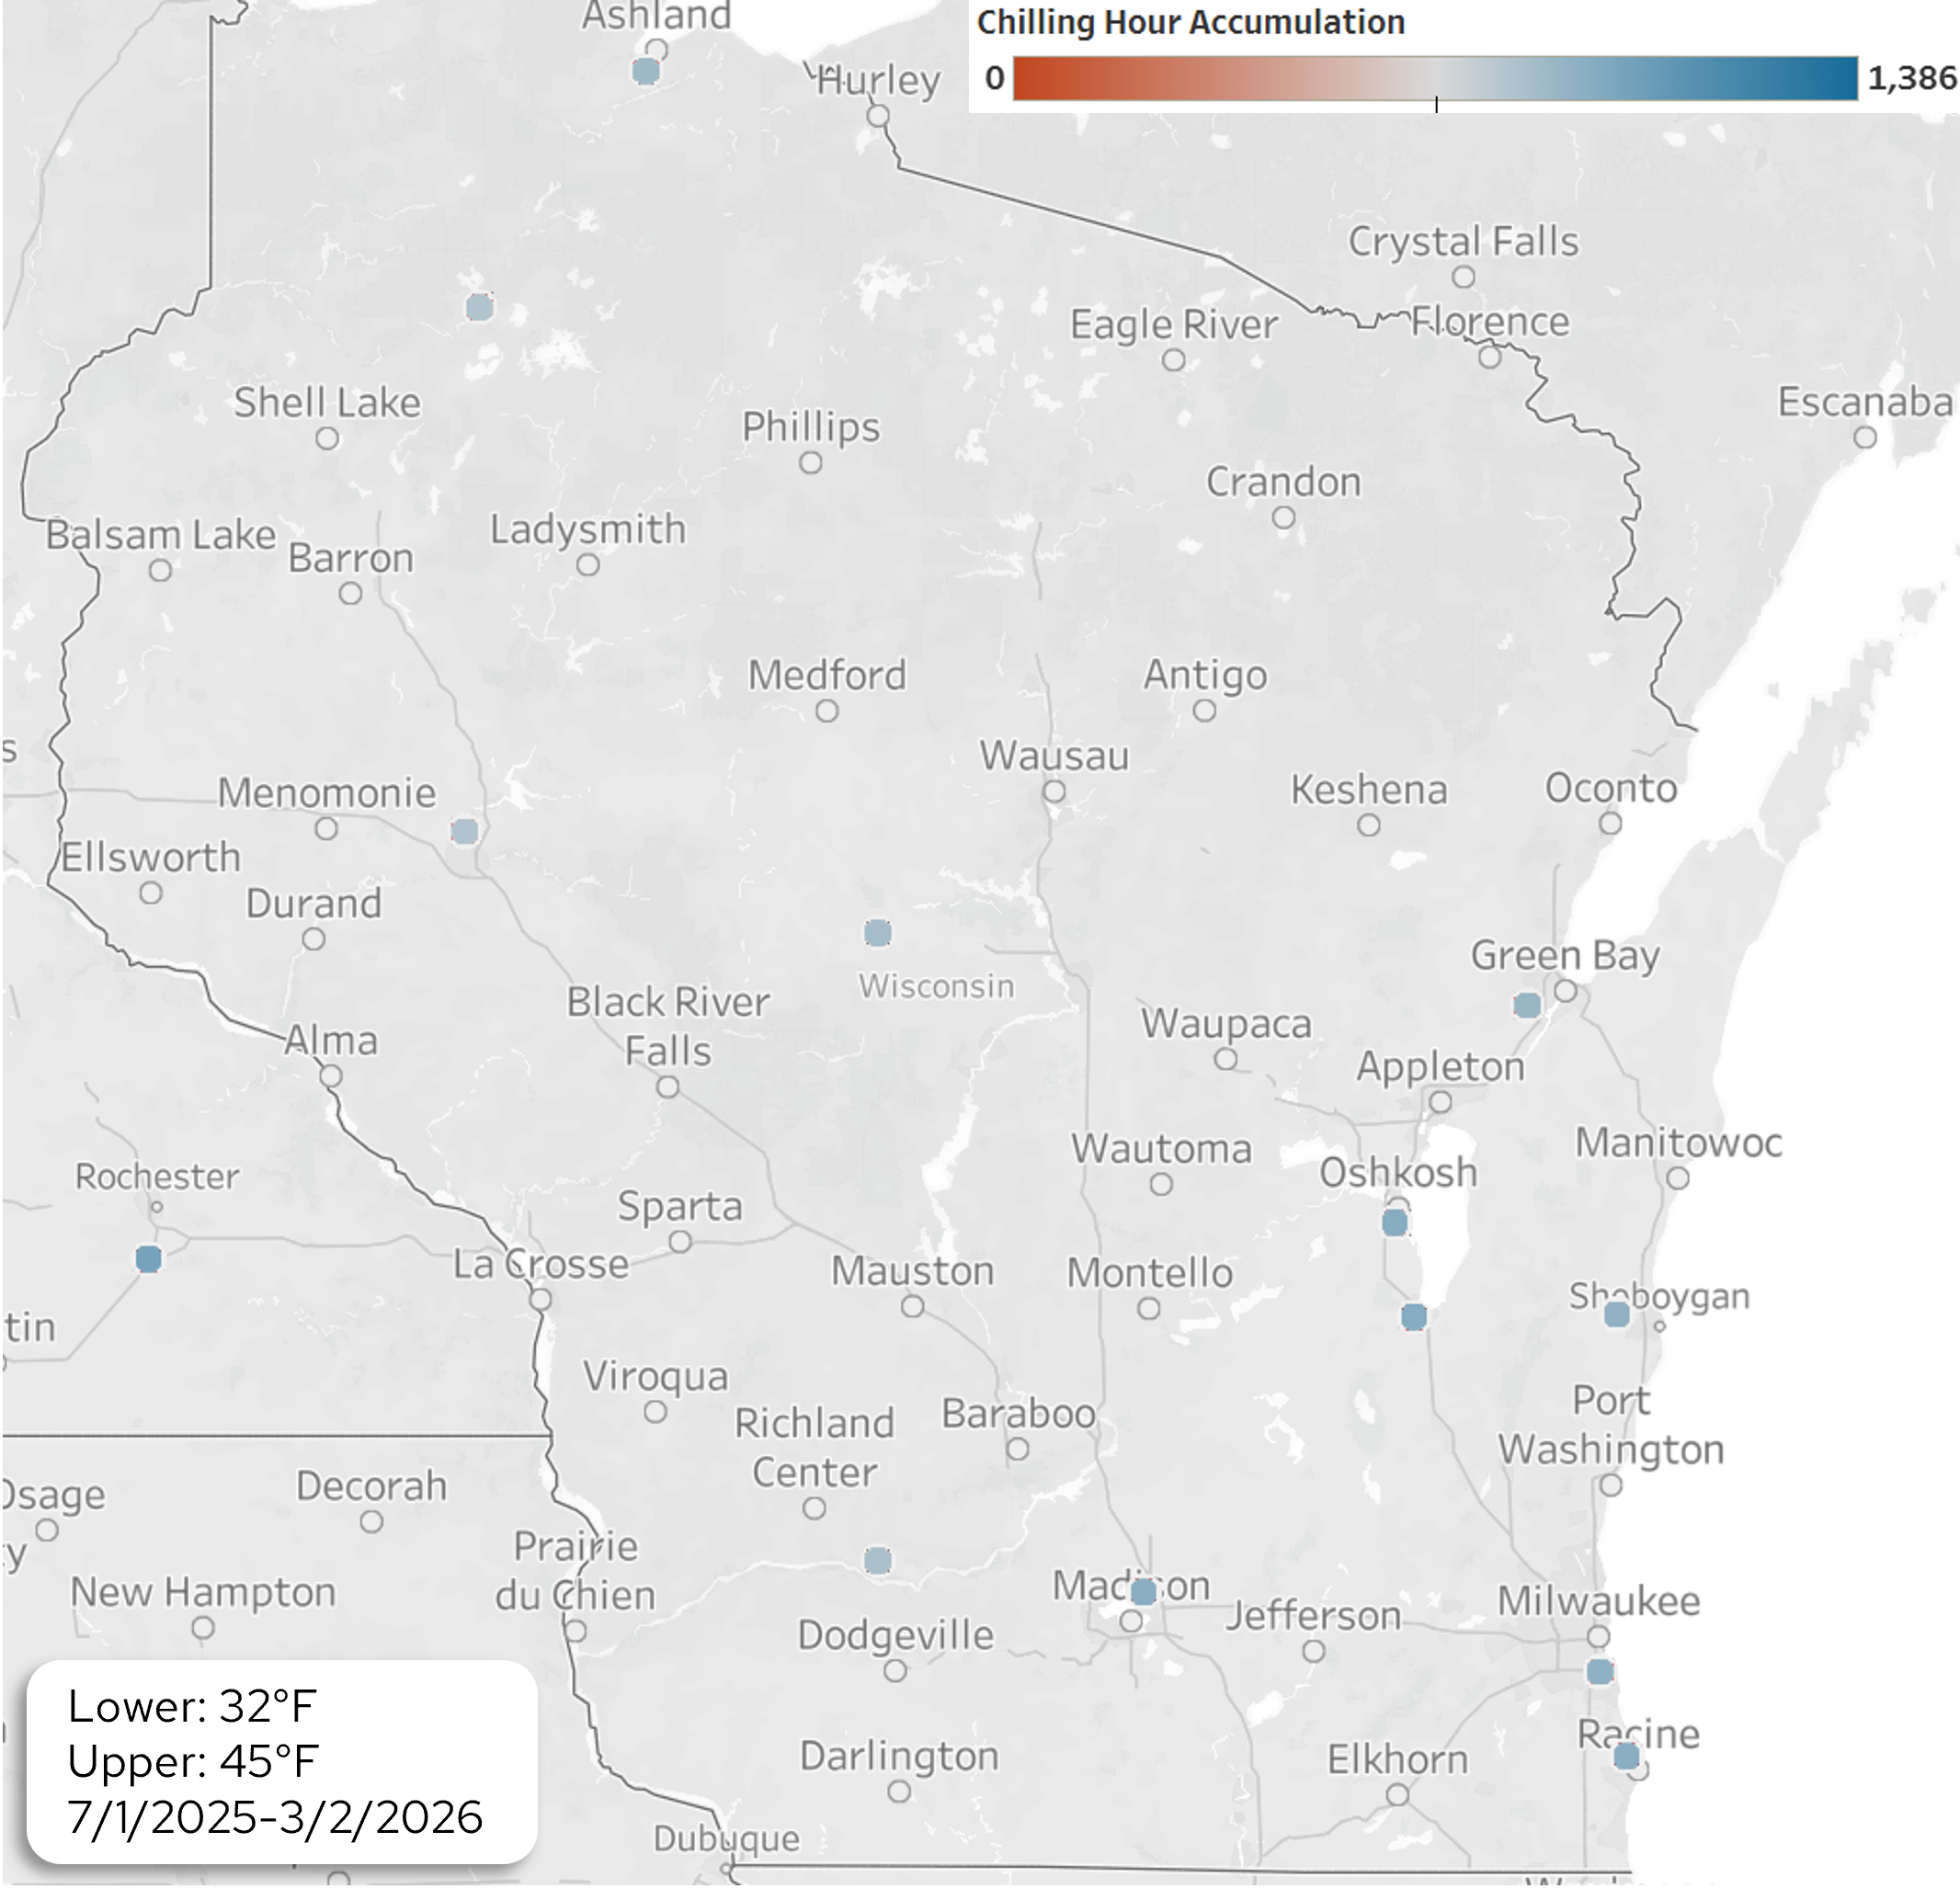
Chilling hours for Wisconsin’s perennial fruits range from 812 to 952 accumulated hours.
Abnormal dryness (D0) coverage increased from early February, with minimal (1-2%) shifts in D1 and D2 coverage.
Outlook
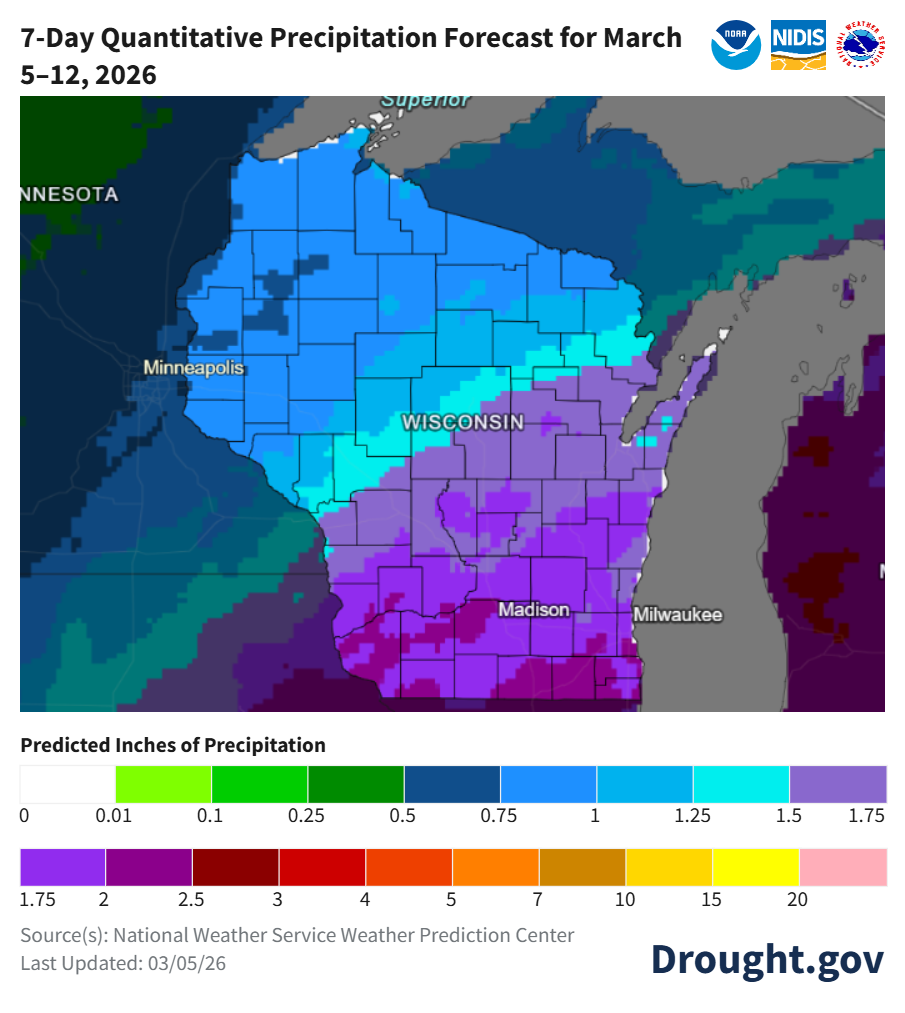
Precip over the next 7 days is most likely in the south with multiple chances for rain.
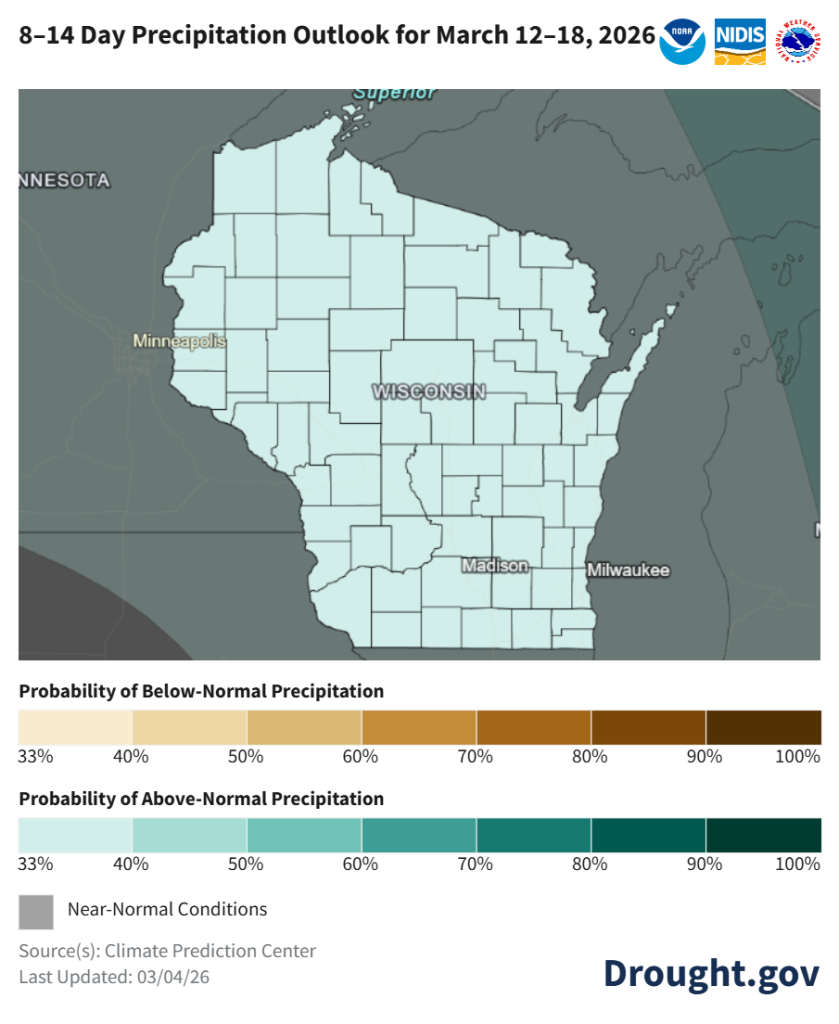
Climate probabilities for Mid-March indicate that temperatures are leaning (40-50% odds) to be below normal statewide with a lean (33-40% odds) towards above normal precipitation.
The outlook for March shows a lean toward above-normal temperatures and above-normal precipitation statewide.
The outlook for Mar-May indicates a statewide lean towards above-normal precipitation, with temperatures leaning towards below normal in the north.
Agronomic and Vegetable Considerations
Field Conditions
Avoid trafficking fields in wet conditions to prevent compaction and rutting.
Before you start transplanting in your high tunnel, make sure you remove aphid weed hosts such as henbit and chickweed that can be a reservoir for aphids that can then infest your crop.
Building a high tunnel this spring? Check out this 6-part video series from the University of New Hampshire Extension that covers the entire construction process including in depth explanations and tips & tricks.
Dive deeper into each report section by clicking a topic below.
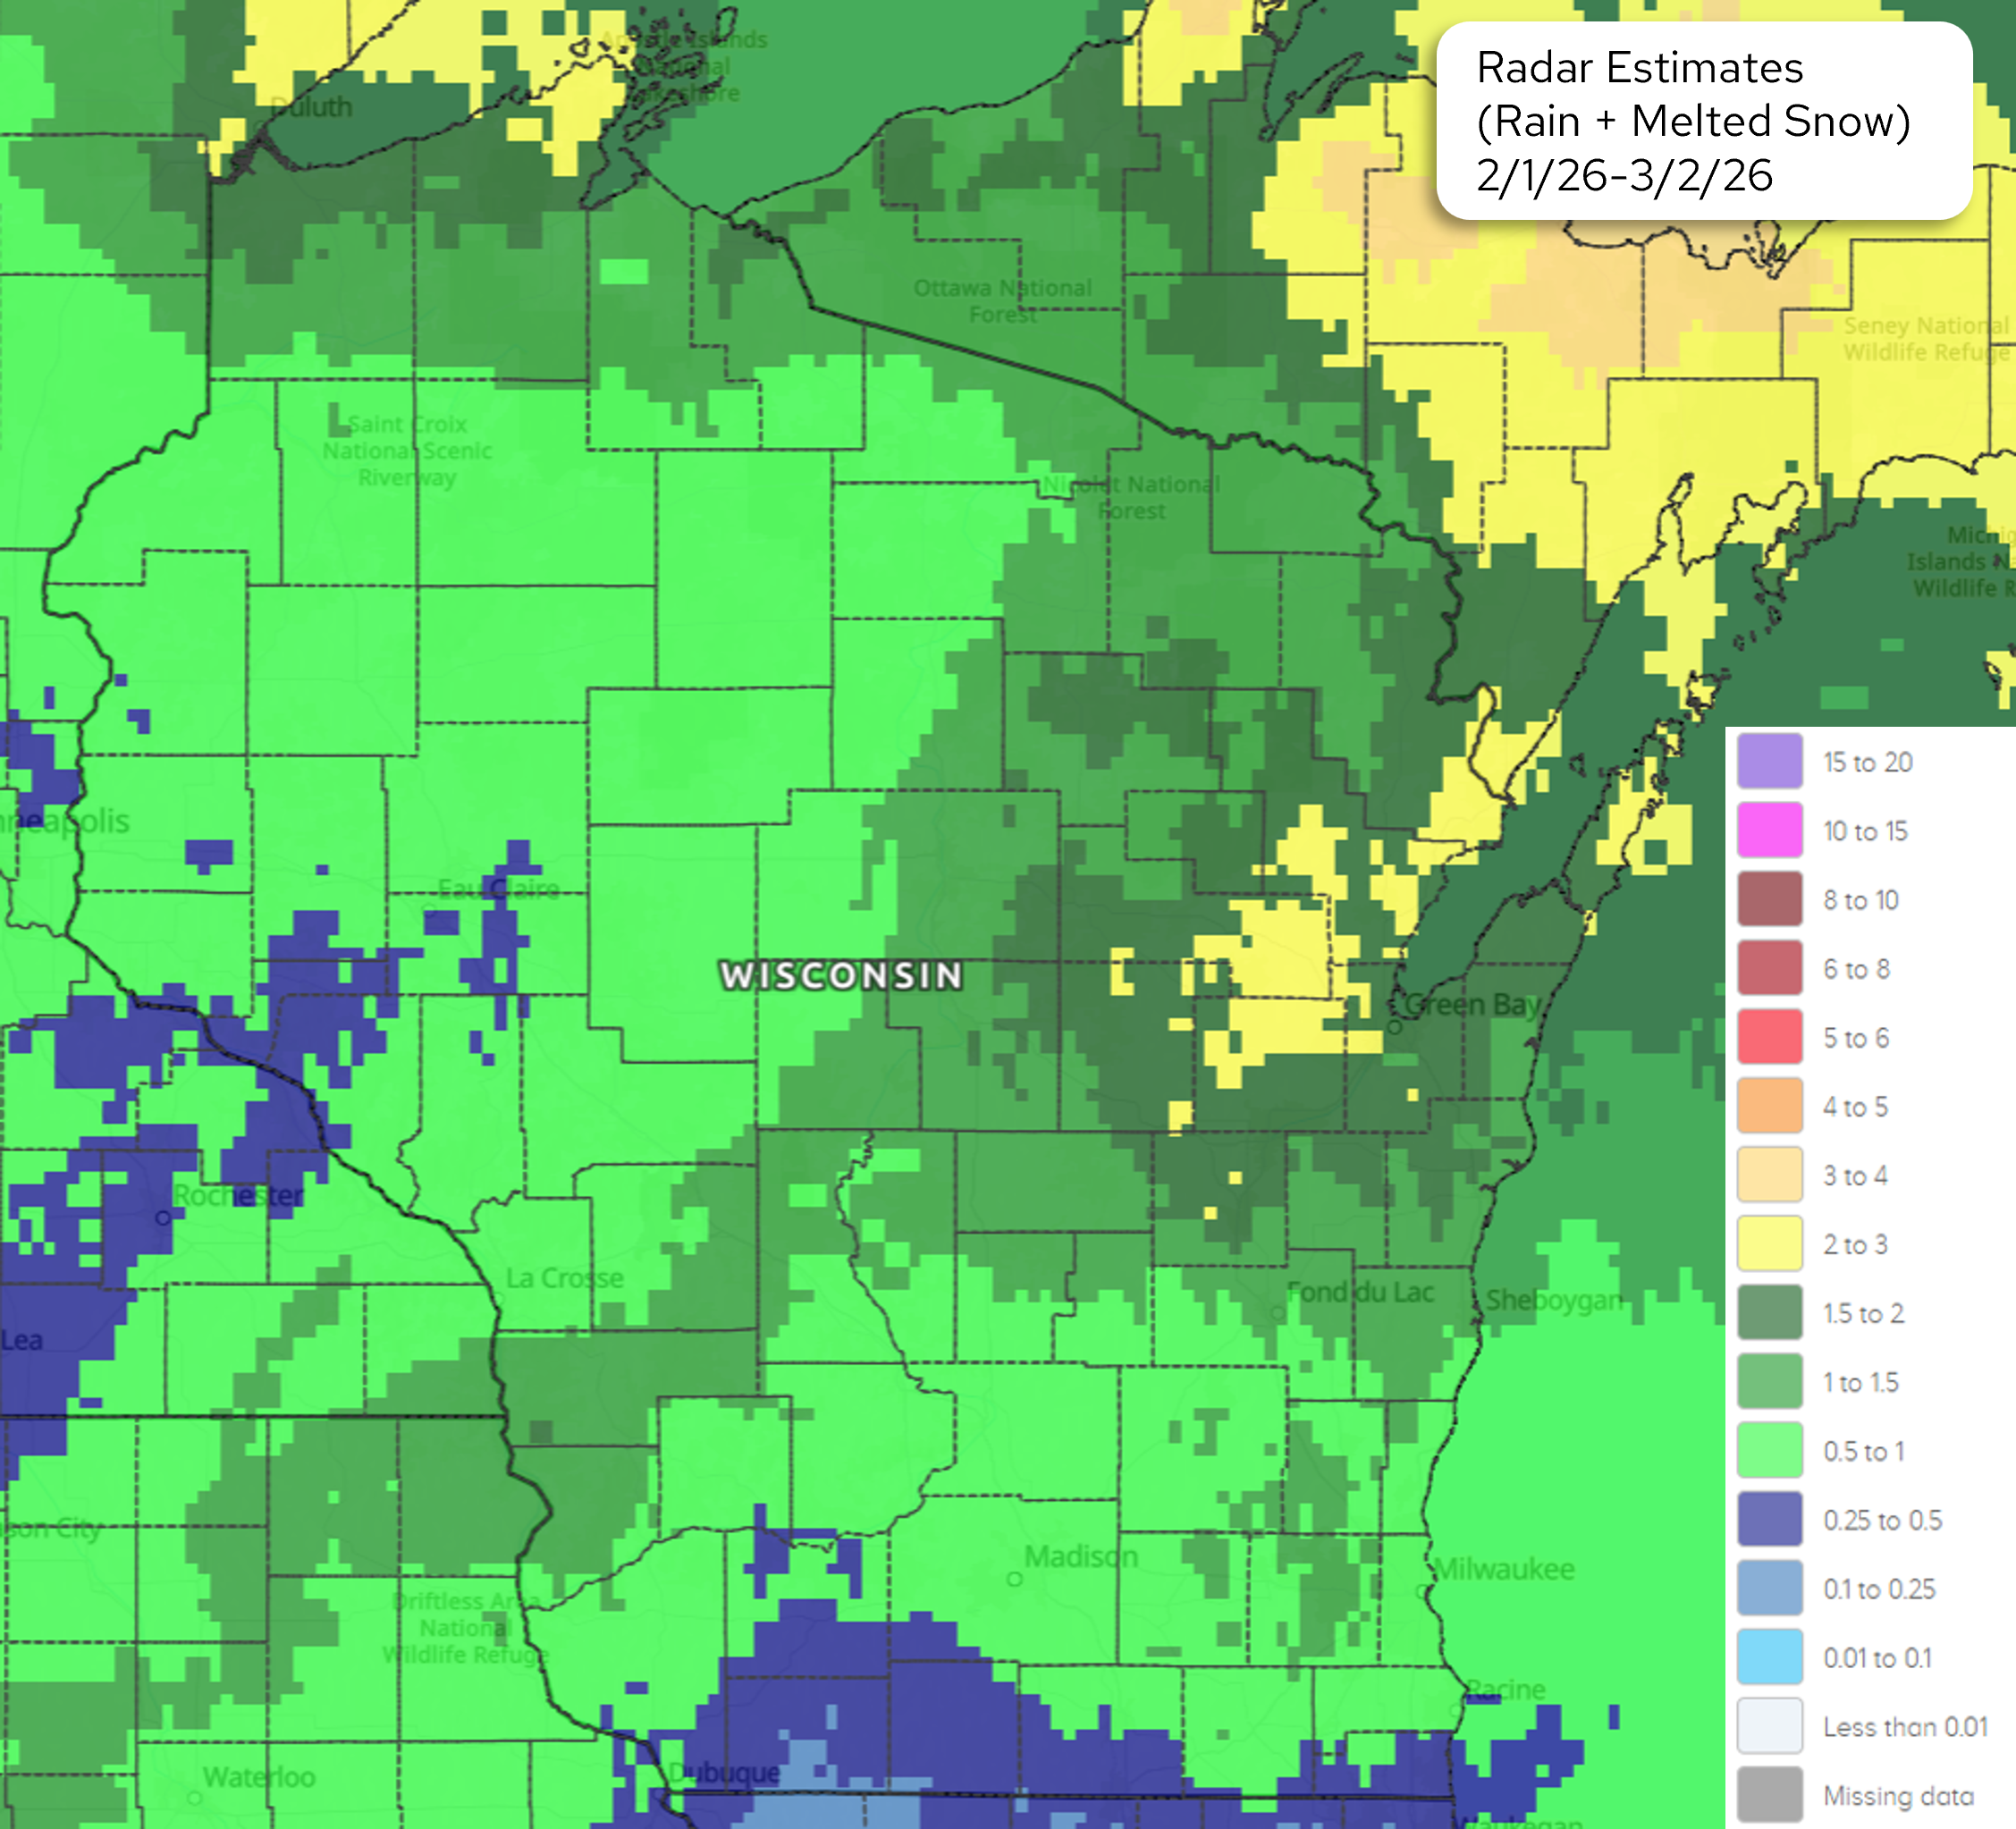
Image description: NOAA radar estimates map (rain + melted snow) for February 1–March 2, 2026, covering Wisconsin and portions of Minnesota, Iowa, Illinois, Michigan, and the Upper Peninsula. A color-coded legend in the lower right shows precipitation ranges from “less than 0.01” to “15 to 20” inches. Most of Wisconsin is covered in light to medium green, indicating 0.5 to 1.5 inches of precipitation. The northeastern corner near Green Bay and along Lake Michigan shows dark green and yellow patches, indicating 1.5 to 3 inches. The northwestern and southwestern edges of the map (parts of Minnesota and Iowa/Illinois) show blue and dark blue, indicating 0.1 to 0.5 inches. Northern Wisconsin and the Upper Peninsula transition to darker green and yellow-green, suggesting 1.5 to 3+ inches. Madison sits in a light green zone (0.5–1 inch). No areas of extreme precipitation (above 5 inches) are visible within Wisconsin.
Highest totals in the northeast and along Lake Superior – 2-3”
Widespread totals of 0.5-1.5”
Lowest totals in the far south and west of Eau Claire- 0.5” or less
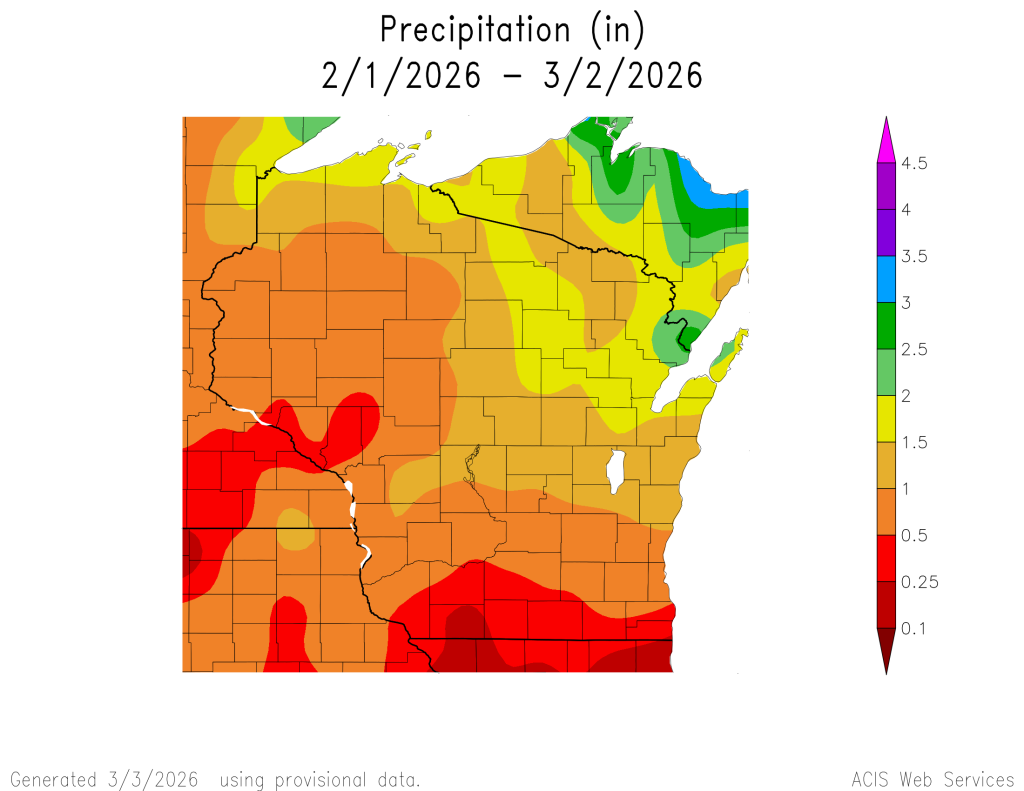
Image description: Precipitation map of Wisconsin (and portions of neighboring states) showing 30-day totals from February 1 to March 2, 2026, generated by ACIS Web Services using provisional data. A color gradient scale ranges from deep red (0.1 in) through orange, yellow, green, blue, to magenta (4.5+ in). Most of Wisconsin received 1–2 inches (orange to yellow). The northeastern corner, near Lake Superior and the Upper Peninsula border, received the highest amounts — 3 to over 3.5 inches (green and blue). Southwestern Wisconsin and areas along the southern border show the lowest totals, 0.1–0.25 inches (red). Central and south-central Wisconsin falls in the 0.5–1.5 inch range (orange).
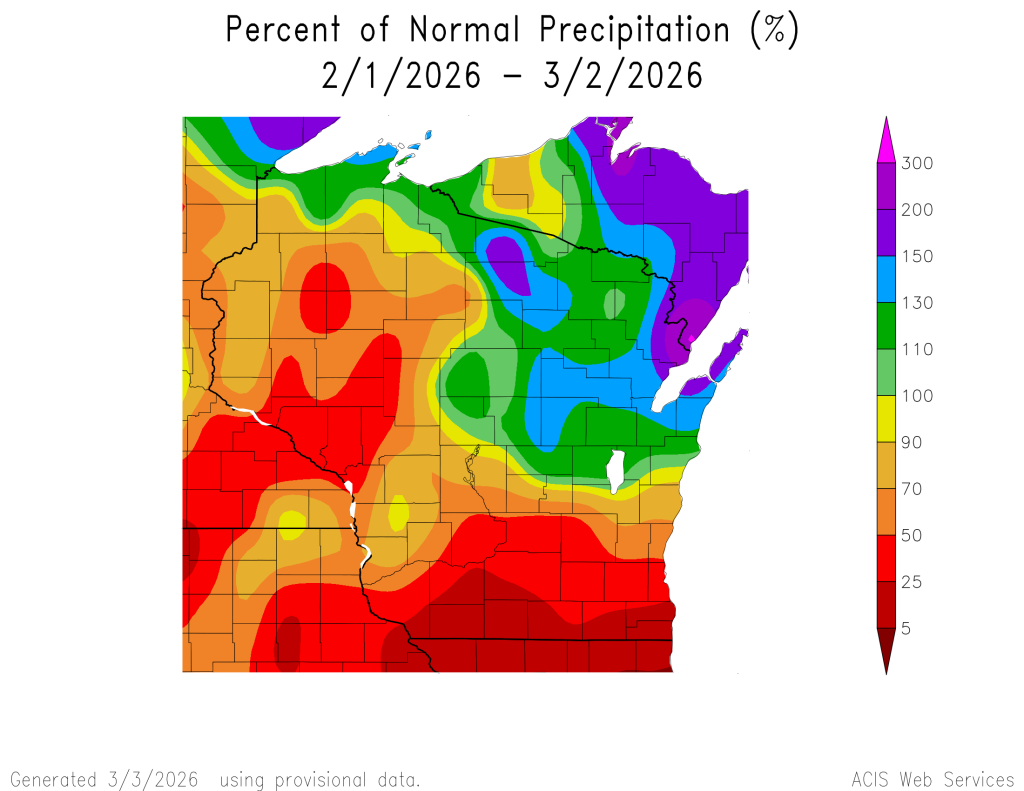
Image description: Precipitation map (ACIS Web Services, generated 3/3/2026, provisional data) showing percent of normal precipitation across Wisconsin and surrounding states for February 1–March 2, 2026. Color scale ranges from 5% (dark red) to 300%+ (magenta/pink). Northwest/west-centralWI is deep red and orange indicating severe precipitation deficit (5–50% of normal). South/southeast WI: Large red zone showing extreme deficit (5–25% of normal). Central WI: Transitional yellow-green band near 90–110% of normal. Northeast WI: Green to blue tones indicating above-normal precipitation (110–150%). Far northeast (Lake Superior/Upper Michigan border area): Purple zones showing 200–300%+ of normal — extreme surplus.
Well below normal (50% or less) precipitation in the south and west – 1” or less common
110-130% of normal common in the north/northeast counties à instances of 150% in Marinette County near Green Bay
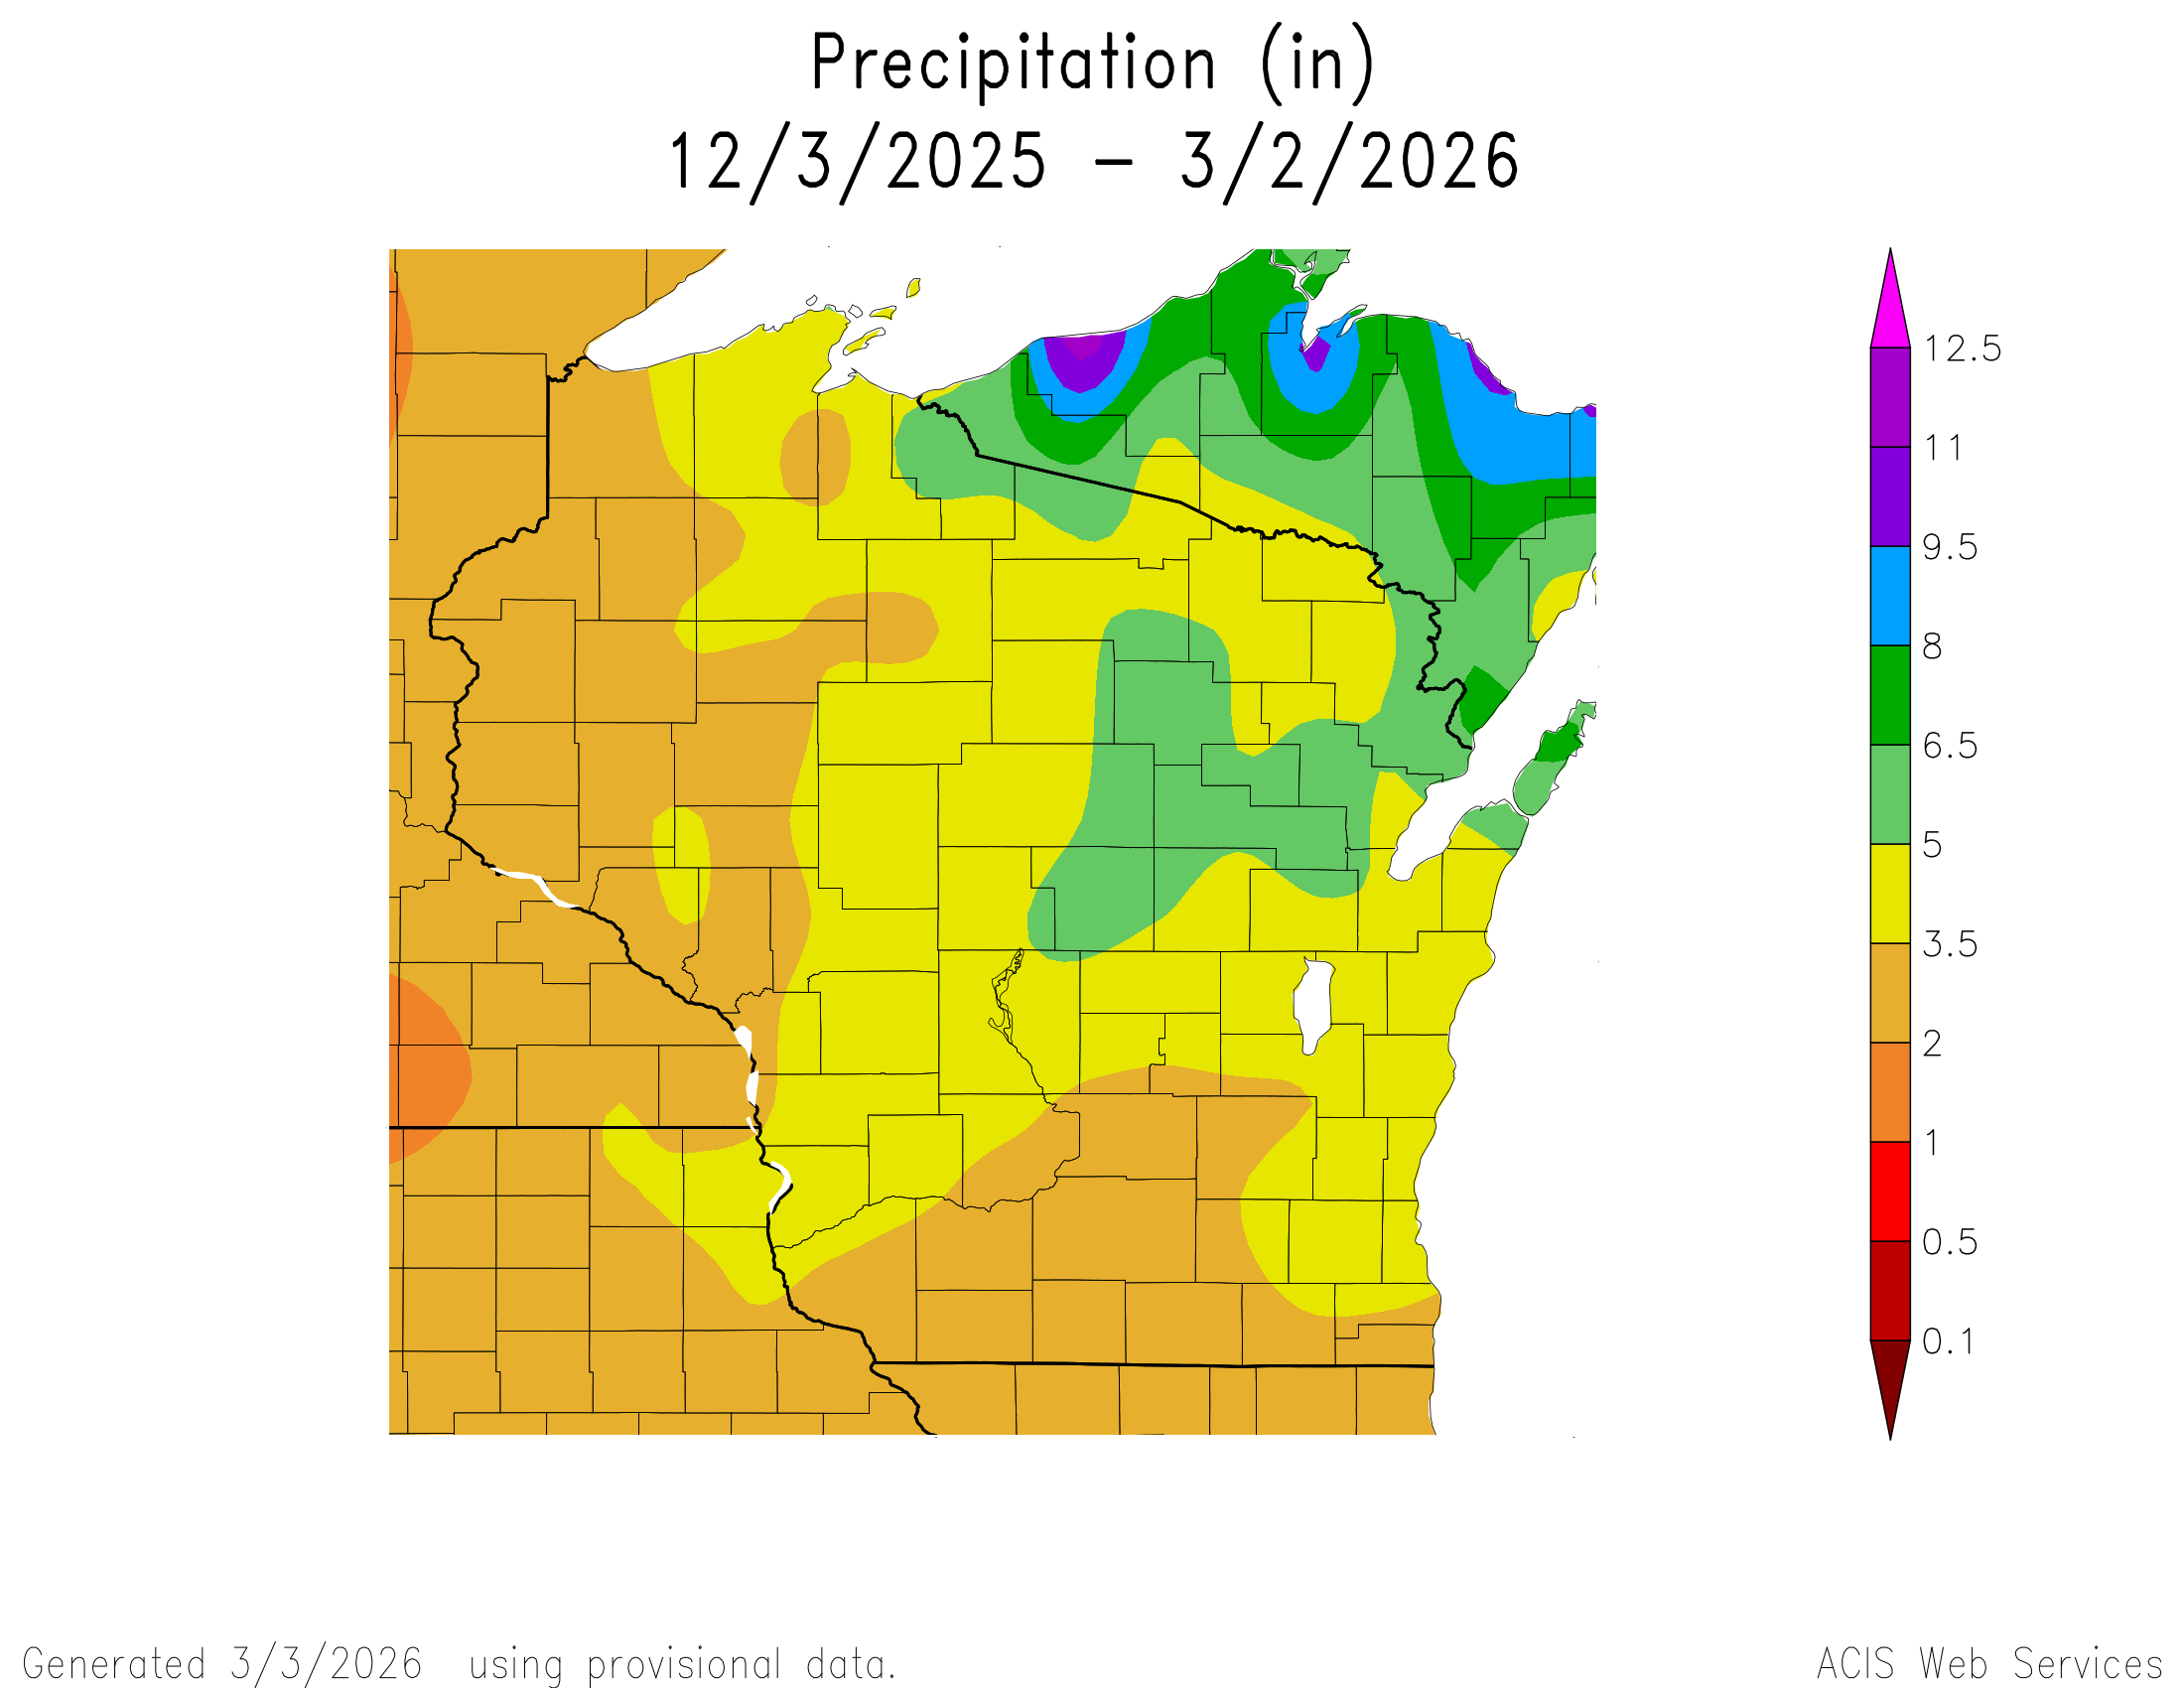
Image description: Precipitation map of Wisconsin and surrounding region showing rainfall totals in inches over a 90-day period. Northern Wisconsin received the most precipitation, with purple zones (11–12.5+ in.) near Lake Superior and blue zones (9.5–11 in.) across the northern tier. A broad green band (6.5–8 in.) stretches across central-north Wisconsin. Central Wisconsin shows yellow-green (5–6.5 in.). Southern and western Wisconsin, plus most of Minnesota and Iowa visible in the frame, show orange-brown tones indicating 2–3.5 in. A small red-orange area in the far southwest corner suggests under 1 in. Data is provisional, generated 3/3/2026 by ACIS Web Services.
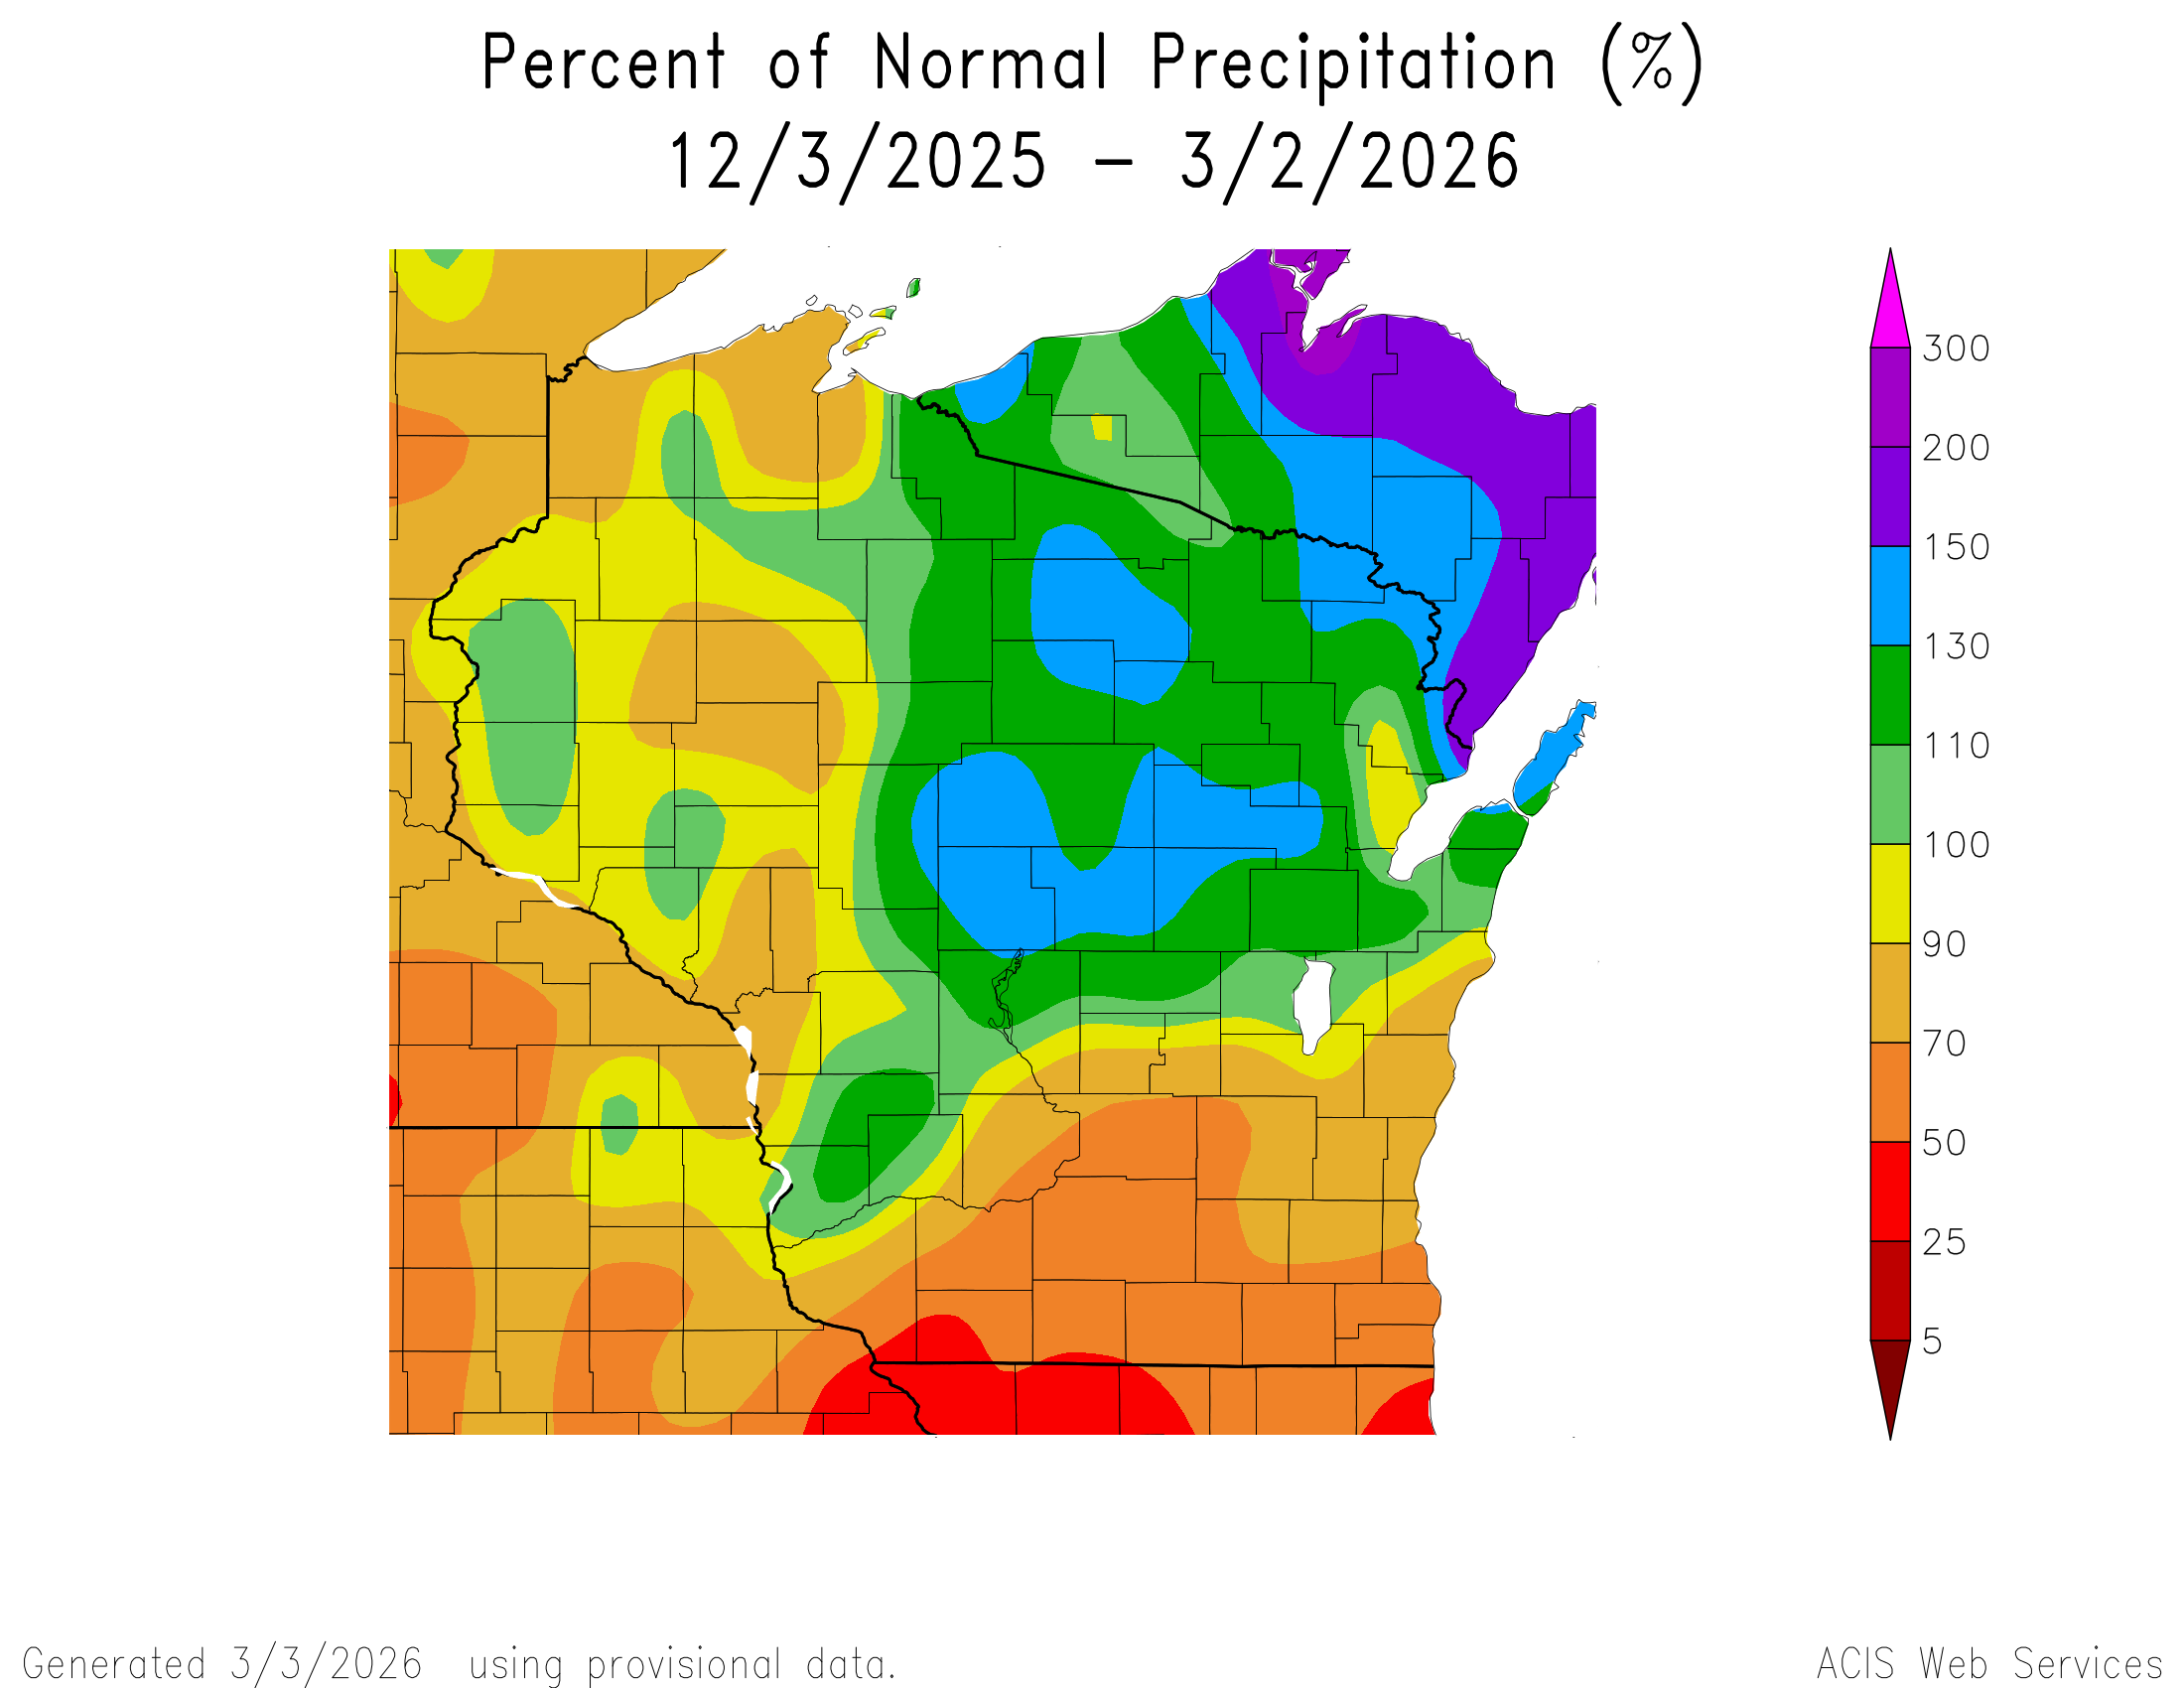
Image description: Precipitation map covering Wisconsin and surrounding states for the 3-month period ending March 2, 2026. Color scale ranges from red (5%) to magenta (300%+ of normal). Northeast Wisconsin shows 200–300%+ of normal precipitation (purple). Central and north-central Wisconsin shows 110–150% (green/blue). Western Wisconsin and eastern Minnesota show 90–100% (yellow/light green). Southern Wisconsin, southern Minnesota, northern Iowa, and northern Illinois show 50–70% of normal (orange). A small area in south-central Wisconsin/northern Illinois shows below 25% of normal (red). Generated March 3, 2026 using provisional data by ACIS Web Services.
90% of normal or less common across the south – 3.5” or less
Above normal across a large portion of north/northeast WI, as much as 130-150% of normal
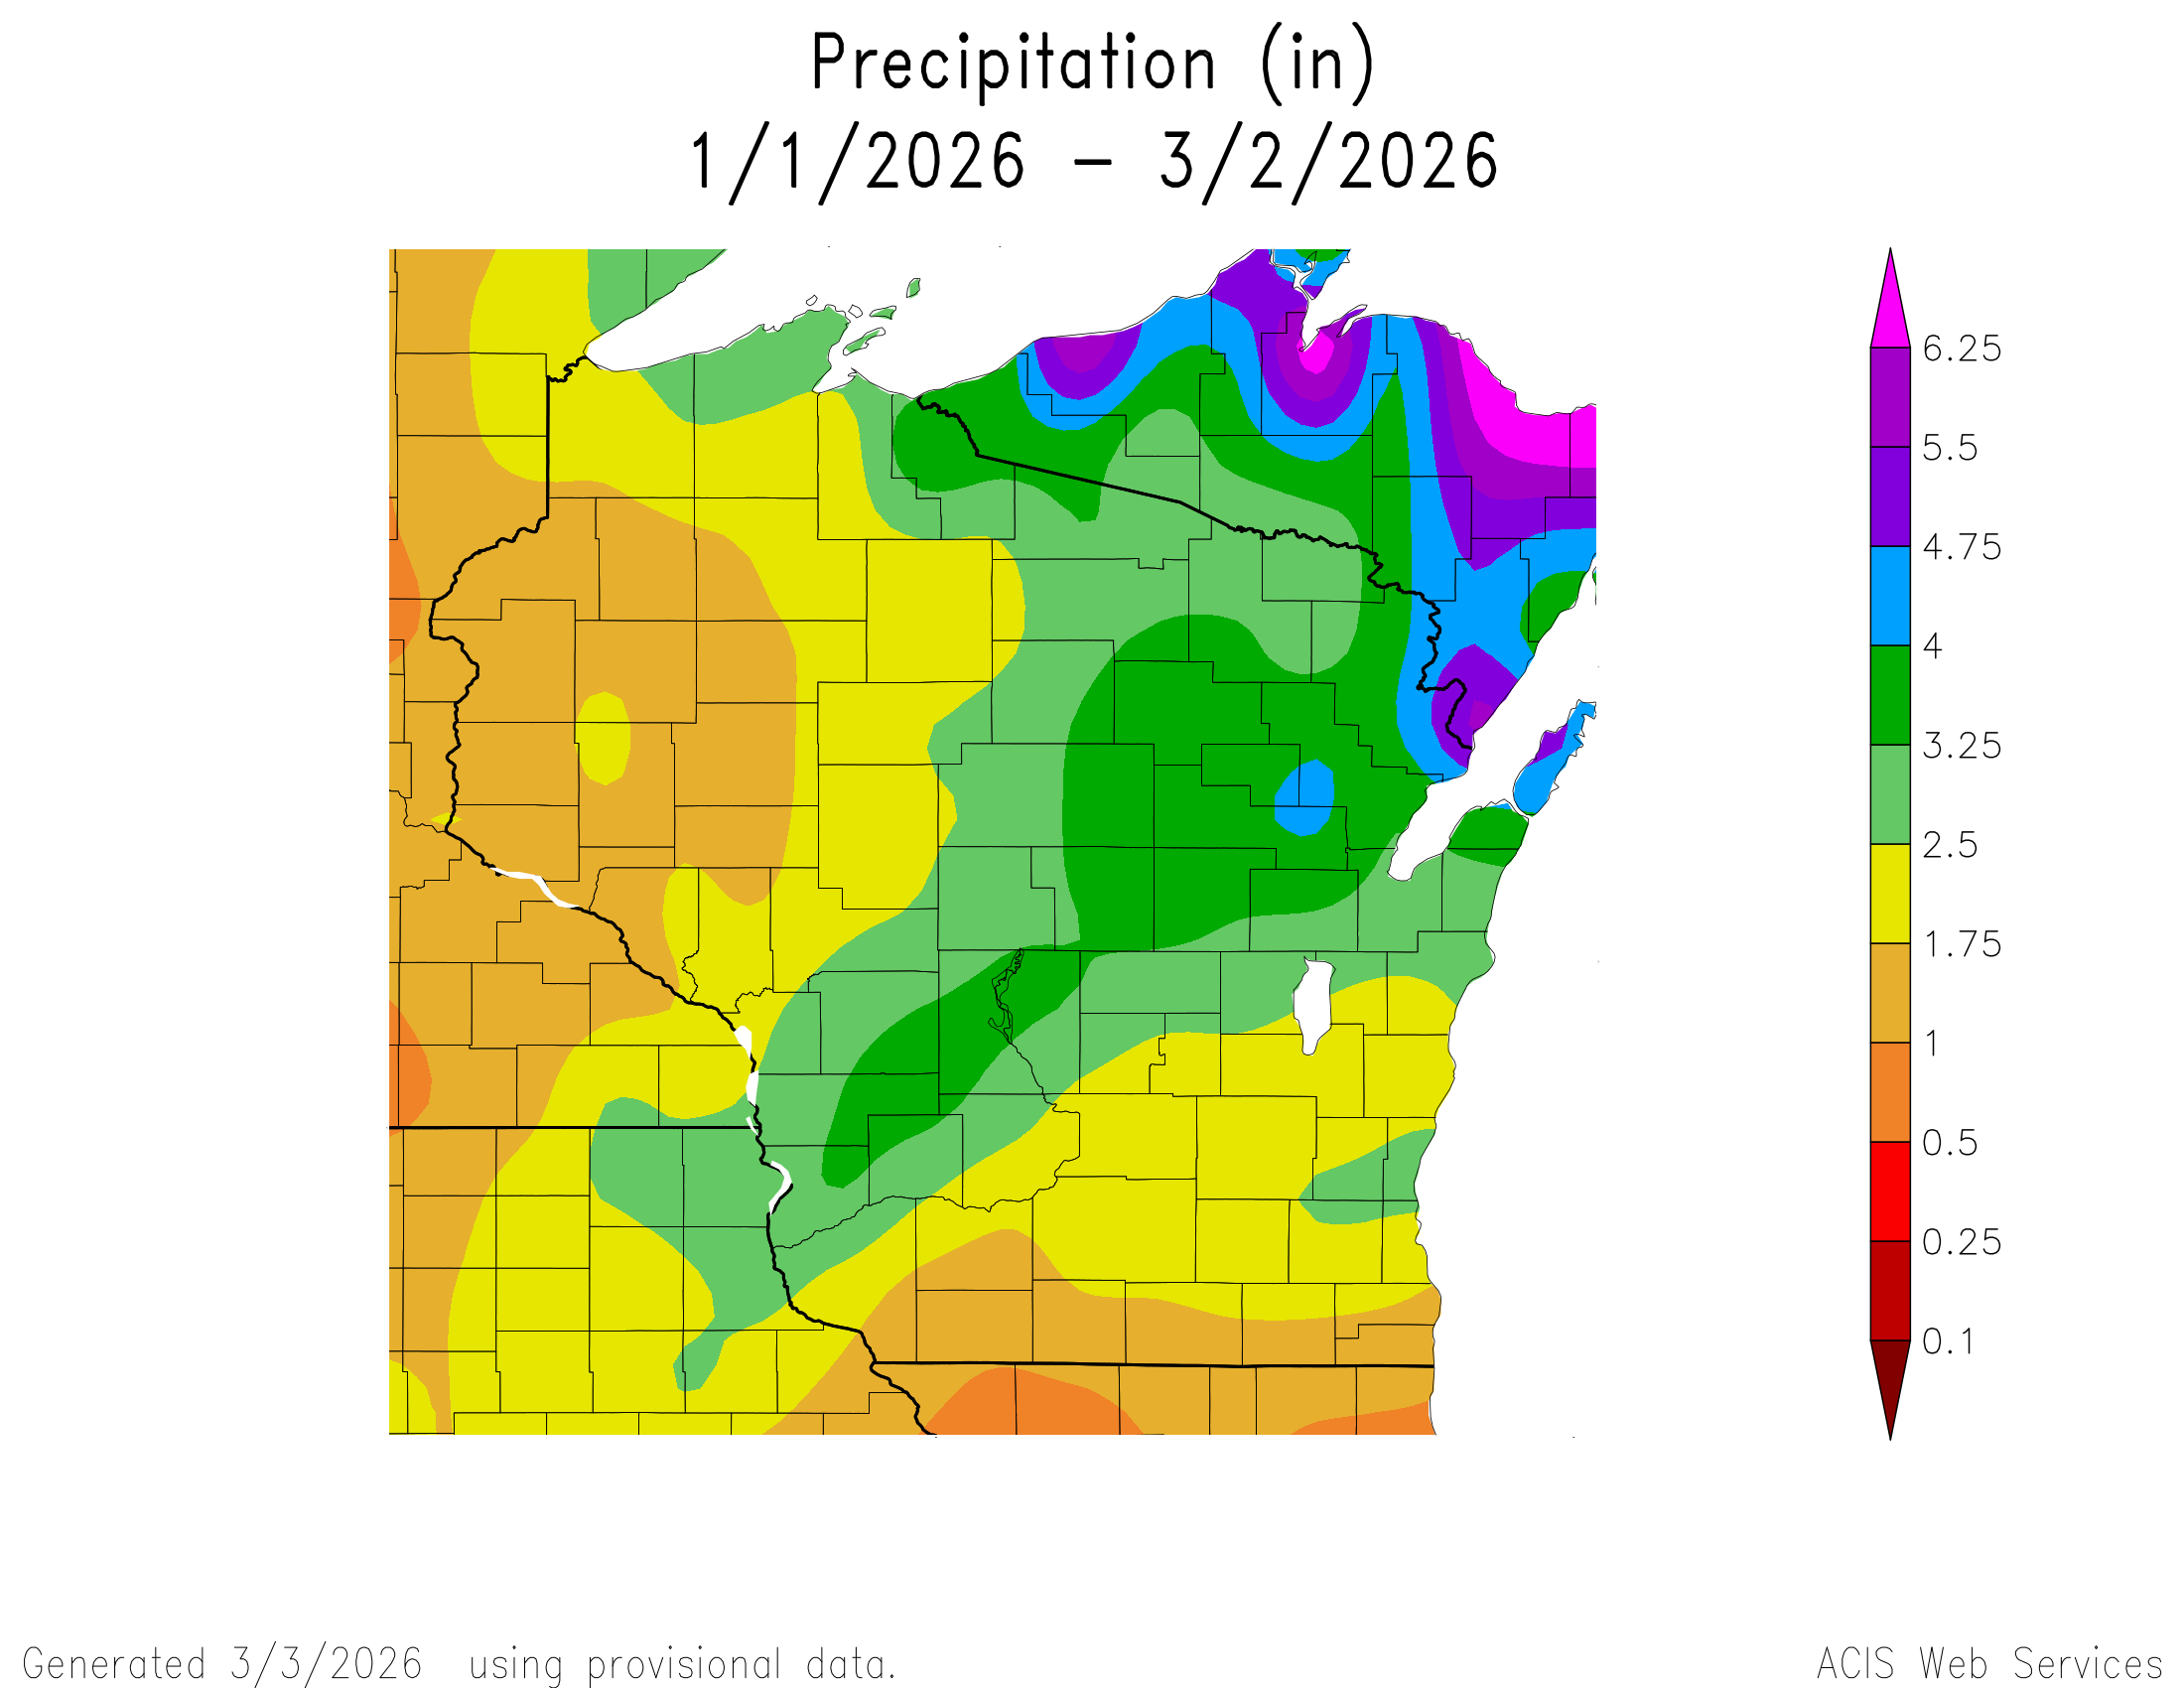
Image description: Choropleth map of Wisconsin showing cumulative precipitation in inches from January 1 to March 2, 2026, generated by ACIS Web Services using provisional data. A color scale ranging from red (0.1 in) through orange, yellow, green, blue, purple, to magenta (6.25 in) represents precipitation totals. The northwest region received the least precipitation (roughly 0.5–1.75 in, shown in orange/yellow). Central and north-central Wisconsin received moderate-to-high amounts (3.25–4 in, dark green). The northeast corner, particularly the Lake Superior shoreline area, received the highest totals, exceeding 5.5–6.25 inches (purple/magenta). Southern Wisconsin shows mostly 1.75–2.5 inches (yellow-green). State and county boundaries are outlined in black.
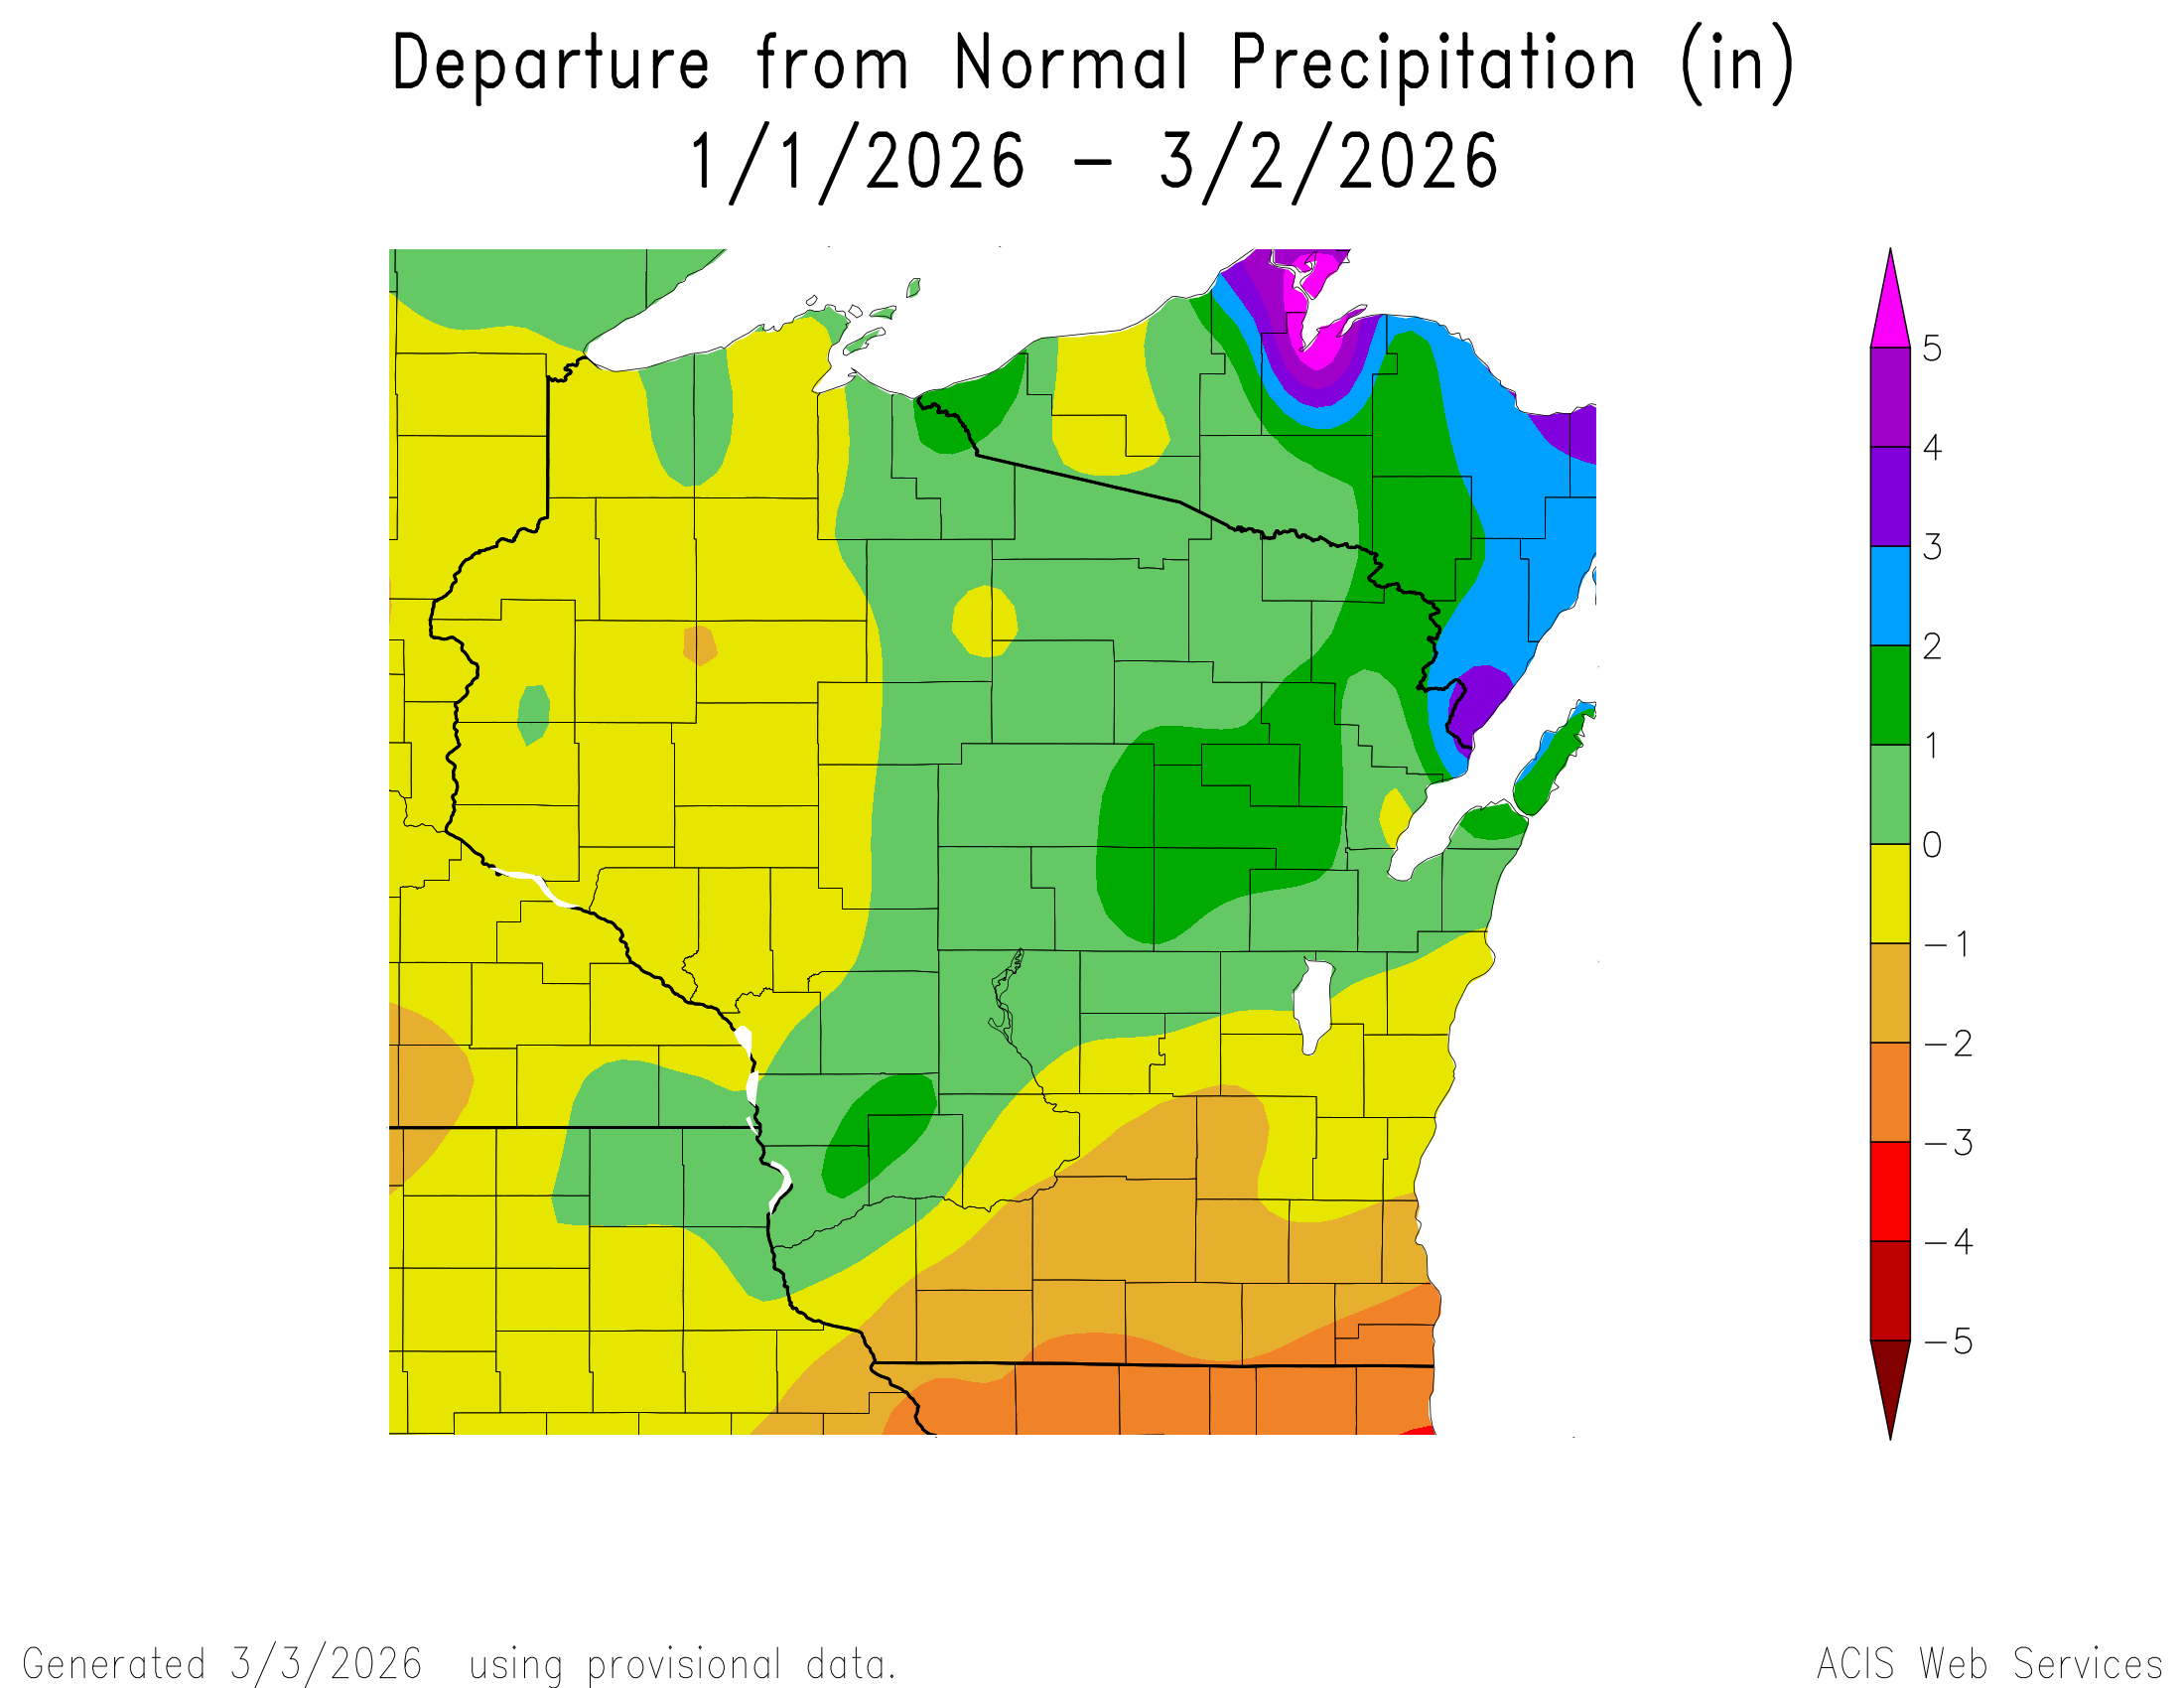
Image description: Color-coded county map of Wisconsin showing departure from normal precipitation (inches) from 1/1/2026 to 3/2/2026. The northeastern region shows the greatest above-normal precipitation, with areas exceeding +4 to +5 inches (blue to magenta). Central and east-central Wisconsin shows +1 to +2 inches above normal (green). Western Wisconsin is near normal to slightly below (yellow, 0 to −1 inches). Southern Wisconsin shows below-normal precipitation of −2 to −3 inches (orange), with the far southeast approaching −4 to −5 inches (red). Data is provisional, generated 3/3/2026 by ACIS Web Services.
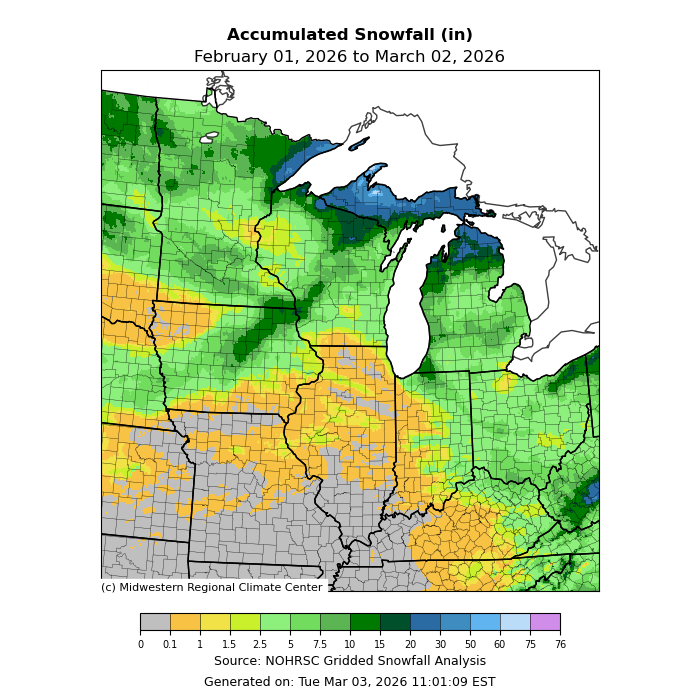
Image description: Map showing accumulated snowfall (inches) across the Midwest, February 1–March 2, 2026. Northern Minnesota and Wisconsin received the heaviest snowfall (20–50+ inches, shown in dark green and blue). Michigan’s Upper Peninsula and areas around Lake Superior and Lake Michigan show 30–76 inches (blue/purple). Central states including Iowa, Illinois, and Indiana received 5–15 inches (yellow-green). Missouri, Kansas, and southern Illinois show 0–2.5 inches (gray/orange). Color scale ranges from gray (0 inches) through yellow, green, blue, to pink (76 inches). Source: NOHRSC Gridded Snowfall Analysis, generated March 3, 2026.
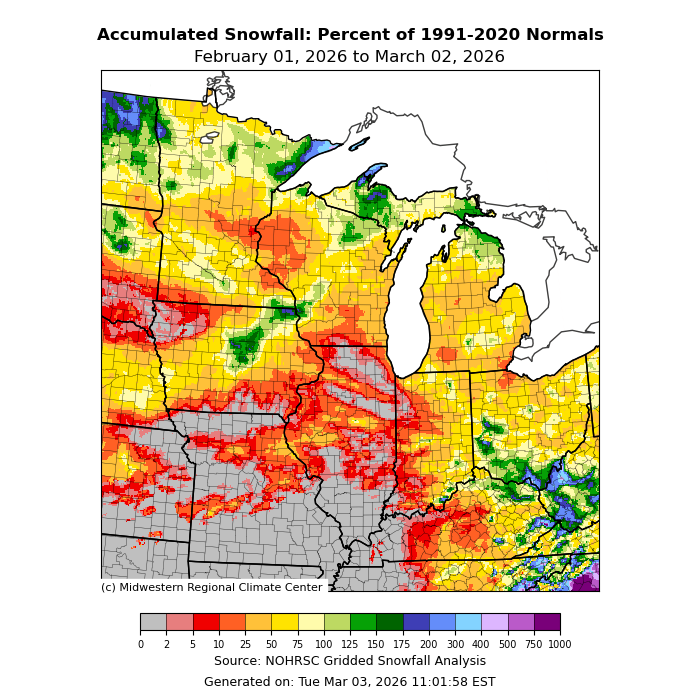
Image description: Map of accumulated snowfall as a percent of 1991–2020 normals, Feb 1–Mar 2, 2026, across the Midwest and Great Lakes region. Most of Wisconsin, Minnesota, Iowa, Illinois, Indiana, and Ohio show 50–125% of normal snowfall (yellow/orange tones). Pockets of above-normal snowfall (green/blue, 150–400%) appear in northern Minnesota, parts of Michigan’s Upper Peninsula, and the Ohio/Pennsylvania border region. Below-normal areas (red/orange, 25–75%) dominate Missouri, Kansas, Nebraska, and southern Illinois. Gray areas (primarily Kansas, Missouri, Arkansas) indicate 0–2% of normal or no measurable snow. A color scale ranges from 0 to 1000% of normal. Source: NOHRSC Gridded Snowfall Analysis; generated March 3, 2026.
Well below normal snowfall across most of Wisconsin (10-50% of normal)- 5” or less
Most below normal near to the Illinois border – 1” or less since February 1
15-20” in far northern counties, which was 125%+ of normal
Pocket of 10-15” in Crawford, Vernon, & Monroe Counties from a winter storm on February 20.
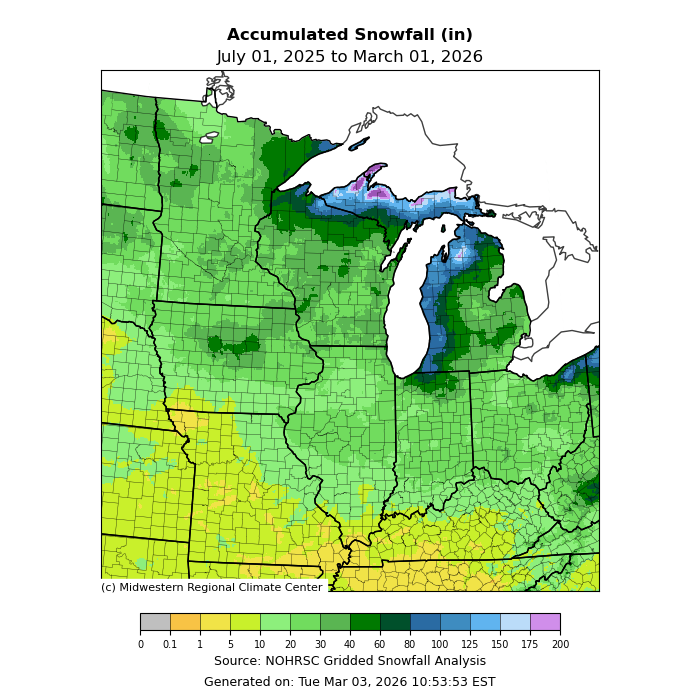
Image description: NOHRSC gridded snowfall analysis map of the Midwestern U.S. showing season-to-date accumulated snowfall in inches from July 1, 2025 to March 1, 2026. A color scale ranging from gray (0 in) through yellow, green, blue, and purple (200+ in) indicates snowfall totals. Northern Minnesota and the Upper Peninsula of Michigan show the highest accumulations (100–200+ in), displayed in blue and purple. Wisconsin and the northern Lower Peninsula of Michigan show 60–100 inches (dark green to blue). Central Midwest states including Iowa, Illinois, Indiana, and Ohio show moderate totals of 20–60 inches (medium green). Southern portions of the map covering Missouri, Kentucky, and Tennessee show the lowest totals of 0–20 inches (yellow). Lake-effect snow bands are visible along the southern and eastern shores of Lake Superior and Lake Michigan. Source: Midwestern Regional Climate Center. Generated March 3, 2026.
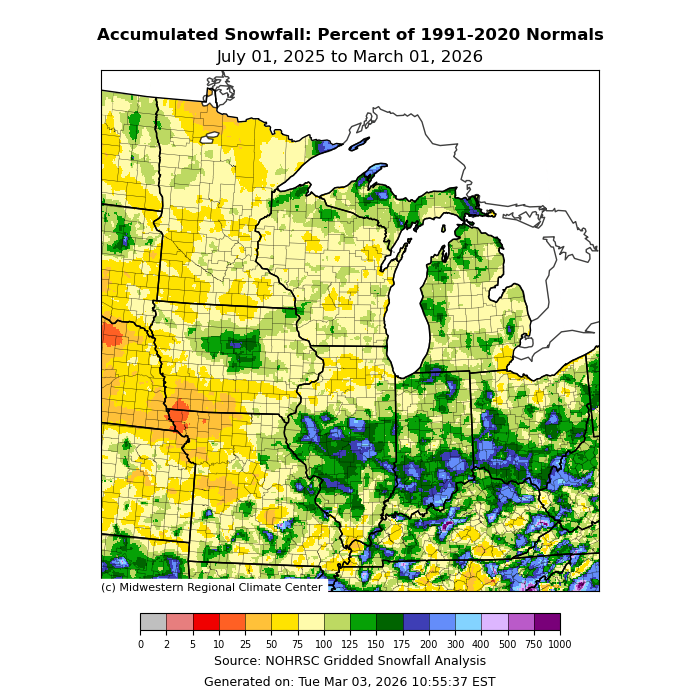
Image description: Map of the Midwest showing accumulated snowfall as a percent of 1991–2020 normals, July 1, 2025 to March 1, 2026. Most of the region shows 50–125% of normal (yellow-green). Notable exceptions: parts of western Nebraska/Kansas show well below normal (red/orange, 0–25%); southern Indiana, Ohio, and Kentucky show above normal (green to blue, 150–400%+). Generated March 3, 2026 by NOHRSC/Midwestern Regional Climate Center.
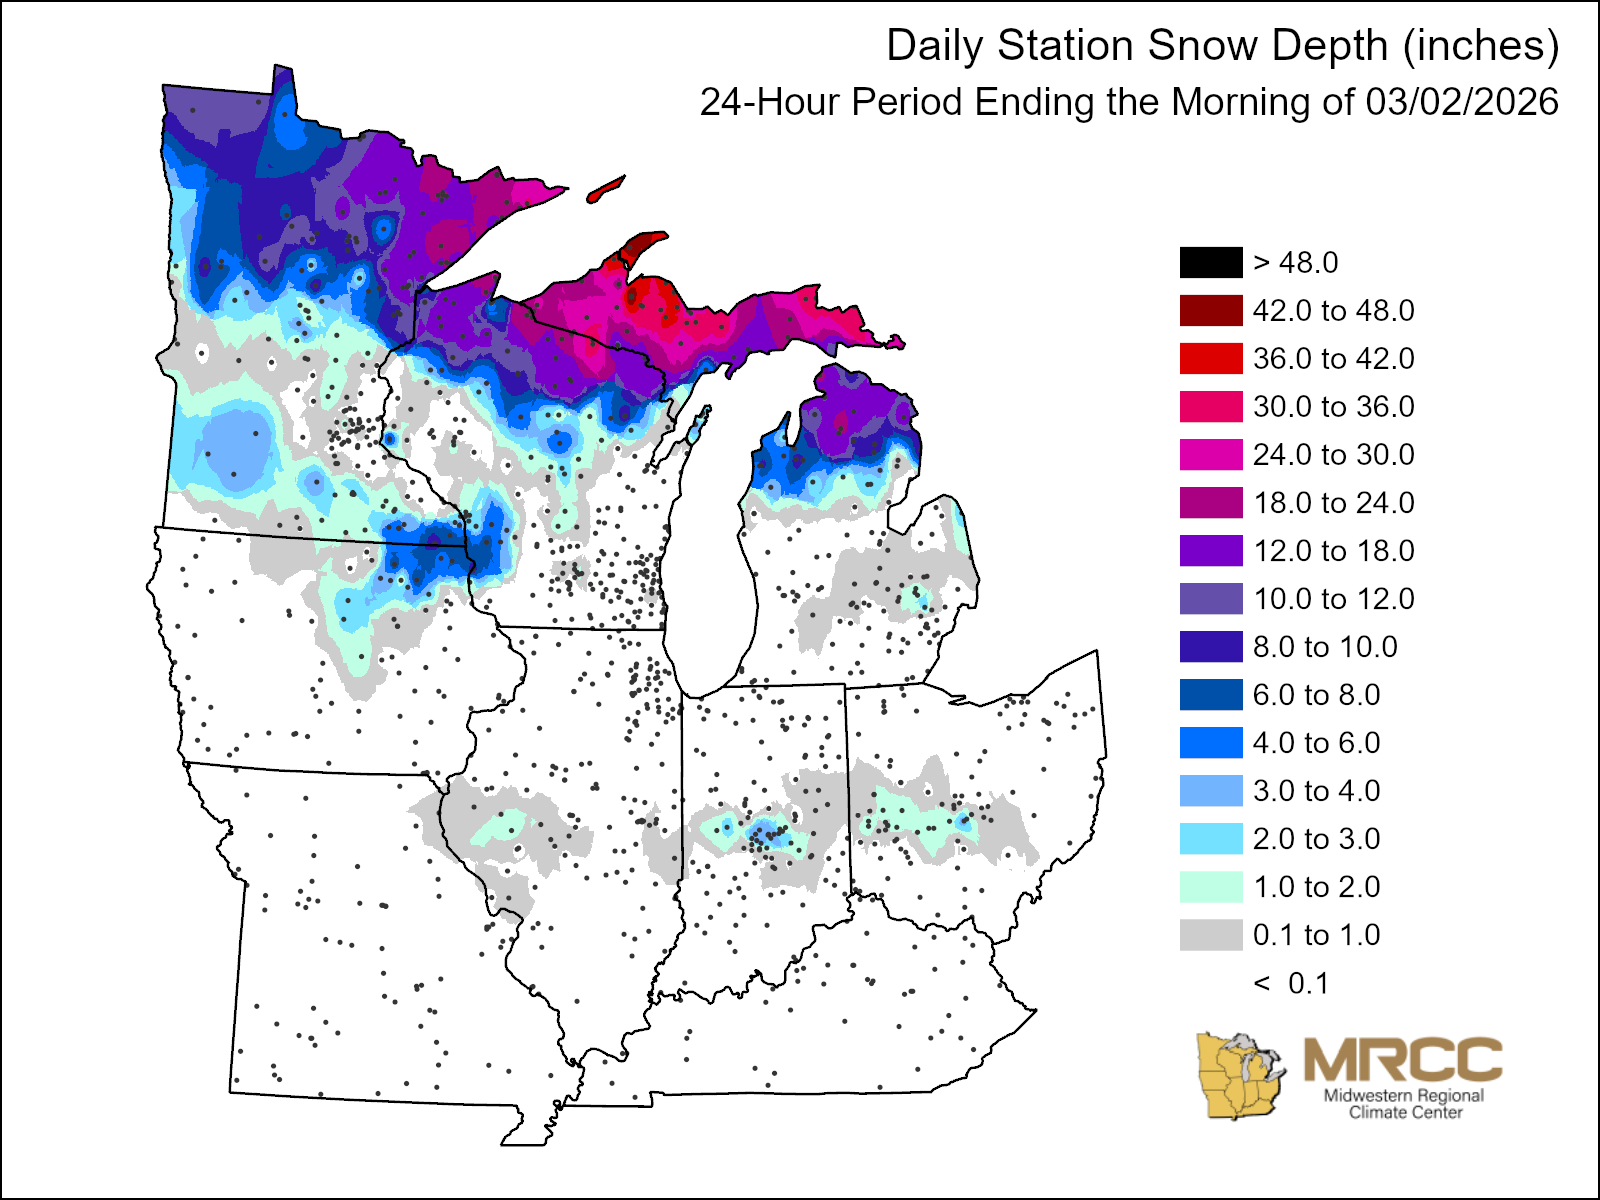
Image description: Midwestern Regional Climate Center map showing daily station snow depth in inches for the 24-hour period ending the morning of March 2, 2026. The map covers the Upper Midwest including Minnesota, Wisconsin, Michigan, Iowa, Illinois, Indiana, and Ohio. The deepest snow concentrations (30–48+ inches, shown in red/magenta) appear across northern Wisconsin and Michigan’s Upper Peninsula. Northern Minnesota shows 12–24 inches (purple/blue tones). Central Wisconsin and the northern Lower Peninsula of Michigan show 6–12 inches (medium blue). Scattered areas of 1–6 inches (light blue/cyan) appear in parts of central Minnesota, Iowa, and central Illinois/Indiana/Ohio. Most of Iowa, Illinois, Indiana, and Ohio show 2 inches or less snow with many areas with no snow reported.
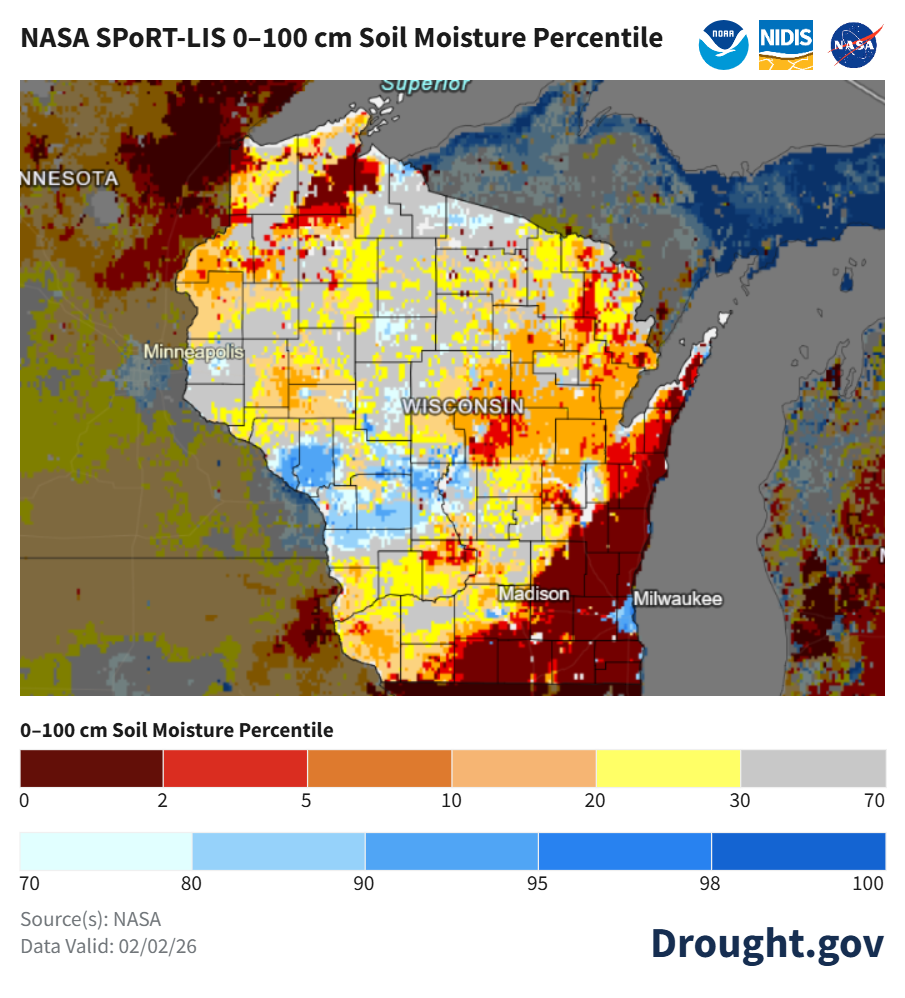
Image description: NASA SPoRT-LIS map of the upper Midwest showing 0–100 cm soil moisture percentiles valid February 2, 2026. Wisconsin displays highly variable conditions: south and southeast regions (including Milwaukee and Madison) show extreme dryness at the 0–2nd percentile (dark red/maroon). North-central Wisconsin shows near-normal to slightly wet conditions (light blue, 70–90th percentile). Northeast Wisconsin along Lake Michigan shows extremely wet conditions at the 98–100th percentile (dark blue). Minnesota to the west is predominantly very dry (0–5th percentile). Lake Superior’s south shore appears in the 95–100th percentile range. The color scale ranges from dark maroon (0) through red, orange, and yellow (dry, 2–30th percentile), gray (near normal, 30–70th), and light to dark blue (wet, 70–100th percentile). Logos for NOAA, NIDIS, and NASA appear in the upper right. Data sourced from Drought.gov.
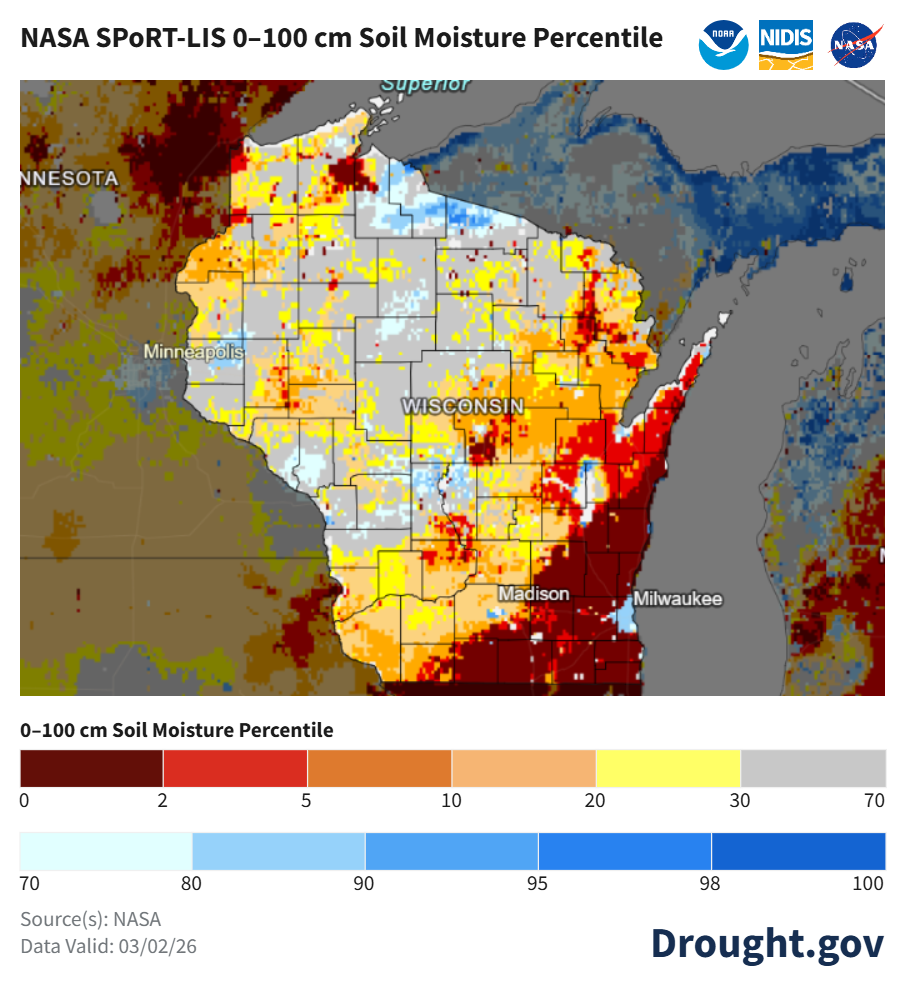
Image description: NASA SPoRT-LIS 0–100 cm Soil Moisture Percentile map valid March 2, 2026, showing Wisconsin and surrounding states. The color scale runs from dark brown (percentile 0–2, extremely dry) through red, orange, and yellow to gray (30–70, near normal), then light to dark blue (70–100, very wet). Southern and eastern Wisconsin, including areas near Madison and Milwaukee, show predominantly dark brown and red tones indicating soil moisture at the 0–5th percentile — extreme drought conditions. Central Wisconsin is mixed orange and yellow (5–20th percentile). Northern Wisconsin shows gray and light blue tones (near normal to slightly wet). Lake Superior and Lake Michigan shoreline areas appear dark blue (90–100th percentile). Source: NASA. Logos for NOAA, NIDIS, and NASA appear in the upper right. Data sourced from Drought.gov.
Minimal change over the last 30 days. Soil moisture levels are nearest to normal in the west-central and north-central counties.
Abnormal dryness remains in place across the east and southeast counties.
Image description: Map of Wisconsin showing 4-inch depth soil moisture readings from monitoring stations, displayed as colored dots. Values range from 0.02 to 0.41 m³/m³. A color-coded legend spans 11 categories from dark red (0.00–0.05) through yellow-green (0.25–0.30) to dark green (greater than 0.50). Western Wisconsin stations predominantly show low moisture (0.02–0.12, dark red/brown dots). Central and eastern regions show moderate moisture (0.12–0.20, olive/tan dots). Notable high-moisture stations include Ashland area (0.41), near Sparta (0.39), and near Baraboo (0.37–0.39). Several stations are marked N/A. Lake Michigan borders the eastern edge.
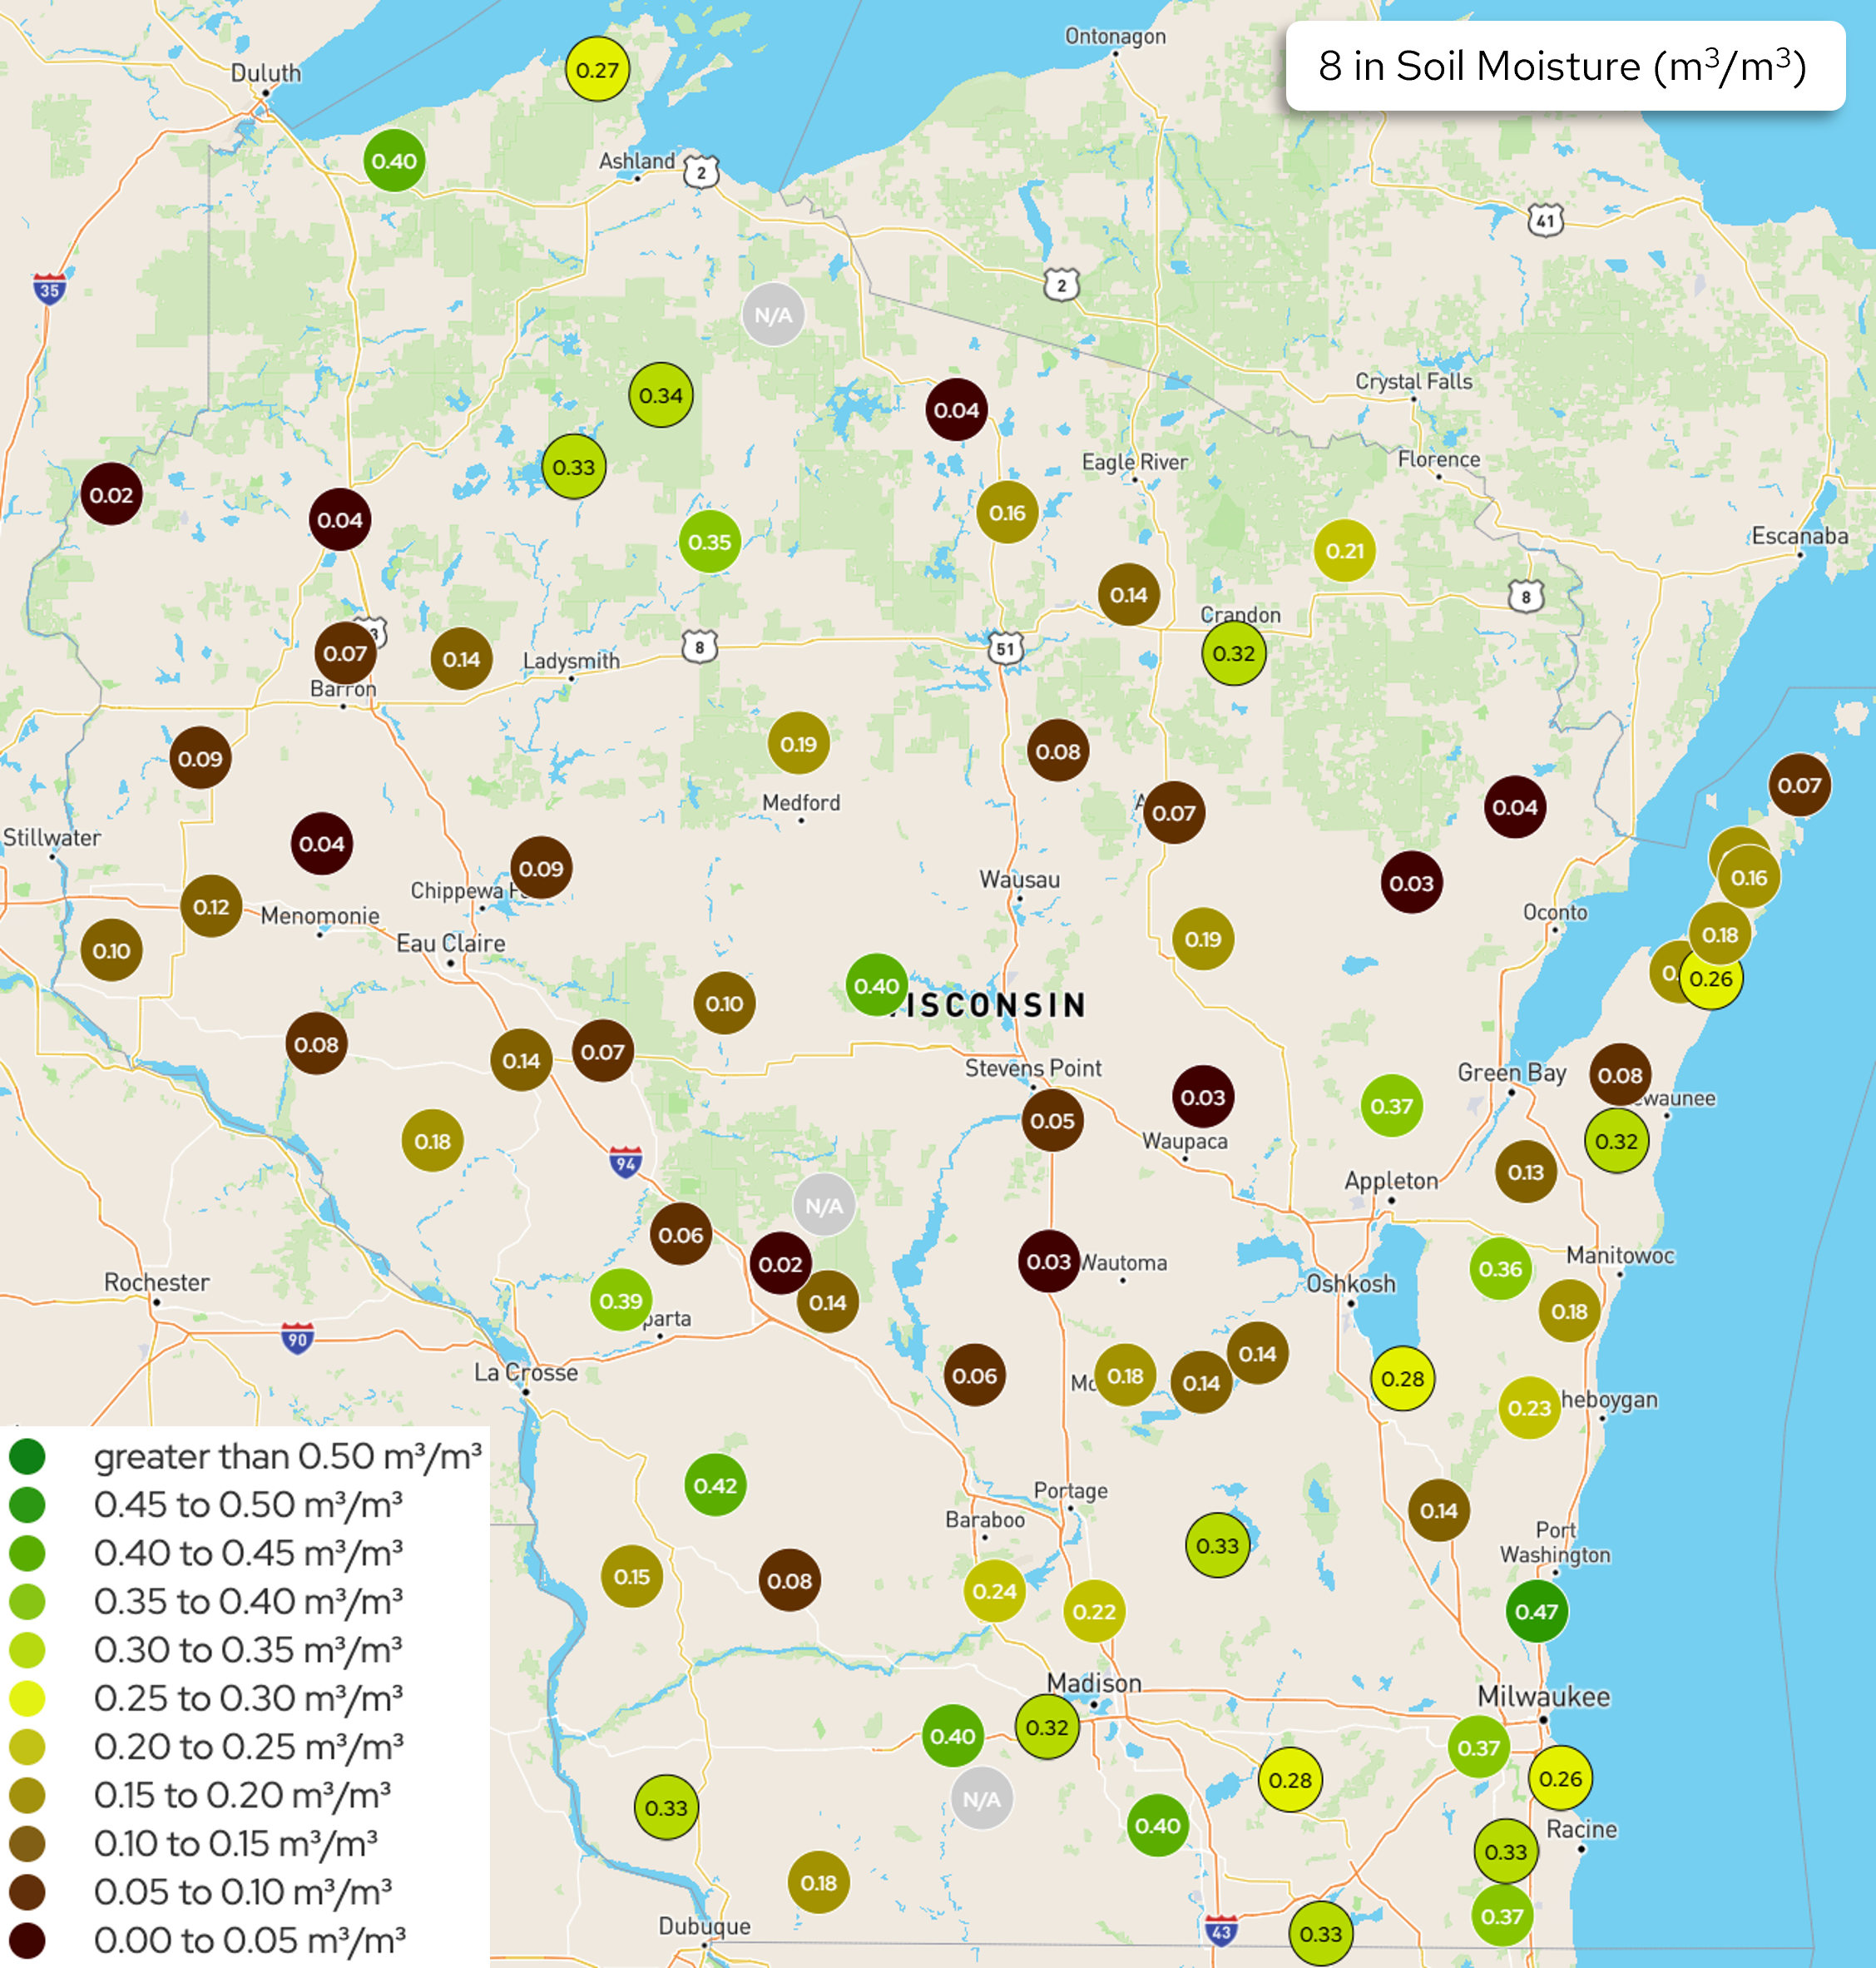
Image description: A color-coded dot map of Wisconsin displaying 8-inch depth soil moisture sensor readings in m³/m³. Dots range from dark red (0.00–0.05) through brown, olive, yellow-green, to dark green (above 0.50). Most readings cluster in the 0.02–0.42 range. Drier conditions (dark red/brown dots, values 0.02–0.09) appear predominantly in northwestern and north-central Wisconsin. Wetter conditions (yellow-green to green dots, values 0.32–0.47) are concentrated in central, eastern, and southeastern Wisconsin, including areas near Madison, Milwaukee, and Green Bay. Several stations display “N/A.” A legend in the lower left defines 11 color categories in 0.05 m³/m³ increments.
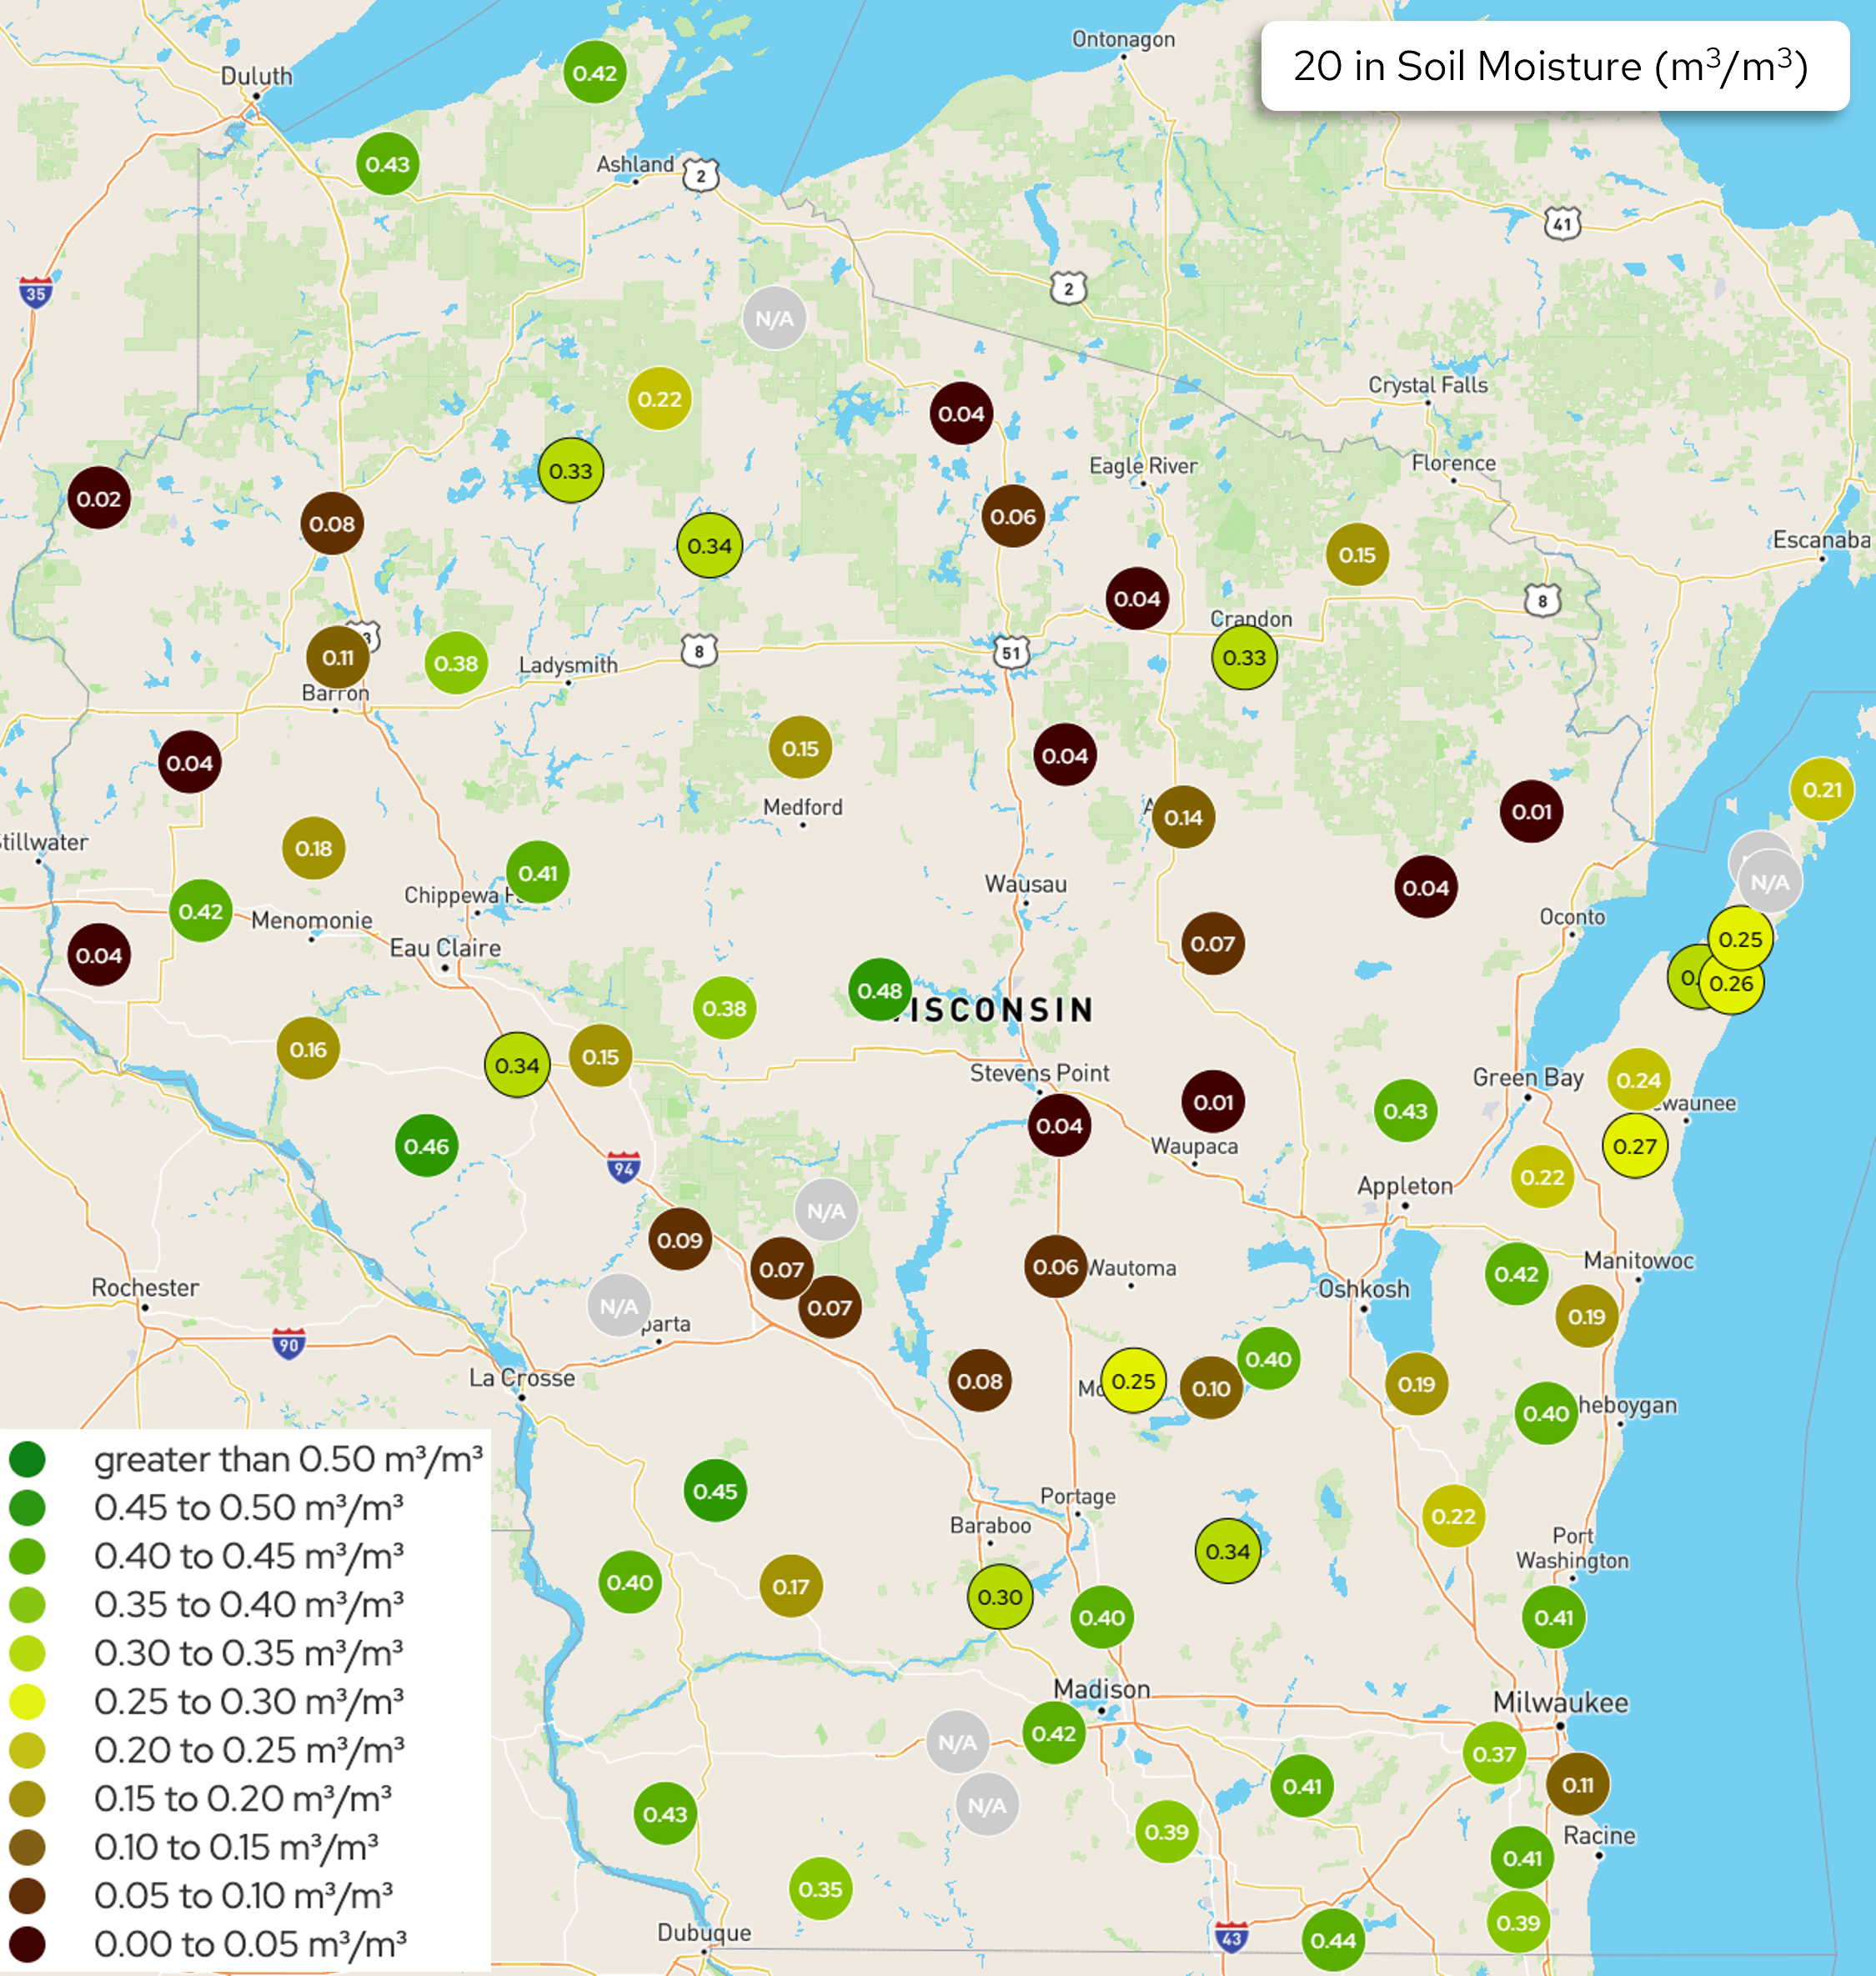
Image description: Map of Wisconsin showing 20-inch depth soil moisture readings at weather station locations, displayed as colored circles with numeric values ranging from 0.01 to 0.48 m³/m³. A color-coded legend ranges from dark red (0.00–0.05) through olive/yellow-green to dark green (greater than 0.50). Northern and central Wisconsin stations show a mix of very low readings (0.01–0.09, dark red) and moderate-to-high readings (0.33–0.48, green). Southern and eastern Wisconsin stations trend moderate-to-high (0.19–0.44). Several stations are marked N/A. Highest visible value is 0.48 near Stevens Point; lowest is 0.01 near Waupaca and Oconto areas.
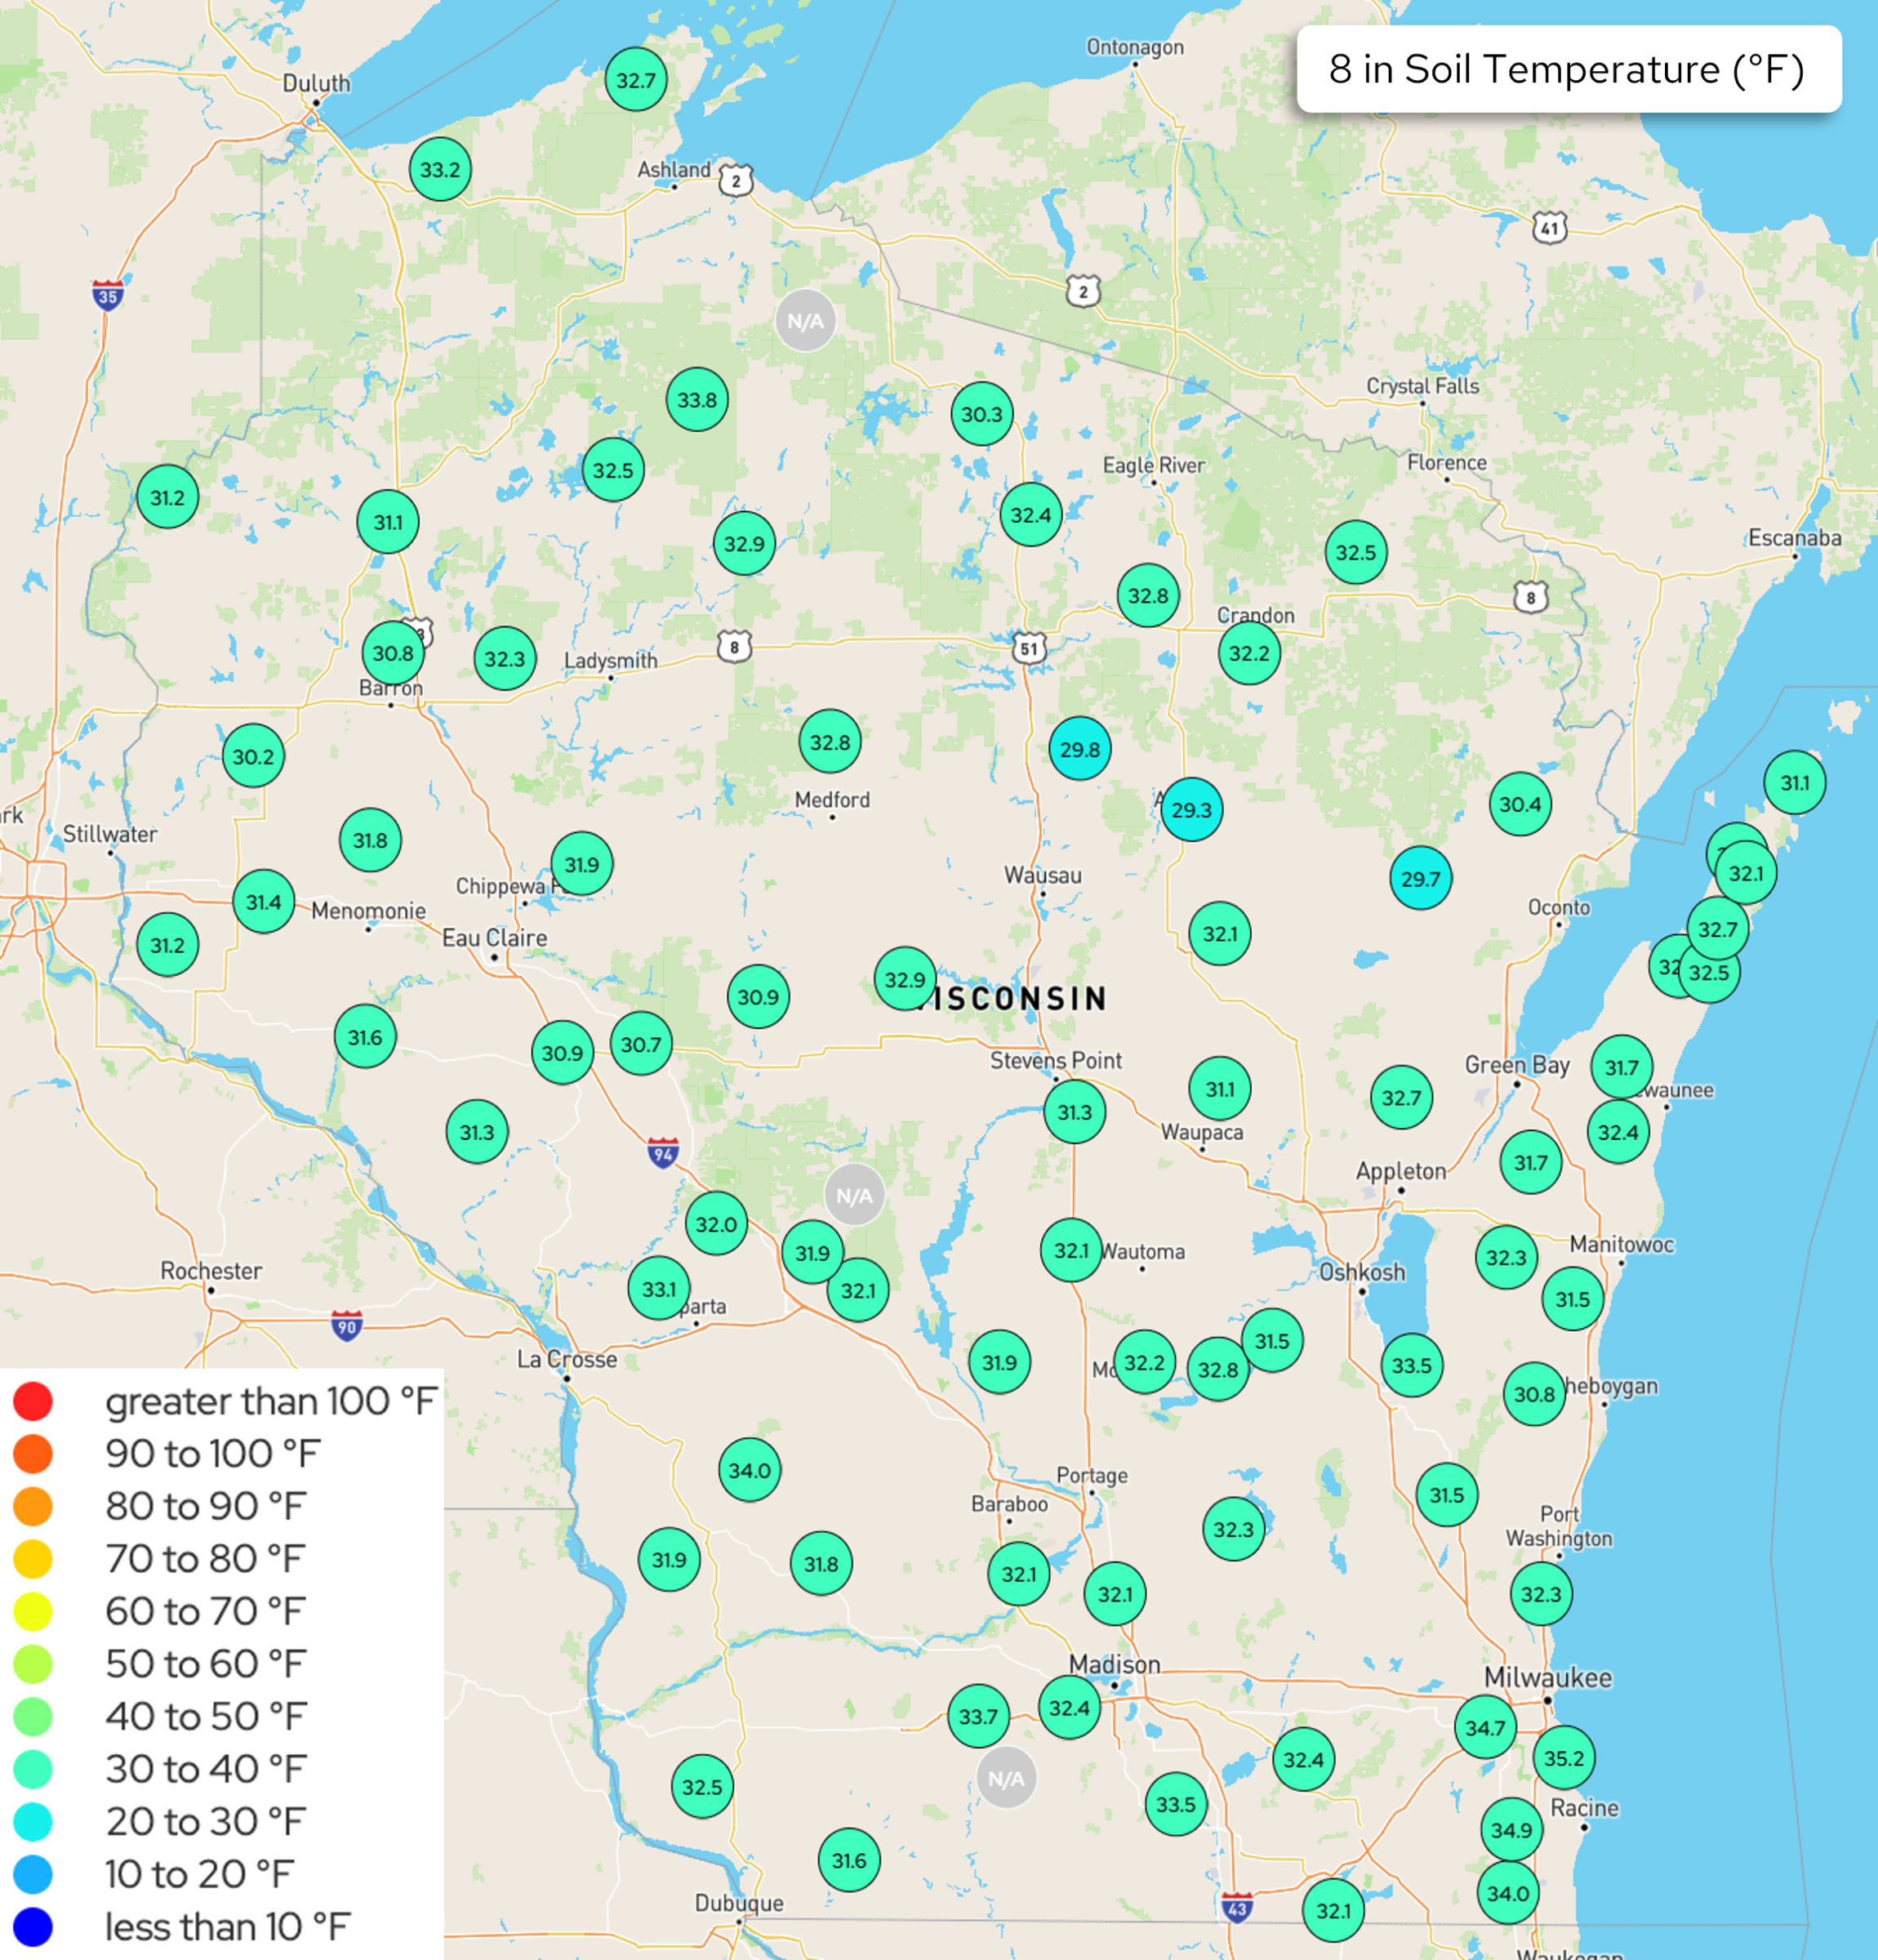
Maps showing soil temperature conditions on March 3rd @ 12:00 pm.
Change in soil moisture from February 3rd (Start) to March 2nd (End).
Units of map & change values are {Volume of water}/{Volume of soil}.
Research Farm
County
Total Precipitation (in.)
4″ Start
4″ End
8″ Start
8″ End
20″ Start
20″ End
Arlington
Columbia
0.45
0.13
0.17
0.14
0.22
0.39
0.40
Black River Falls
Jackson
0.12
0.02
0.05
0.02
0.07
0.02
0.10
Dairy Forage ARS
Sauk
0.46
0.09
0.20
0.11
0.24
0.28
0.30
Hancock
Waushara
0.57
0.01
0.03
0.01
0.07
0.01
0.05
Kemp
Oneida
0.94
0.13
0.17
0.13
0.17
0.05
0.06
Lancaster
Grant
0.36
0.08
0.22
0.10
0.33
0.42
0.43
Marshfield
Marathon
0.37
0.10
0.11
0.41
0.41
0.48
0.48
O.J. Noer (Turfgrass)
Dane
0.28
0.09
0.19
0.11
0.32
0.42
0.42
Peninsular
Door
1.59
0.08
0.21
0.09
0.19
0.23
0.25
Rhinelander
Oneida
0.33
0.08
0.21
0.09
0.14
0.05
0.04
Spooner
Washburn
0.54
0.06
0.06
0.04
0.04
0.11
0.12
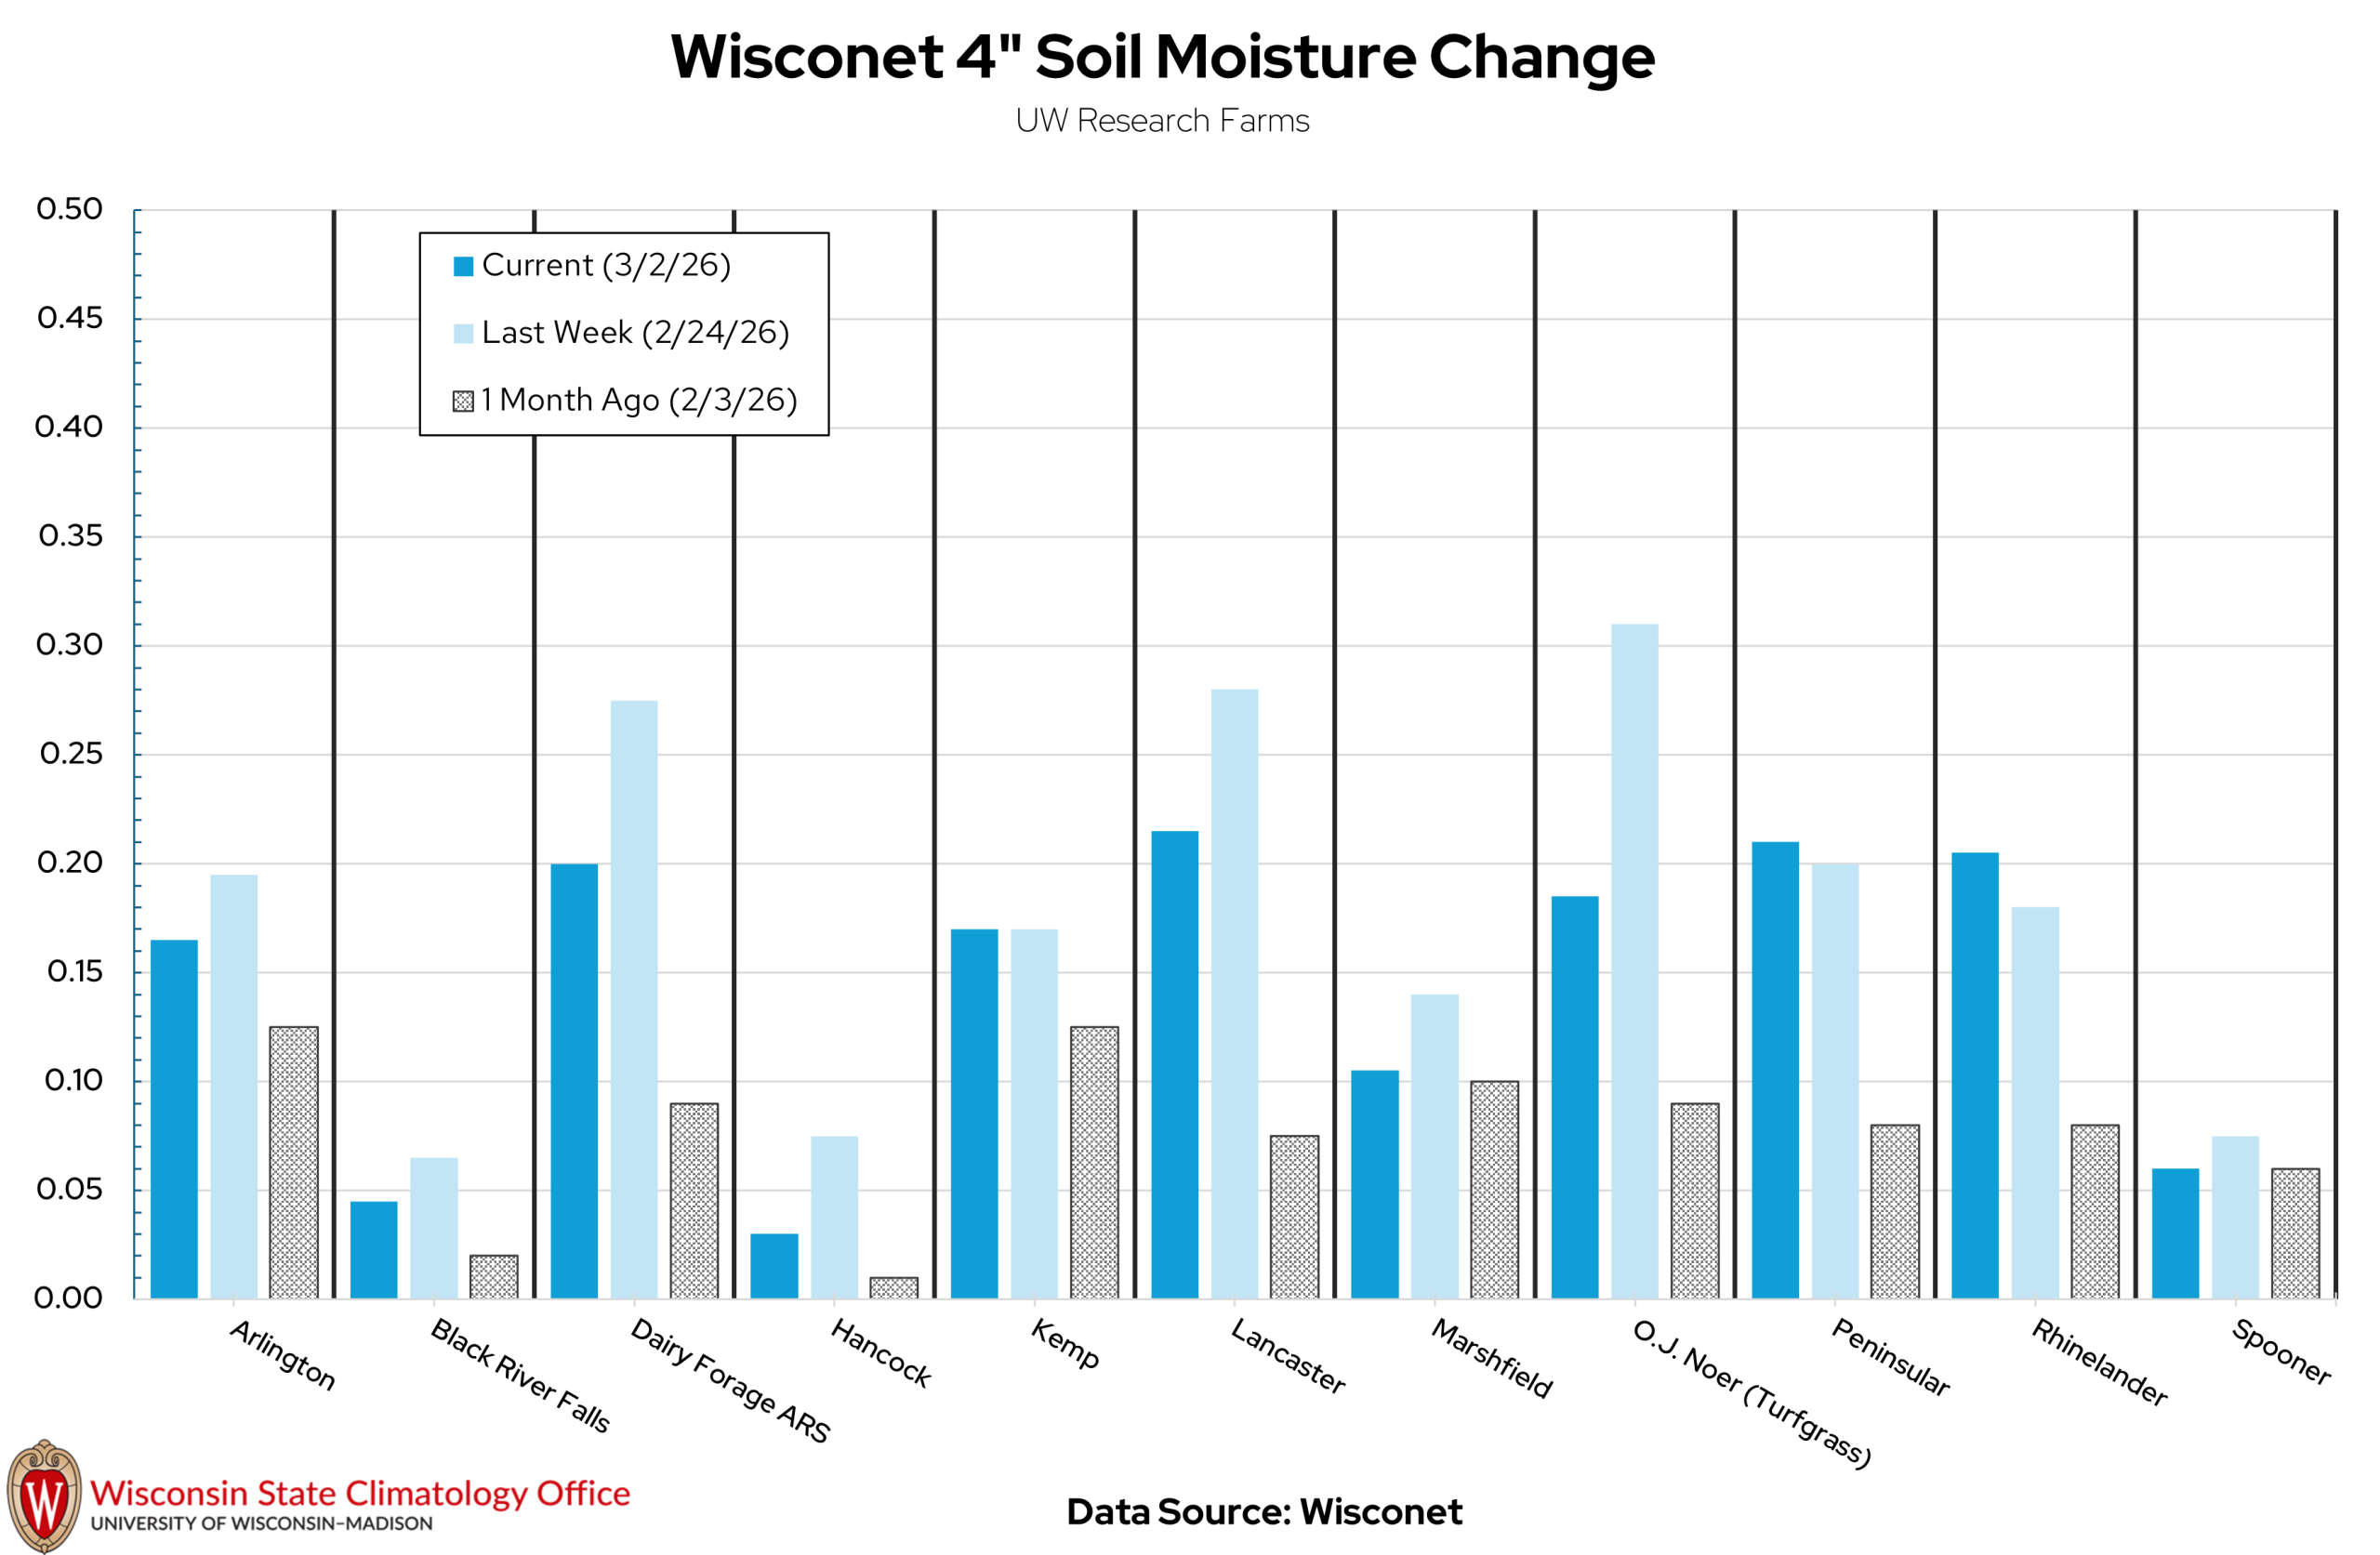
Image description: Bar chart titled “Wisconet 4″ Soil Moisture Change” from UW Research Farms, sourced from Wisconet. Three grouped bars per location represent soil moisture values (scale 0.00–0.50) for: Current (3/2/26, dark blue), Last Week (2/24/26, light blue), and 1 Month Ago (2/3/26, gray hatched). 12 UW Research Farm locations are shown along the x-axis. Most locations show higher moisture last week versus current, with notably lower readings one month ago across all sites.
Research Farm
Current 4″ Soil Moisture
Last Week’s 4″ Soil Moisture
1 Month Ago 4″ Soil Moisture
Arlington
0.165
~0.195
~0.125
Black River Falls
~0.045
~0.065
~0.020
Dairy Forage ARS
~0.200
~0.275
~0.090
Hancock
~0.030
~0.075
~0.010
Kemp
~0.170
~0.170
~0.125
Lancaster
~0.215
~0.280
~0.075
Marshfield
~0.105
~0.140
~0.100
O.J. Noer (Turfgrass)
~0.185
~0.310
~0.090
Peninsular
~0.210
~0.200
~0.080
Rhinelander
~0.205
~0.180
~0.080
Spooner
~0.060
~0.075
~0.060
Most locations show higher moisture last week versus current, with notably lower readings one month ago across all sites.
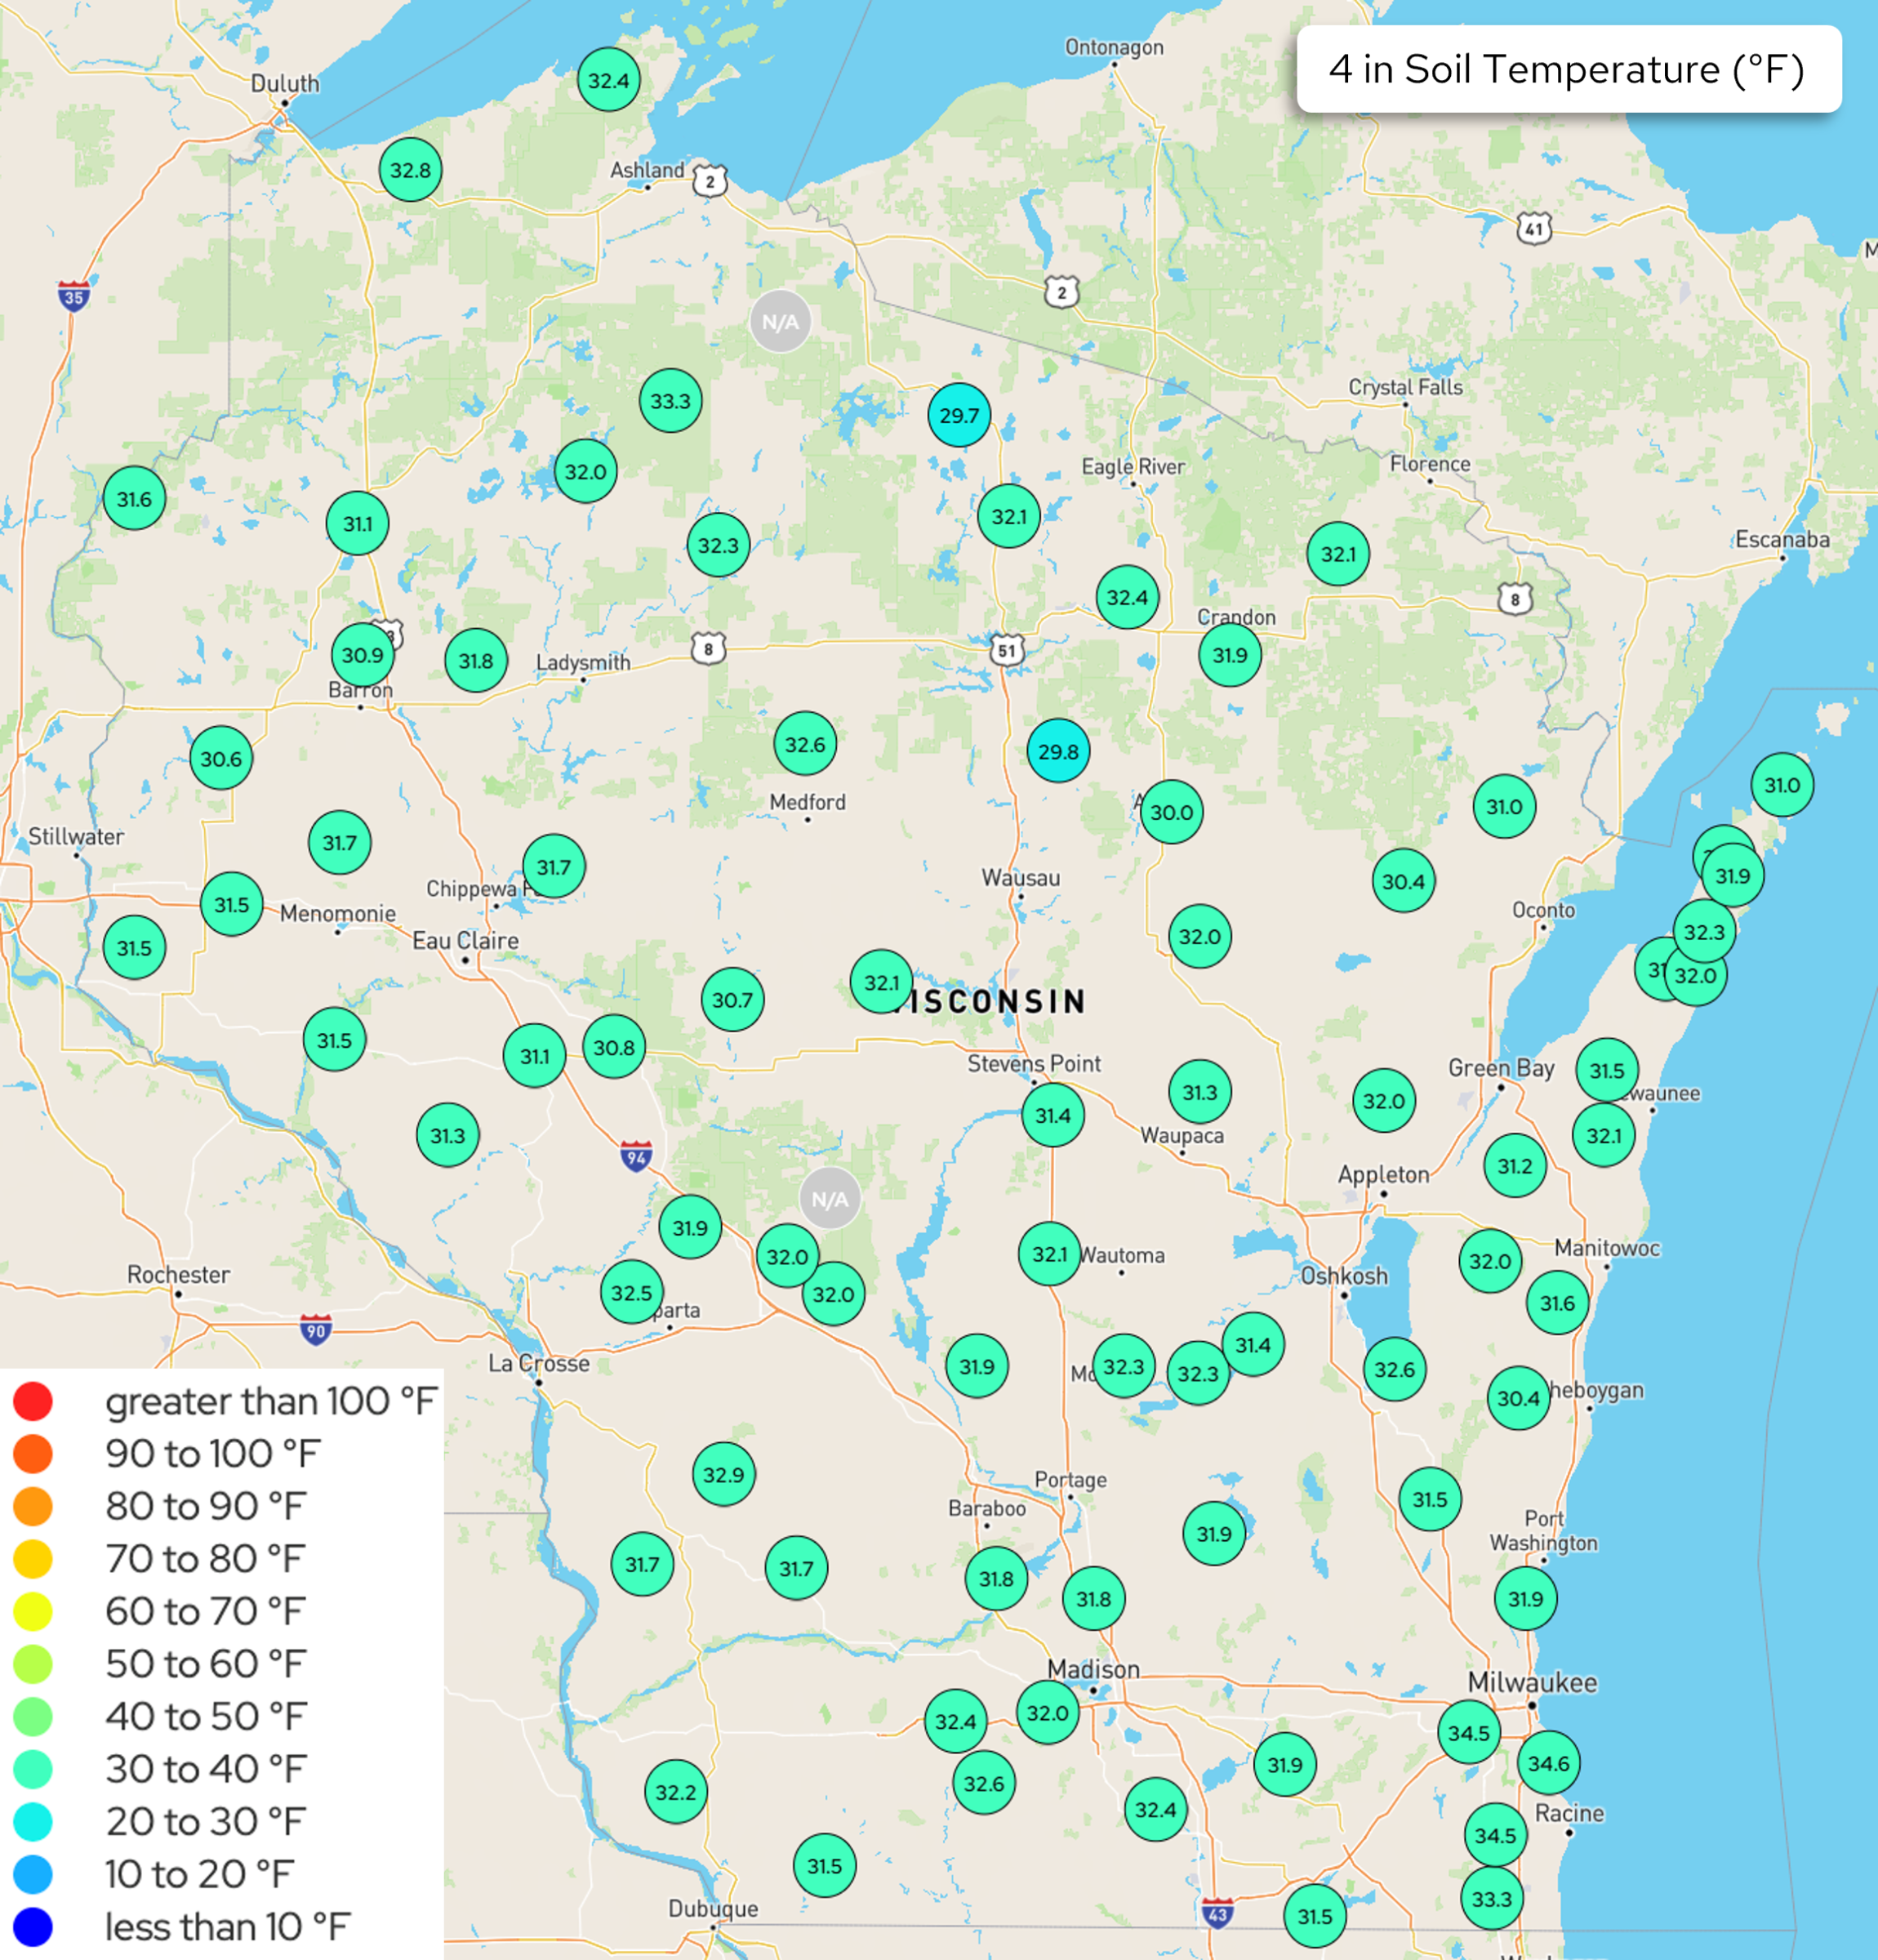
Image description: A map of Wisconsin displaying 4-inch depth soil temperature readings (°F) from weather monitoring stations statewide. All visible readings fall in the 30–40°F range (teal-colored dots per the legend). Notable values include a low of 29.7°F near Eagle River and highs of 34.5–34.6°F near Milwaukee/Racine. One station near Rhinelander reads N/A. A color-coded legend spans less than 10°F (dark blue) to greater than 100°F (red); only the 30–40°F teal category is active in this dataset.
Image description: A color-coded map of Wisconsin displaying 8-inch depth soil temperatures in °F from the WI Weather Network. Approximately 80 monitoring stations are plotted as colored circles with numeric temperature labels. Nearly all readings fall in the 30–35°F range (teal/cyan circles per the legend). A handful of stations near central Wisconsin show values in the upper 20s (light blue, 20–30°F range). The southeast corner (Milwaukee/Racine area) shows slightly warmer readings of 34–35°F. Several stations are marked “N/A.” A color legend in the lower left maps colors to temperature ranges from “less than 10°F” (dark blue) through “greater than 100°F” (red).
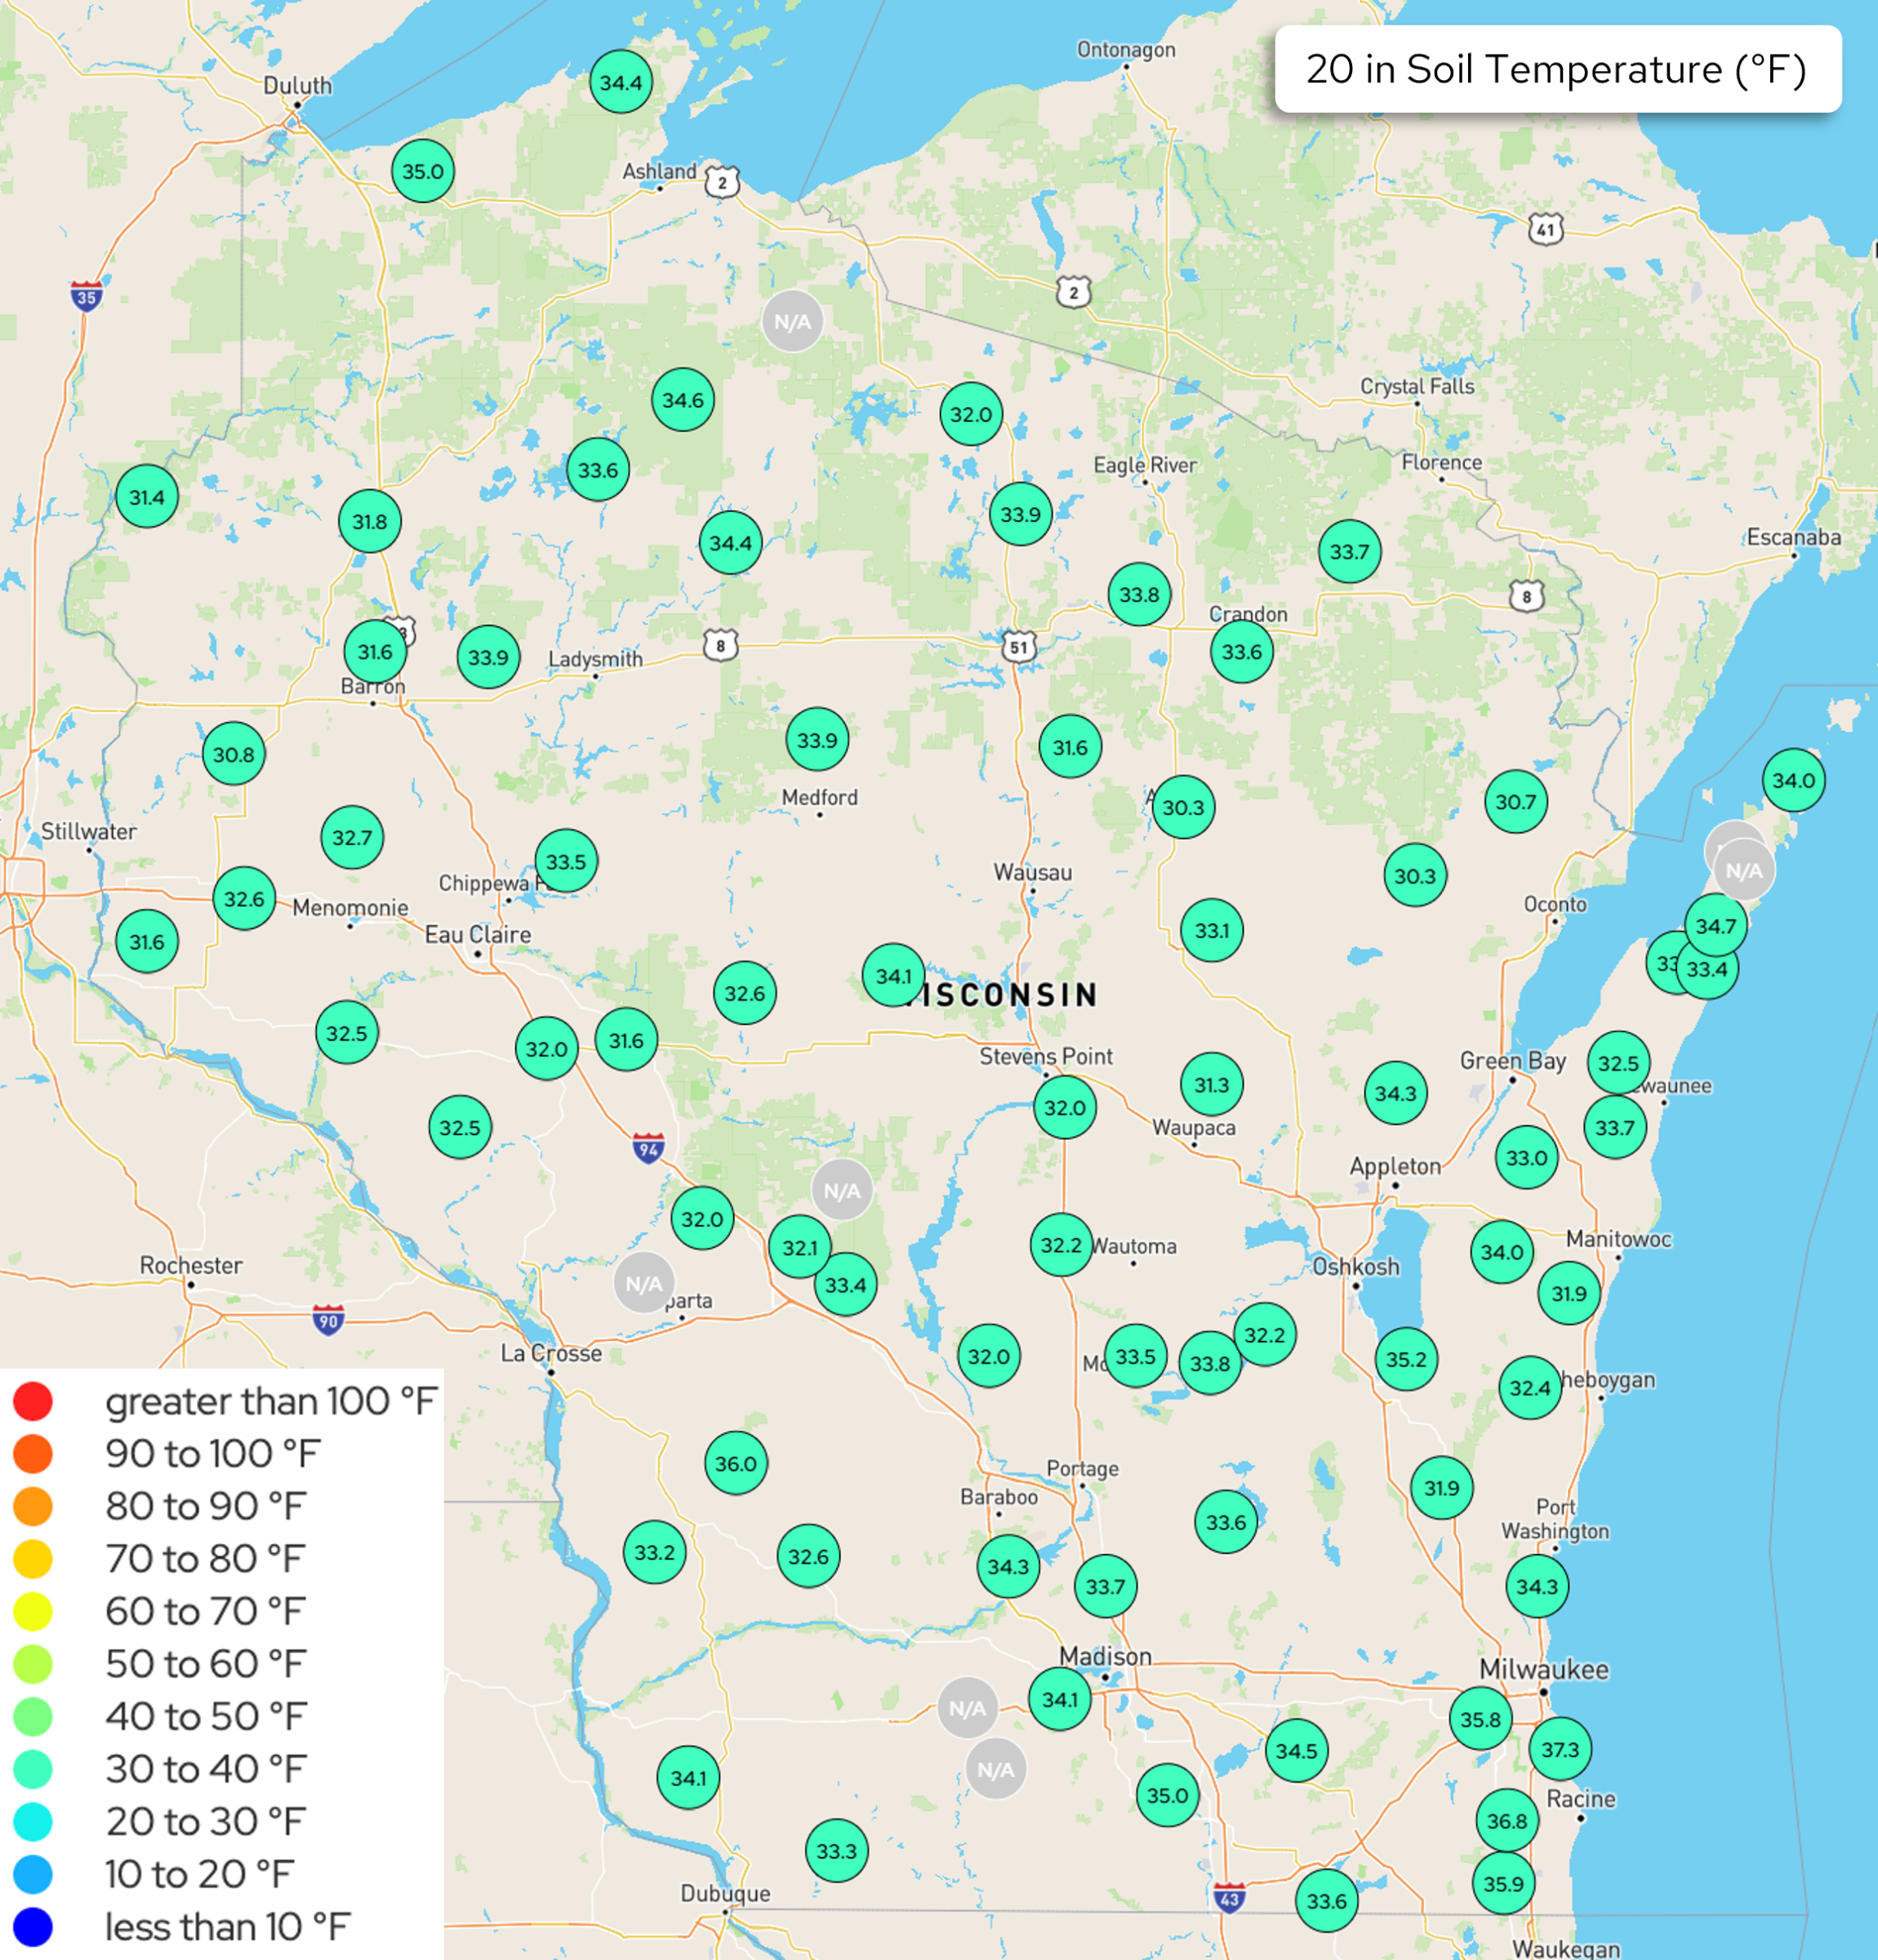
Image description: A color-coded map of Wisconsin displaying 20-inch depth soil temperature readings in degrees Fahrenheit from a network of monitoring stations. The legend uses a gradient from dark blue (below 10°F) through cyan, green, yellow, orange, and red (above 100°F). All visible station markers appear teal/green, indicating readings in the 30–40°F range. Specific readings visible across the state include values such as 31.4, 34.6, 33.9, 34.1, 32.0, 35.2, 37.3, and 36.8, among many others. Northern stations tend to show slightly lower temperatures (low-to-mid 30s) compared to southern stations (mid-to-upper 30s). Several stations are marked “N/A,” indicating no data available. Lake Michigan is visible along the eastern edge.
Maps showing soil temperature conditions on March 3rd @ 12:00 pm.
Image description: Dot map of Wisconsin and border regions showing soil frost depth at weather stations, color-coded by depth category. Northern and central Wisconsin stations show 17–33 inches (dark blue/purple dots). The deepest reading is 36 inches in south-central Wisconsin. Eastern stations near Lake Michigan (Green Bay, Sheboygan, Milwaukee) show shallower frost of 2–22 inches, with several readings of 2–4 inches closest to the lakeshore. La Crosse area shows 18 inches. Madison area shows 13–15 inches. Duluth (Minnesota) shows 8 inches. Legend categories: 0″, >0″–6″ (teal), >6″–12″ (light blue), >12″–24″ (dark blue), >24″–36″ (medium purple), >36″–60″ (dark purple).
Map showing soil frost depth observations reported between 2/24 and 3/3.
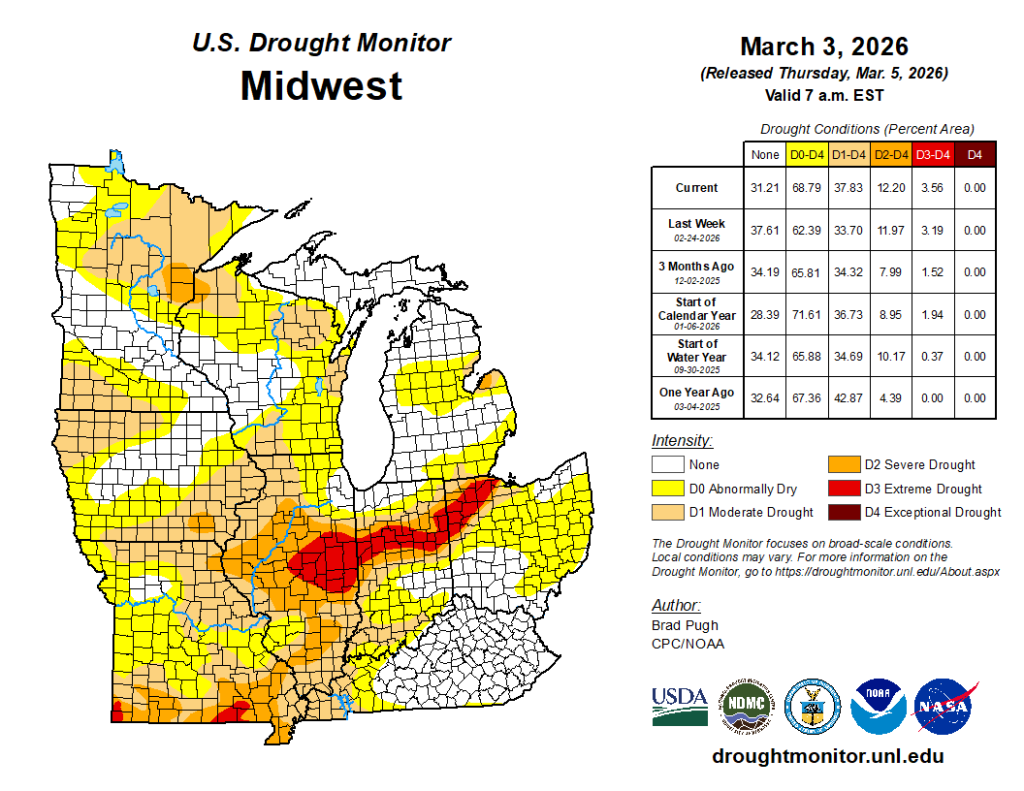
Image description: U.S. Drought Monitor map of the Midwest region, valid March 3, 2026 (released March 5, 2026). The map uses a color-coded intensity scale ranging from D0 (Abnormally Dry, yellow) through D4 (Exceptional Drought, dark brown). Severe to extreme drought (D2–D3, orange and red) is concentrated in Missouri and southern Illinois, with a large D3 Extreme Drought zone visible in central Missouri. Moderate drought (D1) spans much of Kansas, Nebraska, Iowa, and parts of Minnesota. Northern Minnesota and the Upper Peninsula of Michigan show little to no drought. The accompanying data table shows current conditions: 31.21% of the area has no drought; 68.79% falls within D0–D4; 37.83% is D1–D4; 12.20% is D2–D4; 3.56% is D3–D4; and 0% is D4. Compared to one year ago (March 4, 2025), D3–D4 coverage has increased from 0% to 3.56%. The map was authored by Brad Pugh, CPC/NOAA.
Midwest: Compared to last month close to a 10% increase in D1 coverage; 3% increase in D2 coverage.
Midwest: 1-2 class degradation across IA, IL, and northern MO. 1-2 class improvement in southern MO.
62.2% of the Midwest region is drought free (~37.8% in D1-D4).
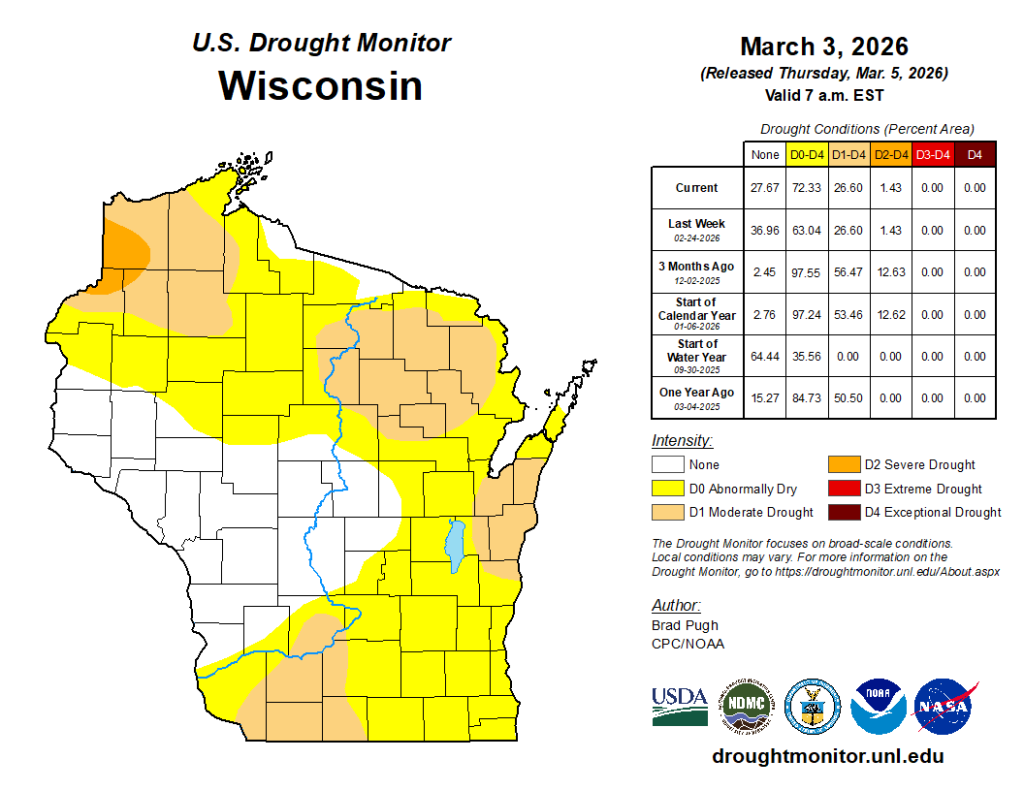
Image description: U.S. Drought Monitor map of Wisconsin dated March 3, 2026, released March 5, 2026. The map uses color coding to show drought intensity by region. Northwest Wisconsin shows D2 Severe Drought (orange). Much of northern and central Wisconsin shows D0 Abnormally Dry (yellow) and D1 Moderate Drought (tan). Southern Wisconsin has a mix of D0–D1 conditions with some drought-free areas. Eastern and parts of south-central Wisconsin show no drought conditions (white). An accompanying data table shows drought conditions as percent of state area: currently 27.67% has no drought, 72.33% is in some drought (D0–D4), with 26.60% at D1 or worse and 1.43% at D2 or worse. No D3 or D4 conditions are present. Compared to one year ago, drought coverage has expanded significantly (from 84.73% D0–D4 to 72.33%, though D1+ coverage increased from 50.50% to 26.60%). Authored by Brad Pugh, CPC/NOAA.
Wisconsin: 1 class degradation across the southern counties. D1-D2 remains in place in the NE and NW, with an expansion of D1 in the SW.
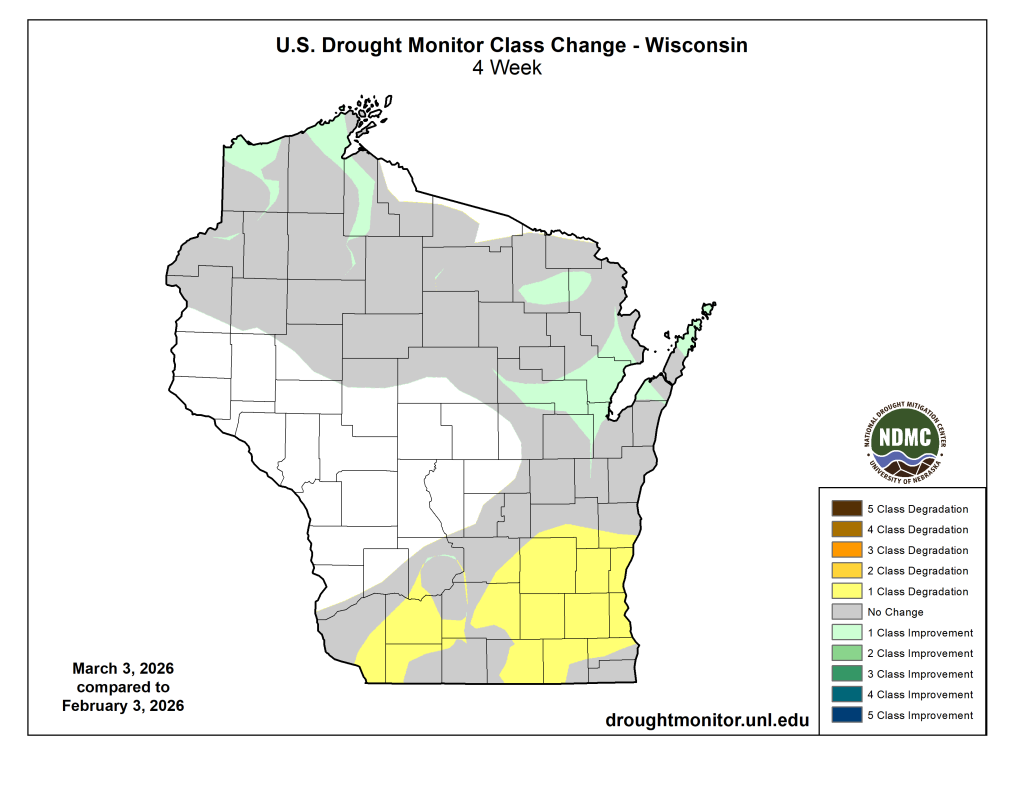
Image description: U.S. Drought Monitor Class Change map for Wisconsin comparing March 3, 2026 to February 3, 2026. The northern tier shows 1–2 class improvement (light to medium green). The central and eastern regions are predominantly no change (gray). The southwestern and south-central counties show 1 class degradation (yellow), with scattered gray (no change) patches throughout southern Wisconsin. Western counties are largely unchanged (white/no change). No areas show degradation beyond 1 class or improvement beyond 2 classes.
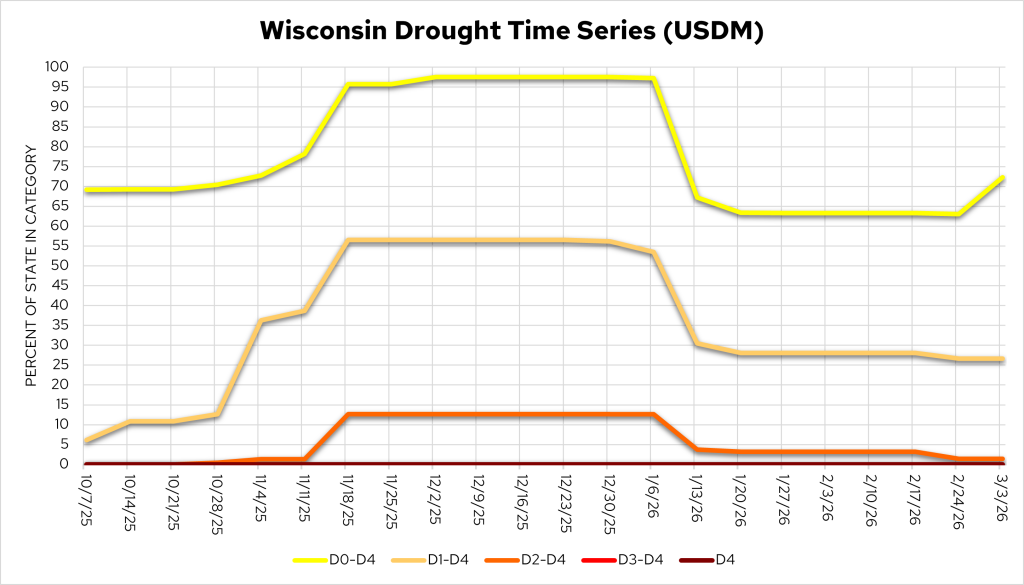
Image description: Line chart tracking the percent of Wisconsin in drought categories D0–D4 over time. D0–D4 (yellow) starts near 69%, peaks around 97% in late November through late December 2025, then drops to roughly 63–72% by early 2026. D1–D4 (tan/beige) rises from ~6% in October to ~56% by mid-November, holds steady through late December, then falls to ~25–29% by March 2026. D2–D4 (orange) emerges in early November, peaks near 13% from mid-November through late December, then drops to near 0–2% by January 2026. D3–D4 (red) and D4 (dark red/maroon) remain near 0% throughout the entire period.
9% increase in D0 coverage since early February, with minimal (1-2%) shifts in D1 and D2 coverage.
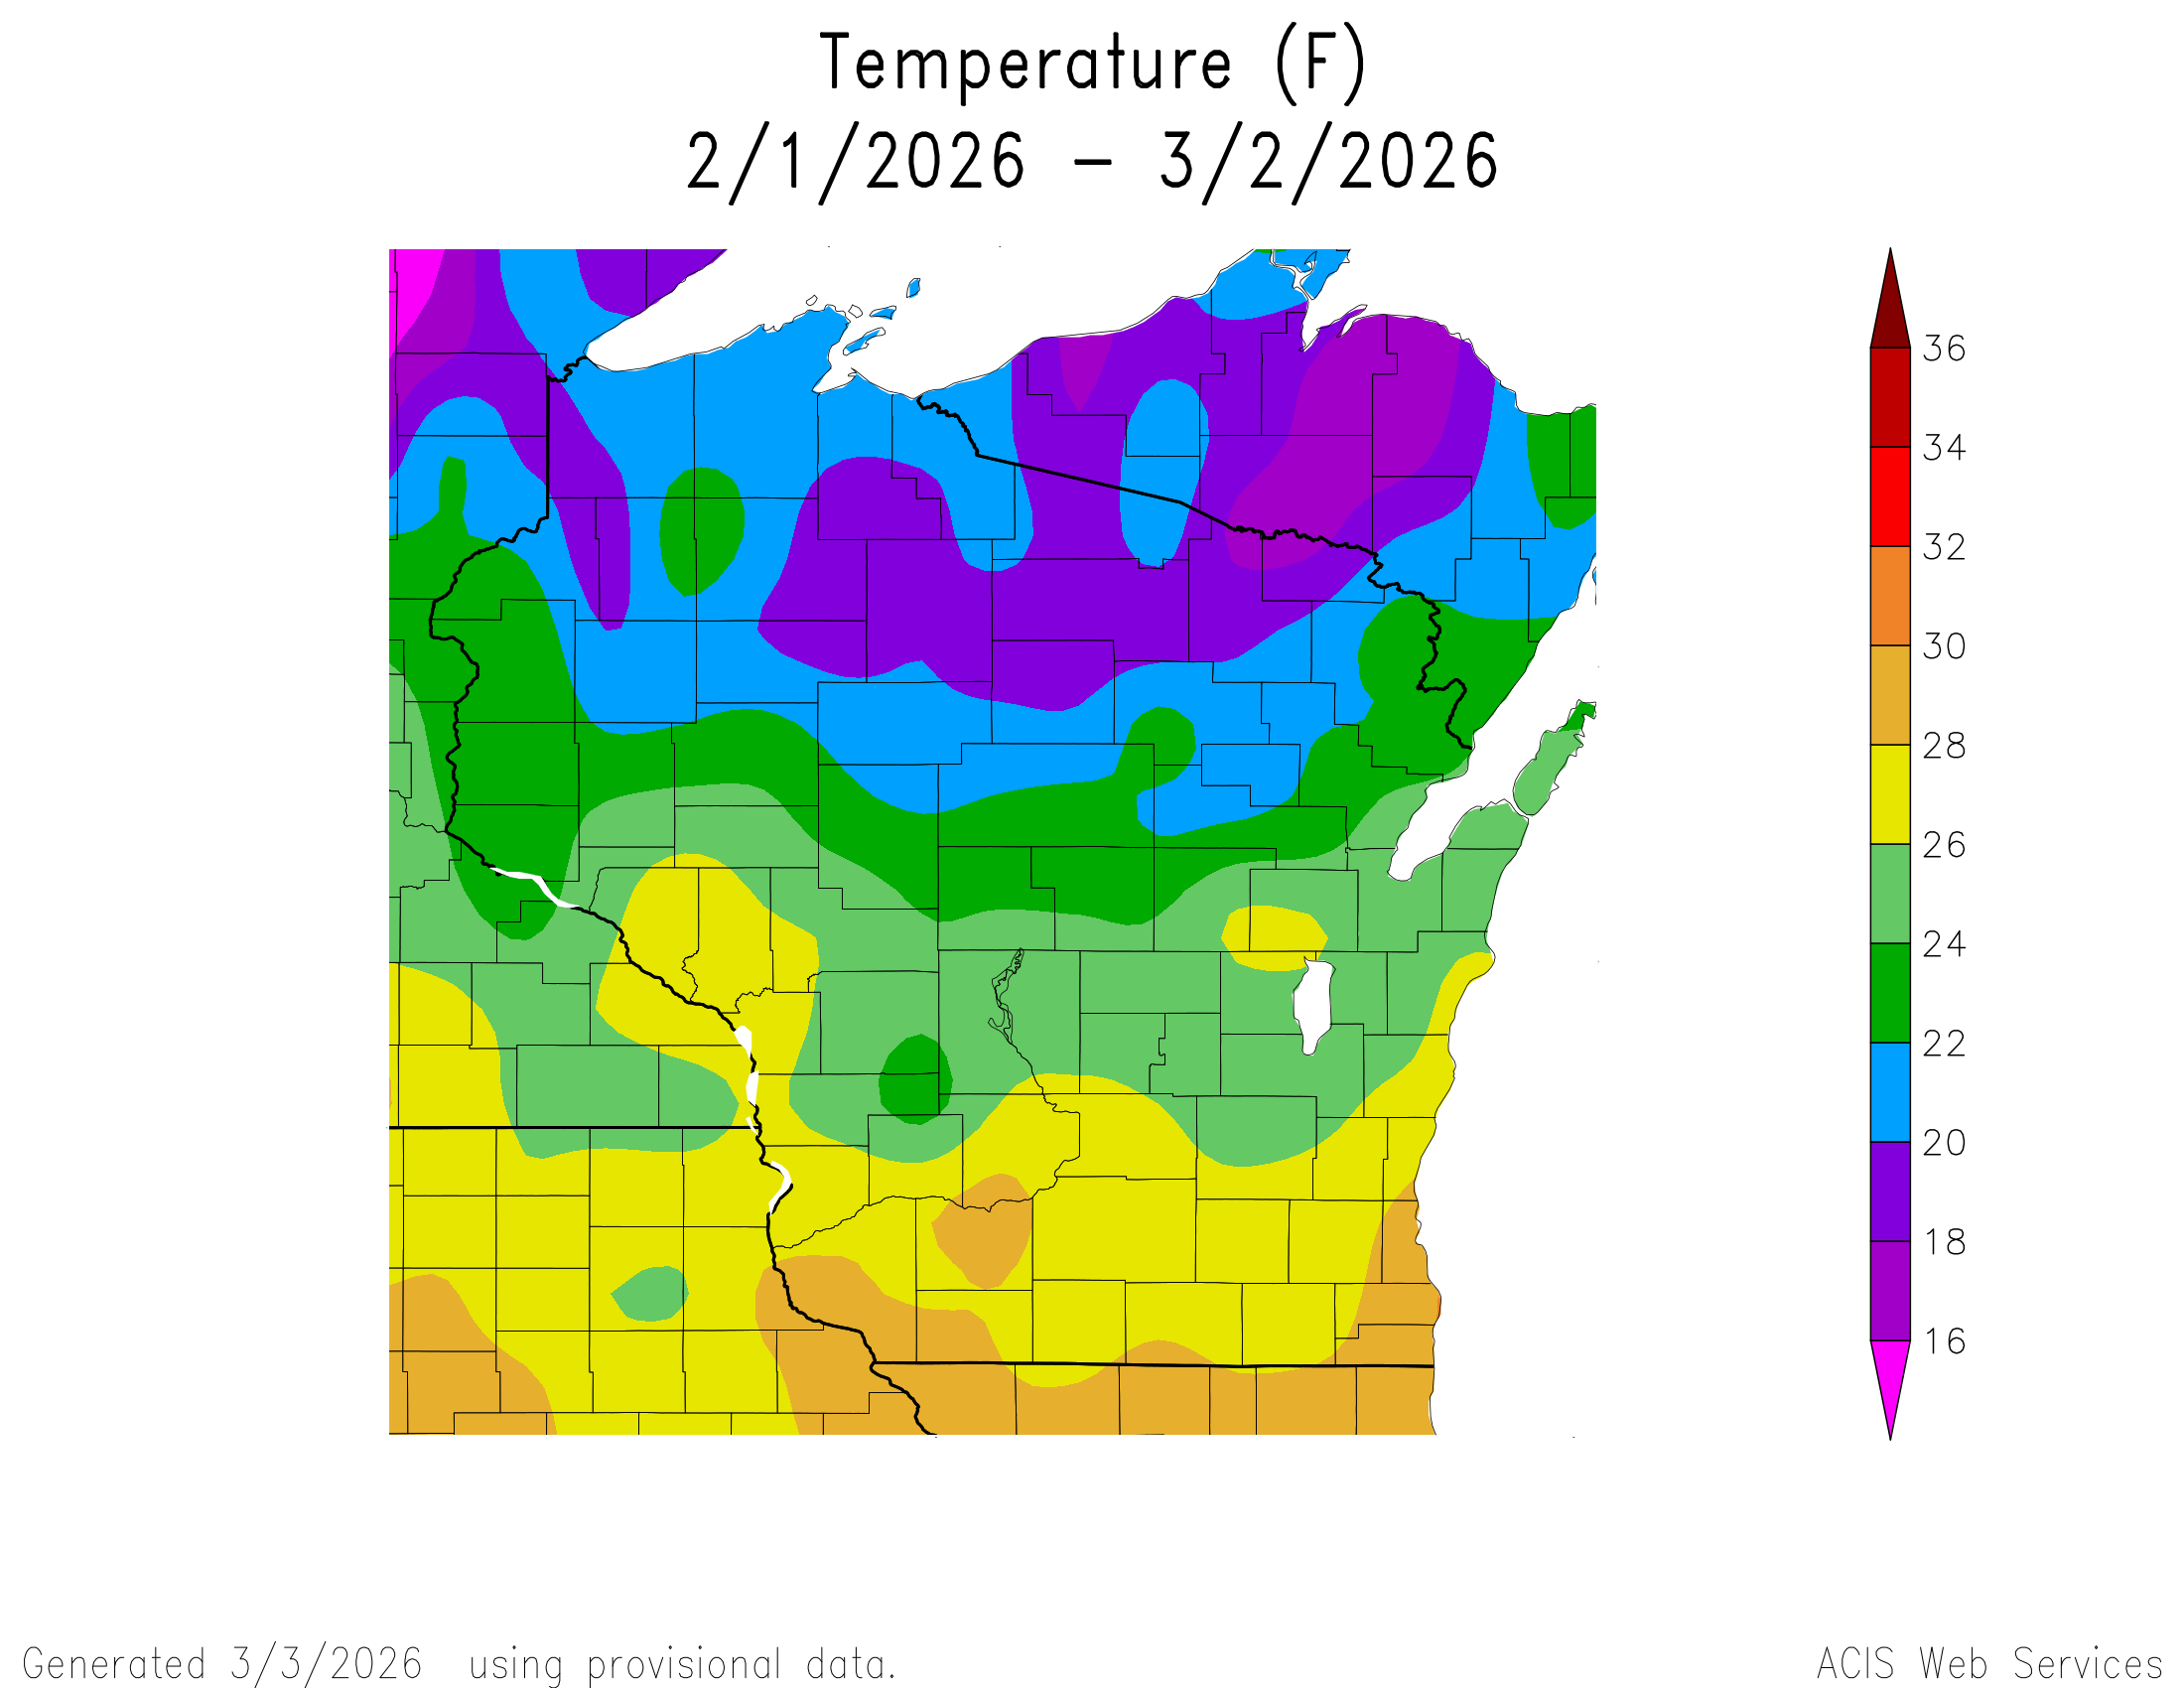
Image description: Color-coded temperature map of Wisconsin showing 30-day average temperatures in °F from Feb 1–Mar 2, 2026. Northern Wisconsin shows the coldest temperatures (16–20°F, purple/blue). Central Wisconsin ranges from 22–26°F (green/light green). Southern Wisconsin is warmest at 26–30°F (yellow/orange), with the southwest corner reaching 28–30°F. Lake Michigan shoreline shows a moderating effect with slightly warmer readings (~24–26°F) compared to inland areas at the same latitude. Generated 3/3/2026 using provisional data via ACIS Web Services.
Image description: Color-coded map showing departure from normal temperature (°F) across Wisconsin and neighboring states from February 1 to March 2, 2026. The majority of the region is orange, indicating 2–6°F above normal. Several localized red and dark red areas — particularly in western and west-central Wisconsin and across the Minnesota border — show departures of 8–10°F above normal. A small yellow spot in far northern Wisconsin indicates near-normal to slightly above-normal temperatures (approximately +2°F). No areas show below-normal temperatures. Data is provisional, generated March 3, 2026, by ACIS Web Services.
Average temps. ranged from 26-30°F in the southern counties; to 18-22°F for the north.
Image description: A choropleth map of Wisconsin showing chilling hour accumulation between 32°F and 45°F from July 1, 2025 through March 2, 2026. A diverging color scale ranges from red (0 hours) through white to dark blue (1,386 hours). Northern Wisconsin displays darker blue tones indicating higher chilling hour accumulation, while southern and eastern areas near Milwaukee, Racine, and Madison appear lighter, indicating fewer accumulated hours. Labeled cities include Green Bay, Appleton, Madison, La Crosse, Wausau, and others. Blue square markers are placed at select weather station locations across the state.
Chilling hour accumulation in WI ranges from 812 to 952 hours.
To view fruit-specific chilling hour requirements, please visit this link.
Image description: NOAA/NIDIS quantitative precipitation forecast map covering Wisconsin, Minnesota, and surrounding areas. Northern Wisconsin shows lighter precipitation (cyan/light blue = 1–1.5 inches). Central Wisconsin transitions to purple tones indicating 1.75–2 inches. Southern Wisconsin, including Madison and Milwaukee, displays deep purple, indicating 1.75–2.5+ inches. The color scale ranges from 0 inches (white) through greens, blues, purples, reds, oranges, and yellows (up to 20 inches). Source: National Weather Service Weather Prediction Center, last updated 03/05/26.
When? – an unseasonably wet few days are on tap, with the best chances for rain/snow on Friday and Tuesday/Wednesday of next week
Where? – best chances in the south, where precip will fall primarily as rain
Check your local forecast for details on totals and timing.
Image description: NOAA/NIDIS Climate Prediction Center map showing Wisconsin’s 8–14 day precipitation outlook (March 12–18, 2026), last updated 03/04/26. The entire state of Wisconsin is shaded light teal, indicating a 33–40% probability of above-normal precipitation. No counties show below-normal or near-normal conditions. A color scale at the bottom shows above-normal probability ranging from 33% (light teal) to 100% (dark teal), and below-normal from 33% (light tan) to 100% (dark brown). Cities labeled include Superior, Madison, and Milwaukee.
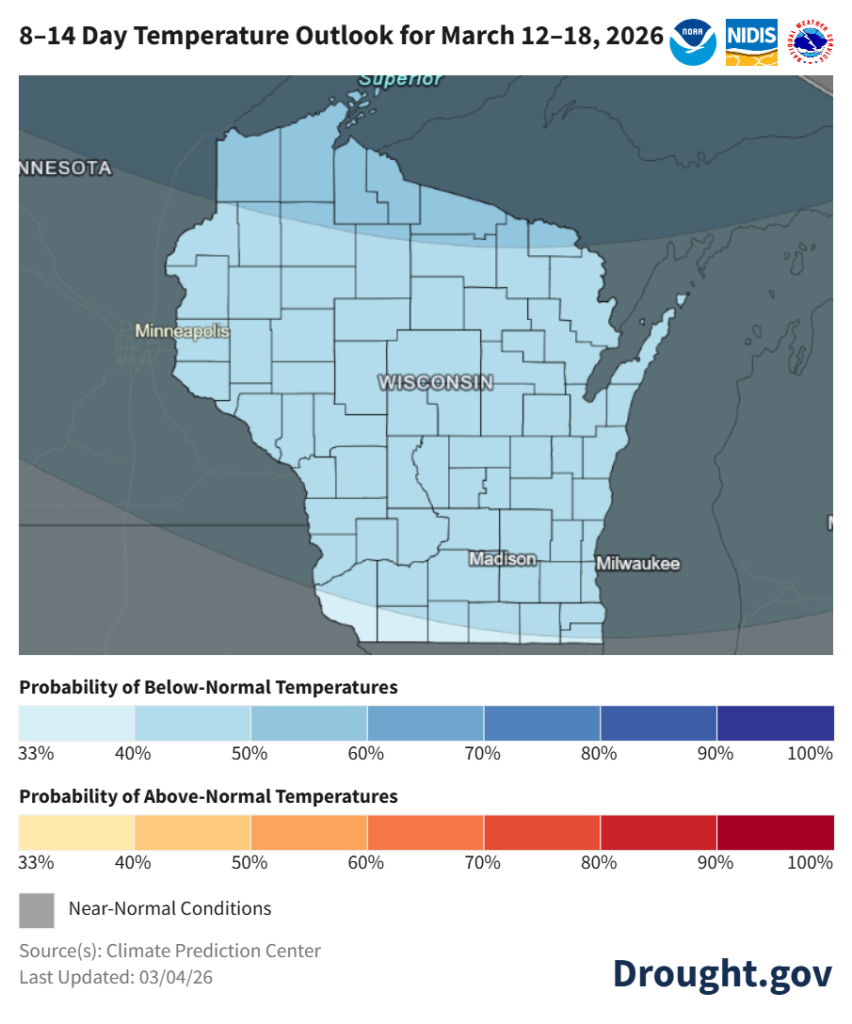
Image description: A choropleth map of Wisconsin from NOAA’s Climate Prediction Center, last updated March 4, 2026. Most of the state is shaded in light blue, indicating a 40–50% probability of below-normal temperatures for March 12–18, 2026. The far northwest corner near Superior shows a slightly deeper blue, suggesting a marginally higher probability (approaching 50–60%) of below-normal temperatures. The southwestern border counties appear in gray, indicating near-normal conditions. No areas show above-normal temperature probability. Cities labeled include Superior, Minneapolis (outside Wisconsin), Madison, and Milwaukee. The map is sourced from the Climate Prediction Center and published on Drought.gov.
Mid-March: Statewide leans for below normal temperatures (40-50% odds for most) and above normal precipitation (33-40% odds).
Statewide normals (1991-2020) for Mar 12-18 are 30.2°F and 0.39”.
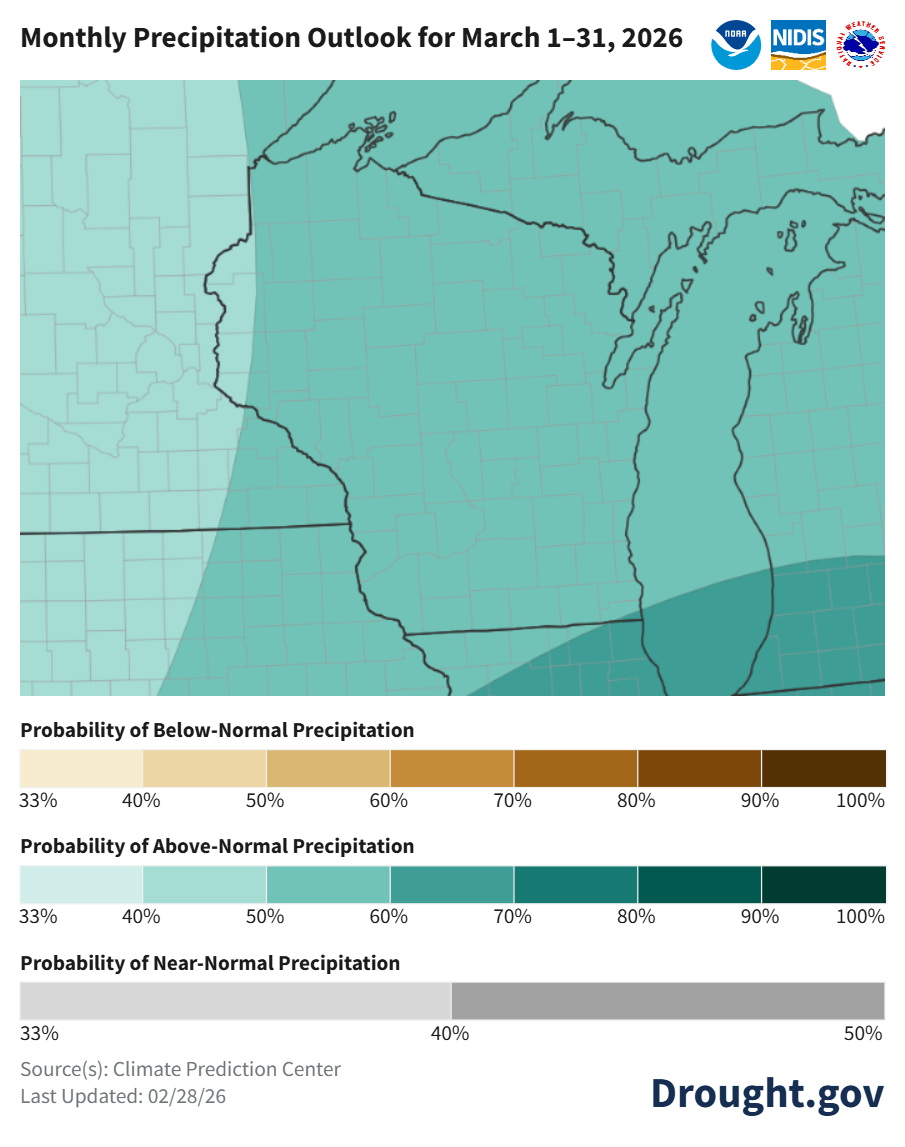
Image description: A color-coded map from NOAA’s Climate Prediction Center (updated 02/28/26) showing the monthly precipitation outlook for the Great Lakes and upper Midwest region. The majority of the mapped area is shaded in teal/green tones indicating a 40–60% probability of above-normal precipitation. A darker teal patch appears in the lower-right portion of the map (southern Lake Michigan/northern Indiana area), suggesting a 60–70% probability of above-normal precipitation. The western edge of the map shows a lighter shading transitioning to near-normal or below-normal probability. Three color scale legends are shown below the map: a tan-to-brown scale for below-normal probability (33–100%), a light-to-dark teal scale for above-normal probability (33–100%), and a light-to-medium gray scale for near-normal probability (33–50%). Source is credited to the Climate Prediction Center and Drought.gov.
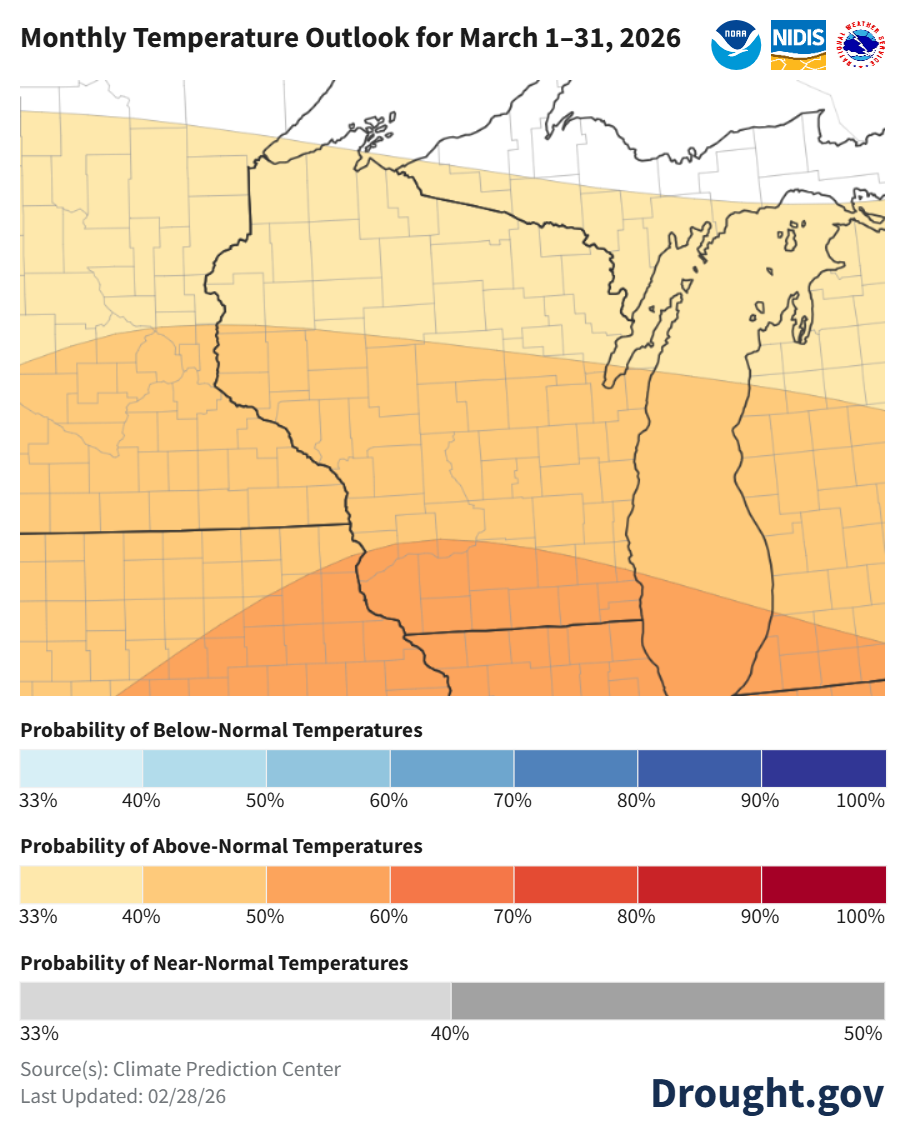
Image description: Climate Prediction Center map covering the Great Lakes region and upper Midwest for March 2026. Southern Wisconsin, Illinois, Indiana, and eastern Iowa show 60–70% probability of above-normal temperatures (medium orange). Northern Wisconsin, Michigan’s Upper Peninsula, and Minnesota show lighter shading at 33–40% probability of above-normal temperatures. No areas on this map show below-normal temperature probability. Three color scale legends are shown: blue for below-normal, orange-red for above-normal (33–100%), and gray for near-normal (33–50%). Source: Climate Prediction Center. Last updated 02/28/26.
March: Statewide lean towards above normal temperature, more so in the south (50-60% odds). Statewide lean (50-60% odds) towards above normal precipitation.
Statewide normals (1991-2020) for Mar 1-31 are 30.5°F and 1.82”.
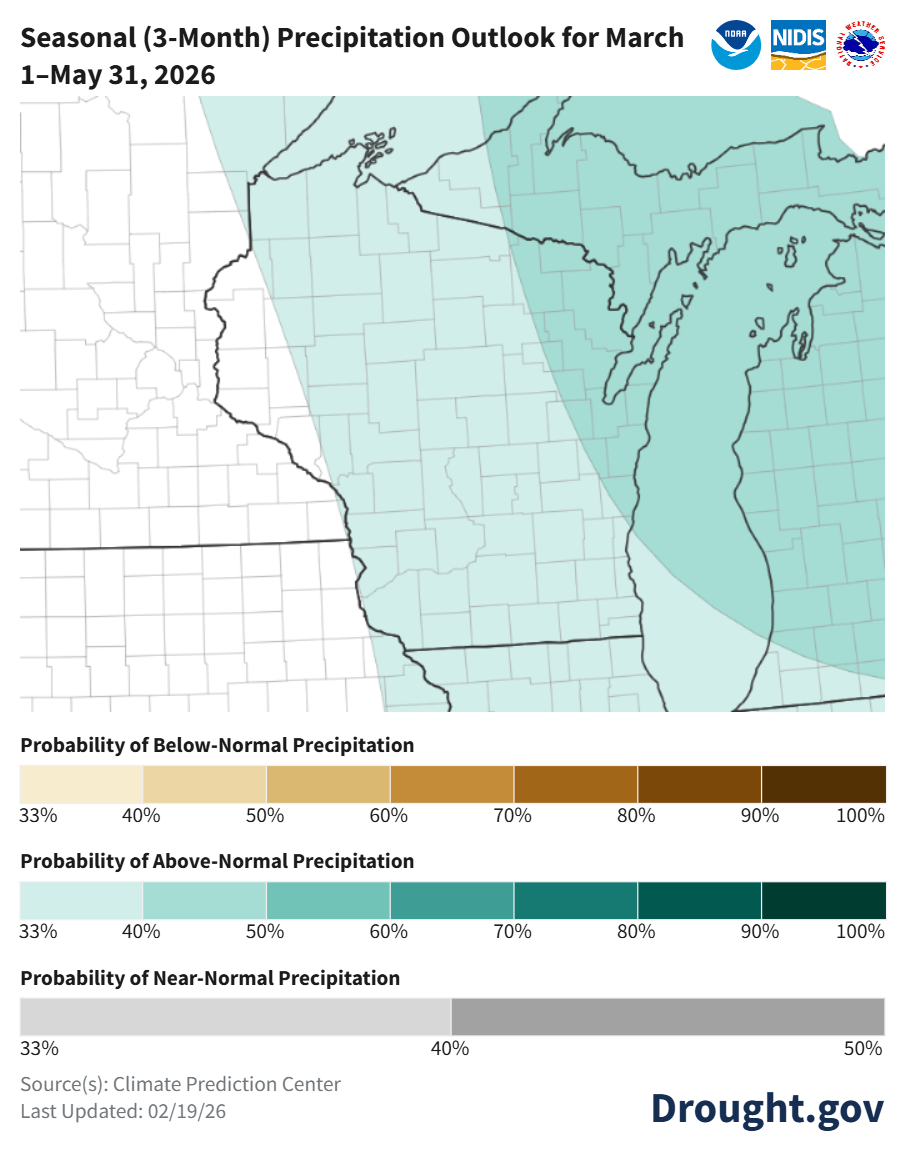
Image description: NOAA/NIDIS Climate Prediction Center map showing above-normal precipitation probability for the upper Midwest and Great Lakes region. Wisconsin, Michigan, and surrounding areas are shaded light teal, indicating 33–40% probability of above-normal precipitation. No below-normal precipitation is forecast for any visible area. Map last updated 02/19/26.
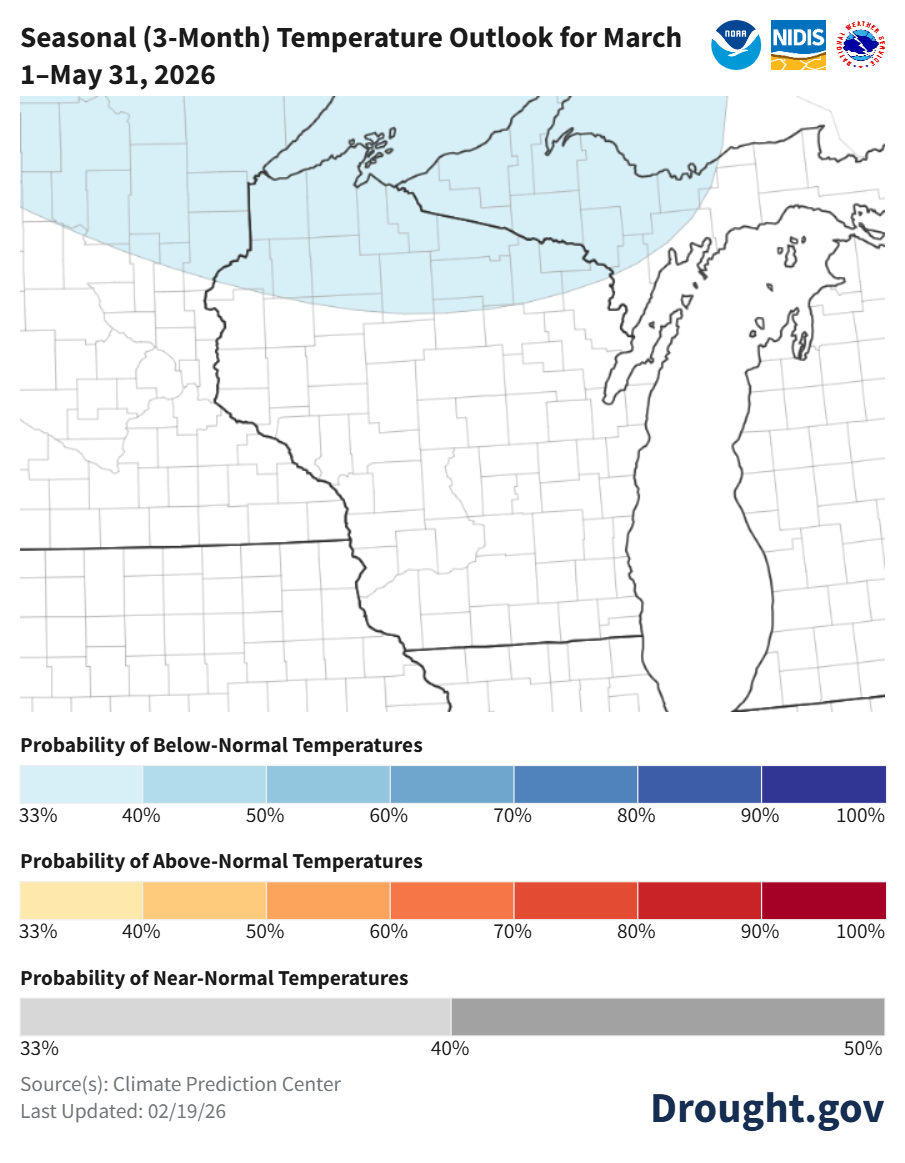
Image description: NOAA/Climate Prediction Center choropleth map showing the 3-month seasonal temperature outlook for March 1–May 31, 2026, covering the upper Midwest and Great Lakes region. Northern areas — including the Upper Peninsula of Michigan, northern Wisconsin, northern Minnesota, and adjacent Canada — are shaded light blue, indicating a 33–40% probability of below-normal temperatures. The remainder of the mapped region (southern Wisconsin, Illinois, Indiana, lower Michigan, Iowa) is unshaded white, indicating equal chances of below-, near-, or above-normal temperatures. Three color-scale legends are shown: blue for below-normal (33–100%), orange-red for above-normal (33–100%), and gray for near-normal (33–50%). Source: Climate Prediction Center. Last updated: 02/19/26.
March-May: Temperatures uncertain except for the far north (below normal lean). Precipitation leaning towards above normal (33-50% odds), more so in the northeast.
Statewide normals (1991-2020) for Mar-May are 43.0°F and 8.95”.
If you would like to obtain a PDF or PowerPoint copy of this report, please email anastasia.kurth@wisc.edu.
User Survey
Are you a regular user of the Ag Weather Outlook for Wisconsin (AgWOW)? Or maybe you are viewing these slides for the first time this week? Either way, we want to hear your feedback on this resource! Please take a few minutes and fill out this survey. Your feedback will help us better serve your ag-weather data needs through AgWOW.
If you have any trouble accessing or filling out the survey, please email Josh Bendorf at jbendorf@wisc.edu. Thank you!