Skip to content

Crops and Soils

Division of Extension

  • Topics
    • Economics, Budgets and Financials
    • Emerging Crops
    • Forage Production and Management
    • Fruit and Vegetable Production
    • Grain Production and Management
    • Grazing
    • On-Farm Research
      • Nitrogen Optimization Pilot Program
    • Pest Management
    • Soils, Nutrient Management, and Soil Health
  • Events
    • Events Calendar
    • UW Forage and Cover Crop Field Day
    • Agronomy and Soils Field Day
    • Wisconsin Extension Weed Management Workshop
    • WWASH Conference
    • Badger Crops and Soils Update Meetings
  • News
    • News
    • Get Connected
      • The Wisconsin Crop Manager
    • Hay Market Report
    • Ag Weather Outlook for Wisconsin
  • Programs
    • Webinars
      • Badger Crop Connect
      • Emerging Crops Webinars
      • Focus on Forage
      • Foundational Crop Scouting Training
      • Vegetable Production Webinars
    • Podcasts
  • Articles
  • People
  • About
  • Contact Us
Search
University of Wisconsin-Extension
Articles > Cranberries

Soil Health in Cranberry Production Systems: A Case Study of Four Wisconsin Farms

Written by Francisco Arriaga and Allison Jonjak
Share
  • Share:
  • Share on Facebook
  • Share on X (Twitter)
  • Share via Email
  • Copy Link

Copied!

Are there differences in soil health indicators between higher and lower yielding cranberry beds in Wisconsin?

Table of Contents


  • What we did
  • What we found
  • Future work
  • Methods and statistical analysis
  • Results, discussion, and conclusion

What we did

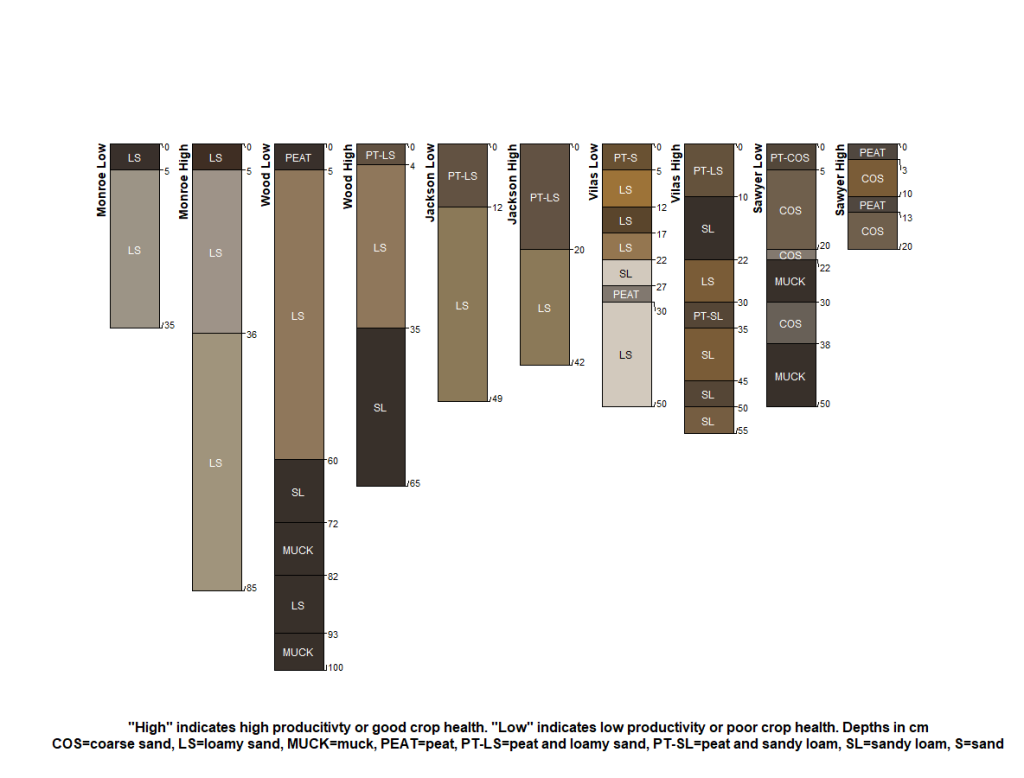
Sampled surface soils (top 6”) from one higher and one lower yielding cranberry bed on four farms in Jackson, Monroe, Sawyer, and Wood Counties, Wisconsin in summer of 2022. Higher and lower yielding beds were self-identified by growers at each farm. All beds were sandy, of similar age, contained the same cranberry variety, and were managed similarly.

Analyzed soil samples for soil fertility (pH, cation exchange capacity (CEC), plant available macro and micronutrients), and indicators of soil health (soil organic matter, potentially mineralizable nitrogen (PMN), permanganate oxidizable carbon (PoxC), and phospholipid fatty acids (PLFA)).

What we found

When comparing higher to lower yielding beds:

  • Evaluated soil health indicators were statistically similar. This means measured soil health indicators were likely not the main driver of cranberry yield differences in the evaluated beds and farms.
  • Potentially mineralizable nitrogen was trending towards being higher in lower yielding beds. This means that by sampling additional farms, the data may show increased potential for naturally cycled soil nitrogen to negatively influence bed productivity.

When comparing farm to farm:

  • Many traditional soil fertility measurements were significantly different. This means differences in on-farm nutrient management practices likely contributed to highly variable soil fertility levels and potentially, yields between farms.
  • Microbial populations, as measured by PLFA, were statistically similar. This means soil biology in sampled cranberry beds was less influenced by management practices than the measured soil fertility parameters.

Future work

Sampling of additional farms will better define potential soil health indicators appropriate for cranberry production.

Continued evaluation of soil health indicators, particularly physical and hydrological properties, such as percent pore space, water percolation rates, and soil moisture retention, may identify specific soil health indicators reflective of cranberry bed yield differences.

Methods and statistical analysis

Soil fertility and soil organic matter analyses were run at a commercial laboratory using Wisconsin certified methodology. PLFA analyses were conducted at the Uni-versity of Missouri Soil Health Assessment Center. PoxC and PMN were run at the Arriaga Lab at UW-Madison.

Analysis of variance was performed between the higher and lower yielding beds for soil fertility and PLFA indicators using farms as block. Means of specific indicators were considered significantly different when p-values were less than 0.10.

Results, discussion, and conclusion

There were no statistically significant differences between the measured soil health indicators (Tables 1 and 2). However, there was a strong trend of greater potential mineralizable nitrogen (p-value = 0.155) in lower versus higher yielding beds (Table 1). The lack of significance between higher and lower yielding beds can be attributed to large differences in indicator results between farms. For example, for most soil fertility parameters, variability between farms contributed more than bed productivity rating (0.0069 versus 0.468, respectively) to measured indicator differences. There were significant differences between farms for CEC (0.059), copper (0.053), zinc (0.015), manganese (0.011), calcium (0.071), potassium (0.007), phosphorus (0.020), and soil organic matter (0.046). Similarly, there were strong trends indicating differences between farms for magnesium (0.116), iron (0.119), and potentially mineralizable nitrogen (0.184). Differences in soil fertility indicators between farms were generally greater than for measured microbial populations. Only arbuscular mycorrhizae fungi (0.221) had a strong trend towards differences between farms.

Soil fertility appears to contribute more to the overall soil health/property differences between higher and lower yielding beds than soil biological parameters. Potential mineralizable nitrogen contributions appear to potentially influence productivity. However, results suggest soil fertility contributions may not be related to differences in soil organic matter, as there was no significant difference in organic matter content between bed types. A larger sample pool to include more farms would increase the sensitivity to detect differences between soil health indicators and reduce the statistical variability between farms. Continuing analysis of additional soil physical and hydrological parameters may produce results reflective of cranberry bed productivity differences.

A table showing soil indicator comparisons between lower yielding and higher yielding cranberry bed types. The table includes measurements for various soil properties including pH (5.63 vs 5.48), organic matter (0.78% vs 0.60%), and multiple nutrients measured in ppm such as phosphorus, potassium, calcium, magnesium, sulfur, copper, iron, manganese, PMN, and PoxC. Also shown are CEC and base saturation percentages. Each row includes a p-value column showing statistical significance, with all values being greater than 0.155, indicating no statistically significant differences between the bed types.

Table 1. Soil health indicator
mean values between lower
and higher yielding cran-
berry beds and associated
probability significance value
(p-value).
A table showing PLFA (Phospholipid Fatty Acid) indicators comparing lower yielding and higher yielding cranberry bed types. The table displays measurements in nmol/g soil for various microbial indicators including: total PLFA-microbial biomass (37,832.5 vs 30,336.5), gram negative bacteria (38.74 vs 36.47), gram positive bacteria (22.20 vs 20.49), gram+/gram- ratio (0.85 vs 0.83), total fungi (24.35 vs 28.87), mycorrhizae fungi (2.45 vs 2.16), fungi/bacteria ratio (0.47 vs 0.60), eukaryote (1.23 vs 1.32), and actinomycetes (11.04 vs 10.69). All comparisons include p-values in the rightmost column, with none showing statistical significance (all p-values > 0.476).

Table 2. Mean values of phospholipid fatty acids (PLFA)
indicators of lower and higher yielding cranberry beds
and associated probability significance value (p-value).
Cranberry-Soil-Health-2023Download

Authors and Funding 

Francisco Arriaga and Allison Jonjak, UW-Madison, Division of Extension; Jamie Patton and Andy Paolucci, USDA-NRCS. This project was funded by Wisconsin SARE.

Appendix

A soil profile diagram comparing different cranberry bed types with varying productivity levels. The image shows 10 soil columns labeled as "Monroe Low," "Monroe High," "Wood Low," "Wood High," "Jackson Low," "Jackson High," "Vilas Low," "Vilas High," "Sawyer Low," and "Sawyer High." Each column displays soil layers at different depths (in cm) down to 100cm, with soil compositions labeled as LS (loamy sand), SL (sandy loam), COS (coarse sand), PEAT, MUCK, PT-LS (peat and loamy sand), PT-SL (peat and sandy loam), and PT-COS (peat and coarse sand). A legend at the bottom explains that "High" indicates high productivity or good crop health while "Low" indicates low productivity or poor crop health, and provides definitions for all soil type abbreviations.

Print This Page

You May Also Like

  • Field Notes Episode 13: AgroforestryField Notes Episode 13: Agroforestry
  • Establishing silvopasture in existing woodland Establishing silvopasture in existing woodland 
  • Establishing silvopasture by planting treesEstablishing silvopasture by planting trees
  • The Cutting Edge Podcast Episode 6: Prairie STRIPSThe Cutting Edge Podcast Episode 6: Prairie STRIPS

Division of Extension

Connecting people with the University of Wisconsin

  • Agriculture
  • Community Development
  • Health & Well-Being
  • Families & Finances
  • Natural Resources
  • Positive Youth Development
University of Wisconsin-Madison      |        Explore Extension: Agriculture Community Development Families & Finances Health Natural Resources Youth
Connect With Us
Support Extension
Extension Home

We teach, learn, lead and serve, connecting people with the University of Wisconsin, and engaging with them in transforming lives and communities.

Explore Extension »

County Offices

Connect with your County Extension Office »

Map of Wisconsin counties
Staff Directory

Find an Extension employee in our staff directory »

staff directory
Social Media

Get the latest news and updates on Extension's work around the state

facebook iconFacebook

twitter icon Follow on X


Facebook
Follow on X

Feedback, questions or accessibility issues: info@extension.wisc.edu | © 2026 The Board of Regents of the University of Wisconsin System
Privacy Policy | Non-Discrimination Statement & How to File a Complaint | Disability Accommodation Requests

The University of Wisconsin–Madison Division of Extension provides equal opportunities in employment and programming in compliance with state and federal law.