As with any other crop, fertilizer is an important aspect of management in small grain production. Nutrients are vital for crop development and yield outcomes, but they are also an input cost that should be optimized for profit; not yield alone. This document serves as a centralized resource containing soil fertility information from UW-Madison, Extension, and Nutrient and Pest Management (NPM) resources (see resources section below for more information).
Soil pH Considerations for Small Grain Production
Soil pH is one of the most important soil fertility properties to consider as it impacts the nutrient availability to your crops. It also impacts soil microbial communities. Generally, the optimal soil pH for small grain production ranges from 5.6 to 6.6; with a specific target pH that optimizes crop performance for each individual crop (Table 1).
Table 1. Target pH values for specific small grain crops
| Crop | Target pH (Mineral Soils) |
|---|---|
| Barley, grain | 6.6 |
| Oat, grain | 5.8 |
| Rye, grain | 5.6 |
| Triticale | 6 |
| Wheat, grain | 6 |
Keep in mind, however, that soil pH should be managed based on the crop with the highest target pH in your rotation. Wheat, for example, has a target pH of 6.0; however, if soybean is in the crop rotation, the rotation’s target pH would be 6.3 (6.3 is the target pH of soybean). It generally makes more economic sense to manage pH, and therefore lime, in this way. For additional, generalized, information related to liming, see Chapter 5 in Extension Publication A2809).
Phosphorus and Potassium Fertilizer Recommendations
Phosphorus (P) and potassium (K) fertilizer rate recommendations are determined based on several pieces of information including: 1. Crop P and K demand level; 2. Recent soil test P and K levels; and 3. Expected yield.
- Crop P and K demand levels (ranging from 1 to 4) are used as a method for grouping crops that have relatively similar P and K demand for optimal growth. Crops with a demand level of “1” need less P and K than those with a demand level of “4”. Small grains have a P and K demand level of “1”, indicating a relatively low P and K requirement compared to other crops. The only exception is wheat, where the demand level is “2”; suggesting that wheat requires slightly more P and K than other small grains due to higher nutrient removal rates.
- Soil test P and K interpretations are available for specific crops based on their relative P and K demand level (as mentioned above) in addition to the soil type of the field. Separate ranges are provided for “Loamy” soils and for “Sandy or Organic” soils (Table 2a and Table 2b below). Similar to managing soil pH, however, it is recommended to manage soil test P and K levels based on the highest P and K demanding crop in your rotation. Use the P and K results from your most recent soil test lab report and reference them against the ranges provided in the table below to determine the appropriate interpretation category.
Table 2a. P and K soil test interpretations for non-wheat small grain crops
| Very Low | Low | Optimum | High | Very High* | Excessively High | |||||||
| Soil Group | P | K | P | K | P | K | P | K | – | K | P | K |
| Loamy | <10 | <70 | 10-15 | 70-100 | 16-20 | 101-130 | 21-30 | 131-160 | – | 161-190 | >30 | >190 |
| Sandy, Organic | <12 | <45 | 12-22 | 45-65 | 23-32 | 66-90 | 33-42 | 91-130 | – | – | >42 | >130 |
Table 2. Soil test interpretation categories for phosphorus and potassium for small-grain crops (adapted from Tables 7.1 and 7.2 in UW–Madison Extension Publication A2809).
All soil test P and K test values displayed have units of parts per million (ppm).
*The “Very High” soil test interpretation category is used for potassium only.
Table 2b. P and K soil test interpretations for wheat
| Very Low | Low | Optimum | High | Very High* | Excessively High | |||||||
| Soil Group | P | K | P | K | P | K | P | K | – | K | P | K |
| Loamy | <12 | <90 | 12-17 | 90-110 | 18-25 | 111-140 | 26-35 | 141-170 | – | 171-240 | >35 | >240 |
| Sandy, Organic | <18 | <50 | 18-25 | 50-80 | 36-37 | 81-120 | 38-55 | 121-160 | – | 161-200 | >55 | >200 |
Table 2. Soil test interpretation categories for phosphorus and potassium for small-grain crops (adapted from Tables 7.1 and 7.2 in UW–Madison Extension Publication A2809).
All soil test P and K test values displayed have units of parts per million (ppm).
*The “Very High” soil test interpretation category is used for potassium only.
- Phosphorus and potassium application rate recommendations for specific crops are based on current soil test levels (i.e. interpretation category) AND expected crop yield or yield goal. Generally, P and K application rate recommendations for soils testing in the “Optimum” category will match expected crop removal rates. For soils testing in the “low” or “very low” categories, recommended rates will exceed expected crop removal, with the goal of building soil test levels up to the optimum category over a period of 4 to 8 years. Conversely, for soils testing high or very high (for K), recommended rates are less than expected crop removal such that soil test levels will be “drawn down” to the optimum range over time.
Lastly, it is important to account for the difference in nutrient removal (and therefore fertilizer rate recommendations) between when only the grain is being harvested compared to when the grain and the straw are being removed. See below for P and K rate recommendations for both harvest-scenarios for small grain crops in Wisconsin.
Table 3a. P and K rate recommendations for barley (grain)
| Yield Goal (bu/ac) | P2O5 Rate Guidelines (lb/ac) | K2O Rate Guidelines (lb/ac) | |||||||
| VL | L | O | H | VL | L | O | H | VH | |
| 25-50 | 55 | 45 | 15 | 10 | 60 | 40 | 15 | 10 | 5 |
| 51-75 | 65 | 55 | 25 | 15 | 65 | 50 | 20 | 10 | 5 |
| 76-100 | 75 | 65 | 35 | 20 | 75 | 60 | 30 | 15 | 10 |
Table 3b. P and K rate recommendations for barley (grain + straw)
| Yield Goal (bu/ac) | P2O5 Rate Guidelines (lb/ac) | K2O Rate Guidelines (lb/ac) | |||||||
| VL | L | O | H | VL | L | O | H | VH | |
| 25-50 | 75 | 65 | 35 | 20 | 120 | 105 | 75 | 40 | 20 |
| 51-75 | 85 | 75 | 45 | 25 | 130 | 115 | 85 | 45 | 20 |
| 76-100 | 95 | 85 | 55 | 30 | 140 | 125 | 95 | 50 | 25 |
Table 3c. P and K rate recommendations for oats (grain)
| Yield Goal (bu/ac) | P2O5 Rate Guidelines (lb/ac) | K2O Rate Guidelines (lb/ac) | |||||||
| VL | L | O | H | VL | L | O | H | VH | |
| 30-60 | 55 | 45 | 15 | 10 | 55 | 40 | 10 | 5 | 5 |
| 61-90 | 60 | 50 | 20 | 10 | 60 | 45 | 15 | 10 | 5 |
| 91-120 | 70 | 60 | 30 | 15 | 65 | 50 | 20 | 10 | 5 |
Table 3d. P and K rate recommendations for oats (grain + straw)
| Yield Goal (bu/ac) | P2O5 Rate Guidelines (lb/ac) | K2O Rate Guidelines (lb/ac) | |||||||
| VL | L | O | H | VL | L | O | H | VH | |
| 30-60 | 70 | 60 | 30 | 15 | 150 | 135 | 105 | 55 | 25 |
| 61-90 | 80 | 70 | 40 | 20 | 155 | 140 | 110 | 55 | 30 |
| 91-120 | 90 | 80 | 50 | 25 | 160 | 145 | 115 | 60 | 30 |
Table 3e. P and K rate recommendations for rye (grain)
| Yield Goal (bu/ac) | P2O5 Rate Guidelines (lb/ac) | K2O Rate Guidelines (lb/ac) | |||||||
| VL | L | O | H | VL | L | O | H | VH | |
| 15-30 | 50 | 40 | 10 | 5 | 50 | 35 | 5 | 5 | 0 |
| 31-50 | 55 | 45 | 15 | 10 | 55 | 40 | 10 | 5 | 5 |
| 51-70 | 65 | 55 | 25 | 15 | 65 | 50 | 20 | 10 | 5 |
Table 3f. P and K rate recommendations for rye (grain + straw)
| Yield Goal (bu/ac) | P2O5 Rate Guidelines (lb/ac) | K2O Rate Guidelines (lb/ac) | |||||||
| VL | L | O | H | VL | L | O | H | VH | |
| 15-30 | 55 | 45 | 15 | 10 | 85 | 70 | 40 | 20 | 10 |
| 31-50 | 60 | 50 | 20 | 10 | 90 | 75 | 45 | 25 | 10 |
| 51-70 | 70 | 60 | 30 | 15 | 95 | 80 | 50 | 25 | 15 |
Table 3g. P and K rate recommendations for triticale (grain)
| Yield Goal (lb/ac) | P2O5 Rate Guidelines (lb/ac) | K2O Rate Guidelines (lb/ac) | |||||||
| VL | L | O | H | VL | L | O | H | VH | |
| 1,000-5,000 | 75 | 65 | 35 | 20 | 75 | 60 | 30 | 15 | 10 |
Table 3h. P and K rate recommendations for triticale (grain + straw)
| Yield Goal (lb/ac) | P2O5 Rate Guidelines (lb/ac) | K2O Rate Guidelines (lb/ac) | |||||||
| VL | L | O | H | VL | L | O | H | VH | |
| 1,000-5,000 | 80 | 70 | 40 | 20 | 105 | 90 | 60 | 30 | 15 |
Table 3i. P and K rate recommendations for wheat (grain)
| Yield Goal (bu/ac) | P2O5 Rate Guidelines (lb/ac) | K2O Rate Guidelines (lb/ac) | |||||||
| VL | L | O | H | VL | L | O | H | VH | |
| 20-40 | 55 | 45 | 15 | 10 | 65 | 50 | 10 | 5 | 5 |
| 41-60 | 65 | 55 | 25 | 15 | 75 | 60 | 20 | 10 | 5 |
| 61-80 | 75 | 65 | 35 | 20 | 80 | 65 | 25 | 15 | 5 |
| 81-100 | 85 | 75 | 45 | 25 | 85 | 70 | 30 | 15 | 10 |
| 101-120 | 95 | 85 | 55 | 30 | 95 | 80 | 40 | 20 | 10 |
Table 3a-i. Phosphorus (P2O5) and potassium (K2O) application rate guidelines for common small-grain crops at several soil test interpretation levels. (Adapted from Table 7.4 in UW–Madison Extension Publication A2809).
Table 3j. P and K rate recommendations for wheat (grain + straw)
| Yield Goal (bu/ac) | P2O5 Rate Guidelines (lb/ac) | K2O Rate Guidelines (lb/ac) | |||||||
| VL | L | O | H | VL | L | O | H | VH | |
| 20-40 | 65 | 55 | 25 | 15 | 120 | 105 | 65 | 35 | 15 |
| 41-60 | 75 | 65 | 35 | 20 | 130 | 115 | 75 | 40 | 20 |
| 61-80 | 85 | 75 | 45 | 25 | 125 | 120 | 80 | 40 | 20 |
| 81-100 | 95 | 85 | 55 | 30 | 145 | 130 | 90 | 45 | 25 |
| 101-120 | 105 | 95 | 65 | 35 | 150 | 135 | 95 | 50 | 25 |
Nitrogen Fertilizer Considerations
NITROGEN (N) fertilizer rate recommendations are determined in a slightly different way than for P and K recommendations are, and the process is also different between wheat and all other small grain crops. For wheat, N rate recommendations are made by using a maximum return to N (MRTN) approach, while other small grain-N recommendations are made based on soil organic matter content.
Nitrogen for wheat
The MRTN rate guidelines for wheat were developed by conducting wheat yield response to N trials in on-farm and agricultural research station settings in major wheat producing areas of Wisconsin over many years. Analysis of the yield response to N data resulted in determining the average N application rates that resulted in maximum economic return on the N investment. As such, it is important to recognize that a combination of both agronomic (i.e. wheat-yield response to N functions) and economic (i.e. cost of N, price of wheat) factors are utilized in the MRTN approach; not just one or the other. The MRTN approach emphasizes maximizing profitability, not maximizing yield.
Additionally, it is recommended that N is applied in the spring at “green-up”, and that fall N applications are avoided due to the risk of denitrification and leaching over the winter months.
To determine the appropriate N application rate for wheat, we need to know the soil group (e.g. Loamy, Sandy, or Organic; Table 4.1 in A2809), previous crop, and the N:Wheat price ratio. By utilizing the ratio between the price of N fertilizer ($ / lb of actual N) and the value of wheat grain ($ / lb grain), rate selections are applicable to current / near-future market conditions and can be dynamic as those markets change over time.
Example N:Wheat price ratio calculation, assuming $0.50 / lb N and $5.00 / bu of wheat:
        N:Wheat price ratio = ($0.50 / lb N) ÷ ($5.00 / bu) = 0.10
Lower price ratios indicate market conditions where N fertilizer is relatively cheap and/or where wheat prices are relatively high. Conversely, higher price ratios reflect more expensive N fertilizer and/or lower wheat prices. For reference, a price ratio of 0.10 is “lower” than a price ratio of 0.15. Accounting for fluctuations in N cost and wheat price allows farmers to minimize overall financial risk. Figure 1 below provides an easy way to determine what the correct price ratio is for a range in N and wheat prices.
Figure 1. N:Wheat Price Ratio Table
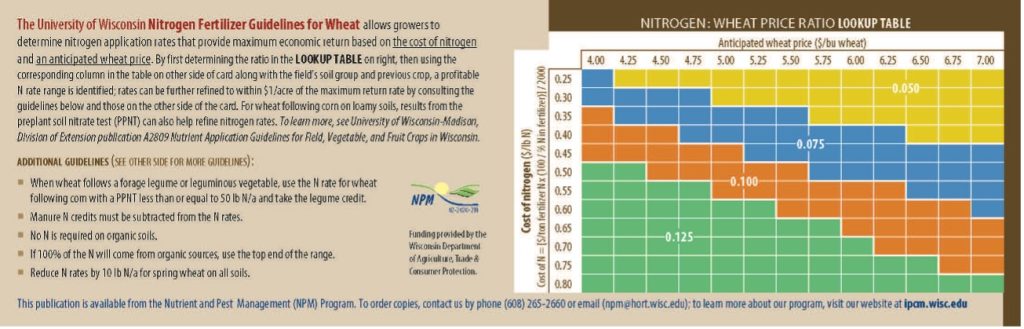
Figure 1. N:Wheat Price Ratio Table from UW-Madison Nutrient and Pest Management Publication ”Nutrient Management – Fast Facts Magazine“, Sept. 2024
Upon determining the N:Wheat price ratio, soil group (i.e. Loamy or Sandy), and previous crop, reference Figure 2 for deciding the N rate recommendation. Note that for each price ratio scenario, there is a range of N application rates provided. These ranges represent the rates of N fertilizer that result in profitability within +/- $1/ac of the economic optimum N rate (i.e. maximum economic return to N). Reference A2809 for additional details related to the MRTN approach and additional considerations for N rate selection for wheat.
Figure 2. Nitrogen Rate Guidelines for Wheat
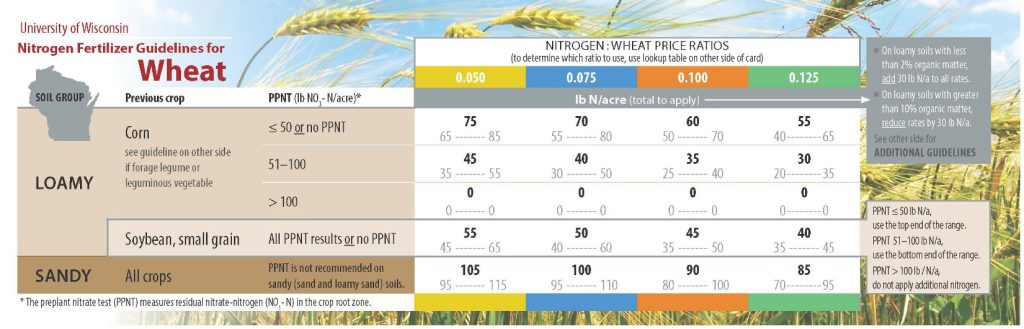
Figure 2. University of Wisconsin Nitrogen Guidelines for Wheat (UW-Madison Nutrient and Pest Management Publication ”Nutrient Management – Fast Facts Magazine“, Sept. 2024.)
Use of the pre-plant soil nitrate test (PPNT) to adjust MRTN recommendations in wheat
As seen above, it is recommended to utilize the PPNT on Loamy soils when wheat is following corn to further enhance the accuracy of N rate selections. The PPNT test is recommended because there may be significant amounts of residual soil nitrate leftover following corn harvest, especially if corn N uptake was reduced by drier-than-normal conditions or if N fertilizer application rates in corn were greater than crop need. Accounting for this residual nitrate will increase wheat N use efficiency, can increase profitability, and reduce the potential for excess nitrate leaching to groundwater.
Additional information on the PPNT for wheat
PPNT sampling includes collecting soil samples in the late summer months from the 0-1 foot and 1-2 foot depths. Fifteen cores from each depth should be collected and kept separate from an area of no more than 20 acres. Composite the cores for each individual depth and submit them to a laboratory as two separate samples for nitrate determination. Soils where the PPNT is less than 50 lb N/ac require higher N fertilizer application rates than those where the PPNT is between 51-100 lb N/ac (generally a difference of 25-30 lb N/ac). When the PPNT is greater than 100 lb N/ac, it is recommended that no additional N be applied from fertilizer. If the previous crop was corn and a PPNT was not taken, N rate guidelines for “PPNT < 50” should be followed. See A2809 for additional information related to the PPNT.
Nitrogen rate guidelines for other small-grain crops are based on soil organic matter (% SOM) content of the predominant soil type in your field (Table 5). Nitrogen response data from research studies across a range of WI soils is insufficient to allow application of the MRTN approach for these crops. As such, a single N application rate recommendation is made for each crop, regardless of yield goal. As seen in Table 4 below, N application recommendations decrease with increasing SOM content; reflecting the N cycling ability of soils with greater SOM content.
Table 4. Nitrogen rate recommendations for non-wheat small grain crops
| Crop | Yield Range (per acre) | Soil Organic Matter Content (% SOM) | |||
| <2.0 | 2.0-9.9 | 10.0-20.0 | >20.0 | ||
| lb N/ac to apply | |||||
| Barley | 25-100 bu | 70 | 50 | 30 | 15 |
| Oat | 30-120 bu | 60 | 40 | 20 | 0 |
| Rye | 15-70 bu | 60 | 40 | 20 | 0 |
| Triticale | 1-5,000 lb | 60 | 40 | 20 | 0 |
Table 4. Nitrogen rate guidelines for small grain crops other than wheat.
Sulfur Considerations
Sulfur (S) is considered a secondary nutrient in crop production as it is needed in slightly lower quantities compared to N, P, and K. Regardless, there are many instances in small-grain production where S fertilizer applications will likely result in positive yield responses. Additionally, it is important to note that S plays into crop N use as both nutrients are essential for amino acid and protein production. Providing crops with adequate amounts of S can help with overall use efficiency of applied N as well. There are several factors that impact S availability to crops including soil organic matter (SOM), clay content, atmospheric deposition, and manure history.
Sulfur from soil organic matter
Generally, for every 1% of SOM, about 3 pounds of sulfur per acre are made available to crops. As such, soils with greater SOM content will require less S from fertilizer compared to soils with lower organic matter.
Soil Texture Impacts Sulfur
Medium and fine-textured soils have greater sulfate-S (the plant available form of S) holding capacity than coarse-textured soils. The reason for this is 2-fold: 1. Sulfate-S can be bound to clay particles (i.e. medium/fine-textured soils have greater clay content than coarse textured); and 2. Sulfate is a mobile nutrient, meaning it can be leached from the soil profile, especially in coarse textured soils. In summary, coarse textured, low organic matter soils will have a greater probability of being S-deficient than higher organic matter medium and fine-textured soils.
Atmospheric Deposition of Sulfur
Atmospheric deposition of S has decreased dramatically over the past few decades; resulting in an average annual S deposition rate of 3 to 10 pounds of S per acre in WI today which is about 1/3 of historical amounts received. As such, S deficiency has become more prevalent throughout the state.
Manure History Impacts Sulfur
Given the relatively high amount of S present in manure (~1 lb/ton or ~1 lb/1,000 gal of 1st-year available S in dairy manure), fields with recent manure applications seldom show signs of S deficiency. That said, however, most crops will use the entirety of the manure-derived S within the first year of application; meaning don’t expect much residual S to carryover for subsequent crops.
Determining Sulfur Need in Small Grain Crops
Soil tests for determining plant available S and subsequent S fertilizer application rates are not reliable tools, unlike those for P and K mentioned above (*note that S needs can be determined/verified by use of plant tissue analysis). Instead, it is recommended to consider the following when considering whether your crop needs S fertilizer: 1. Soil sulfate-S holding capacity; 2. Manure history; and 3. Relative Sulfur requirements of specific crops. If soil sulfate-S retention is low or medium (Table 5), and no manure has been applied in the past two years, a S application will most likely be needed for crops with a medium or high relative need for S (Table 6).
| Surface Texture | Subsoil Texture | Potential for Retaining Sulfate in Root Zone |
|---|---|---|
| Sandy | Sandy | Low |
| Sandy | Loamy | Medium |
| Loamy | Sandy | Medium |
| Loamy | Loamy | Medium |
| Organic | – | High |
| Crop | Relative Sulfur Requirement^ | |
| Grain | Grain + Straw | |
| Barley | Low | Medium |
| Oat | Low | Medium |
| Rye | Low | Low |
| Triticale | No Data | No Data |
| Wheat | Low | Medium |
^ Relative sulfur requirement based on annual crop removal rates:
low < 10 lb S/a; medium = 10-20 lb S/a; high > 20 lb S/a
Table 6. Relative Sulfur requirement for small-grain crops in Wisconsin (Adapted from table 8.3 in A2809).
If after considering the above you determine S is needed, it is generally recommended to apply a S rate of 10-25 pounds of S per acre to small-grain crops. These rates align with how relative sulfur requirements are defined in Table 7; meeting annual crop S removal rates. All sulfate forms (e.g. Gypsum, CaSO4; Ammonium Sulfate (AMS), NH4SO4) of fertilizer are equally effective when surface applied or incorporated. Keep in mind that elemental sulfur is unavailable to plants and needs to be converted to sulfate by soil biogeochemical processes before plants can use it.
For additional information regarding soil fertility management for small-grain production, please see publication A2809 or the resources listed below.
Other Resources
Nutrient Management Fast Facts Magazine
Small Grains in Wisconsin: Benefits, Management and Resources
Fundamental Soil Fertility Strategies for Success in Corn, Soybean and Small Grains
Updated: May 6, 2025
Reviewed by: Shawn Conley, Dan Marzu