Small Grains Economics
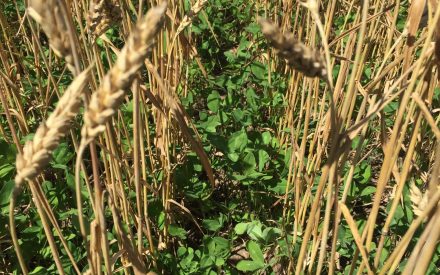
Introduction to small grain economics
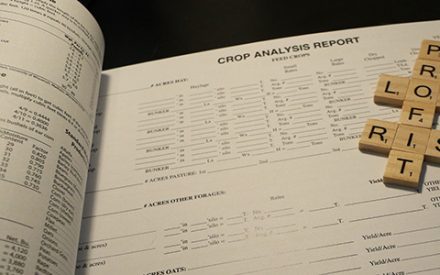
Breaking down the financials of small grain production
Accounting for agronomic benefits of extended rotations
Scenario I: Low market conditions for corn or soy
Scenario II: High corn/soy-to-wheat price ratio
Introduction to small grain economics
Wheat acres in Wisconsin have averaged about 250,00 acres across the state over the past ten years. This is dwarfed by the nearly 4 million acres of corn and 2 million acres of soybeans planted annually in the state. Modern agriculture got its start in Wisconsin with wheat, which peaked in the 1860s before the transition to dairying. A lack of rotation increased disease incidence, pushing production further west to more arid regions.
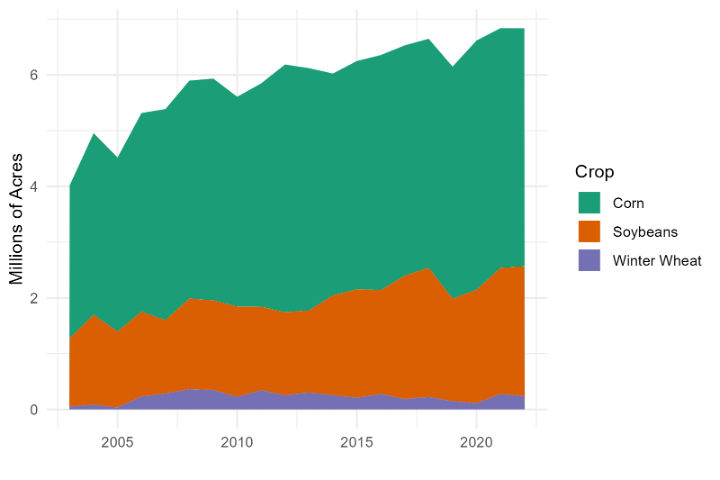
Data source: Cropland Data Layer.
Adding wheat back into the corn and soybean-dominant grain rotations in Wisconsin can yield dividends that are not captured in the price at the elevator. These dividends should be accounted for in making cropping rotation decisions, so that profitability is maximized over time and risk is reduced.
Breaking down the financials of small grain production
When we consider year-over-year profitability of Wisconsin’s three primary grain crops over the last two decades, it is not surprising that wheat acres remain negligible across the state. Figure 2 plots average net-returns (i.e. profit) each year for these three commodities (including forage value of stalks or straw). Except for 2003-2004, and more recently in 2023, wheat by itself was never the top earner. On average across the last 20 years, corn in Wisconsin nets $11.65 more than wheat, and soybeans $57.55 more than wheat.
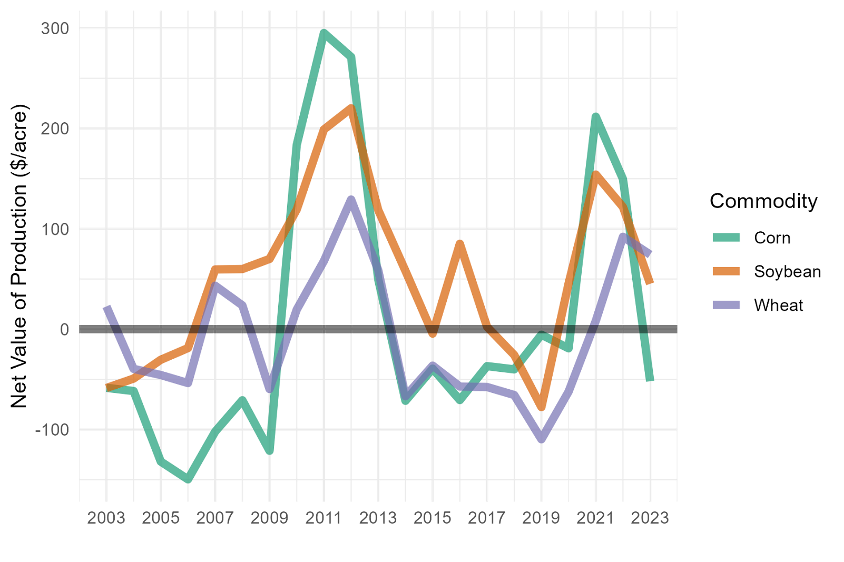
Data source: USDA, Economic Research Service. Commodity Costs and Returns, https://www.ers.usda.gov/data-products/commodity-costs-and-returns
On the other hand, the cost of production for wheat tends to be much less than that for corn and soybeans; meaning producers have less invested risk when growing wheat compared to corn and soybean. Table 1 displays the 2023 costs of production broken down by category. Especially in years of tight margins, having less production costs invested into the crop may reduce the downside risk of the operation.
Table 1. Average Total Cost of Production for Corn, Soy and Wheat (2023)
| Operating Costs | Corn | Soy | Wheat |
|---|---|---|---|
| Seed | $113.82 | $77.22 | $34.38 |
| Fertilizer | $203.27 | $60.87 | $116.42 |
| Chemicals | $56.21 | $42.96 | $33.17 |
| Custom services | $39.09 | $20.07 | $17.34 |
| Fuel, lube, and electricity | $33.61 | $20.52 | $14.59 |
| Repairs | $47.15 | $32.05 | $33.68 |
| Purchased irrigation water | – | – | $2.82 |
| Interest on operating capital | $12.53 | $6.44 | $6.41 |
| Total, operating costs | $505.68 | $260.13 | $258.81 |
| Allocated Overhead | Corn | Soy | Wheat |
|---|---|---|---|
| Hired labor | $5.98 | $2.43 | $2.35 |
| Opportunity cost of unpaid labor | $34.32 | $25.85 | $20.41 |
| Machinery and equipment | $155.24 | $122.45 | $137.59 |
| Opportunity cost of land | $147.87 | $152.62 | $141.18 |
| Taxes and insurance | $18.84 | $16.84 | $6.00 |
| General farm overhead | $32.80 | $33.27 | $10.93 |
| Total, allocated overhead | $395.05 | $353.46 | $318.46 |
| Costs Listed | Corn | Soy | Wheat |
|---|---|---|---|
| Total, operating costs | $505.68 | $260.13 | $258.81 |
| Total, allocated overhead | $395.05 | $353.46 | $318.46 |
| Total costs | $900.72 | $613.59 | $577.27 |
Despite the fact that wheat is typically a less valuable crop, the real economic benefit of incorporating wheat into the crop rotation stems from the agronomic, labor-savings, pest, weeds, and soil health benefits that are all supported with data. In the following sections, we will outline these added benefits that are masked by just looking at the aggregate costs and returns for the individual crops. Therefore, when considering the economics of extended crop rotations, it is imperative to understand the long-run return on investment, rather than just the year-over-year payoffs.
Accounting for agronomic benefits of extended rotations
Many studies, including those conducted in Wisconsin, have documented the potential yield benefits to all crops within a corn-soy-wheat (CSW) rotation relative to continuous cropping or corn-soy (CS) rotations (Agomoh, et al., 2021; Huo et al., 2022; Janocivek et al., 2021). Across these studies, corn grain yield was 1-11% greater in CSW rotations than in CS rotations. Similarly, soybean yield was 6-12% greater in CSW rotations than in CS rotations.
These rotational yield benefits are considerable but are realized outside of the wheat growing year, making it difficult to assess the true economic impact of wheat from farm-to-farm. As such, this may be a reason why extended crop rotations are not more widely leveraged in Wisconsin.
In the following section, we will explore three scenarios and assess the net present value (the sum of all future cash flows over a period of time discounted back to their present-day value) of investing in a diversified crop rotation for 24 years, or 8 full CSW rotations.
In the baseline, we will assume a +4.5% rotational effect for corn and a +11% increase for soybeans, which are consistent with the data from Arlington, WI field trials and within the range of other studies in the region.
Those scenarios include:
- A low corn/soy-wheat price ratio
- A higher corn/soy-wheat price ratio
- A lower-rotational yield effect price ratio
The purpose of this analysis is to show the economic feasibility of different crop rotations under a variety of market and agronomic responses.
Scenario I: Low market conditions for corn or soy
For the first scenario, we will consider a market context that was similar to prices observed in Fall 2024. Under this scenario, corn price was projected to be $4.00 per bushel, soybeans at $10.00 per bushel, and wheat at $5.80 per bushel.
Historically, this was a relatively advantageous time for wheat given the low market conditions for corn and soybeans. The cumulative net present value is presented in Figure 3 below, and Table 2 provides the expected profit per year and total net present value over the 24 years of this cycle.
Under this scenario, the CSW rotation (with and without straw value) always results in greater NPV compared to the continuous corn and corn-soy rotations. With these conditions, the CSW and CSW +Straw rotations would exceed the CS rotation by about $8 and $26.50 per year, respectively, as shown in Table 2.
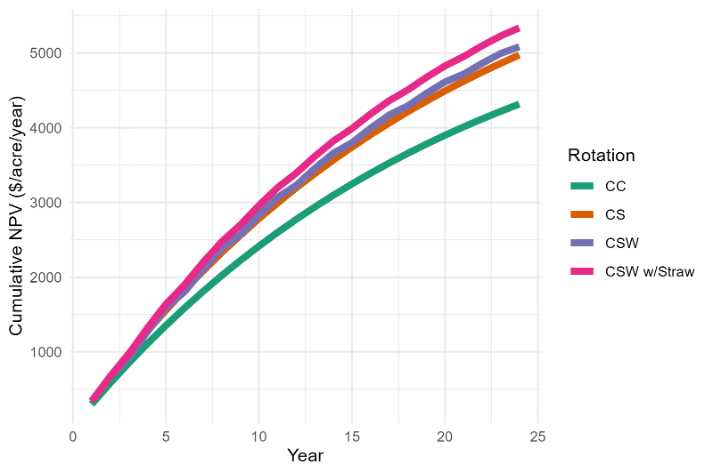
Table 2. Net present value and per year returns to different rotations in Scenario I
| Rotation | Profit per year | NPV |
|---|---|---|
| CSW | $351.67 | $5,085.57 |
| CS | $343.50 | $4,975.59 |
| CC | $298.00 | $4,317.60 |
| CSW with straw | $370.00 | $5,338.35 |
Scenario II: High corn/soy-to-wheat price ratio
Between Fall 2024 and Spring 2025, conditions became more favorable for corn and soybeans and less favorable for wheat in terms of marketing year average prices. Here we will consider a scenario where corn prices are $4.25, soybeans are $10.08, and wheat is $5.63. While these corn and soy prices are not as historically extreme as they could be (e.g., in 2012), they reflect above-average market conditions for corn and soy relative to wheat.
Furthermore, even this modest shift in market conditions is sufficient to flip average profitability in favor of a CS rotation ahead of CSW without straw (Table 3). Figure 4 shows the expected annual net returns for the first six years of the rotation. Here, very clearly there is a major dip in net return during the wheat year, but the expected returns on corn and soy are slightly higher after benefiting from the rotation effect.
Under these conditions, the CS rotation provides a higher payoff than the CSW rotation alone. However, when also considering a modest value of wheat straw, the CSW rotation with straw exceeds the CS rotation by about $8.30 per acre per year. Therefore, even in relatively poor market years for wheat, there is some economic justification for investing in an extended rotation, especially if you have a reliable market for the wheat straw.
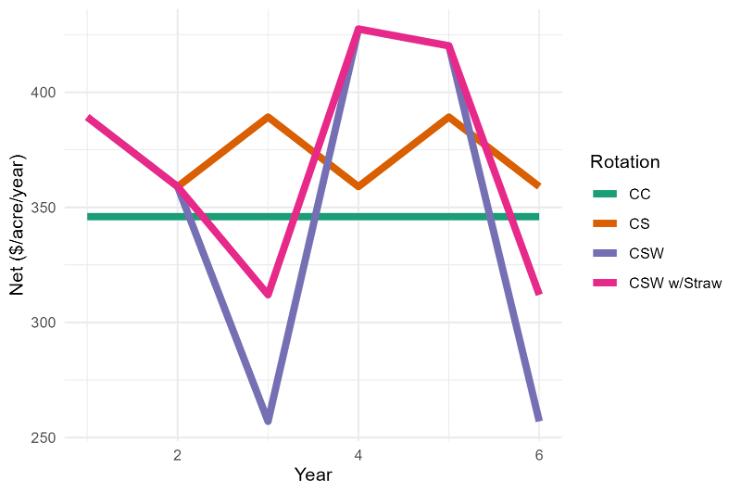
Table 3. Net present value and per year returns to different rotations in Scenario II
| Rotation | Profit per year | NPV |
|---|---|---|
| CSW | $364.09 | $5,278.50 |
| CS | $374.13 | $5,425.88 |
| CC | $346.00 | $5,013.05 |
| CSW with straw | $382.42 | $5,531.28 |
Scenario III: Low yield effect
Lastly, we will consider the scenario where prices are consistent with scenario II, but we reduce the corn and soybean yield ”rotation benefit” to the lower-end-estimate from the literature. For this scenario, we reduced the extended rotation-yield benefit to corn from 4.5% to 0%, and from 11% to 5% for soybean.
Under this pessimistic scenario, NPV from the CS rotation exceeds that from both the CSW and CSW+Straw rotations (Figure 5). Hence, the actual magnitude of the extended rotation-yield benefit to corn and soybean plays an important role in determining the relative return on investment in these rotations.
Uncertainty about the size of the yield benefit to corn and soybeans from extended rotations likely plays a fundamental role in acreage decisions, and why Wisconsin has only a small share of acreage in diverse rotations.
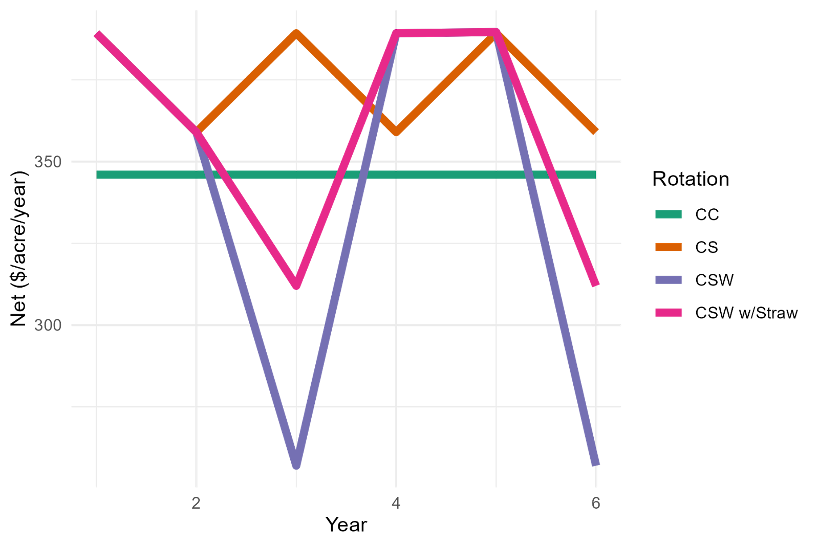
Table 4. Net present value and per year returns to different rotations in Scenario III
| Rotation | Profit per year | NPV |
|---|---|---|
| CSW | $344.01 | $5,004.42 |
| CS | $374.13 | $5,425.88 |
| CC | $346.00 | $5,013.05 |
| CSW with straw | $362.34 | $5,257.19 |
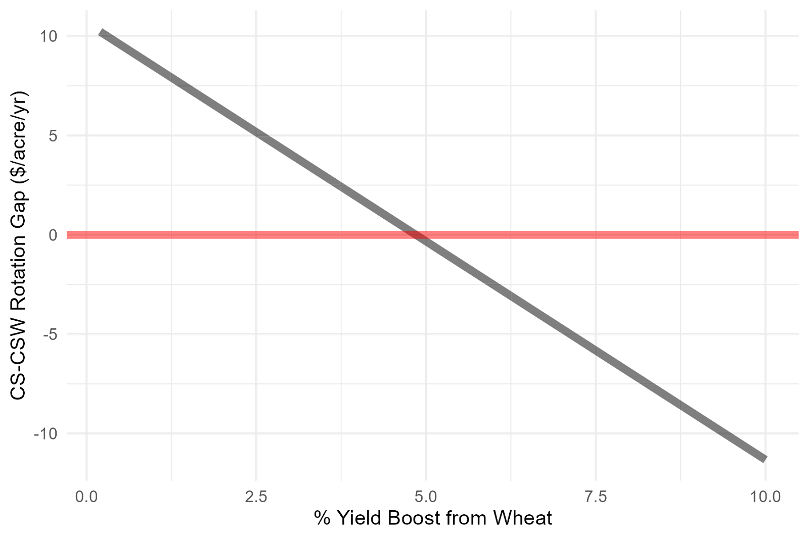
So, how big does the yield benefit to corn and soybeans need to be in extended rotations with wheat in order to breakeven? Figure 6 plots the net return difference between CS and CSW with straw across different values of the yield enhancing effect. This analysis demonstrates that a uniform 5% increase in corn and soybean yields would be sufficient to justify an investment into wheat.
Management flexibility for legume cover crops
Due to the timing of the winter wheat growing season, incorporating wheat also carries financial and management flexibility. A summer harvested crop brings cash flow to the farm at a time when there might otherwise be none. If price points change and corn and/or soybeans are dramatically more profitable, a wheat crop can be terminated, serving as a cover crop, and corn/soybean planted.
Harvesting wheat earlier in the year allows for a wider window to successfully establish cover crops and accumulate meaningful amounts of biomass prior to winter; generating nutrient and soil health benefits. Of particular value, this window allows for legume cover crop species (such as red clover or hairy vetch, for example) to establish and put on significant amounts of fall biomass. With adequate growth, and through their symbiotic relationships with soil Rhizobia that “fix” atmospheric nitrogen (N), legume cover crops can provide a significant N credit to subsequent cash crops such as corn.
Establishing legume covers, however, may be more costly than the more typical grass cover crops. A wide range of data estimates that clover and vetch cover crops can cost between $40-60 per acre including seed, planting, and termination costs. There are a number of potential benefits, though, that may offset these costs.
With good establishment, University of Wisconsin specialists have estimated that N credits from legume cover crops to corn for grain often range between 40-80 lb N/acre (Ruark, 2021). At a current market price of $0.55/lb of N, the economic value of this nutrient credit ranges $22 – $44 per acre.
Additionally, that research showed an average corn grain yield increase of 8 bu/ac when corn followed the legume cover crops compared to no cover crop. The value of the additional grain yield using current corn prices would be about $32/ac; for a total added benefit of $54 – $76 per acre when considering the reduced N from fertilizer and added yield.
Furthermore, farmers may be eligible for cover crop cost-share through USDA-Natural Resource Conservation Service, Producer-Led Watershed Groups, and others up to $65 per acre to offset implementation costs.
Table 5. Cost per unit of nitrogen from red clover*, UAN 28, and urea
Red Clover*
| $ per 50 lbs. | $ per lb. N |
|---|---|
| 100 | 0.30 |
| 110 | 0.33 |
| 120 | 0.36 |
| 130 | 0.39 |
| 140 | 0.42 |
| 150 | 0.45 |
| 160 | 0.48 |
UAN 28
| $ per ton | $ per lb. N |
|---|---|
| 200 | 0.36 |
| 250 | 0.45 |
| 300 | 0.54 |
| 350 | 0.63 |
| 400 | 0.72 |
| 450 | 0.81 |
| 500 | 0.90 |
Urea
| $ per ton | $ per lb. N |
|---|---|
| 300 | 0.33 |
| 350 | 0.38 |
| 400 | 0.43 |
| 450 | 0.49 |
| 500 | 0.54 |
| 550 | 0.60 |
| 600 | 0.65 |
Additionally, building perennial cover for soils may result in longer-run agronomic and economic benefits, like increased water-holding capacity and plant available water for times of drought. To investigate the expected resiliency impacts, visit the cover crop risk decision-support tool.
In summary, due to the varied growing season of winter wheat, additional opportunities exist to grow cover crop biomass to protect and build a healthy soil profile. While introducing legume cover for the first time is not cost-free and without risk, the direct nutrient credits and by leveraging cost-share opportunities make the winter wheat and legume cover crop combination both economically viable and the timing feasible.
References
Agomoh IV, Drury CF, Yang X, Phillips LA, Reynolds WD. Crop rotation enhances soybean yields and soil health indicators. Soil Sci Soc Am J. 2021; 85: 1185–1195. https://doi.org/10.1002/saj2.20241
Huo, D., Frey, T., Lindsey, L. E., & Benitez, M.-S. Yield and soil responses to adding wheat to a corn–soybean rotation. Crop Forage & Turfgrass Mgmt. 2022; 8: e20143. https://doi.org/10.1002/cft2.20143
Janovicek K, Hooker D, Weersink A, Vyn R, Deen B. Corn and soybean yields and returns are greater in rotations with wheat. Agronomy Journal. 2021; 113: 1691–1711. https://doi.org/10.1002/agj2.20605
Ruark, M. Quantifying the benefits of legume cover crops following winter wheat. 2021. Video recording presentation.
Updated: June 5, 2025
Reviewed by: Chris Bandura, Shawn Conley, Dane Elmquist, and Will Fulwider