Video Summary
This session features four short presentations on current on-farm nitrogen management, soil health, insect monitoring, and water quality research projects. Featured are Lindsey Rushford, Chris Bandura, Dane Elmquist, and Ellen Albright (UW–Madison Crops and Soils and Agriculture Water Quality Programs) as they share their findings and discuss opportunities for farmers to get involved in impactful research that enhances both economic viability and environmental sustainability.
Whether you’re interested in optimizing nitrogen use, improving soil health, monitoring pest populations, or understanding water quality impacts, this webinar offers valuable insights and practical advice. Discover how on-farm research can inform management decisions, promote sustainable practices, and contribute to statewide agricultural recommendations.
Transcript
0:00
Good afternoon everyone, thank you all for joining for the last webinar in our webinar series on conducting effective on farm research.
0:08
Today’s session we’re going to be highlighting different on farm research projects throughout the state, showcase some findings and some opportunities to get involved.
0:16
So these are going to be really rapid lightning talks that highlight diversity of subject areas, including nitrogen management, soil health, insect monitoring, and water quality, but hopefully leaves you with a lot of thoughts and some people to connect more about if you’re interested in learning more.
0:35
All right, so I’m going to kick off our lightning talks.
0:39
My name is Lindsey Rushford.
0:41
I’m an outreach specialist with UW Madison Division of Extension.
0:45
And I’ll introduce the Nitrogen Optimization Pilot Program and some preliminary data.
0:50
So I can’t continue without acknowledging my colleagues within the program.
0:54
So Monica Schauer is NOPP’s Research Director with UW Madison and is responsible for providing data analysis and figures that I’ll share later on.
1:04
And Susan Makert is NOPP’s Program Manager within DACAP.
1:10
So NOPP is a grant program funded by the State of Wisconsin and administered by Wisconsin’s Department of Ag Trade and Consumer Protection and supported by UW Madison.
1:23
These grants support farmers and their partners in investigating nitrogen fertilizer management on their farms by conducting 2 year on farm nitrogen rate trials.
1:36
So why are we interested in individual on farm nitrogen research when we already have statewide nitrogen recommendations?
1:44
It’s because nitrogen cycling is really complicated and so it’s an agronomic or economic challenge as well as being an environmental challenge.
1:54
The graphic on the left is showing the estimated percentage of private wells in Wisconsin per county that are over the nitrate standard of 10 parts per million.
2:05
Not only is this an issue for human health, but also environmental health and this scatter plot comes from the corn nitrogen rate calculator.
2:18
Optimum yield is on the vertical axis and optimum nitrogen rate is on the horizontal axis.
2:25
This is showing individual data points from nitrogen rate trials that feed into our state recommendations.
2:32
We can see the data points are all over the place, and this is because they each come from unique Wisconsin growing environments with a variety of soils, weather conditions and management.
2:44
So it’s important to conduct research under each of our individual environments to inform decisions we make on farm.
2:52
And that information can be shared regionally to farmers with similar systems and conditions.
2:58
And the data from all those trials across the state can feed back into the data sets that inform and fine tune the statewide recommendations.
3:09
So NOPP was developed to address the agronomic and environmental challenges that nitrogen management presents.
3:18
The primary short term goals are to answer producer specific nitrogen management questions and improve farm profitability.
3:27
The secondary and long term goals are to improve commercial nitrogen management efficiency across the state and to reduce nitrates in surface and groundwater.
3:40
To reiterate some of the program details, NOPP is a grant program funded by the State of Wisconsin, facilitated by DATCP and supported by UW Madison.
3:51
These grants are provided to producers to conduct 2 year on farm nitrogen research projects and trials in NOPP include at least 4 nitrogen rates, are replicated 4 times and include some required data collection such as routine soil, soil nitrate and yield.
4:12
And projects can also include an additional management practice such as tillage, manure or cover crops.
4:22
So in 2023 and 2024, when the when the program came about, there were 37 unique projects implemented across the state, which resulted in 108 individual trials.
4:35
So because there can be more than one producer involved in a project and because they’re all at least two years, we end up with many more trials than the number of projects.
4:46
And so not included in these numbers are the newly funded 2025 projects that will begin this year.
4:52
There were nine new projects that were funded.
4:57
So as I mentioned before, there’s some projects are nitrogen rate trials in corn and some of those also investigate an additional management practice that can impact nitrogen fertilizer such as cover crops or manure or other an endless number of other options.
5:17
And then there are nitrogen trials in crops such as potatoes, cranberries, forages, sunflowers.
5:23
And for this presentation, I’ll share on some findings from the corn nitrogen rate trials.
5:32
So now we can look at an example of some takeaways from someone who has conducted a corn nitrogen rate trial on their farm.
5:41
So NOPP trials have as many as six nitrogen rates, which are randomized and replicated 4 times across the field.
5:50
Following harvest, yield on the vertical axis is plotted against nitrogen rate on the horizontal axis, and then a statistical curve is fit to the data.
6:03
This is a typical yield response curve, though not every response curve looks like this.
6:09
In this example, we can see that yield increases at the lower nitrogen rates and then we see the yield start to plateau at the higher nitrogen rates.
6:22
So utilizing this curve, two data points are identified where that plateau begins, the agronomic optimum nitrogen rate or the AONR and the economic optimum nitrogen rate, which is the EONR.
6:35
The AONR is the nitrogen rate that maximizes yield and the EONR is the rate that maximizes profit.
6:46
In this case, AONR is 145 lbs of nitrogen per acre and this maximize maxes out our yield.
6:55
EONR is always lesser than or equal to AONR, and in this case, EONR is only 6 lbs per acre less at 139 lbs of nitrogen per acre.
7:10
So even though EONR may not achieve the greatest yield, in this case, the yield difference would be quite minimal.
7:17
This slightly lower rate maximizes our profit when we take into account the cost of nitrogen fertilizer and the price of corn.
7:28
So it’s important to keep in mind that this figure represents results that are unique to the soil type, system and season in which it was conducted.
7:38
But if we can imagine that this response curve is from a trial conducted on our own farm, we can very directly understand the environmental and financial costs of applying nitrogen fertilizer beyond the EONR.
7:52
So up into this range up here. This is because the additional nitrogen rates would very quickly reduce our profits and the nitrogen that isn’t reflected in additional yield at a high would be at a high risk for leaching and polluting our groundwater.
8:13
So even though we may not be able to apply the results of one yield response curve to all the other farms in Wisconsin, we can put together data from many site years and we might see some trends here.
8:29
The EONR on the vertical axis is plotted against AONR, and this diagonal dotted line is where EONR and AONR are equal.
8:43
So across NOPP corn trial sites in 2023 and 2024, that’s what these data points are representing.
8:52
Sometimes the EONR and AONR are equal, so such as this point that pretty pretty specifically lies right on the dotted line.
9:03
But the difference of EONR and AONR is sometimes quite large.
9:07
So this site has a difference of 45 pounds of nitrogen per acre.
9:13
And on average with all these data points, EONR was 13 lbs of nitrogen per acre less than AONR.
9:23
This highlights the opportunities for potential nitrogen fertilizer cost savings by applying nitrogen for profitability goals rather than yield goals.
9:37
And just as we saw with the data set that feeds into the state nitrogen recommendations, there is a wide range of optimum nitrogen rates in NOPP trials as well.
9:48
This is again due to the unique differences in soils, cropping history, management practices and localized weather across our state.
9:58
And the value of on farm nitrogen research not only informs management decisions on that farm, but is also shared regionally with other farmers and can contribute back into those state nitrogen recommendations.
10:15
So that’s all I have for you all today.
10:18
Tried to keep it short and sweet.
10:20
If anyone has is interested in learning more about NOPP, you can reach out to myself or you can use a QR code on the screen to access DATCP’s NOPP web page.
10:31
Which I’ll also put the link in the chat.
10:33
When I’m finished here.
10:35
I’ll also encourage you to contact your local extension crops and soils educator or a crops and soils outreach specialist with extension if you’re interested in on farm research or investigating your on farm nitrogen management in other ways.
10:50
So I’ll leave it at that.
10:51
Thank you.
10:52
Thank you.
10:53
So hello everyone, my name is Chris Bandura.
10:56
I’m coming to you today from the attic of a shed somewhere in Clark County, Wisconsin that has no heat in it.
11:03
So I’m a little chilly right now. Excited to be talking with you today about some benchmarking soil health in Wisconsin data with on farm samples.
11:14
So let’s go ahead and dive right in.
11:18
All right, So we are going to be thinking a little bit about kind of big picture here at the beginning about how we can evaluate soil health and ultimately soil function.
11:31
So I’m going to put on screen here this this pretty classical demonstration that many folks have likely seen right?
11:37
It, it, this is a rainfall simulator where we have soil samples from, from different cropping systems or different fields placed on on the shelf here.
11:48
And then we artificially put rain on top of that.
11:51
And we look at infiltration and runoff, right?
11:54
And so we can pretty clearly see as we move from from left to right, the amount of water and soil running off of these samples increases quite a bit as we go from intense ground cover, lots of roots, what you might think of as a soil health management system to more bare ground.
12:14
My, my point here, right, is that often times when we think about soil health and function, there’s a lot of things that we can do and see in the field with our eyes, with a shovel and so on and so forth.
12:27
And, and really what, what the research or the project that we’re going to highlight here today gets that is how can we use laboratory tests for soil health and soil function to help us understand what soil function is doing on our, on our ground and how soil properties, right?
12:45
The inherent properties that Mother Nature dealt us and our management that we can control and do, how does that impact soil function?
12:55
So with that introducing I think for the second time, I think the first time this data set was really shared in this matter was at the Agri Business Classic conference.
13:05
So this is the second platform for that, but the Wisconsin Soil Health Database and right off the top like to give a hat tip to Dr. Matt Ruark.
13:14
This is essentially his data set.
13:17
Several folks and a lot of work has gone into compiling this database.
13:22
More recently, our host today, Abby Augarten, has been very helpful in in looking through this data with us as well as Bethany Canales with with extension doing some of the data analysis.
13:35
Ashley Waggoner and Hava Blair with additional support as well.
13:38
So with that, this dataset has about 1000 soil samples from across the state, several different years being represented in this data as well from working farms, right.
13:50
So on farm research, very collaborative project between faculty, graduate students, other partners, and of course, most importantly the farmers.
14:00
So in addition to collecting these soil samples, this project also collected a lot of information about the the soil type information, primarily looking at soil texture and inherent soil drainage class, in addition to some other cropping, cropping system management information, right.
14:19
So are we looking at annual systems and perennial systems?
14:24
How diverse is the crop rotation, where that sample came from?
14:27
What’s the manure history?
14:30
That’s right.
14:32
And so when we when we pull up the map here, you can kind of see, don’t worry about the colors at this point, but you can just see kind of the geographic spread where these samples have come from across the state.
14:44
And then apparently some came from Iowa and and Illinois as well.
14:48
We’re not sure how those snuck in there, but, but they’re in here nonetheless.
14:52
But right, the goal of this, of this project currently is to provide farmers and, and consultants with some context regarding what these soil indicators might mean and, and what, what’s their soil function relative to say other farms or fields that are under similar cropping and soil conditions, right.
15:12
So if you get a soil health test back, often times you look at the result and you wonder, well, what in the world does this mean?
15:20
And so this dataset and, and, and the ways that we’re trying to help provide some of the, the interpretation behind this data is to help bring context to so you have something to compare to. The soil health indicators that that are currently in this dataset include the following.
15:39
So we’ve got soil organic matter on the very top and then the next level below that is total carbon and total nitrogen.
15:48
And we can think of these three indicators or these three properties of soil, right, OM, total carbon, total nitrogen, think of them as the oil reserves, right?
15:58
It’s, it’s all of the things that are present in that soil system.
16:03
And then if you go the the third level down right on the left hand side, we’ve got some additional carbon based soil health indicators to include the permanganate oxidizable carbon or POXC.
16:14
You might have also heard this been called active carbon in the past.
16:19
This is a smaller portion.
16:20
It’s thought to be the smaller more available or accessible pool of carbon in the organic matter for our biological communities to use as an energy source.
16:31
And we also have potentially mineralizable carbon.
16:34
This one’s got a lot of different names: soil respiration, the CO2 burst test, the Solvita test from back in the day.
16:43
But essentially what that’s what that’s looking at is the abundance and activity of our microbial communities in soils. To the right you, you have some, some other nitrogen indicators, right?
16:55
So we have potentially mineralizable nitrogen or or PMN, right?
16:59
This is looking at the amount of nitrogen that our, our biological communities are converting into plant available nitrogen in a certain period of time in the lab.
17:10
And it’s also looking at, you know, how what is that soil substrate, how does that look like from an availability standpoint for microbes to access that nitrogen and do those conversions for us.
17:21
So it’s really looking at nitrogen cycling ability.
17:25
And the one on the bottom, bottom right there, autoclave citrate extractable or ACE protein.
17:32
This is the smaller pool of nitrogen that’s organically bound but thought to be microbially available, right?
17:39
So like I mentioned, the ones at the top, the three organic matter, total carbon, total nitrogen, that’s the oil reserves.
17:47
Think of these other 4 indicators that are in these lighter boxes as what’s in the gas tank today.
17:52
These are the more reactive and available indicators of, of carbon cycling and nutrient cycling in our systems.
18:01
And so as we think about why did we use these tests and, and not some others, because believe me, there is a plethora of others out there to choose from, right?
18:12
What’s important when we think about soil health testing or evaluation is we’re really trying to look at #1 soil function, right?
18:20
So are these indicators related to or predictive of do they have the ability to inform us about some function that soils are supposed to do or they are doing?
18:32
But they should also be sensitive to changes in management and specifically management that kind of falls in this that these principles and soil health that we talked about a lot, right.
18:42
So minimizing disturbance, increasing the diversity of those systems, bringing livestock into those systems and so on.
18:49
And so these indicators ought to be sensitive to these changes in management, right.
18:55
So if we are in a full tillage type system and we we go down to no till, right, these indicators over over a relatively short period of time should start to pick up and in an increase in number as that soil function starts to change, right.
19:12
That soils got a greater ability to do some of the things that we want our soils to do. And this, this, this aspect of time, right?
19:20
So we know that organic matter and, and total carbon, they change on a very, very over a long period of time.
19:29
It’s very hard to detect a meaningful change.
19:32
Whereas these other indicators, we can see something happening a little bit quicker.
19:36
So they’re a little bit more practical to use.
19:40
So stepping back out, right?
19:41
So we have 1000 data points.
19:43
We’ve got all the soil property data, we’ve got a lot of the management information.
19:48
How do we start to divide this data set up in a way that it’s meaningful in a practical way for you all to do something with?
19:55
So again, just to kind of support how we laid this out, we, we, we know from prior research that soil inherent properties are going to influence the soil’s ability to perform certain functions.
20:08
Therefore, inherent soil properties also impact.
20:12
How different soil health tests respond, right?
20:14
So in this study by Lindsay Malone here in Wisconsin, they looked at soil drainage class and soil texture class and and its relative impact on explaining variation or differences, excuse me, in several different soil health indicators.
20:32
And what you can see here is that drainage class was the number one most important variable and texture was the number one for, for that nitrogen cycling, potentially mineralizable nitrogen indicator, right?
20:44
So we know that inherent properties matter.
20:47
And then our host today, Abby Augarten, some work that she’s published recently highlights the impact that that management systems have on soil function and therefore these indicators as well, right?
20:57
So we know we have to balance these two things.
21:01
So our first, our first stab at this dataset resulted in dividing everything into three big buckets.
21:07
So on the left hand side, we’ve got this, we’ve got what we call sandy soil.
21:13
So it’s loamy sand or coarser, dumped into that black colored box there.
21:19
And you can see the average soil organic matter in this example is 2.2%.
21:24
In the middle, we have medium and fine textured soils with a lot of different cropping systems and management happening there, right?
21:31
But medium and fine textured soils, you can see organic matter up to 3.1% and then pasture based systems are their own bucket if you will and you can see 4% organic matter there.
21:46
And so really just looking at all of the data summarized in one place, this is going to look familiar at some point this year, right?
21:53
We’re going to have this extension resource available with some of these benchmark average values for these different buckets as well as these normal ranges for you to be able to use.
22:06
So for for each soil health test on the left column, if you’re a farmer on sand, you would pick that sand category.
22:16
There’s the average of each soil health test in the sand category.
22:20
And when we say range, that’s the middle 50% of all the sand data points that we have in the dataset.
22:27
So it’s the middle 50% is what we’re calling the normal range, the normally observed range.
22:34
And you can see as you move from left to right, in general right, these soil health indicators increase, therefore representing some improvement in soil function as you go from left to right.
22:48
So also one of the other things that we’re doing with this data set is to really drill into this medium and find texture group a little bit more to understand how management and other soil properties are impacting these things.
23:02
So again, looking at drainage class here, the black boxes are poorly drained soils, the red are well drained soils, you know, we can see that drainage does not seem to impact that mineralizable carbon indicator, but it does have some control over total soil organic matter.
23:20
So looking at some of these trends, here’s another way that you as a farmer could use this information right.
23:27
You’re on a silt loam soil.
23:29
You would pick poorly drained or well drained, and you could use this information to look at your function relative to the dataset.
23:38
Here’s manure history.
23:39
So we’re looking at all sorts of different combinations.
23:42
So that the key take away of this work is that that organic matter, carbon and nitrogen, those total pools are more influenced by soil properties than management.
23:53
The biological indicators, right.
23:54
Those other four that we talked about seem to be more influenced by what we do, what we can control than the soil properties.
24:03
And like I said, this is going to help contextualize some of these indicators on your farms for you. Really quickly,
24:10
And I’m almost out of time here.
24:12
Coming also later this year will be a soil health explorer, the WISHE tool.
24:18
We’ll see if I get enough buy in to actually call it that.
24:22
But anyways, looking at making this dataset entirely available to you where you can select which indicator you want to look at and which combination of soil variables and management variables you want to understand and learn how these things are impacting the soil function indicators.
24:41
Quick opportunities to engage.
24:43
So this summer and next summer, using the NOPP network, some extension and NOPP collaborators, we are going to be collecting soil samples from the 0 nitrogen plots across the state.
24:57
And we’re looking to start looking at the relationship between some of these soil health indicators and the corn yield response, optimum nitrogen fertilizer rates to see what, what use cases are out there for using these soil biological indicators to help us manage our nitrogen a little better.
25:17
So keep an ear out.
25:19
You might be asked if you’re on an NOPP project to help us out with that.
25:24
Lastly, last thing I’ll say, so Shawn Conley and Mark Kendall in the in the Cool Bean lab are doing the soil health and soybean soil health analysis here.
25:35
So if you’re interested in participating in that, looking at getting samples from 4 soybean fields this year, they’re going to run a suite of soil health indicators on those. Data would be shared back with you.
25:47
But if you’re interested in that real quick, you can capture Mark’s information here.
25:52
Otherwise, at the end, we can make this information available to you as well.
25:57
So I know that was a quick overview, but thank you for your time.
26:00
And that’s all I have for you today.
26:04
Thank you.
26:04
So yeah, I appreciate the opportunity to to be here with you all today.
26:08
My name is Dane Elmquist.
26:09
I’m a conservation cropping outreach specialist with UW Extension here.
26:14
And my, my talk is going to focus on some insect monitoring bugs, slugs and cover crops.
26:20
We’re going to call slugs honorary insects for this this talk today.
26:24
So just gonna give a quick outline here, briefly gonna discuss 2 projects.
26:29
The first project is it really focused on on cover crops and pest moths. This just started last year.
26:34
So I’ll be able to share a some results as well as some opportunities for for this year.
26:39
The second project is gonna focus on slugs in conservation cropping systems.
26:43
It’s an upcoming project, so I’ll talk about its background, you know, why we’re doing it and some some opportunities to participate.
26:50
Just real quick before we kind of dive into to the good stuff here, just want to touch on, you know, why, why do we care about on farm research and insects in particular in conservation cropping systems.
26:59
So the adoption of these conservation cropping systems like no-till and cover cropping, these have a, a really big impact on our insect communities on farm.
27:09
So these are both the good bugs that provide valuable ecosystem services that we’re, we’re trying to maximize, but also the pest bugs that we, we want to control.
27:18
And these conservation cropping practices, you know, they provide habitat and food for beneficial insects.
27:23
And this is, this is especially true in the spring when there’s typically a a lack of food.
27:28
One major group of of beneficials that are are positively affected by these conservation practices are natural enemies or predators.
27:34
Good example of that is a, a ground beetle shown here on the screen.
27:38
And these are animals that that provide biological control, helping keep pests in check.
27:42
So a valuable ecosystem service there.
27:45
Alternatively, cover crops can also support field crop pests like moths and flies and slugs.
27:51
Early spring vegetation is sometimes called a a green bridge because it provides resources for these pests until the row crops emerge and then they move on to those row crops potentially.
28:01
So again, pests like armyworm, cutworm and slugs are some example of these, these potential pests in in conservation cropping systems.
28:08
So part of the systems level approach, I think to, to understanding conservation cropping practices really needs to involve studying how these good and bad bugs respond to these practices to, to maximize the benefits from the good bugs and minimize the benefits from the bad bugs.
28:22
And that’s put pretty simply there.
28:24
But that’s, that’s ultimately kind of the, the message.
28:27
All right, So jumping into it here, I’m going to start start talking about this cover crops and pest moths on farm research project.
28:34
So several moth tests again, like true armyworm, blackcut worm.
28:38
They migrate to Wisconsin in the spring and they’re looking for grassy hosts like cereal rye to lay their eggs.
28:44
Planting corn, following cereal rye, you know, especially if if farmers are really pushing the corn planting closer to cover crop termination or planting green, this sets up the potential for for a green bridge.
28:54
And that’s kind of what we’re seeing here.
28:55
In this, this picture here, you can see some cereal rye dying back with newly emerged corn coming up there.
29:03
So we were able to, to work with some farms here to conduct a small pilot study in, in 2024 exploring the question basically how to cover crops planted before corn affect the abundance of pest moths, specifically true armyworm and their natural enemies on, on farms in Wisconsin.
29:18
And so to do this, we, we leverage the DATCP statewide pest monitoring network.
29:24
So all the data that we collected for this project also contributed to their program.
29:28
So really appreciative for Tracy Schilder and DATCP generally for supporting this work.
29:35
All right, so getting into some of the nitty gritty here, we sampled the fields for true armyworm injury to corn and natural enemies on farms in in five counties across Wisconsin.
29:44
I want to give a shout out here to to Steve Okonek, former Extension colleague, and Josh Kamps for their teamwork and running the traps in Jackson and Rock County respectively.
29:54
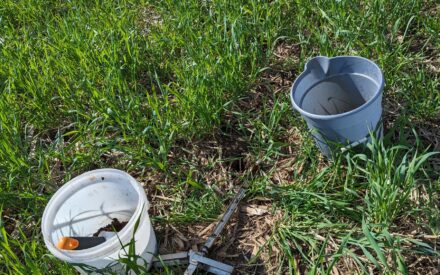
So we monitored 8 field pairs, 16 total fields where corn was planted either after a cereal rye cover crop or into a field with no previous cover crop.
30:04
We monitored the adult moth abundance using these green bucket traps with a with a pheromone lure.
30:11
The lures were were checked weekly.
30:13
Excuse me.
30:13
The traps were checked weekly.
30:15
Weekly.
30:15
We changed the lures every six weeks, and we kept all the bycatch from a subset of traps to identify and quantify natural enemies.
30:23
And so bycatch is basically just all the other bugs that end up in the trap that are not the target insect, which in this case is the true armyworm.
30:30
All right, so what’d we find out?
30:33
Last year we caught a total of 931 total True Armyworm adults at all the fields sampled.
30:38
And we did observe that the number of true armyworm adults captured was significantly greater for fields that had a rye cover crop compared to fields with no cover crop.
30:47
When we start to look at our our natural enemies, we collected 280 total natural enemies from the bycatch from 22 different arthropod families or groups.
30:55
And these natural abundance, the natural enemy abundance was significantly greater in corn fields that had a rye cover crop compared to to cornfields with no rye cover crops.
31:04
So that’s kind of a, a positive result there from the natural enemy standpoint.
31:10
All right, so some what did, what did we learn from this, right.
31:12
Well, I think 1 big take away message is that farmers planting corn following a ride cover crop need to be aware of the potential for for true armyworm adults to be attracted to this rye cover crop.
31:21
And these fields should really be prioritized for for scouting, especially if you’re going to be terminating cover crops late or planting green. Preliminary results
31:29
Do you suggest that that cover crops may be promoting natural enemies?
31:32
But this again, is, is an aspect of kind of the insect cover crop relationship that needs a lot more research, especially here in Wisconsin where we’re we’re lacking some of that knowledge.
31:41
So looking ahead to to opportunities in 2025.
31:44
DATCP’s pest survey just kicked off this week.
31:47
Actually, traps for true armyworm and black cutworm should have been placed this week.
31:53
So, you know, even if, if folks are interested in, in participating, you know, not necessarily participating in like a, a broader study like I just described here, just getting involved with the, the Pest Survey Network is a, is a really great way to, to develop some partnerships.
32:07
You know, if you’re a farmer, you’re an agronomist, if you’re in the field often this is a, a good thing to, to get involved in if you, if you’ve got the time. If you do want to get a little bit more specific, we are going to be repeating this similar study again this year.
32:22
We have a few, a fewer sites picked out so far.
32:25
So if you do plan to join the Pest Survey Network and you do have the capacity to kind of consider different management aspects, for example, like grass cover crops, preceding corn, when you’re choosing the trap locations, it would be really great to to connect with you.
32:39
Perhaps we can get together and and share some data.
32:42
So feel free to to reach out to myself or Josh Kamps as well as in involved in a lot of this work and is a great resource and partner in in these types of projects.
32:50
So getting in touch with either of us is a a good next step there.
32:54
All right, so moving on to the second project, thinking about slugs. 2024 was a, a slugfest for many Wisconsin farmers, particularly in in no till and cover crop fields.
33:05
I talked to some folks where they had to to replant their soybean fields, you know, 2 times, 3 times and some long term no tillers went back to tillage to try and relieve some of the slug pressure.
33:14
So these high slug populations resulted from from multiple factors.
33:18
You know, first the winter last year was really mild, right?
33:20
Slugs usually lay eggs in the fall.
33:23
The adults die from the cold temperatures over the winter, but when the winter is warm, like last year, the adult slugs can survive.
33:29
And then they lay more eggs in the spring.
33:31
And this causes multiple egg hatches in the following spring.
33:34
And the juvenile slugs that are doing a lot of this feeding damage are active for longer.
33:38
We also had a wet and cool spring.
33:40
This kept some plants, you know, growing a little bit more slowly and just provided really optimal conditions for for slugs to to be an issue.
33:48
And assuming the climate change projections for for Wisconsin are accurate, these types of patterns might be more of the norm in our future in in Wisconsin, you know, warmer winters, wetter springs.
33:59
These things coupled with the increased adoption of conservation cropping practices like no till and cover crops, there’s, there’s some potential for slugs to be an increasingly important and, and challenging pest in Wisconsin.
34:10
So there’s something that we definitely want to get ahead of.
34:13
And one thing that myself and some of my extension colleagues found in 2024 when we were getting calls is that we were relying a lot on research and resources from other states.
34:21
And despite the, you know, potential growing concern about this pest in Wisconsin, little is known about our our slug populations across the state.
34:30
So we want to change this, right.
34:31
And to better understand, you know, slug pressure and their population dynamics, several of us, an extension, myself, Laura Flandermeyer and Jordan Kampa from NPM Nutrient Pest Management, teamed up with Doctor Emily Bick, who’s our faculty field crops entomologist and her digital entomology lab to establish Slugnet, which is a statewide slug pest monitoring network.
34:52
The first goal of Slugnet is, is to monitor slug activity and try to discern patterns to their emergence and damage.
34:58
And the second kind of more, more long term goal that’s going to require a, a few years of data collection is to, is to couple these, these slug population numbers, management data and climate data to try and develop some type of model to help predict slug, slug outbreaks and, and damage risk.
35:14
Really excited to talk to folks about this project because 2025 is our, our pilot year.
35:18
So we’re going to be setting traps here in the next, you know, 3-4 weeks and we’re taking a, a very inclusive citizen science approach to participation.
35:26
So it’s really open to, to a lot of folks out there.
35:29
So how does it work, right?
35:31
Volunteers are, are going to sign up to, to monitor a field or multiple fields.
35:35
They’ll register on the Slugnet website, which goes live next week.
35:39
They complete a, a field management history survey form for for each field they plan to monitor.
35:45
And then you go out and collect the data to assess the slug populations.
35:48
And I’m sure kind of the first question is, is how do you trap slugs?
35:52
Right.
35:52
So slugs are nocturnal feeders.
35:54
They’re seeking refuge under debris and on the soil surface during the day.
35:58
So you can trap slugs using what’s called a, a refuge trap, which for our purposes are really fancy one square foot white roofing shingles that you secure to the ground with landscape staples.
36:09
These traps essentially just provide a refuge for slugs to hide under during the daytime.
36:14
So the first step for volunteers is to establish shingle traps in the field.
36:18
We’re suggesting that volunteers prioritize fields that use conservation practices and if possible had a history of slug damage in 2024 or or previously.
36:26
But conventional fields are allowed to participate as well.
36:29
And we’re really focused on fields planted to to corn or soybean this year.
36:33
Volunteers are responsible for checking traps weekly.
36:37
Traps are usually checked in the morning by lifting the shingle, turning it over and then snapping a picture of the bottom of the shingle trap using a smartphone.
36:44
So the photo is geotagged and we have a GPS coordinate associated with it.
36:47
Then the photos are submitted to the SlugNet website where the slugs are quantified.
36:52
The data will then be publicly available and aggregated at a county level.
36:55
Something like you see here using this map, which is just an example from the IPM website.
37:00
And really we really are kind of hoping that this photo taking process will will streamline volunteer participation and and encourage folks to to get out there and monitor multiple fields if possible.
37:11
So once we are in the season, Extension is going to be publishing weekly slug monitoring updates that report average slug counts by county and try to contextualize these with some weather patterns and other agronomic parameters.
37:23
This is our pilot year, so we’re really excited about getting people involved.
37:26
Again, we’re looking for volunteers, good fit for Extension educators, farmers, agronomists, county conservation staff.
37:33
Yeah, thanks to everyone too, who has already agreed to to monitor some traps.
37:37
Please reach out to myself or anyone on the Slugnet team if you’re interested in participating.
37:42
You can see my e-mail for myself and Laura Flandermeyer are down there in the corner.
37:47
Volunteers are going to be provided with shingles, landscape staples, flags and given instructions on how to how to operate the website.
37:54
So hopefully it’s pretty straightforward process.
37:56
But again, it’s our first year, so we’re always looking for, for some feedback and, and yeah, happy to take feedback on any aspect of the project from the website, communication, methods, etcetera.
38:09
So if you just want some more general information about slugs in Wisconsin, you can check out our our new extension publication, Managing Slugs in Wisconsin Field Crops.
38:17
There’s QR code there.
38:19
And yeah, we really are looking forward to kind of taking a proactive approach.
38:24
It’s really essential to kind of get ahead of slug problems if possible using an integrated pest management strategies and monitoring is going to be an important part of improving our understanding of of slug pests in Wisconsin field crops.
38:35
So hopefully some of this insect and slug monitoring work is interesting to you and feel free to reach out.
38:41
So thank you.
38:46
All right, good afternoon, everyone.
38:47
Thank you for the opportunity to be a part of this webinar series.
38:50
My name is Ellen Albright.
38:52
I’m a researcher with the Wisconsin Discovery Farms program, and I wanted to use today as an opportunity just to give you an overview of what we do and highlight some of our current research projects.
39:03
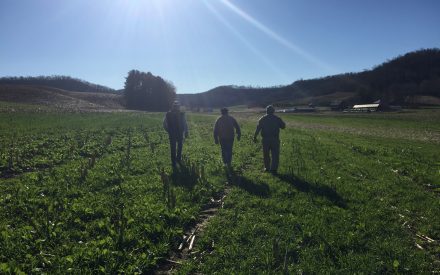
So to kick things off here, Discovery Farms is a farmer-led research and outreach program.
39:08
We do all of our research on privately operated farms across the state, and the goal of our program is to better understand the complex relationship between different agricultural practices and water quality outcomes, both for our groundwater and our surface waters like lakes and rivers.
39:27
The Wisconsin Discovery Farms program started in the early 2000s and since then programs have also been started in Minnesota, Arkansas, and Vermont.
39:37
And I just wanted to put a little plug in here that every year the four states get together to host a webinar where we share program updates and highlight some of our recent findings.
39:46
And we just had our 2025 webinar earlier this week.
39:49
So if you’re interested in hearing about what the other states are up to, and there’s a lot of great information on biochar, cover crops, tile drainage.
39:58
So feel free to check that out with the QR code.
40:01
Now obviously, agriculture differs a lot across these four states.
40:04
So the four Discovery Farms programs modify their research program to fit those needs.
40:10
However, all four programs follow the three pillars of the Discovery Farms philosophy.
40:15
That is farmer leadership, conducting credible water quality research, and sharing out results.
40:22
And for today’s talk I really wanted to focus on the second point and give you a better idea of what it is we actually do on a day-to-day basis, what agriculture water quality research actually looks like.
40:34
So I think I could boil all of our our projects down to measuring water that leaves farm fields and then what is in that water.
40:42
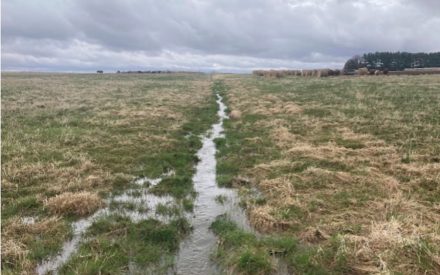
So we do this in a number of different ways.
40:45
Our most common method has been looking at surface runoff at the edge of the field is pictured here on the left.
40:51
But we also look at subsurface drainage as well.
40:54
That can be through tile drainage or more recently looking at infield water movement with a particular focus on nitrate leaching.
41:02
And I’ll talk a bit more about these these three methods in the context of our current projects.
41:11
So with, you know, measuring the water leaving the field, we also look at the amount of sediment and nutrients carried in that water.
41:17
And our goal here is to determine the amount of soil and nutrient losses as a function of that runoff or that drainage.
41:24
We combine this water quantity and quality information together with pertinent environmental data.
41:29
So what’s the soil type?
41:31
What was the weather like that year and then how the field was managed.
41:35
And our goal with with all of this data collection is to understand the timing and magnitude of soil and nutrient losses.
41:43
And if we do have instances where we see elevated losses, we want to try to understand why that happened so we can understand if there’s any management action that could have that could change things in the future.
41:56
So just getting into our current projects, I’m going to start with our surface and tile edge of field sites.
42:03
And I just wanted to walk you through a little bit more about how these stations work.
42:07
So I’m gonna do this focusing on a surface site pictured here, but our tile tile edge of field sites are pretty similar.
42:13
So the station is set up at the edge of a field where we have a, a known area in the field called a basin or any water arriving from snowmelt or rain, we know it flows to this point where the site’s installed.
42:26
At that point we put in a flume or that metal chute you see pictured there, build a small earthen berm just to make sure the water can’t flow around it.
42:34
So when we do have run off, it’s going to be flowing through that chute.
42:38
Now when we we monitor the height of the water that runs through and how long it flows, we could then calculate the total volume of water that ran off the field during that runoff event.
42:50
These stations have automated samplers and remote communications housed in this this gauging box.
42:56
So when there is a runoff event, our colleagues at USGS will be monitoring it and periodically triggering water samples to be taken.
43:04
So there’s a tube going into the flume and a pump.
43:07
So it’ll suck up water samples periodically during the runoff event, put them in bottles in a fridge in that gauging house.
43:15
So then we end up with a composite sample for the runoff event.
43:19
This is sent to a lab at UW Stevens Point analyzed for the sediment nitrogen and phosphorus in that sample and then we can use that to to build our understanding as I mentioned previously.
43:29
And again tile sites pretty similar set up just measuring the tile outflow.
43:36
We currently have 7 edge of field sites and one tile project.
43:41
Although we do measure nitrogen in the surface sites, we’re we’re more focused on soil and phosphorus losses at those sites.
43:47
And then this past fall, we’re really excited, we added a new tile project monitoring a woodchip bioreactor.
43:54
So this is a type of tile treatment where the tile line is routed through a pit filled with wood chips and nitrate is removed from the tile water through microbial denitrification.
44:05
This is a really common practice in some of our neighboring states, not so common in Wisconsin.
44:11
So we’re really excited to be able to evaluate this tile treatment method and see how it performs in our colder climate.
44:19
Just to, to walk through some of our our sites and projects briefly, we have 3 sites located in Langlade County in seed potato production.
44:28
And this is a a new cropping system for the Wisconsin Discovery Farms program.
44:32
So here we’re just really interested in better understanding the dynamics of soil and nutrient losses in this rotation.
44:41
We have two sites in Marathon County.
44:42
1 uses continuous cover and minimal tillage on a row crop system and the other is a grazing operation.
44:51
And then we have two surface sites in Kewanee County looking at different types of dairy forages.
44:56
And then again, that new bioreactor site was also installed in this county this past fall.
45:03
So that covers our surface and tile edge of field sites.
45:06
Next, I’ll just talk briefly about a relatively new method for us to look at in-field nitrate leaching.
45:13
So for these projects, our goal is to be able to measure nitrate leaching or the movement of nitrate from the crop rooting zone, where we want it available for crop uptake, but moving lower into the soil profile where it can eventually make its way into groundwater and cause some of the drinking water concerns that Lindsey talked about in her presentation.
45:32
And measuring, you know, subsurface nitrate movement is relatively easy relatively.
45:37
If you do have tile drainage, you can just measure the tile outflow.
45:41
However, many areas of our state that have elevated nitrate levels in groundwater don’t have a ton of tile drainage at this point.
45:49
So we need some method to measure that nitrate movement within the field itself.
45:53
And we’ve been using a method called equilibrium tension lysimeters.
45:57
That sounds a little technical, but I’ll just walk you through our setup in three steps.
46:02
So first off, a lysimeter is just anything that’s put into the soil to measure water and solute movement through the soil profile.
46:11
So in our case, our lysimeters are these large metal boxes.
46:14
They have a perforated top on them that lets water flow through, but doesn’t, you know, let soil fall in or anything.
46:21
These are installed below the rooting zone and they will collect any infiltrating water that passes through.
46:26
And then the lysimeters are connected to the surface with sample lines.
46:31
So our county partners will periodically pump the lysimeters to measure the total volume of drainage that was collected over a given time period and then analyze the nitrate content.
46:43
The last piece of the puzzle here as of these lysimeters are attached to vacuum lines that maintain a slight suction on that space in the lysimeter.
46:51
This is where the equilibrium tension part of the name comes in.
46:55
And our goal here is it’s not like a crazy suction, it’s going to suck water into the box.
46:59
It’s more to make sure that void space within the lysimeter is acting in the same way as the soil.
47:05
So it’s mimicking soil matrix potential just to keep the water flowing as naturally as possible through that soil profile.
47:14
We currently have 3 lysimeter sites across the state, again focused on drainage and nitrate leaching.
47:19
And all of these sites are set up with a before/after control impact study design.
47:25
This means that we’ll have a period of baseline monitoring where the whole field, all of the lysimeters are treated the same.
47:33
And then we’ll enter a treatment phase where half of the field and half the lysimeters will receive some change in management practice.
47:41
And this design will allow us to evaluate how that practice affected nitrate leaching.
47:46
So hoping to identify things that will reduce nitrate leaching.
47:51
So again, we have 3 sites, 1 is in Pepin County.
47:55
It’s on a dairy farm and the exact treatment is still a little up in the air, but something related to manure management on sandy soils.
48:03
And again, we, we try to pick these treatments as something that’s of interest to the participating farmer.
48:08
So it tends to be, you know, an evolving decision as the project continues.
48:14
Our second two sites are relatively new.
48:17
They’ve only been in for about a year and a half.
48:19
So treatments still still really to be determined.
48:22
But one is in Rock County on a cash grain rotation, so that farmer’s interested in investigating either some aspects of his synthetic nitrogen management or maybe something with grazing covers.
48:33
And our third site is in Calumet County on a dairy forage rotation and treatment is still to be determined.
48:40
Looking ahead to later this year, we’re really fortunate to be partnering with Dr. Steven Hall and others who are involved in the Rural Partnerships Initiative.
48:48
They’ll be installing lysimeters in the central sands and partner with them to better understand nitrate leaching dynamics and potato rotations.
48:59
Looking ahead for for some of our current and future discovery farms project.
49:03
One of our goals is to continue to pursue these more structured research questions and study designs like we have for our lysimeter sites.
49:11
And our goal here is to just get a better handle on some of the mechanisms of loss and to be able to evaluate specific conservation practices.
49:19
And you know, with the the ultimate goal of being able to provide more data-driven recommendations that can be localized to the diverse landscape of Wisconsin.
49:29
So I just want to end with thanking our participating farmers, project partners, funders and members of the Discovery Farm Steering Committee.
49:37
This research isn’t possible without all their efforts.
49:39
So thank you.
49:41
And please always feel free to contact any member of the Discovery Farms team if you have any questions or just want to connect further.
49:48
And I will turn things back over to Abby.
49:52
Thank you to all of our speakers.
49:55
I know we just have a few minutes left, but I am going to share my screen and wrap up the webinar series.
50:03
My name is Abby Augarten.
50:04
I realize I didn’t introduce myself earlier.
50:06
I started in my role with UW Extension a few months ago as the on farm research coordinator with really the goal of supporting farmer-driven, on-farm research efforts throughout the state.
50:19
And I know we started off this webinar series really highlighting the value of farmer-led research, but wanted to circle back to circle back to that as it really shapes what we’ve been talking about, right?
50:30
We know there’s huge value with on farm and farmer-led research to really test practices and products that farmers are interested in, that really can inform decision making on their own farms.
50:43
But we also see a ripple effect of having locally relevant research questions and research projects and opportunities for farmer to farmer learning among communities to really advance and enhance practice adoption.
50:57
We also see value statewide, right?
51:00
There’s no two growing seasons or soil conditions or historical field management that are alike, which means there’s a lot of diversity and a lot of nuance in how these practices might play out on the landscape.
51:14
So there’s a lot of value in bringing data together on an aggregate level and looking at insights and recommendations for best management practices across the diversity of soils, systems, landscapes and growing conditions.
51:30
And something that, you know, I really think we have in mind here at Extension of how can we get value across all of these scopes and scales with our on-farm and farmer-led research efforts.
51:41
So thinking about ways to support on farm research, really interested in, you know, supporting farmer-driven projects and unbiased and credible research design so that folks feel confidence with the results they’re finding at the end of the season.
51:56
We also know outreach is a huge component of that.
51:59
So making sure to share results back not only to participating farmers, but also to communities and creating, you know, opportunities to learn together at field days and events and with written materials.
52:11
And we also see collaboration being key, right?
52:14
There’s so many great folks that are involved and engaged in this area of on farm research and thinking about how we can come together, collaborate and develop a network to really support on farm research and again, see that value among among all of the scales.
52:31
So I know that examples of the research projects shared today were more of those coordinated research projects across many sites.
52:40
But I did want to take time to emphasize that, you know, UW Extension is here to support farmers and folks working with farmers to really tackle research questions and interests individually on their own farm.
52:53
So if you’re someone who has a question or you want to get involved or you’re working with a farmer that wants to test something, whether a new practice or product out, you know, please don’t hesitate to reach out to your local extension educator or outreach specialist or myself or others within UW Extension to provide support all the way from developing your research question through analyzing data and interpreting results.
53:17
We want to be a resource for that. But also, you know, as we think about creating support systems and networks and opportunities to further support farmer-led research and create opportunities to collaborate together,
53:32
I know we’ve been, and I’ve been, really interested in connecting with farmers, agronomist, partners to learn more about needs, interests and goals among the community.
53:41
So that’s how I’ve been spending my first couple months and really interested in connecting with folks.
53:47
If this is a space you want to work more in, please don’t hesitate to reach out.
53:51
That’s my e-mail or a QR code to take you to a survey.
53:56
So lastly, just thank you again for coming to this webinar series and thank you to all of our great presenters.
54:02
If you’re interested in more on-farm research, please don’t hesitate to reach out to any of these folks, to educators, to myself.
54:10
Yeah, I’m really excited for future opportunities.