We introduced Relative Forage Quality as an improvement to RFV in 2002. We released the term to better estimate energy and intake and to do it in accordance with NRC Nutrition Requirements for Dairy Animals released in 2001. The 2001 NRC recommended use of a summative TDN (TDN = digestible CP + Digestible NDF + Fatty Acids + Digestible Nonfiberous Carbohydrate) and we incorporated that into RFQ.
RFV and RFQ are based on the same concept:
intake times energy content divided by a standard (full bloom alfalfa).
RFV calculates energy from ADF while RFQ is calculated by two different equations depending on whether the forage is primarily legume or grass. For grass, the equation is based on actual animal feeding data from trials conducted in the Southeast during the 1980’s. For legumes and legume-grass mixtures the equation is:
RFQ = (dIntake, % of BW) × (dTDN, % of DM) ÷ 1.23
Where the ‘d’ indicates that digestible fiber is used in the calculation. Note that both intake and TDN (energy content) are adjusted for digestible fiber.
RFV and RFQ were designed to have similar mean and slope response so that the two numbers could be interchanged as we considered economic value. We have seen from various data sets that means are similar but individual values deviate 20 to 40% of the time. When numbers differ, digestible fiber is other than average and we believe that RFQ is a better estimator of value to the animal.
The two indices differ:
- For grass samples. RFV was based on alfalfa and discriminated against samples with high NDF. We have learned that, while grasses have higher NDF, it is more digestible and therefore RFQ better estimates value of grassy samples.
- Whenever legume digestibility is not “average.” Since RFV is based on estimating dry matter digestibility from ADF, fiber digestibility of samples that deviate from that prediction are poorly estimated. This includes samples grown under cool weather (higher than average digestibility) or samples that were stressed, have heat damage or high ash.
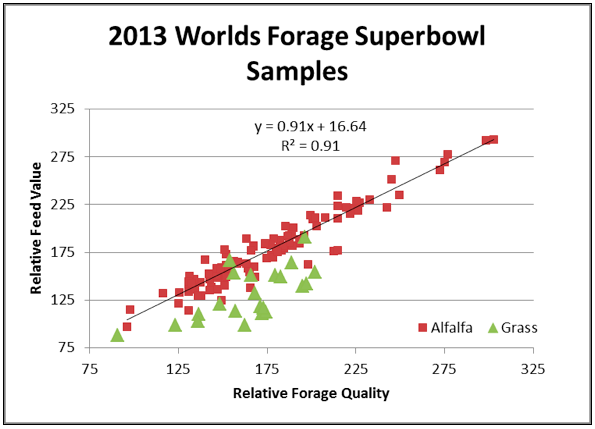
In samples from the Worlds Forage Superbowl (see graph) show that RFV and RFQ are highly correlated for alfalfa and with a similar mean (179 vs 177). However the range of RFQ values at any RFV point is great (e.g. RFQ ranges from 140 to 213 for RFV of 175).
Observe as well that grasses tend to have higher RFQ than RFV values. The mean difference from this data set was 34 points.
RFQ is useful for:
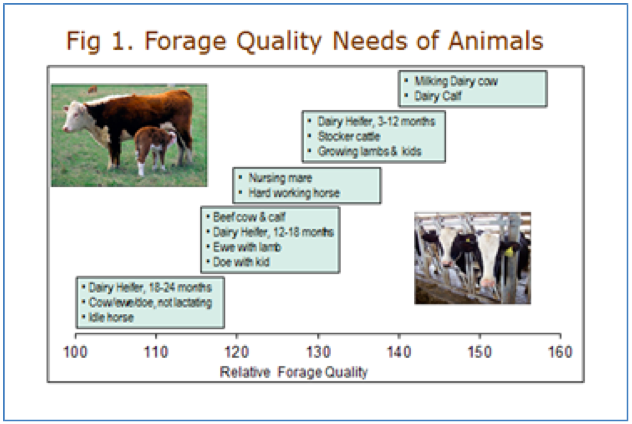
- Benchmarking how well an individual is doing in hay/haylage production. Are you optimizing forage quality for animal category (e.g. 150 for milking cows, less for growing heifers, beef and other animals)?
- Allocating feed to animals. Feeding the forage of greatest benefit to each animal type (see chart below).
- Marketing forage – forage has sold for about $1.25 to $1.50/pt of RFQ above the base price for RFQ100 hay.

 Small Grains, Big Gains
 Prevent plant considerations and small grains disease management
 Getting a Good Forage Stand
 Johnsongrass in Wisconsin


