
Weather and climate conditions this week in Wisconsin
Here are this week’s take-home points about the weather. As a reminder, AgWOW reports will be published weekly throughout the growing season. Scroll down for the full report.
Additionally, we’re collecting user feedback. Regardless of whether it’s your first time here or if you are a regular user, we’d love to hear from you!
Key Points
One Month Conditions
- Temperatures were 1-4°F above normal across northern Wisconsin and 4-7°F above normal across southern Wisconsin.
- Precipitation was largely above normal from Vilas to Pepin County and points south. Totals in portions of central, east central, and southeastern Wisconsin were at or above 300% of normal.
- The past month has been full of severe weather in Wisconsin. If you are looking for information on the recent severe weather, and a place to stay on top on top of any future weather, check out the State Climatology Office’s website and social media pages. Stay tuned for the April Climate Summary (to be released in May).
Impact
- Soil moisture levels at 4” depth at UW research farm stations (Wisconet) are near to or slightly lower than last week’s levels. Nonetheless, satellite-based soil moisture models indicate that much of the state has seen improvement in the 0-100cm soil moisture profile.
- Fieldwork and planting were halted by the large amounts of precipitation received, though drier conditions in the northwestern corner of the state allowed for limited tillage and planting.
- There has been improvement in drought since last week. A small area of drought remains in the far northwestern counties.
Outlook
- Precipitation is expected Sunday night through Tuesday morning (4/26-4/28) with higher totals for western and northern counties.
- Between the end of April and beginning of May, there is the chance for below-normal precipitation (33-40% odds) and temperatures (50-60% odds).
- Outlooks for the month of May and late spring into summer (May-July) indicate uncertainty about temperatures and precipitation, showing equal chances for above-, near-, or below-normal conditions.
Agronomic, Fruit and Vegetable Considerations
Field Conditions
- Avoid trafficking fields in wet conditions to prevent compaction and rutting, especially with recent heavy precipitation.
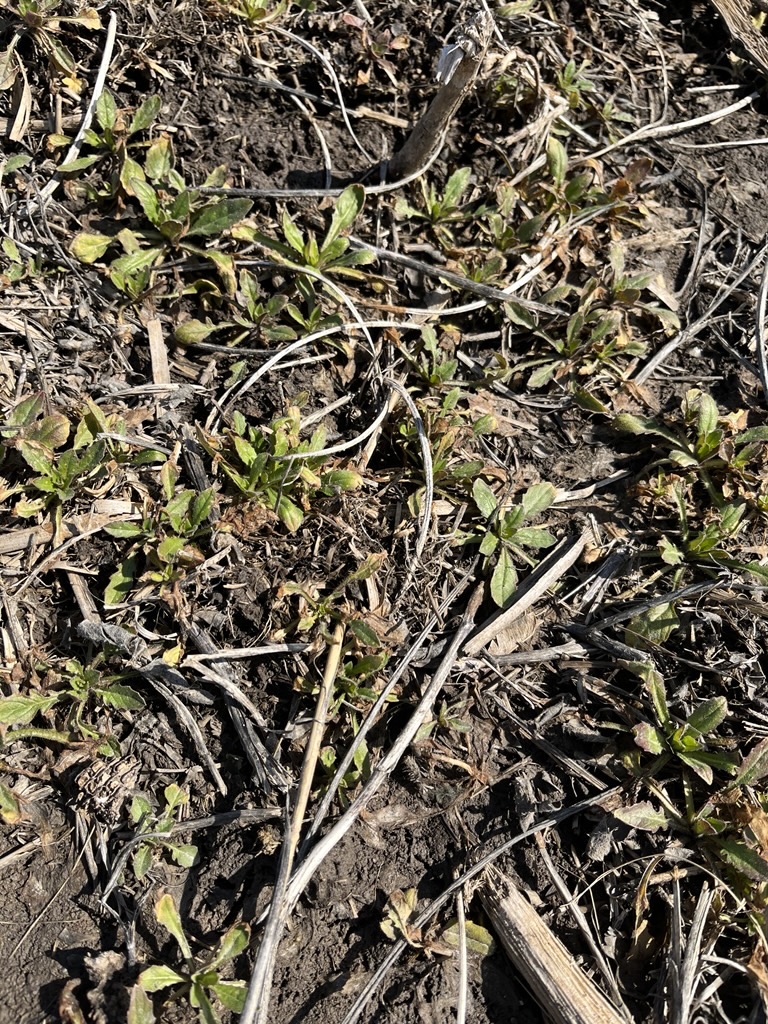
- Check alfalfa for any signs of winterkill. Reports have been minimal. Alfalfa is greening up nicely in Southern WI.
- Keep livestock out of critical and sensitive areas with soft, muddy ground, see this article on the value of keeping cattle clean.
- 2-4″ soil temperatures are warming with increased temperatures, especially in the southern half of the state. Soil temperatures should be consistently at 50 degrees F to reduce the risk of imbibitional chilling and soil-borne pathogens. Planting is underway in Southern WI.
Pest Management
- Start scouting fields by foot to note which early weed species are emerging.
- Be observant of black cutworm and true armyworm moths migrating through the state. Check the DATCP Pest Trap Network Maps.
- Ensure temperatures are conducive to herbicide applications. Pre-emergent herbicides require moisture for activation.
- Monitor insect degree days. Start scouting for alfalfa weevil at 300 DD.
Manure Applications
- Reminder of Wisconsin’s NR 151 Runoff Rules with the timing of manure spreading and current runoff levels. Check DATCP Runoff Risk Advisory Forecast.
Small Grains
- Assess winter grain stands. Check winter wheat for any signs of winterkill. Reports have been minimal.
- Avoid fertilizer applications in wet and cool conditions. Nitrogen loss is greater in wet conditions. Review small grain fertility. Feekes 5 is the stage where fertilizer and herbicide applications should take place. Review growth stages here.
Fruit Considerations
- Rain in the past week has driven disease infection events for several fruit crops. Reminder: Many protectants will wash off after 1 inch of rain.
- Fruit growers can reference the NEWA weather station network for past and forecasted disease infection events. Check out your nearest weather station: NEWA Weather Station Network (Cornell).
- Consider testing your frost protection devices: If you have frost protection like wind machines, you should be checking and testing them to be prepared in case you need to use them.
- If you have a history of bitter pit in your Honeycrisp orchard, consider applying Apogee at pink to reduce bitter pit incidence.
- Early apple varieties are expected to begin blooming by the end of this month. Now is the time to plan your streptomycin and Apogee applications (or OMRI materials for organic orchards) to protect against fire blight, and to monitor disease forecasting models like NEWA for potential infection events.
- Continue monitoring for early season insects, including mites, aphids and scale. Early-season oil applications may continue up until pink. A 10x hand lens is helpful for identification.
- White or yellow sticky traps may be hung in the next week or so for locations with a history of tarnished plant bug.
- Locations with a history of early-lepidopteran larval populations may begin scouting and consider hanging redbanded leafroller pheromone traps. Larvae will feed on leaves and flowers as they continue to expand.
- During bloom, delay insecticide applications until petal fall to protect pollinators.
- Mating disruption: If you have not done so yet, hang codling moth mating disruption dispensers prior to emergence.
- Need insect lures or traps? Place your order here: https://www.greatlakesipm.com/
Vegetable Considerations
- Avoid tillage when fields are wet as this can worsen compaction and lead to large soil clods.
- Cover crops will ideally be terminated 3-4 weeks before planting your cash crop to allow residues to break down. Check out this new video from UMN Extension about different methods of termination.
- The deadline for disposing of potato cull piles is May 20th. This includes waste piles of harvested potatoes, seed cutting slivers, and storage remnants. Find more details in the Vegetable Crop Update newsletter.
- Monitor lettuce for symptoms of bottom rot. Rhizcotonia solani which also causes damping off in seedlings, can also infect older plants. Symptoms start on the oldest leaves as rusty brown patches. When favorable conditions are present- warm and wet- the rot can spread to midribs and leaf blades. Management options include choosing varieties that grow more upright to reduce soil contact, planting into raised beds to help with moisture management, and weed management to reduce the number of alternative hosts. Chemical options can be found in the Commercial Vegetable Production Guide.
- Risk from the first generation of adult seed corn maggots is now high or very high in central and southern WI. Use the Vegetable Disease and Insect Forecasting Network to view GDDs for your area. This first generation overwinters in WI. When flies emerge, they are attracted to fields with high organic matter. If possible, terminate and incorporate cover crops 2-3 weeks before planting your cash crop to reduce the attractiveness of these fields as egg laying sites.
- Starting with healthy transplants is an important part of your IPM plan. Many tomato and pepper viruses are transmitted by aphids and thrips which love the warm environment of your greenhouse. Be sure to scout transplants regularly to look for these pests. Their populations can grow quickly and be difficult to control with chemical or biological methods. Therefore, it is important to limit potential sources of these viruses by not starting ornamentals in the same greenhouse as your vegetables. More information on control methods can be found here.
Dive deeper into each report section by clicking a topic below.
Precipitation Trends
7 Day Precipitation
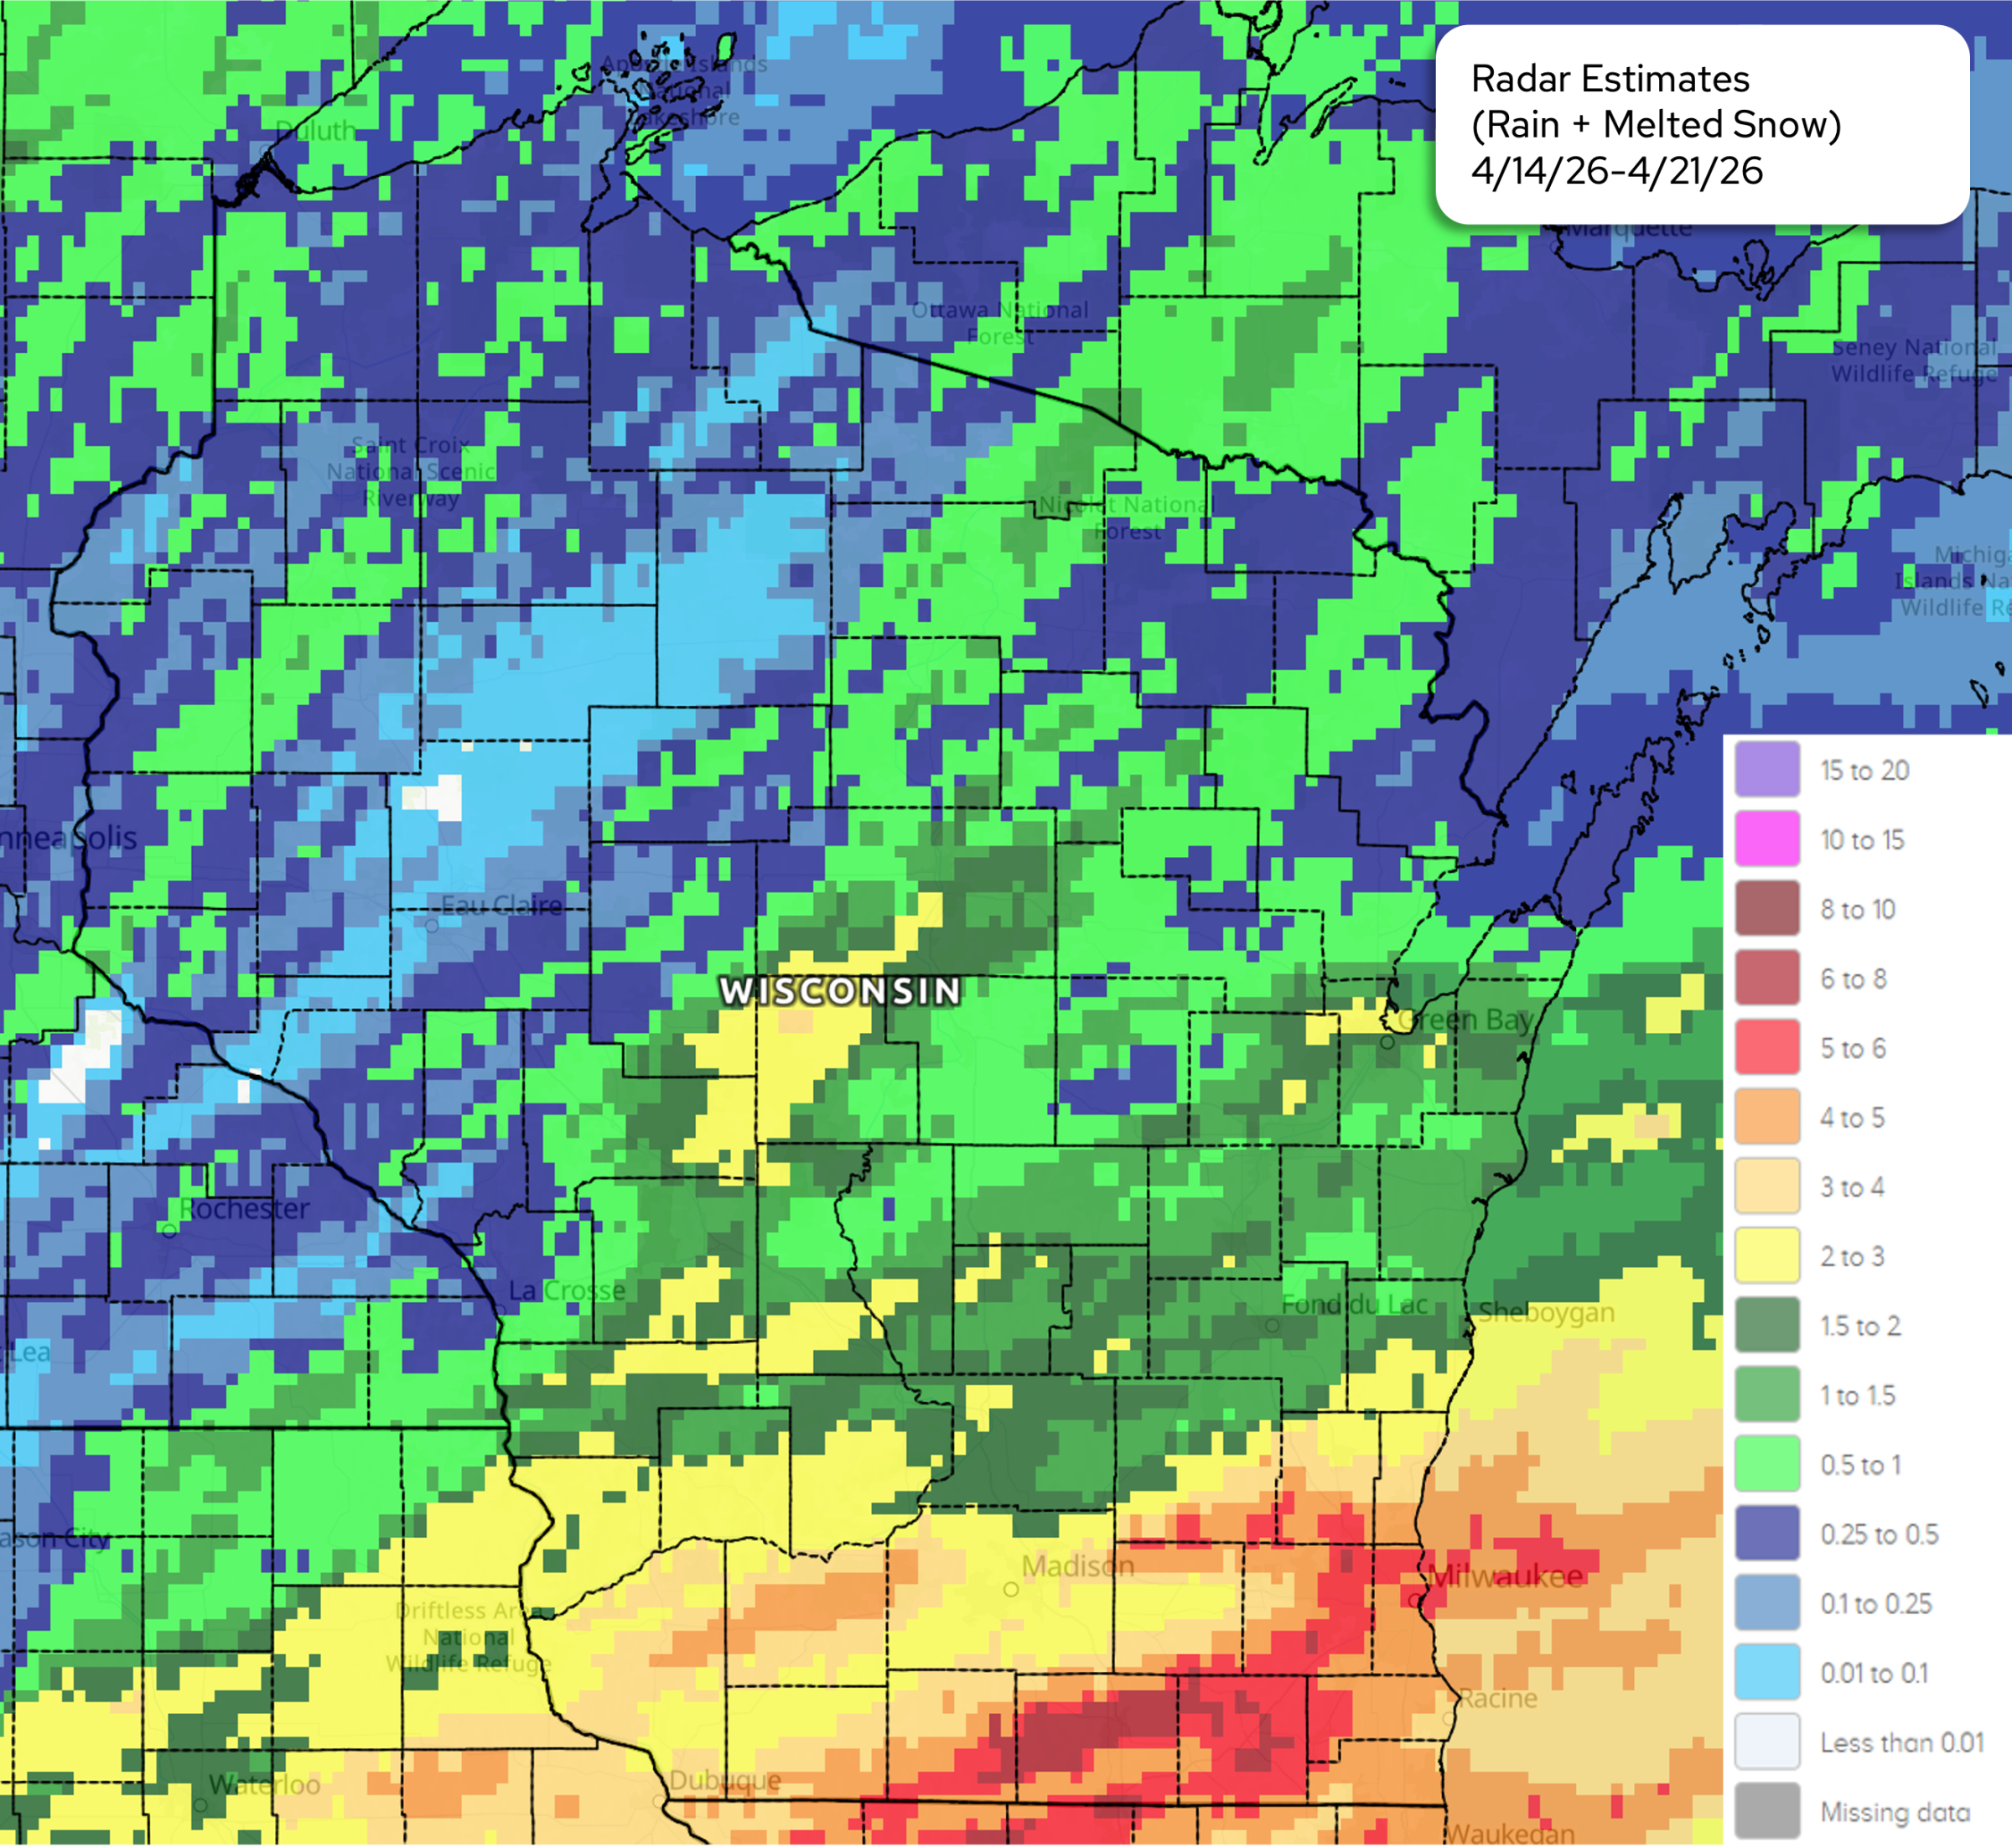
Image Description ↓
A color-coded map of Wisconsin displays radar estimates of cumulative precipitation (rain plus melted snow) for April 14–21, 2026. A legend at right shows ranges from less than 0.01 inches (light gray) through 20 inches (purple). Southern and southeastern Wisconsin, including the Milwaukee and Madison areas, show higher totals (roughly 3–8 inches, with localized areas near 8–10). Central Wisconsin shows moderate amounts (about 1–3 inches). Northern and northwestern areas show lower totals (generally under 1 inch). City names, county outlines, state boundaries, and nearby Great Lakes shorelines are visible.
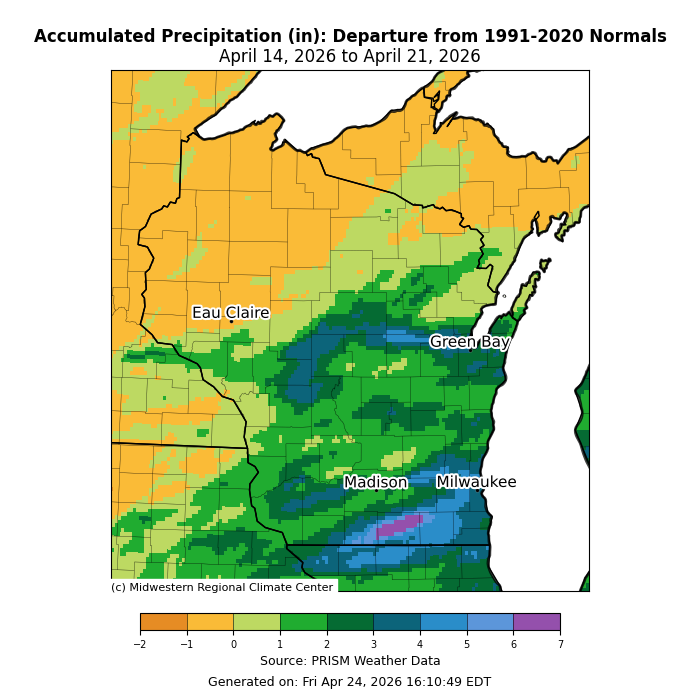
Image Description ↓
A county-level map titled “Accumulated Precipitation (in): Departure from 1991–2020 Normals, April 14, 2026 to April 21, 2026.” Wisconsin counties are shaded by precipitation departure in inches. Northern and northwestern Wisconsin appear orange, indicating below-normal precipitation around –1 to –2 inches. Central and southern areas shift to green and blue, showing above-normal precipitation of about +1 to +5 inches. The highest departures, shown in blue to purple, are concentrated in south-central to southeastern Wisconsin near Madison and Milwaukee, approaching +6 to +7 inches. A horizontal legend shows departures from –2 to +7 inches. Source is PRISM Weather Data, credited to the Midwestern Regional Climate Center, generated April 24, 2026.
- The heaviest precipitation was in southeastern Wisconsin, where 5-8” fell.
- Across many central, east central, and southern counties, 2-4″ of precipitation was common.
- Parts of central, east central, and southern Wisconsin saw ≥ 400% of normal precipitation.
- From Vilas to Pepin County and points north, totals were below normal (less than 1”).
- Portions of Wisconsin remain under flood warnings. Check the National Weather Service website for details.
30 Day Precipitation Total and Departure from Normals
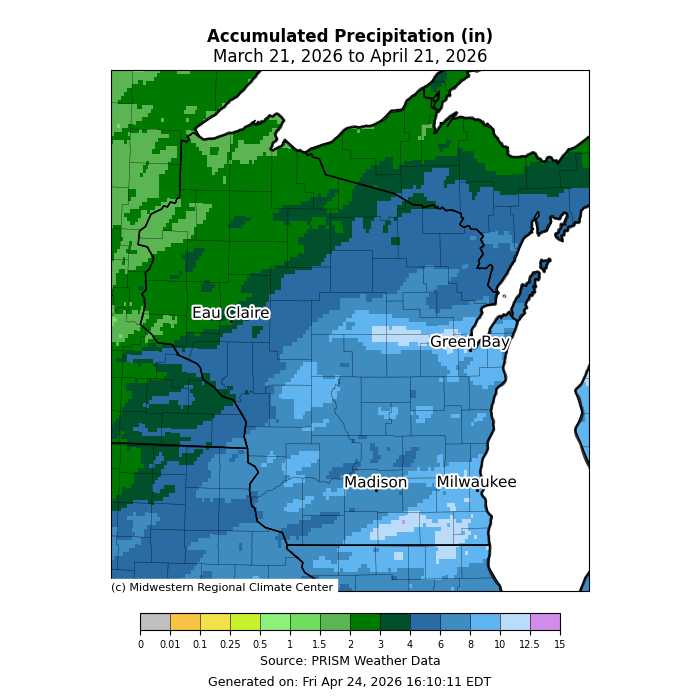
Image Description ↓
A county-level map titled “Accumulated Precipitation (in), March 21, 2026 to April 21, 2026.” Wisconsin counties are shaded in greens to blues, indicating increasing precipitation totals. Northern Wisconsin shows lower totals, generally around 1–3 inches (darker green). Central and eastern areas are mostly blue, indicating about 4–8 inches. Portions of south-central and southeastern Wisconsin near Madison and Milwaukee are lighter blue to purple, showing the highest totals, roughly 10–15 inches. A horizontal legend ranges from 0 to 15 inches. Source is PRISM Weather Data, credited to the Midwestern Regional Climate Center, generated April 24, 2026.
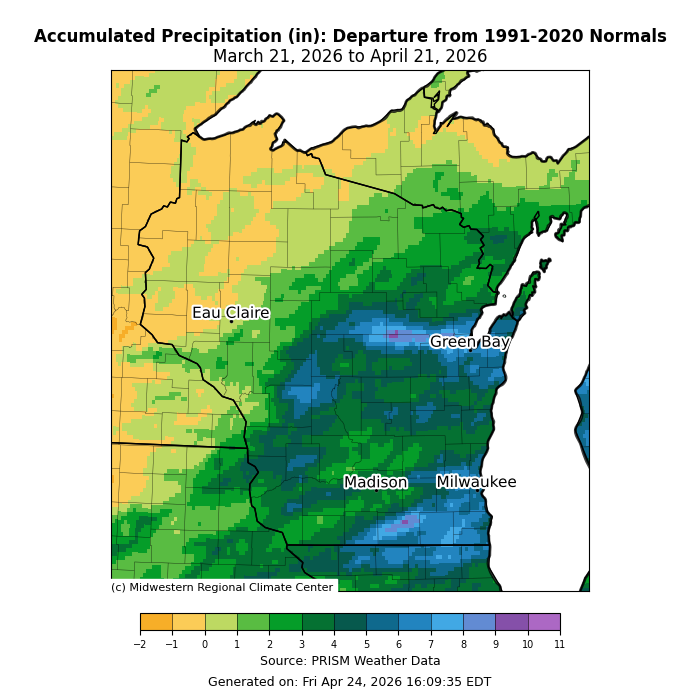
Image Description ↓
A county-level map titled “Accumulated Precipitation (in): Departure from 1991–2020 Normals, March 21, 2026 to April 21, 2026.” Wisconsin counties are shaded by precipitation departure in inches. Northwestern and far northern areas are yellow to light orange, indicating near-normal to about –1 inch departures. Most of central, eastern, and southern Wisconsin is green to blue, showing above-normal precipitation of roughly +2 to +8 inches. Localized dark blue to purple areas near Green Bay and southern Wisconsin, including around Madison and Milwaukee, indicate the highest departures approaching +9 to +11 inches. The legend ranges from –2 to +11 inches. Source is PRISM Weather Data, credited to the Midwestern Regional Climate Center, generated April 24, 2026.
- The heaviest precipitation was in a band stretching from eastern Marathon and Portage Counties through Green Bay as well as eastern Green County and points east, with totals of 10-12.5”.
- Many places from Florence to Vernon Counties and points south received over 4”, which was over 200% of normal for the 30-day period.
- Northwestern counties received less than 4”.
90 Day Precipitation Total and Percent of Normals
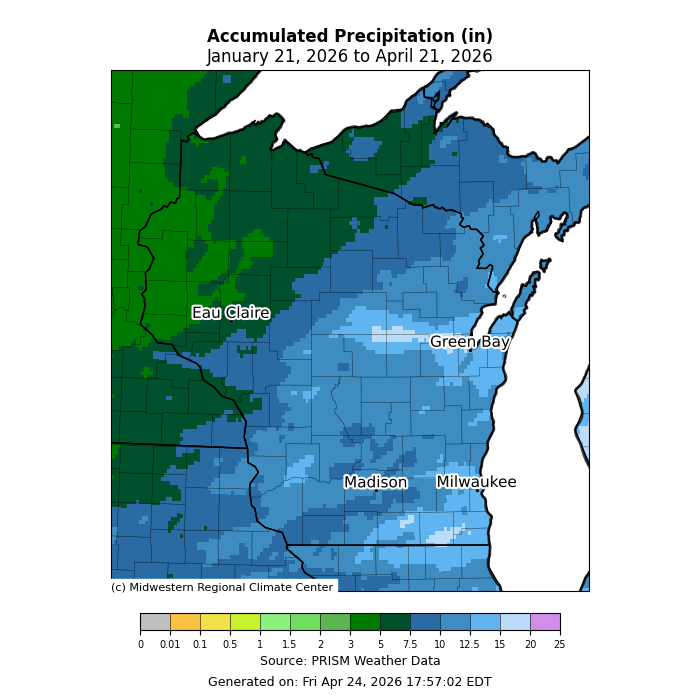
Image Description ↓
A county-level Wisconsin map titled “Accumulated Precipitation (in), January 21, 2026 to April 21, 2026.” Counties are shaded from green to blue, representing increasing precipitation totals. Northwestern Wisconsin, including areas near Eau Claire, appears darker green, indicating lower totals around 2–5 inches. Central and eastern Wisconsin are mostly blue, showing higher totals near 8–15 inches. Southeastern and east-central areas, including around Madison, Milwaukee, and Green Bay, contain lighter blue to near-purple shades, indicating the highest accumulations approaching 20–25 inches. A horizontal legend shows values from 0 to 25 inches. Source is PRISM Weather Data, credited to the Midwestern Regional Climate Center, generated April 24, 2026.
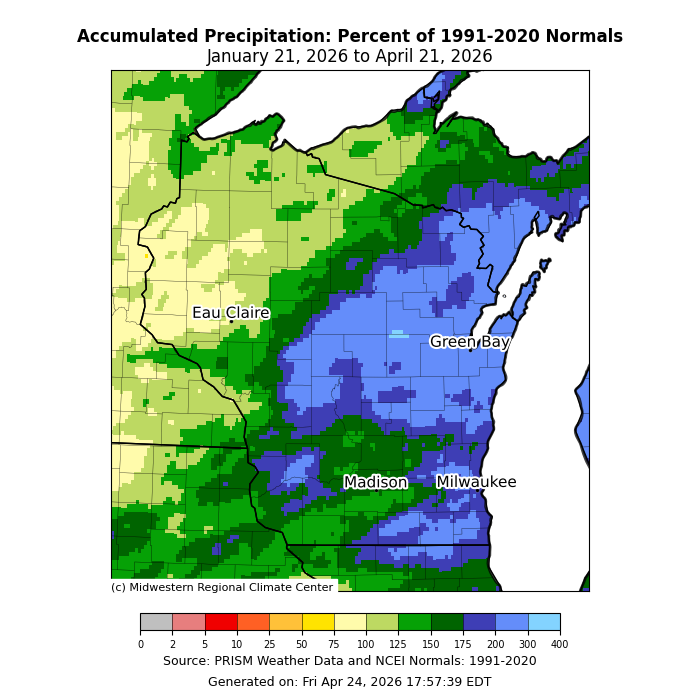
Image Description ↓
A county-level map titled “Accumulated Precipitation: Percent of 1991–2020 Normals, January 21, 2026 to April 21, 2026.” Wisconsin counties are shaded by percent of normal precipitation. Western and northwestern Wisconsin, including near Eau Claire, appear light yellow to light green, indicating roughly 75–100% of normal precipitation. Central and eastern Wisconsin are darker green to blue, indicating above-normal totals around 125–200% of normal. Portions of east-central and eastern Wisconsin near Green Bay, Madison, and Milwaukee show the highest values, locally approaching 300–400% of normal. A horizontal legend ranges from 0 to 400%. Source is PRISM Weather Data and NCEI Normals (1991–2020), credited to the Midwestern Regional Climate Center, generated April 24, 2026.
- The highest precipitation totals were in east central and far southeastern counties (15” or more). A large portion of the state received over 10”.
- Precipitation totals were lowest in the northwest (3-7.5”).
- Most of the area from Florence to Vernon Counties and points south received over 175% of normal precipitation.
2026 Precipitation
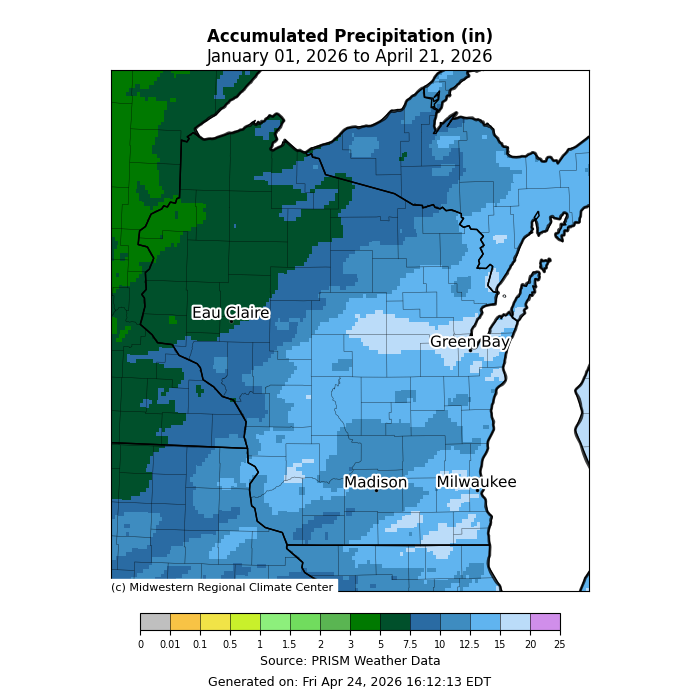
Image Description ↓
A county-level map titled “Accumulated Precipitation (in), January 01, 2026 to April 21, 2026.” Wisconsin counties are shaded from green to blue, indicating increasing precipitation totals. Northwestern Wisconsin near Eau Claire appears darker green, showing lower totals around 2–5 inches. Central and eastern Wisconsin shift to blue shades, indicating higher totals of roughly 8–15 inches. Localized lighter blue to purple areas in eastern and southeastern Wisconsin near Green Bay, Madison, and Milwaukee indicate the highest accumulations, approaching 20–25 inches. A horizontal legend ranges from 0 to 25 inches. Source is PRISM Weather Data, credited to the Midwestern Regional Climate Center, generated April 24, 2026.
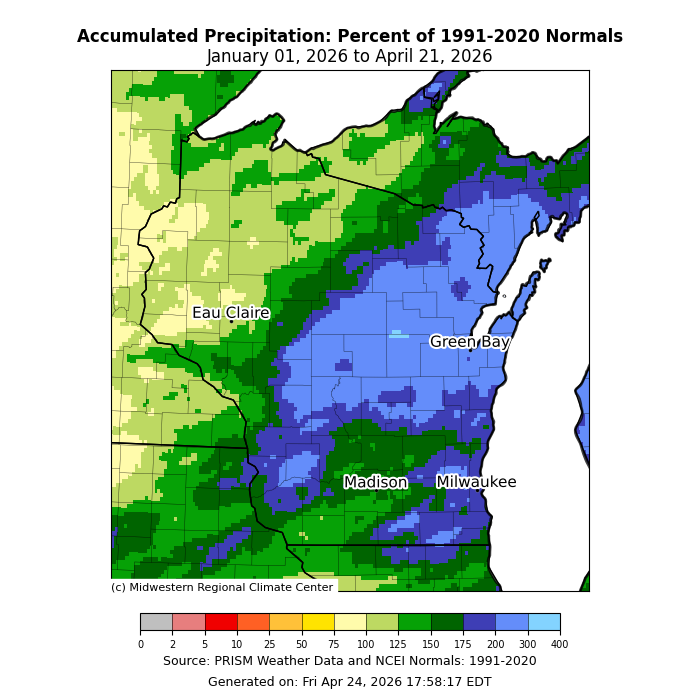
Image Description ↓
A county-level map titled “Accumulated Precipitation: Percent of 1991–2020 Normals, January 01, 2026 to April 21, 2026.” Wisconsin counties are shaded by percent of normal precipitation. Western and northwestern Wisconsin, including areas near Eau Claire, appear light yellow to light green, indicating roughly 75–100% of normal precipitation. Central Wisconsin transitions to darker green, around 125–150% of normal. Eastern and southeastern Wisconsin, including Green Bay, Madison, and Milwaukee, are shaded blue to purple, showing substantially above-normal precipitation, generally around 175–300%, with localized areas approaching 400% of normal. A horizontal legend shows percent values from 0 to 400%. Source listed as PRISM Weather Data and NCEI Normals (1991–2020), credited to the Midwestern Regional Climate Center, generated April 24, 2026.
Soil Moisture and Temperature Trends
Soil Moisture Models
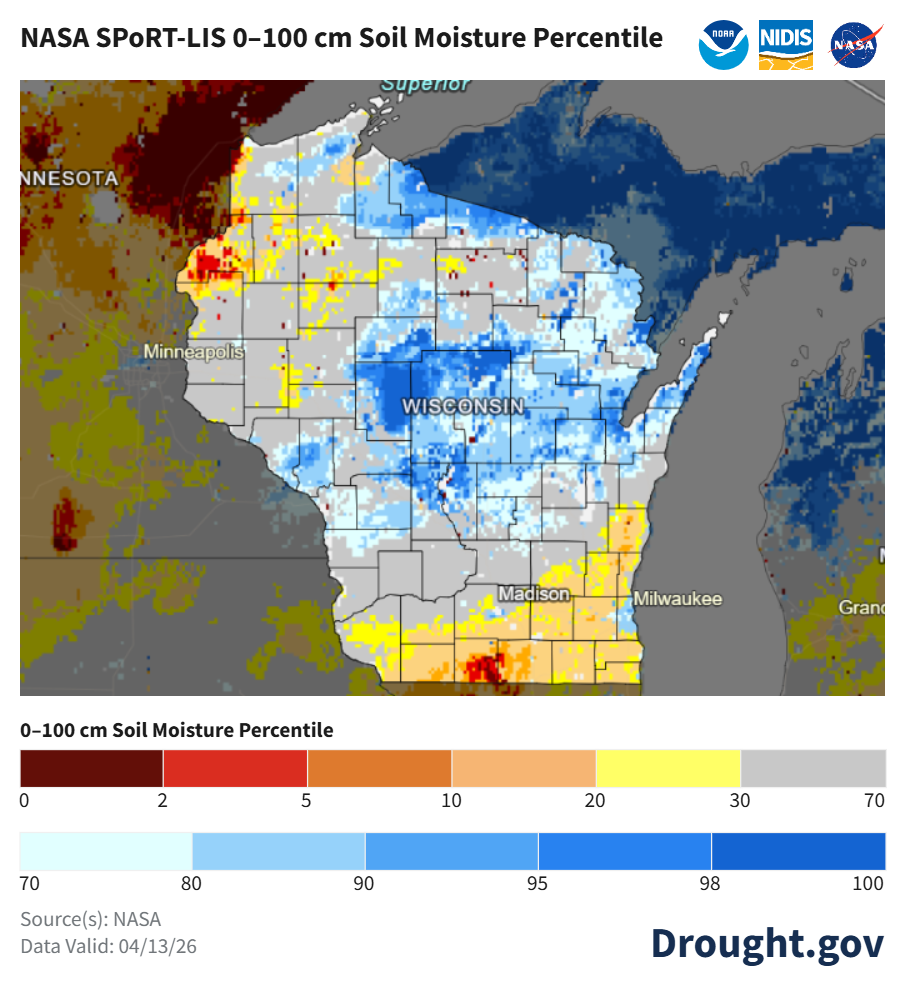
Image Description ↓
The map is titled “NASA SPoRT‑LIS 0–100 cm Soil Moisture Percentile” and covers Wisconsin and nearby regions. Colors represent soil moisture percentiles: dark red to orange indicates very dry soils (0–10th percentile), yellow shows below‑normal moisture (10–30th), light gray is near normal, and light to dark blue indicates above‑normal to very wet soils (70–100th percentile). Central Wisconsin is dominated by blues, indicating wetter‑than‑normal soil moisture. Northwestern Wisconsin and parts of southern Wisconsin show red and orange areas, indicating very dry conditions. The legend at the bottom shows percentile ranges from 0 to 100. Text below the legend reads “Source(s): NASA” and “Data Valid: 04/13/26.”
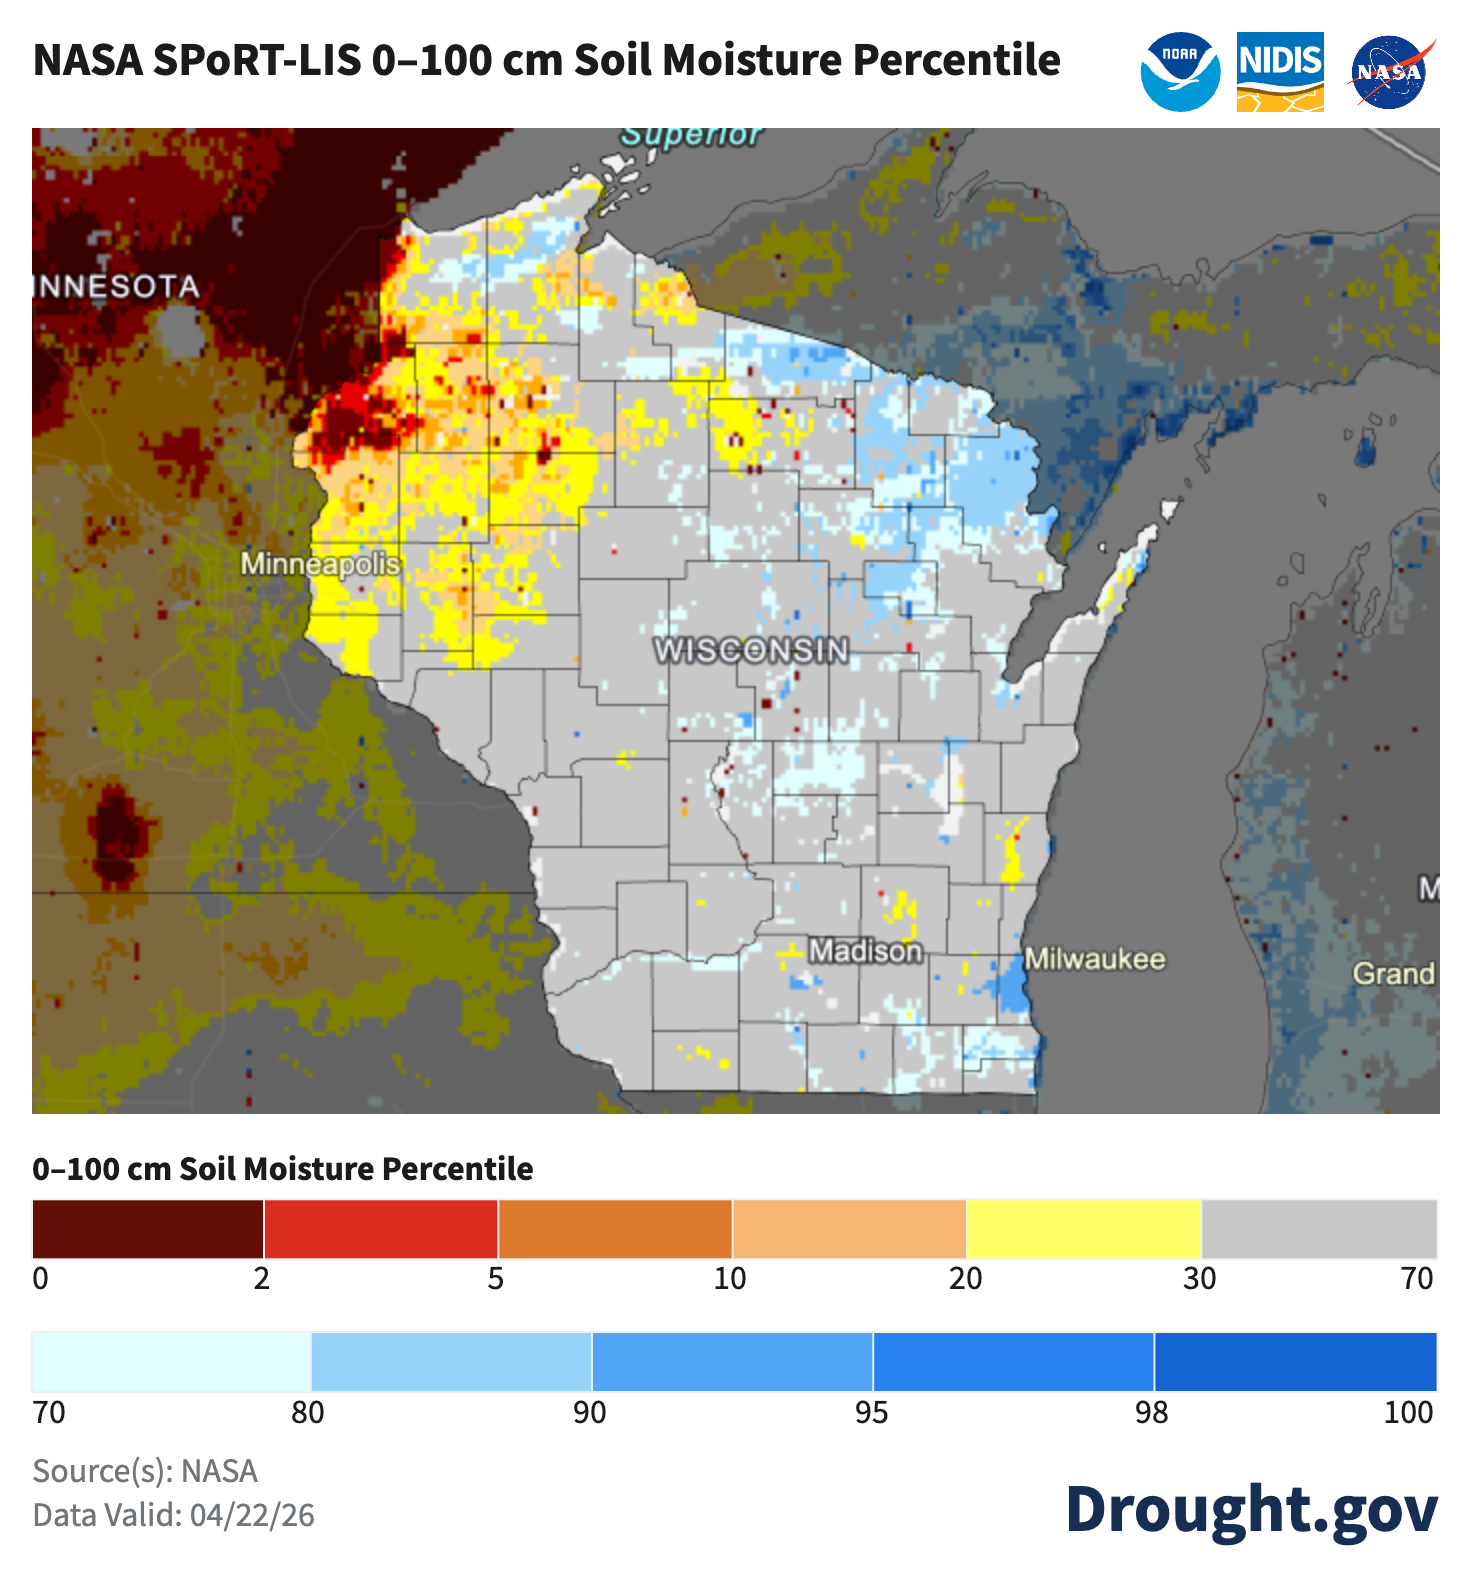
Image Description ↓
A map titled “NASA SPoRT‑LIS 0–100 cm Soil Moisture Percentile” displays Wisconsin with county outlines and nearby states labeled. Colors represent soil moisture percentiles from 0 to 100. Western and northwestern Wisconsin show lower percentiles (reds, oranges, yellows indicating drier soils, roughly below the 30th percentile). Central areas are mostly gray, indicating near-average soil moisture (around the 30th–70th percentile). Eastern and northeastern Wisconsin show higher percentiles (light to dark blues, about the 80th–98th percentile), indicating wetter-than-average soils. Major cities labeled include Madison and Milwaukee. The legend shows percentile ranges, with sources listed as NASA and data valid on 04/22/26.
- Soil moisture levels decreased slightly compared to last week across all Wisconet stations.
- Soils in the central, northeast, and north-central counties remain near normal or wetter than normal.
- Abnormal dryness remains in place across the far southern counties and in parts of the northwest.
- Notes on how to interpret the maps:
- Red areas = top 5 driest in 100 years.
- Dark red areas = top 2 driest in 100 years.
- Dark blue areas = top 2 wettest in 100 years.
Wisconet Soil Moisture
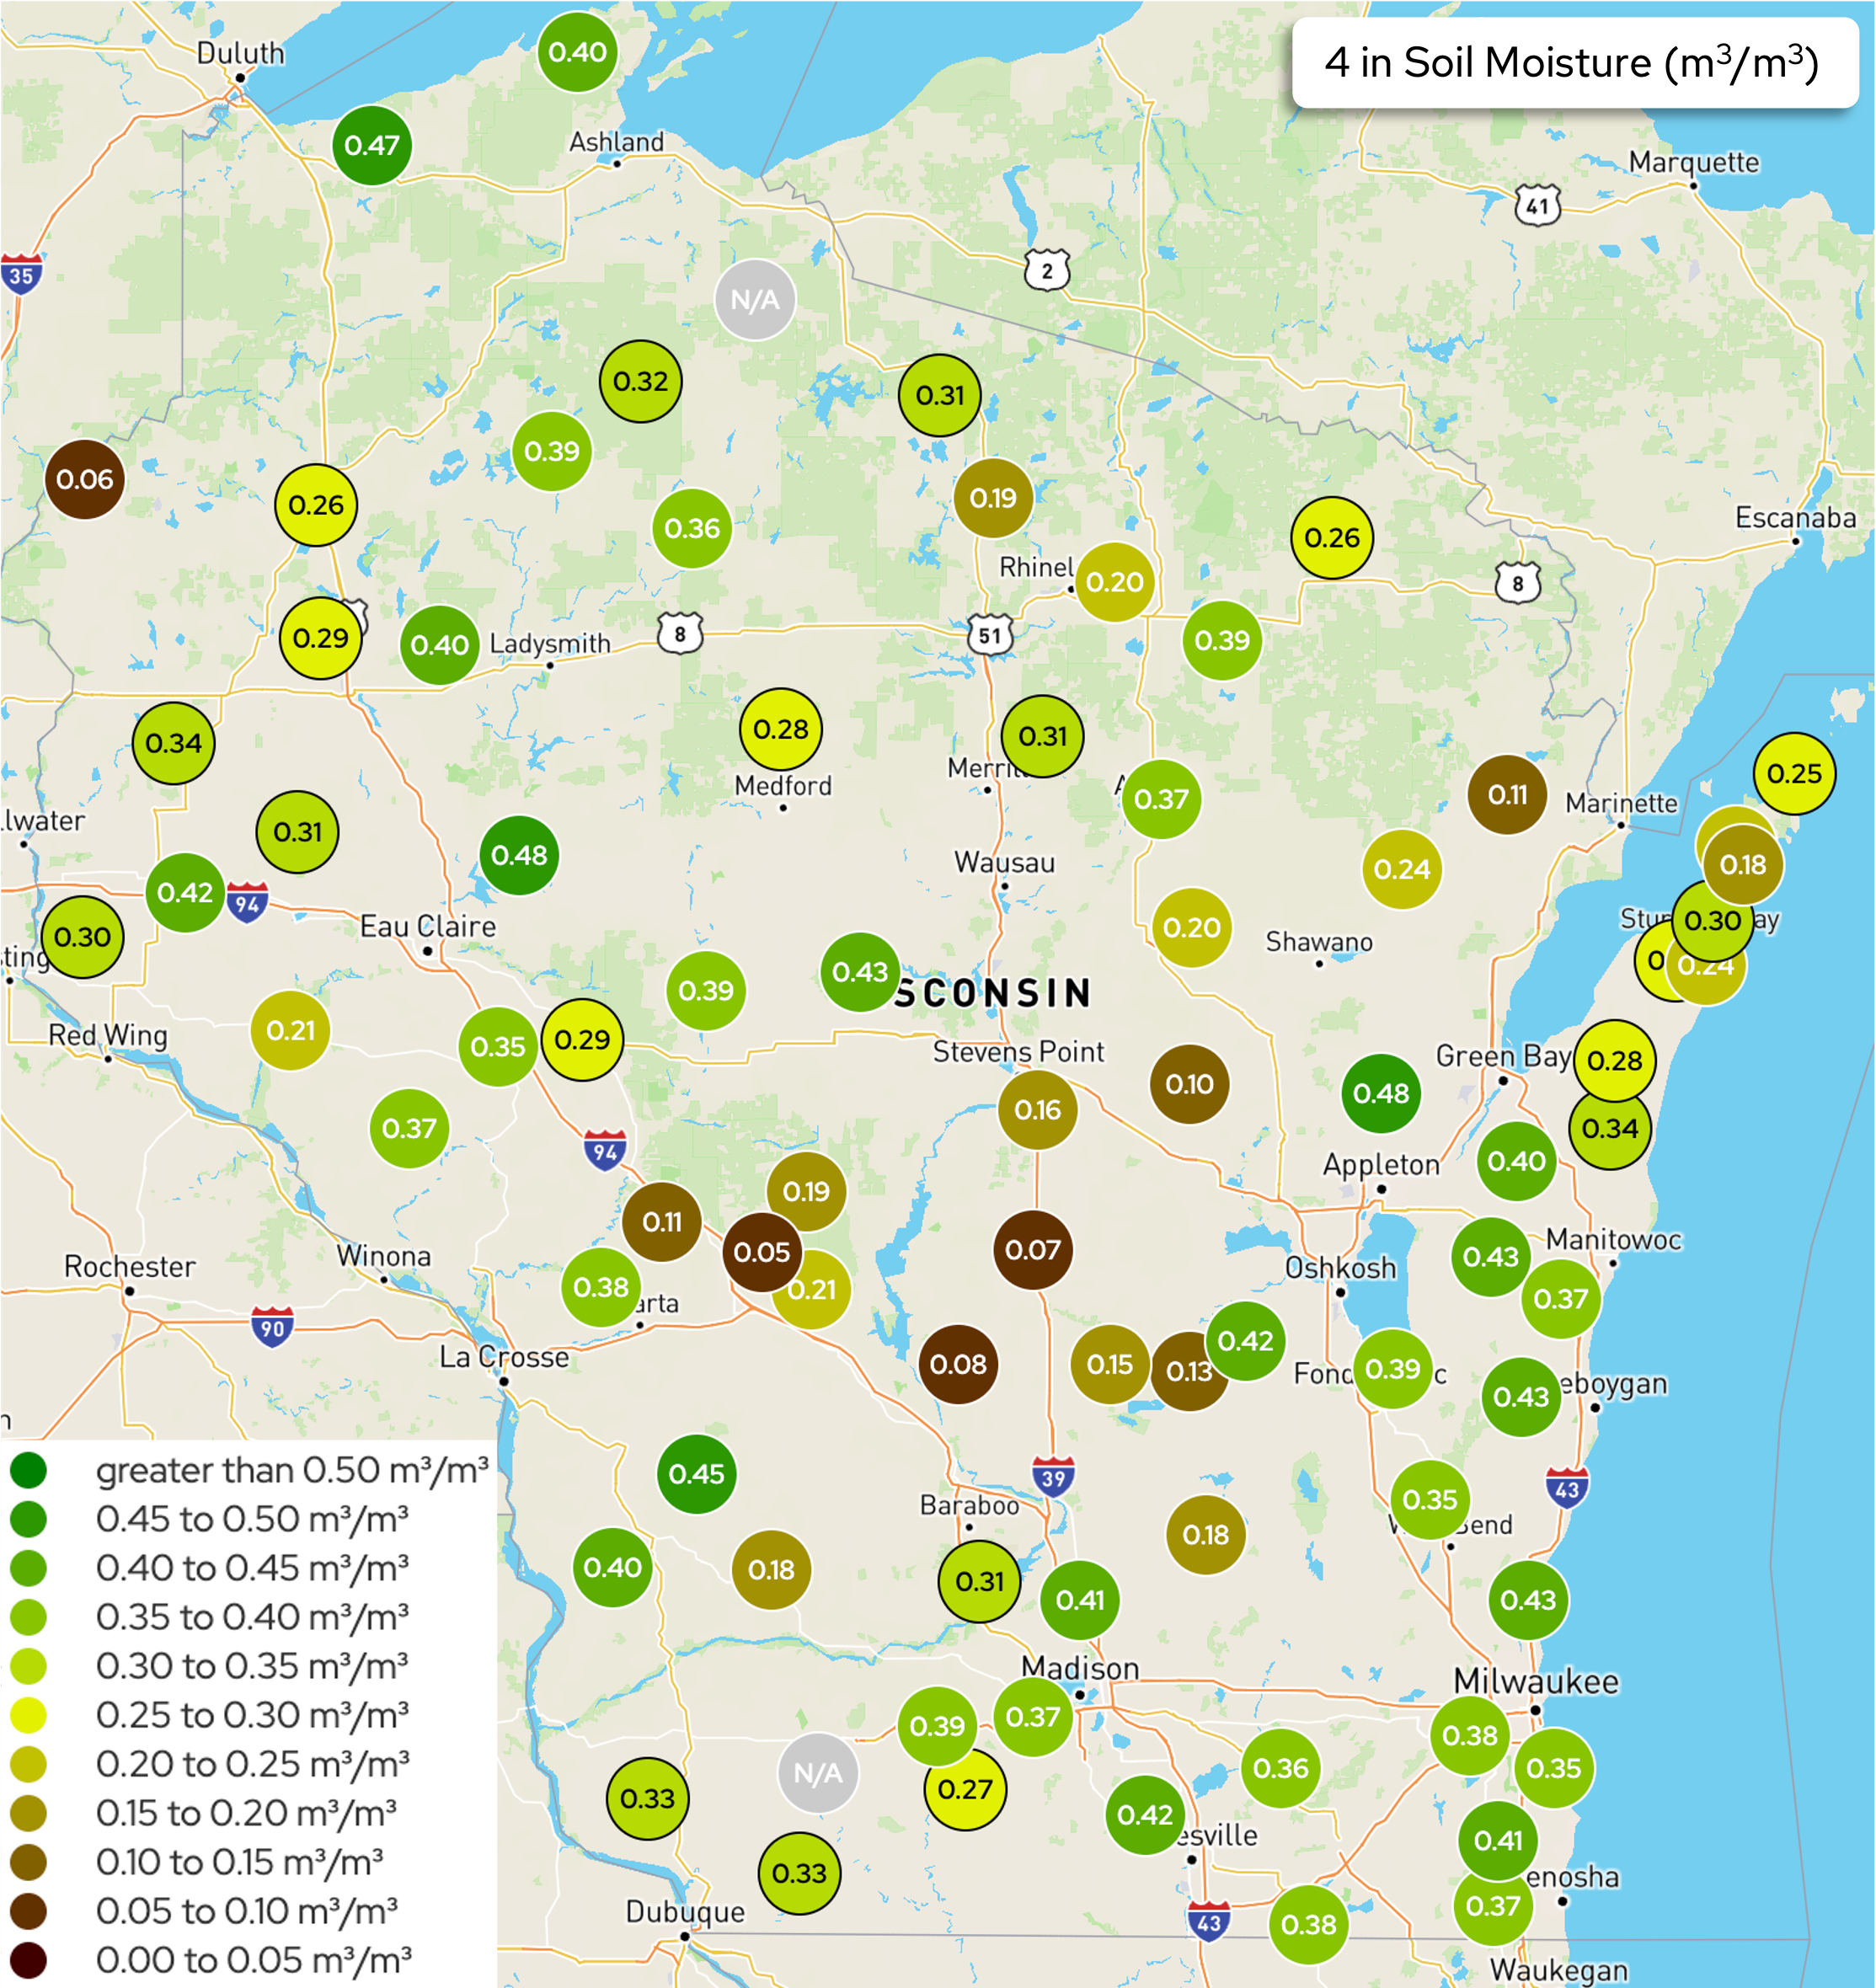
Image Description ↓
A map of Wisconsin displays in‑situ 4‑inch soil moisture measurements (m³/m³) at monitoring stations, shown as colored circles with numeric labels. Values range roughly from 0.05 to 0.48 m³/m³. Drier readings (about 0.05–0.15) cluster in parts of southwest and south‑central Wisconsin, while moderate to wetter readings (about 0.30–0.48) appear across eastern Wisconsin, the Fox Valley, and portions of the north. A legend indicates color classes from less than 0.05 up to greater than 0.50 m³/m³, and a title box reads “4 in Soil Moisture (m³/m³).”
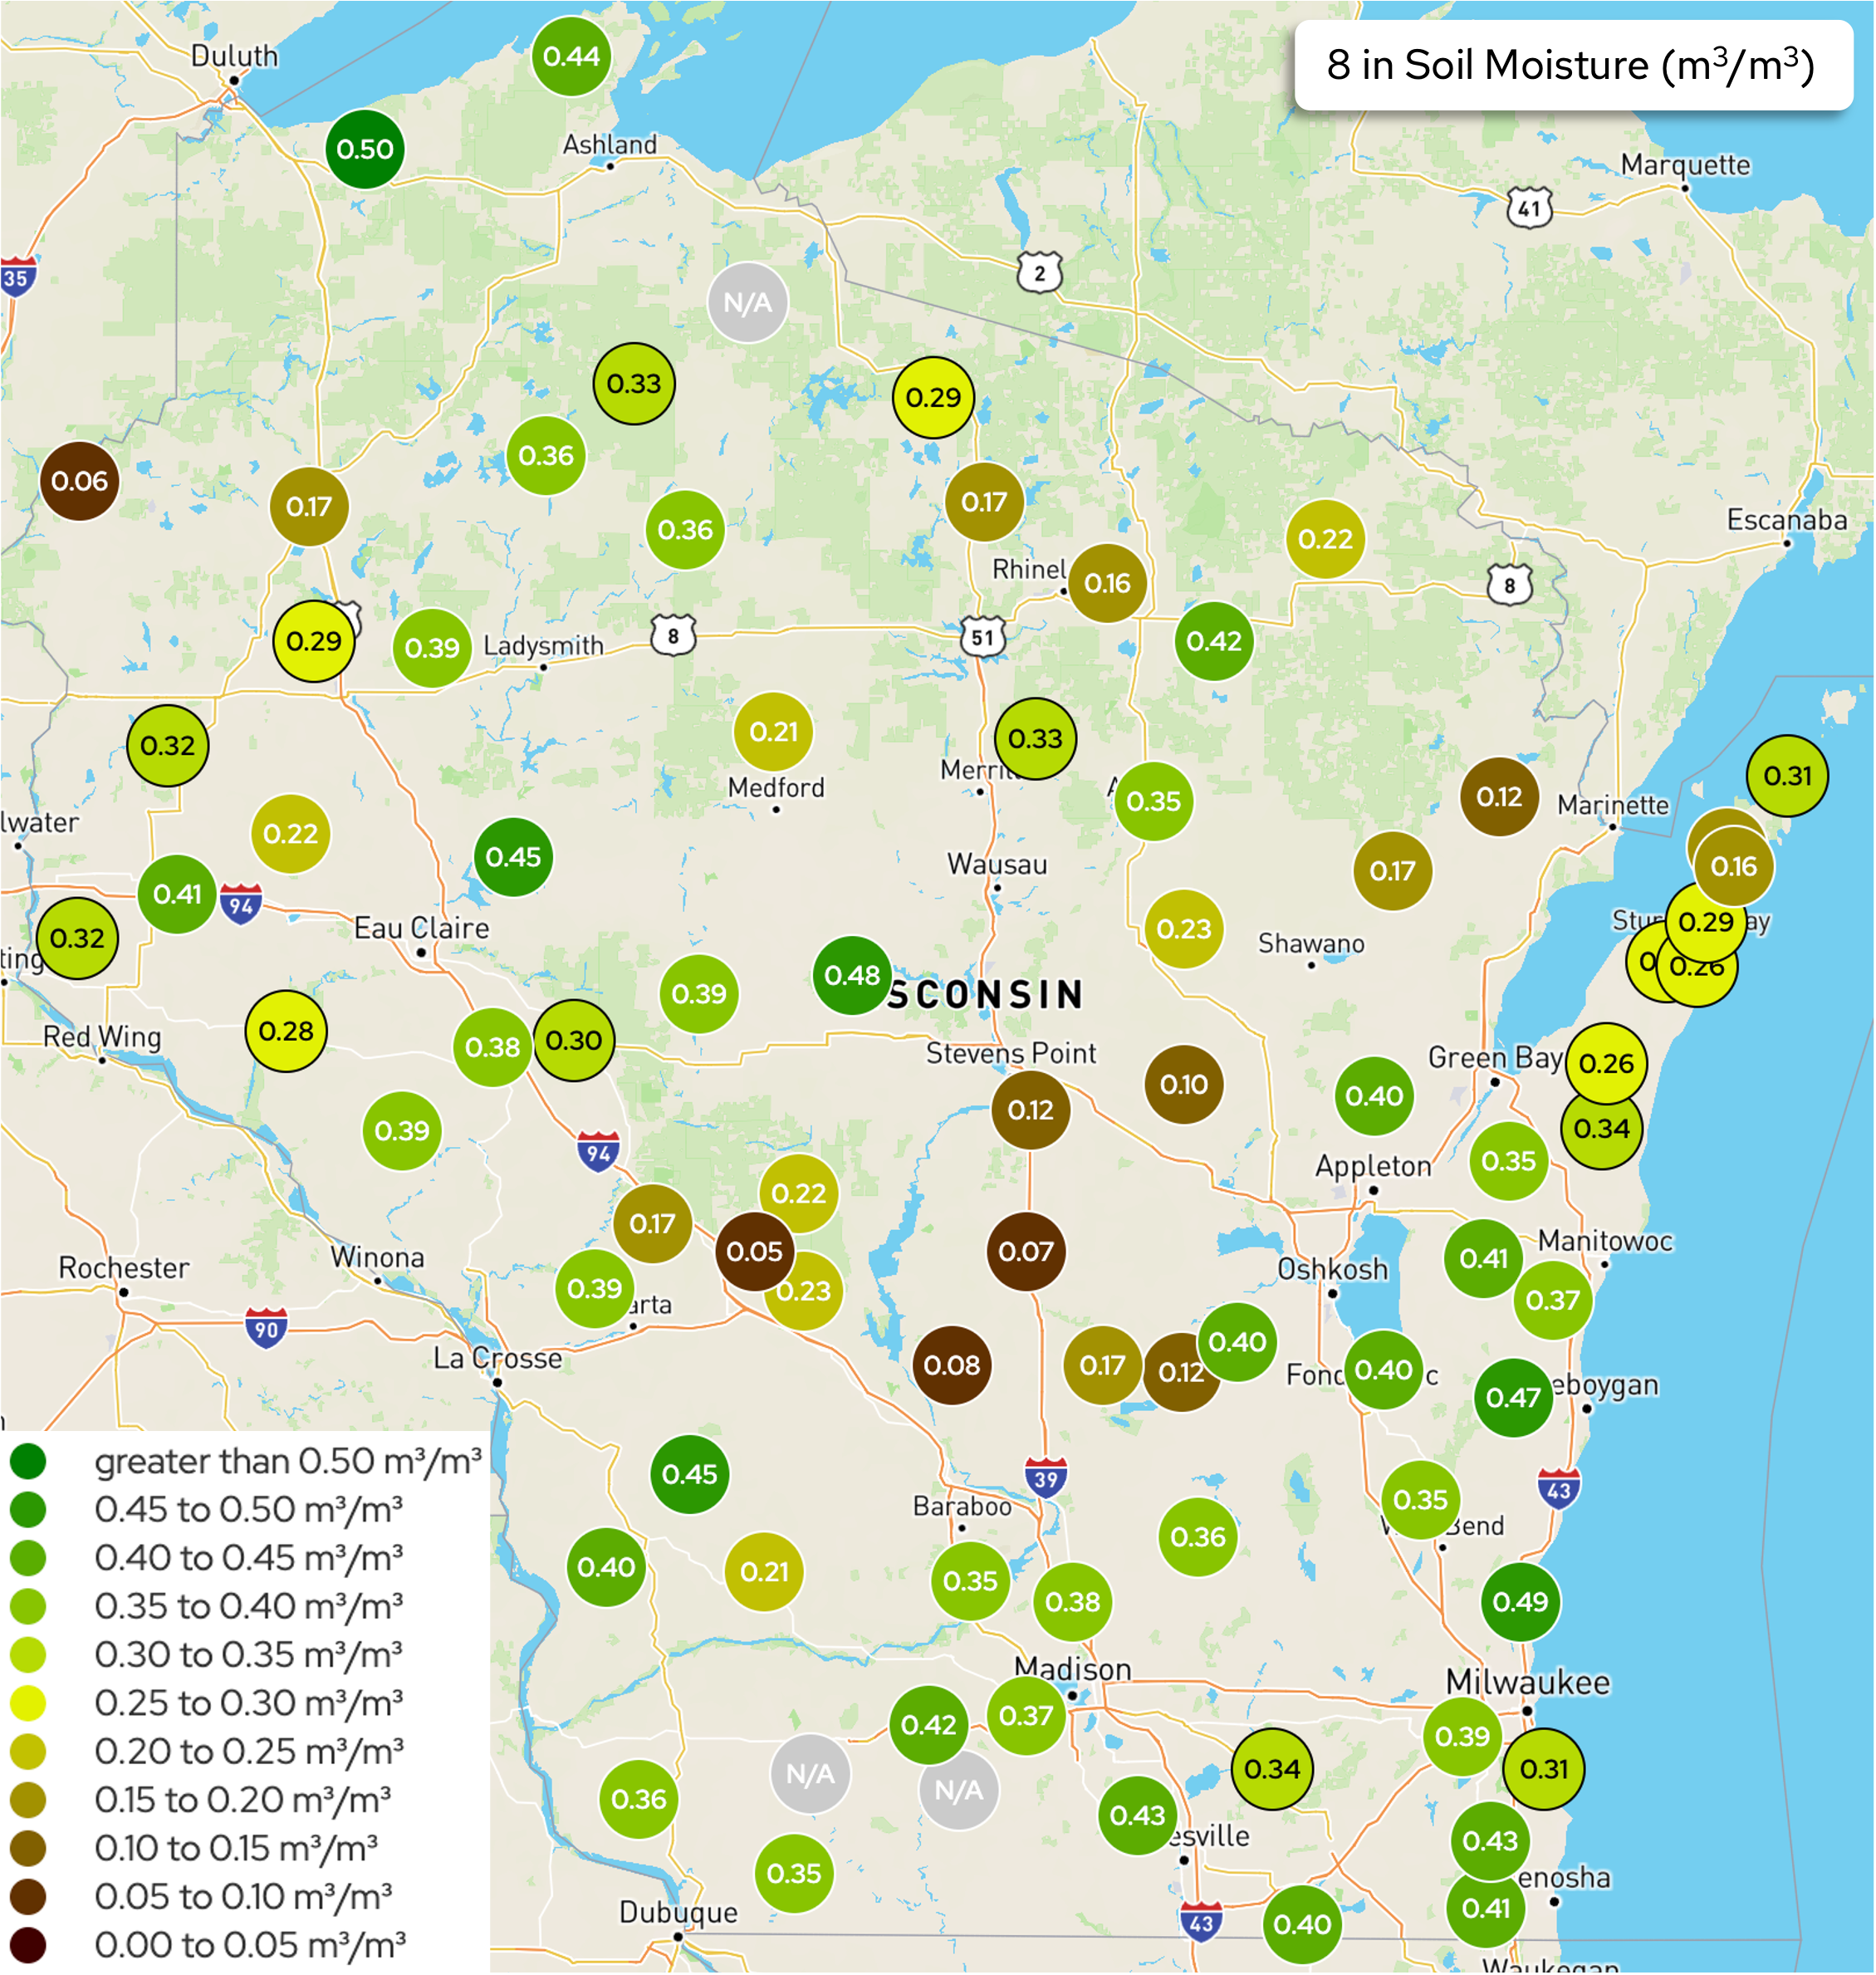
Image Description ↓
A map of Wisconsin displays 8‑inch soil moisture measurements (m³/m³) at monitoring stations, shown as colored circles with numeric labels. Values range from about 0.05 to 0.50 m³/m³. Drier conditions (roughly 0.05–0.15, brown shades) appear in parts of south‑central and west‑central Wisconsin, while moderate to wetter values (about 0.35–0.50, green shades) are common across northern, eastern, and coastal areas near Lake Michigan. A legend shows color categories from 0.00–0.05 up to greater than 0.50 m³/m³, and a title box reads “8 in Soil Moisture (m³/m³).”
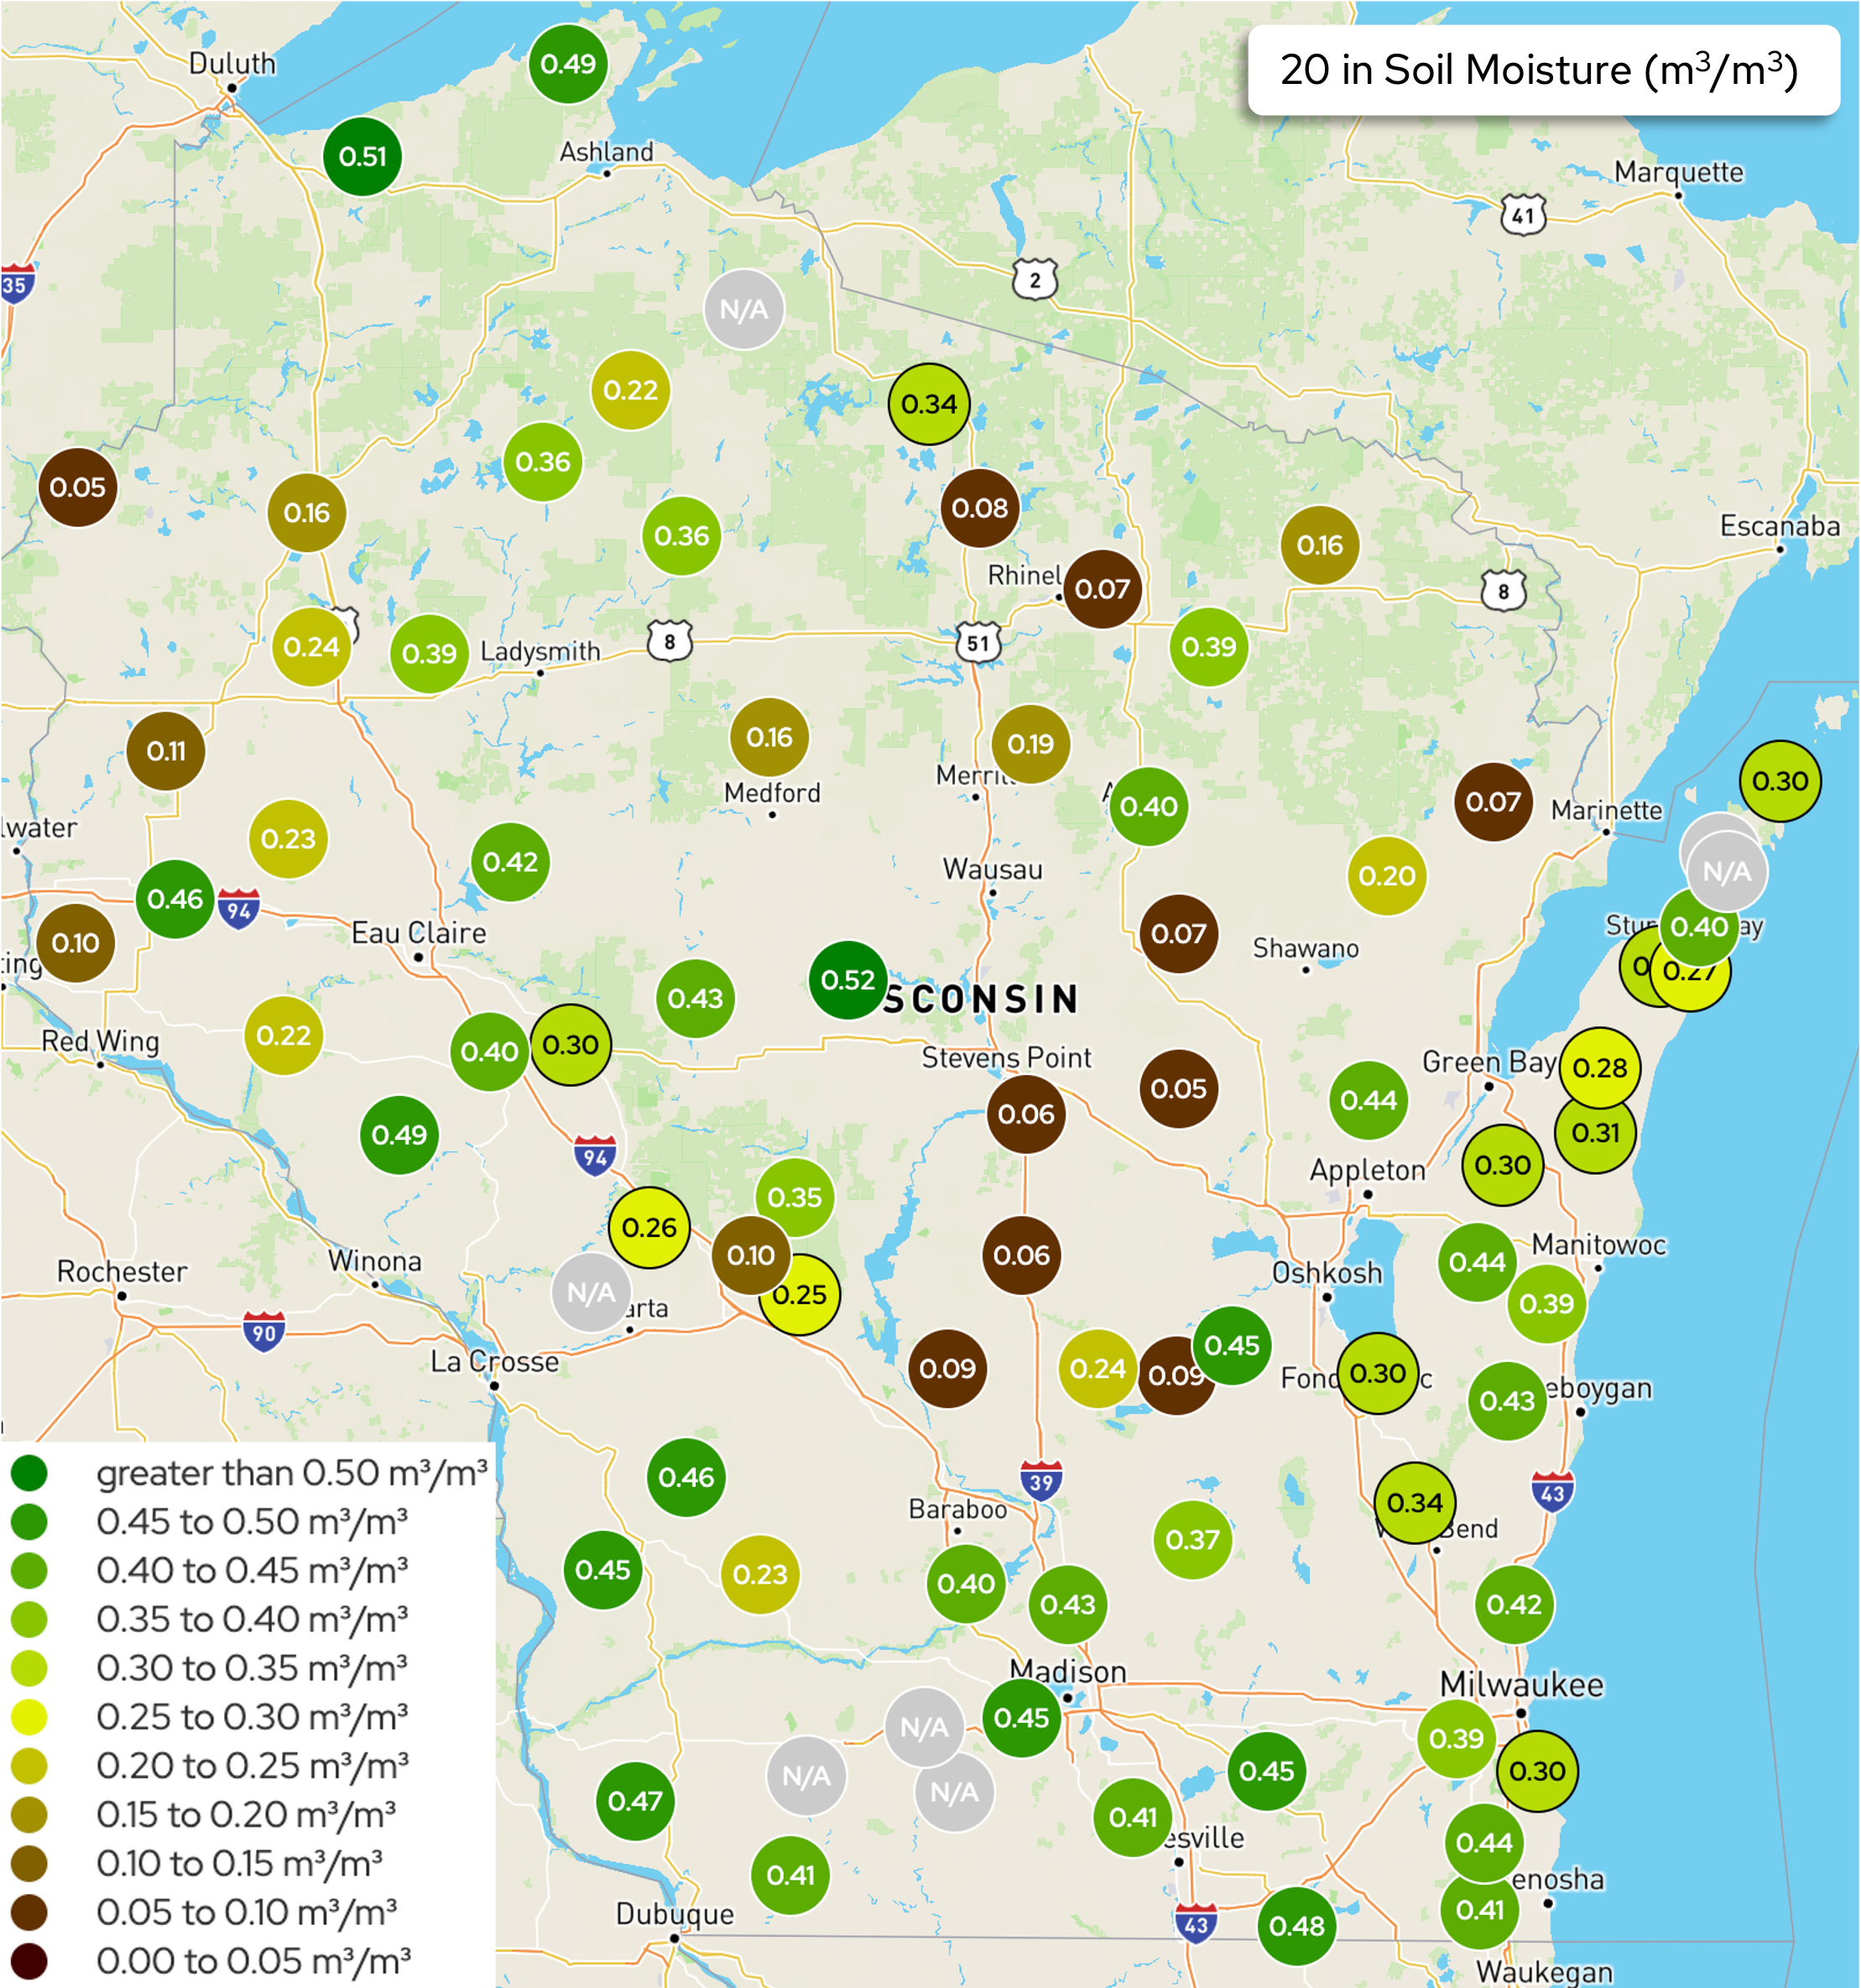
Image Description ↓
A Wisconsin map displays 20‑inch soil moisture measurements (m³/m³) from monitoring stations, shown as colored circles with numeric labels. Values range from about 0.05 to just over 0.50 m³/m³. Very wet conditions (approximately 0.45–0.52) appear in parts of central, southern, and northern Wisconsin, including areas near Stevens Point, Madison, and Ashland. Drier readings (roughly 0.05–0.15) occur in scattered pockets of central and northeastern Wisconsin. Moderate values (around 0.25–0.40) are common across eastern and southwestern regions. A legend shows soil moisture classes from 0.00–0.05 up to greater than 0.50 m³/m³, and a title box reads “20 in Soil Moisture (m³/m³).”
- The maps show Wisconet soil moisture conditions on April 21st @ 12:00 pm.
- The table shows total precipitation and changes in soil moisture from April 13th (Start) to April 20th (End).
- Units of map & change values are {Volume of water}/{Volume of soil}.
| Research Farm | County | Total Precipitation (in.) | 4″ Start | 4″ End | 8″ Start | 8″ End | 20″ Start | 20″ End |
|---|---|---|---|---|---|---|---|---|
| Arlington | Columbia | 2.64 | 0.43 | 0.39 | 0.41 | 0.44 | 0.45 | 0.21 |
| Black River Falls | Jackson | 1.32 | 0.20 | 0.12 | 0.21 | 0.18 | 0.24 | 0.27 |
| Dairy Forage ARS | Sauk | 1.69 | 0.34 | 0.32 | 0.37 | 0.36 | 0.41 | 0.40 |
| Hancock | Waushara | 0.78 | 0.15 | 0.08 | 0.13 | 0.08 | 0.09 | 0.06 |
| Kemp | Oneida | 0.82 | 0.24 | 0.20 | 0.21 | 0.18 | 0.10 | 0.08 |
| Lancaster | Grant | 3.57 | 0.37 | 0.34 | 0.39 | 0.38 | 0.47 | 0.47 |
| Marshfield | Marathon | 1.44 | 0.46 | 0.45 | 0.48 | 0.48 | 0.52 | 0.52 |
| O.J. Noer (Turfgrass) | Dane | 1.97 | 0.40 | 0.38 | 0.39 | 0.38 | 0.46 | 0.46 |
| Peninsular | Door | 0.99 | 0.35 | 0.32 | 0.34 | 0.30 | 0.41 | 0.41 |
| Rhinelander | Oneida | 0.82 | 0.23 | 0.21 | 0.19 | 0.17 | 0.08 | 0.07 |
| Spooner | Washburn | 0.59 | 0.28 | 0.27 | 0.18 | 0.18 | 0.16 | 0.16 |
| Research Farm | Current 4″ Soil Moisture | Last Week’s 4″ Soil Moisture | 1 Month Ago 4″ Soil Moisture |
|---|---|---|---|
| Arlington | 0.39 | 0.43 | 0.44 |
| Black River Falls | 0.12 | 0.20 | 0.16 |
| Dairy Forage ARS | 0.32 | 0.34 | 0.33 |
| Hancock | 0.08 | 0.15 | 0.15 |
| Kemp | 0.20 | 0.24 | 0.20 |
| Lancaster | 0.34 | 0.37 | 0.35 |
| Marshfield | 0.45 | 0.46 | 0.38 |
| O.J. Noer (Turfgrass) | 0.38 | 0.40 | 0.38 |
| Peninsular | 0.32 | 0.35 | 0.30 |
| Rhinelander | 0.21 | 0.23 | 0.24 |
| Spooner | 0.27 | 0.28 | 0.35 |
USDA Soil Moisture Reports
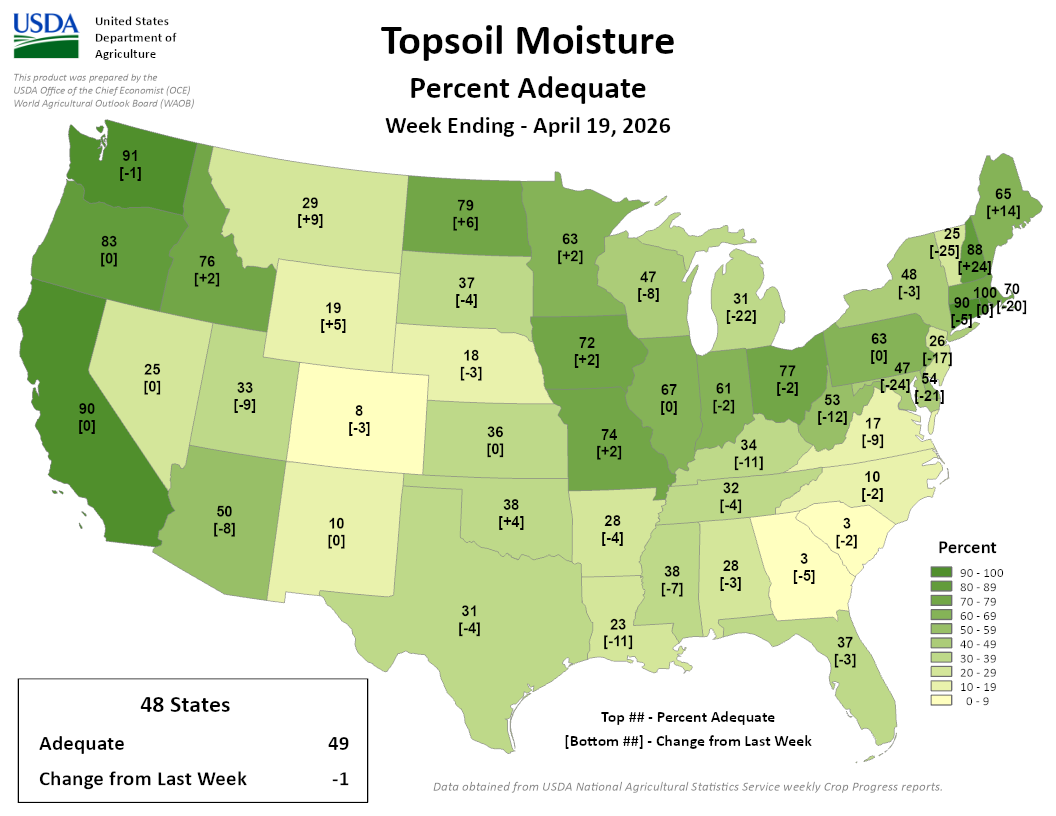
Image Description ↓
A United States map titled “Topsoil Moisture Percent Adequate” shows the percentage of topsoil rated adequate by state for the week ending April 19, 2026. States are shaded from light to dark green, corresponding to percent adequate ranges: 0–9, 10–19, 20–29, 30–39, 40–49, 50–59, 60–69, 70–79, 80–89, and 90–100 percent. Each state displays a number indicating the current percent adequate, with a bracketed number below showing change from the prior week. Examples include Washington at 91% (-1), California at 90% (0), Iowa at 72% (+2), Wisconsin at 67% (0), Texas at 31% (-4), and Florida at 37% (-3). The Southeast and parts of the Plains show lower adequacy (<30%), while much of the Midwest, Pacific Coast, and Northeast show higher values (60–90%+). A summary box states: “48 States — Adequate: 49; Change from Last Week: -1.”
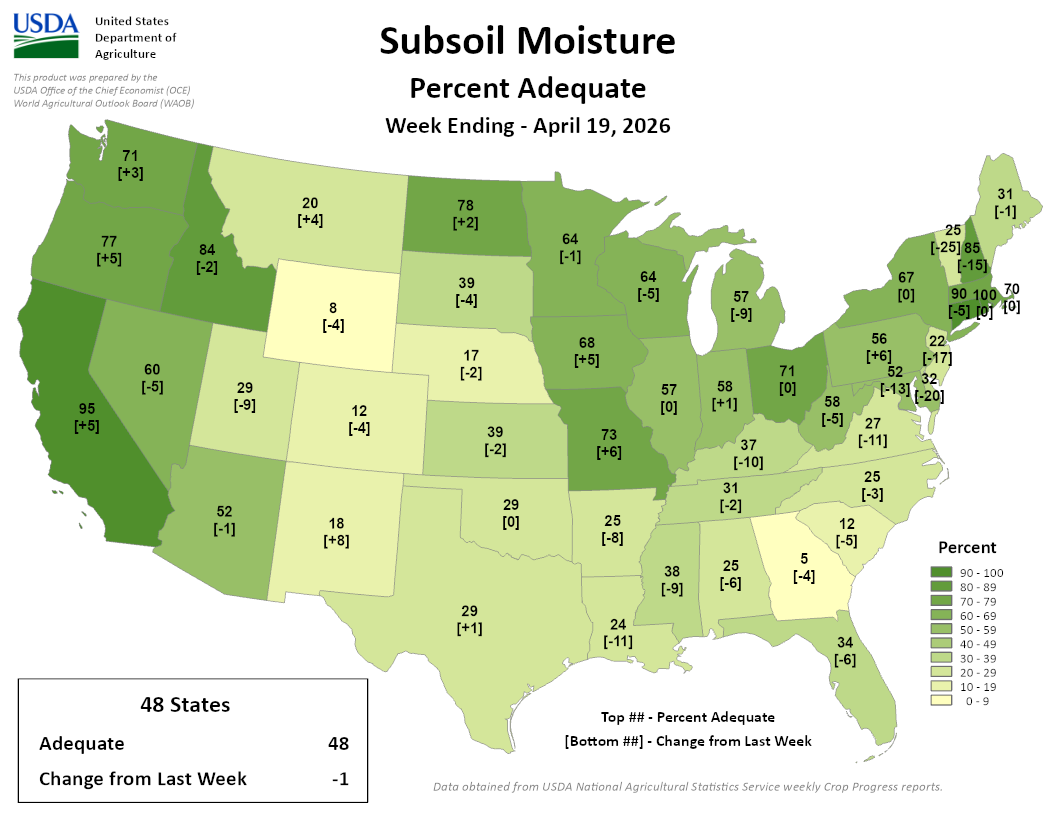
Image Description ↓
A United States map titled “Subsoil Moisture Percent Adequate” shows state-level percentages of subsoil rated adequate for the week ending April 19, 2026. States are shaded from light to dark green to represent percent adequate ranges from 0–9 up to 90–100 percent. Each state displays a numeric value for percent adequate, with a bracketed value below showing the change from the previous week. Examples include California at 95% (+5), Washington at 71% (+3), Wisconsin at 57% (0), Iowa at 68% (+5), Texas at 29% (+11), and Florida at 34% (-6). Large portions of the Plains and Southeast show lower adequacy (generally below 30%), while the Midwest, West Coast, and parts of the Northeast show higher values (60–90%+). A summary box reads: “48 States — Adequate: 48; Change from Last Week: -1.”
- 47% and 64% of agricultural soils in the state are reported as having adequate topsoil and subsoil moisture, respectively.
- 52% and 35% of agricultural soils in the state are reported as having surplus topsoil and subsoil moisture, respectively.
Wisconet Soil Temperature
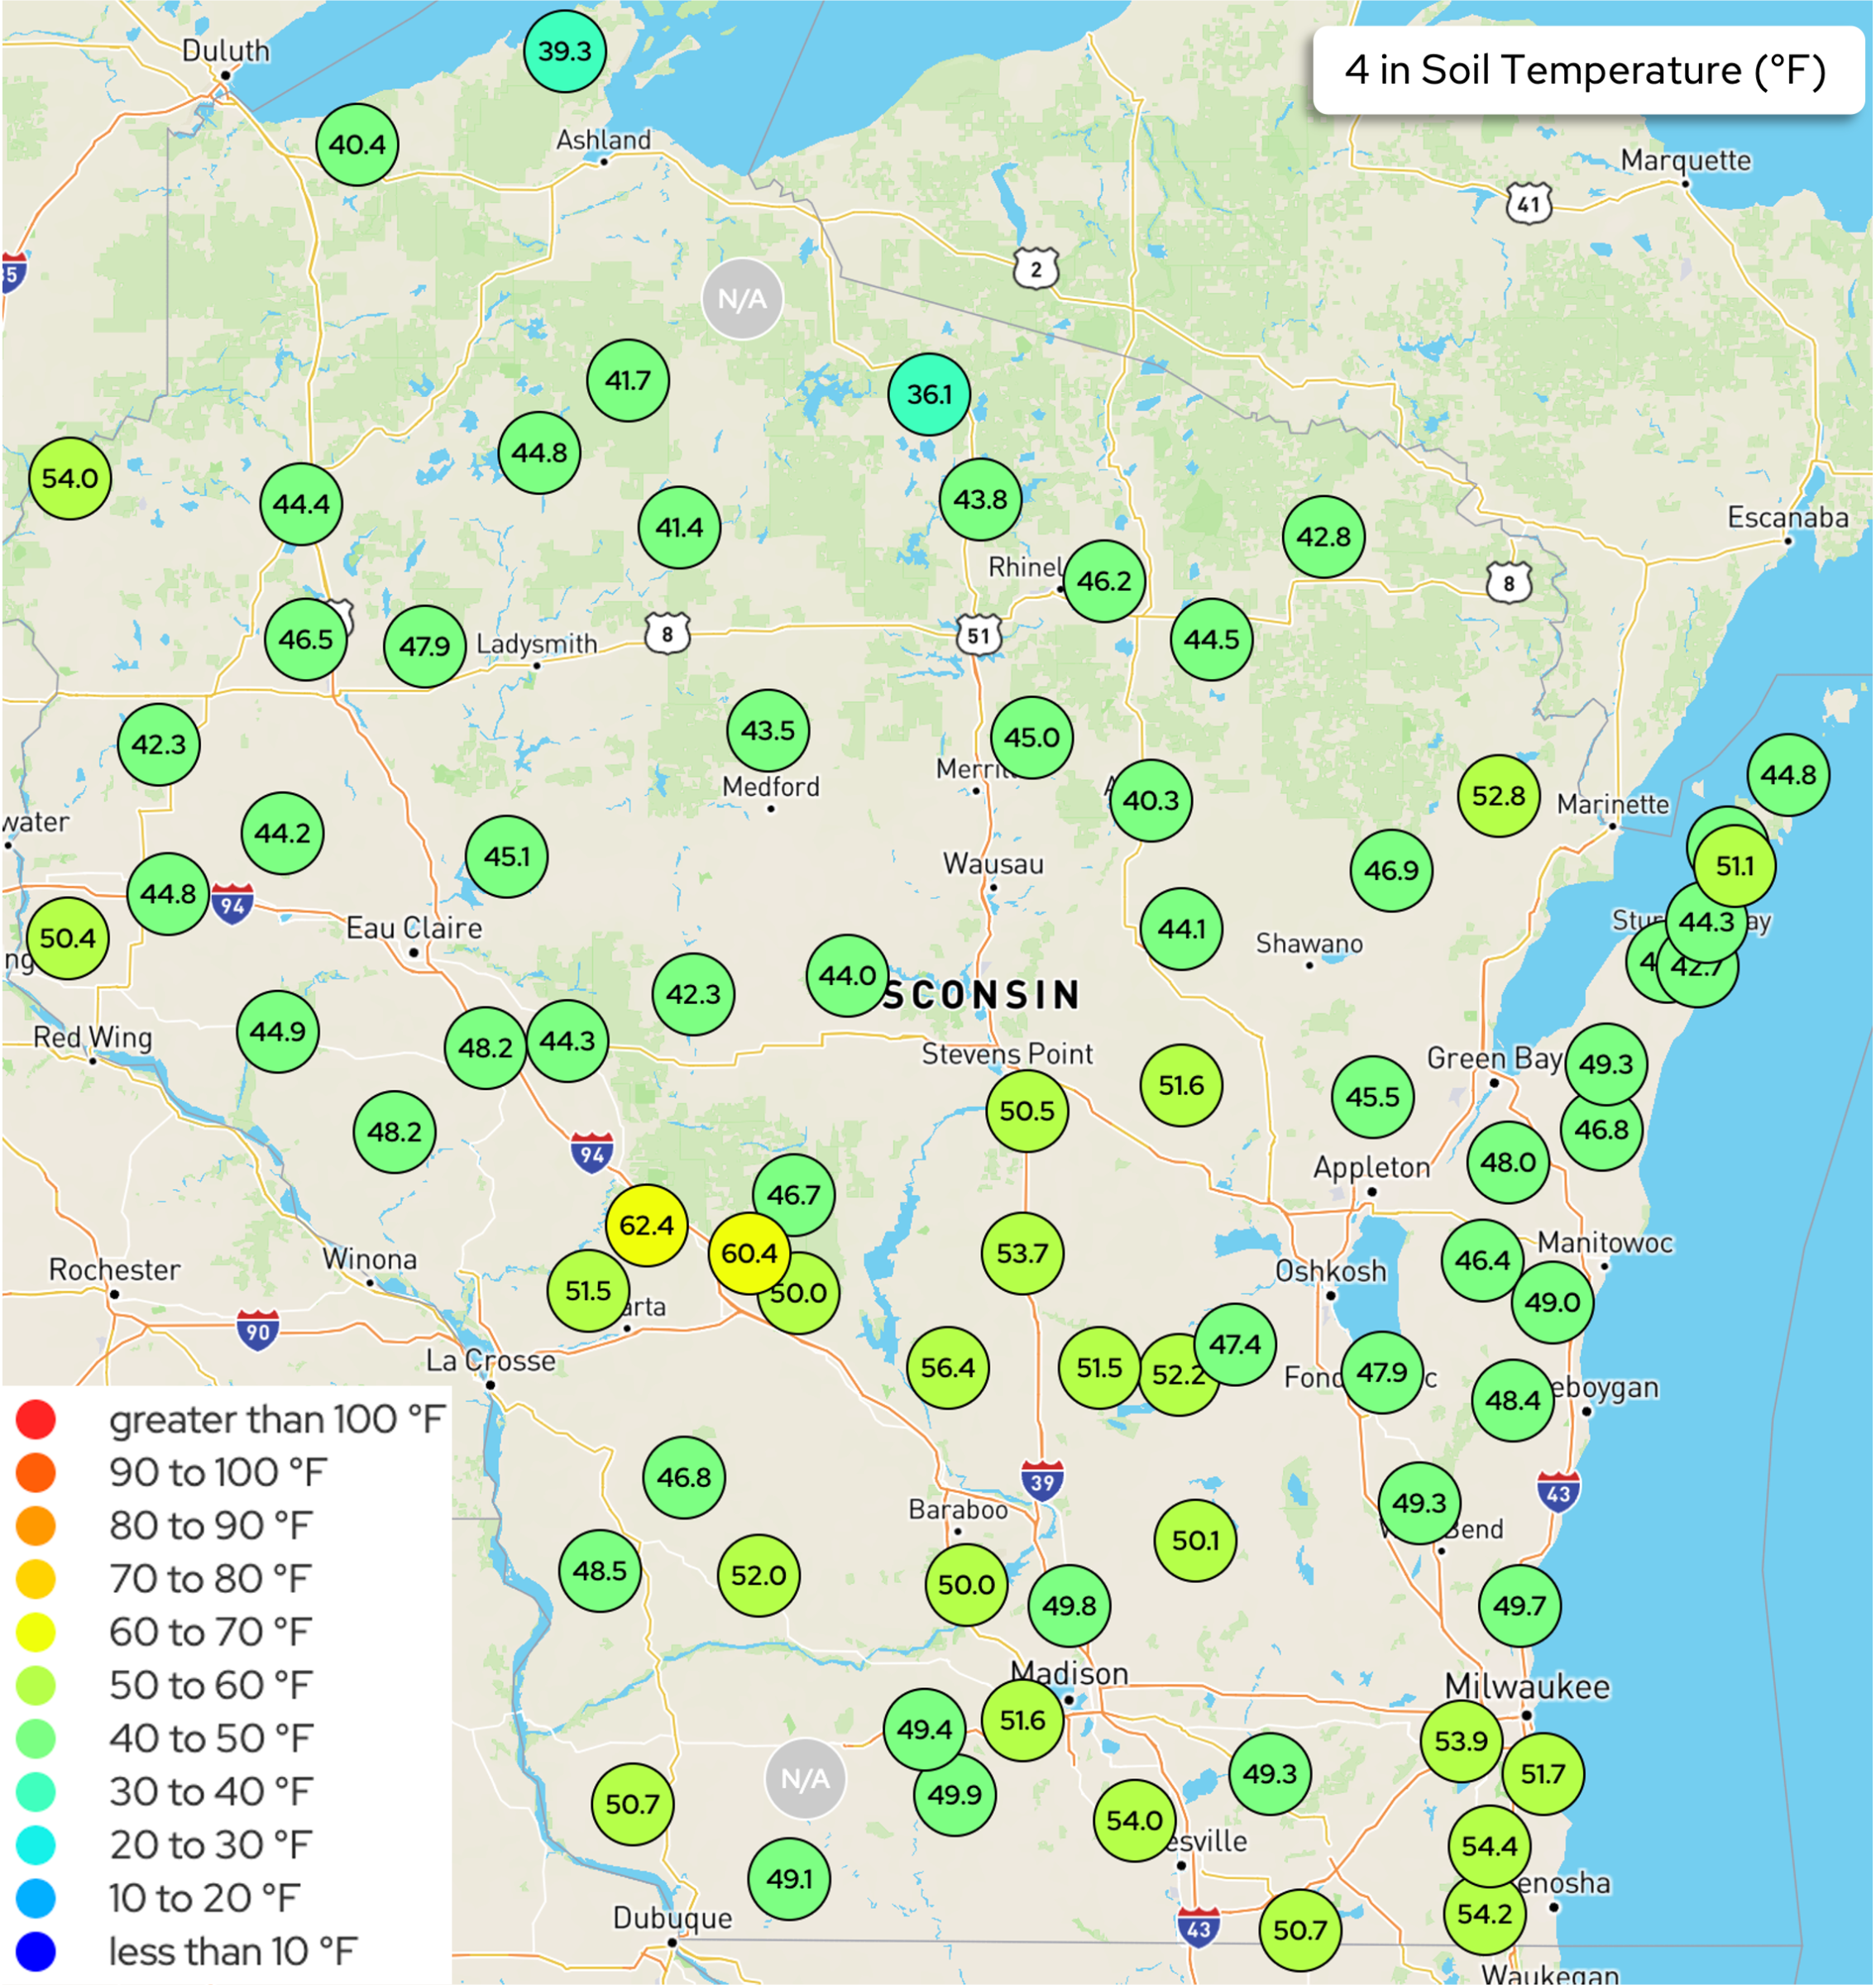
Image Description ↓
A map of Wisconsin displays 4‑inch soil temperature readings (°F) from monitoring stations, shown as green to yellow circles with numeric labels. Temperatures range from the upper 30s °F in far northern Wisconsin near Lake Superior (e.g., around 39–41 °F) to the low and mid‑50s °F across southern and southeastern Wisconsin. Central areas are mostly in the mid‑40s to low‑50s °F. Notably warmer pockets (around 60–62 °F) appear in southwestern Wisconsin near the La Crosse area. A legend indicates temperature categories from less than 10 °F up to greater than 100 °F, and a title box reads “4 in Soil Temperature (°F).”
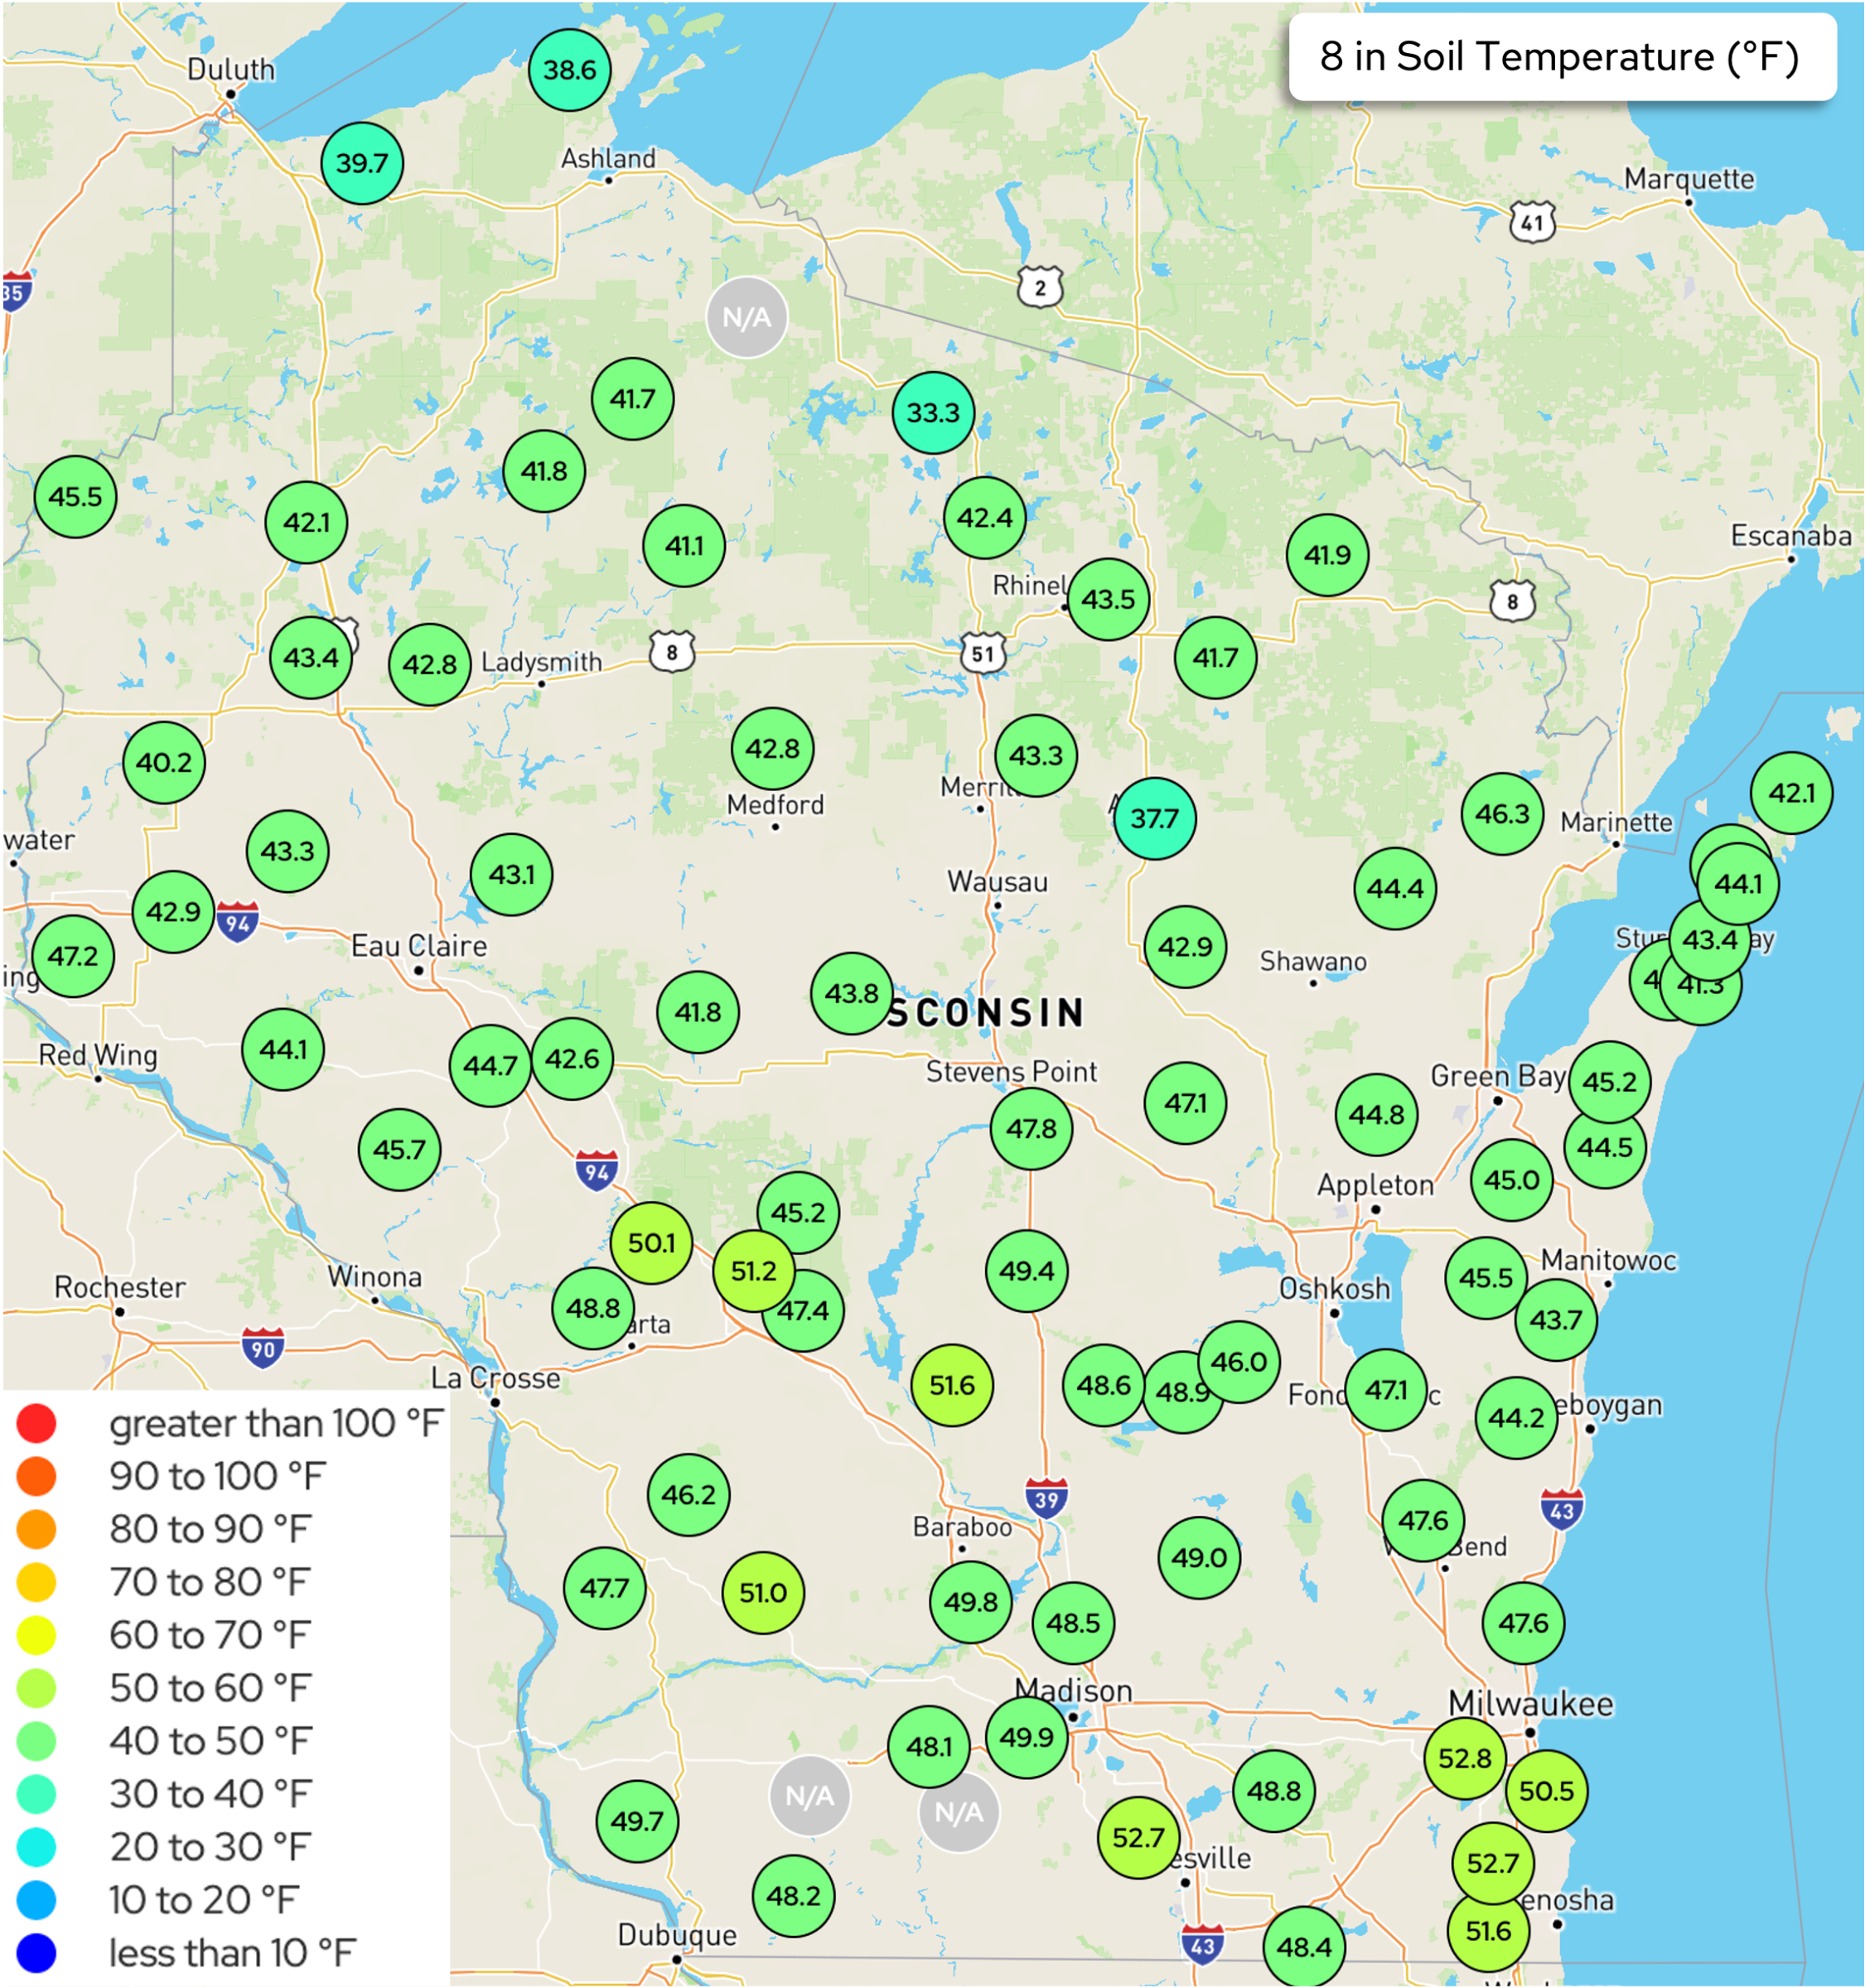
Image Description ↓
A map of Wisconsin displays 8‑inch soil temperature measurements (°F) from monitoring stations, shown as green circles with numeric labels. Temperatures range from the upper 30s °F in northern Wisconsin near Lake Superior (about 38–40 °F) to upper 40s and low 50s °F across southern and southeastern Wisconsin. Central Wisconsin generally shows mid‑40s °F values. Slightly warmer pockets (around 51–53 °F) appear in south‑central and southeastern areas, including near Madison and Milwaukee. A legend shows temperature categories ranging from less than 10 °F to greater than 100 °F, and a title box reads “8 in Soil Temperature (°F).”
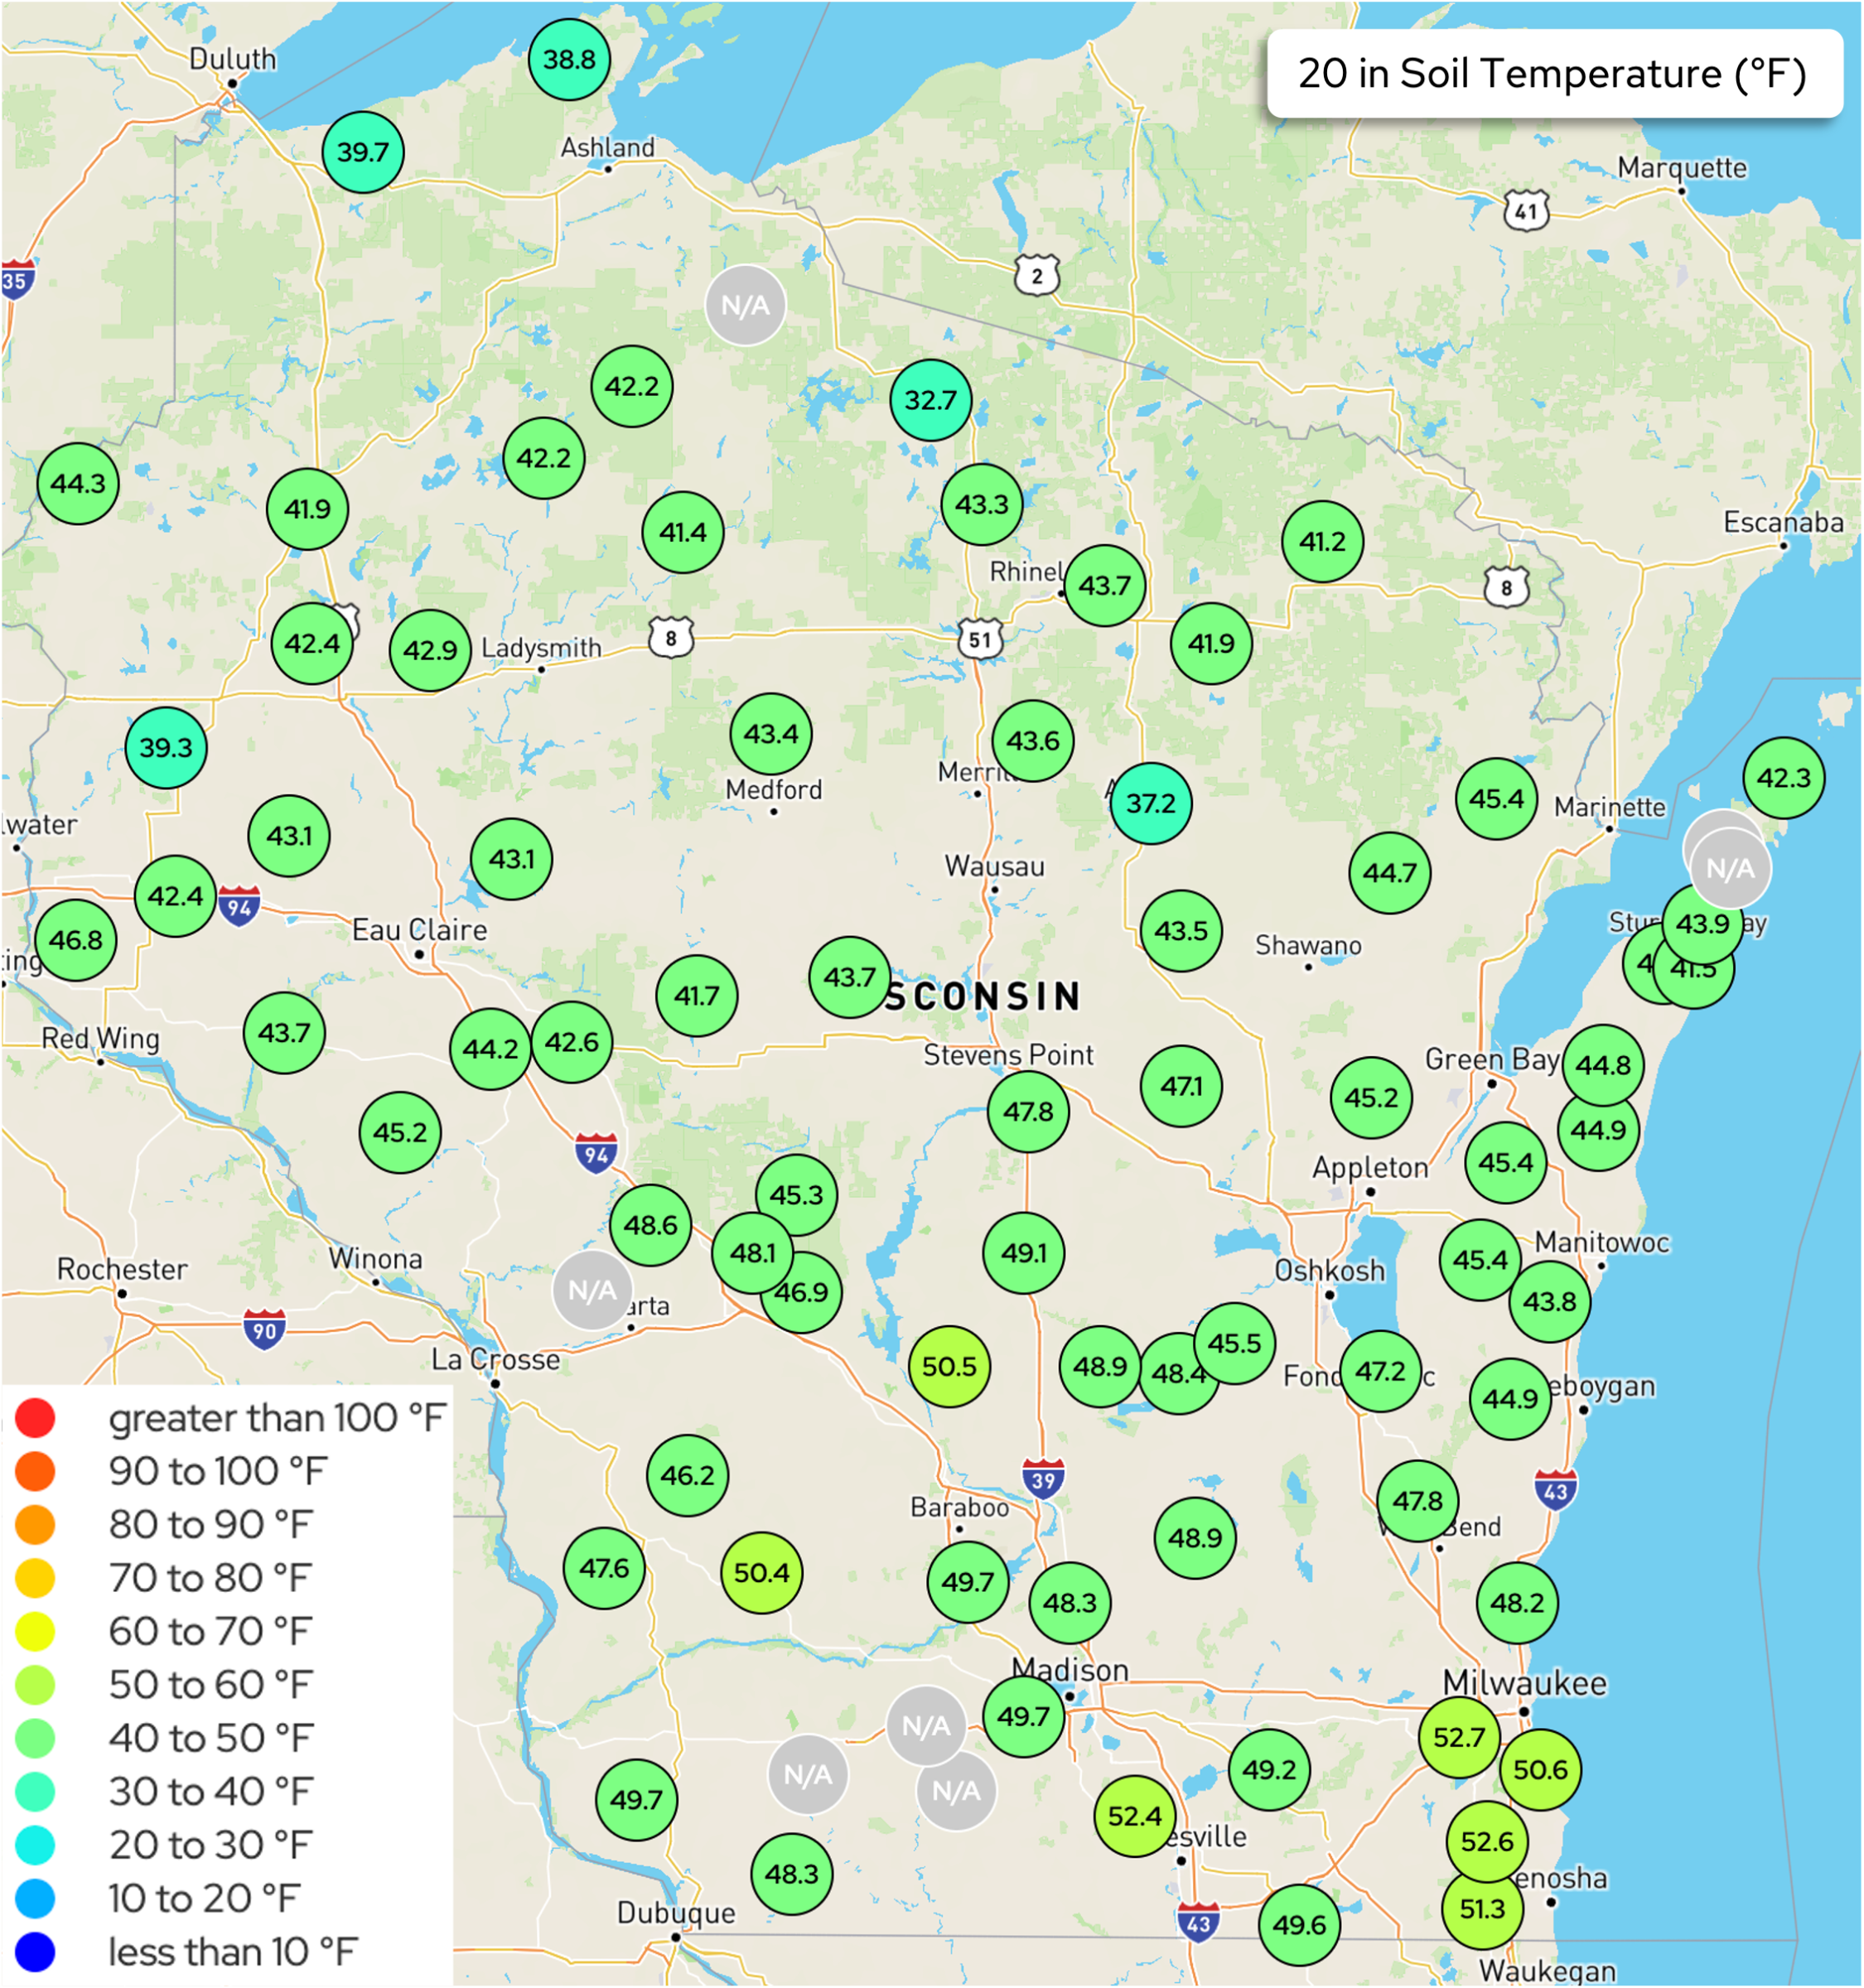
Image Description ↓
A map of Wisconsin displays 20‑inch soil temperature readings (°F) from monitoring stations, shown as green circles with numeric labels. Temperatures range from the upper 30s °F in far northern Wisconsin near Lake Superior (around 38–40 °F) to generally mid‑40s °F across central Wisconsin. Southern and southeastern Wisconsin show warmer temperatures, mostly upper 40s to low 50s °F, with several stations near Milwaukee, Kenosha, and Madison reporting around 50–53 °F. Scattered “N/A” markers indicate missing data at a few locations. A legend indicates soil temperature categories from less than 10 °F up to greater than 100 °F, and a title box reads “20 in Soil Temperature (°F).”
- The maps show Wisconet soil temperature conditions on April 21st @ 12:00 pm.
U.S. Drought Monitor
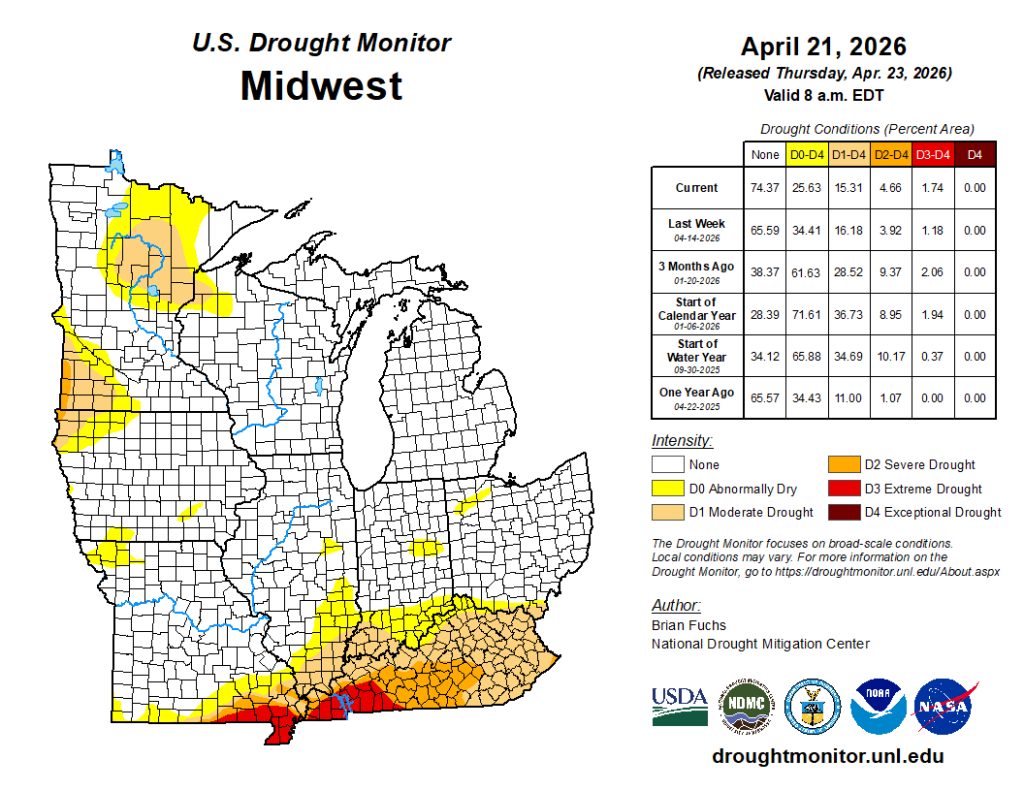
Image Description ↓
A map titled “U.S. Drought Monitor – Midwest” shows drought conditions as of April 21, 2026 (released April 23, valid 8 a.m. EDT). County‑level shading indicates drought intensity: white for none, yellow for D0 (abnormally dry), tan for D1 (moderate drought), orange for D2 (severe drought), red for D3 (extreme drought), and dark red for D4 (exceptional drought). Most of the Midwest (Minnesota, Wisconsin, northern Illinois, Michigan, Iowa, Missouri, and Ohio) shows no drought or D0 conditions. Moderate to severe drought (D1–D2) appears across parts of southern Illinois, Kentucky, and Indiana, with a small area of extreme drought (D3) at the southern tip of Indiana. A table lists percent area by category for the region, with current values showing 74.37% none, 25.63% D0–D4 combined, including 4.66% D2–D4.
Compared to last week:
- Midwest: Drought severity improved by 1 class across parts of northern Minnesota as well as parts of the lower Midwest. Across the southeastern portion of the region, drought became more widespread or increased in severity. Parts of Missouri and Kentucky remain in D3 or Extreme Drought.
- 85% of the Midwest region is drought free (~15% in D1-D4).
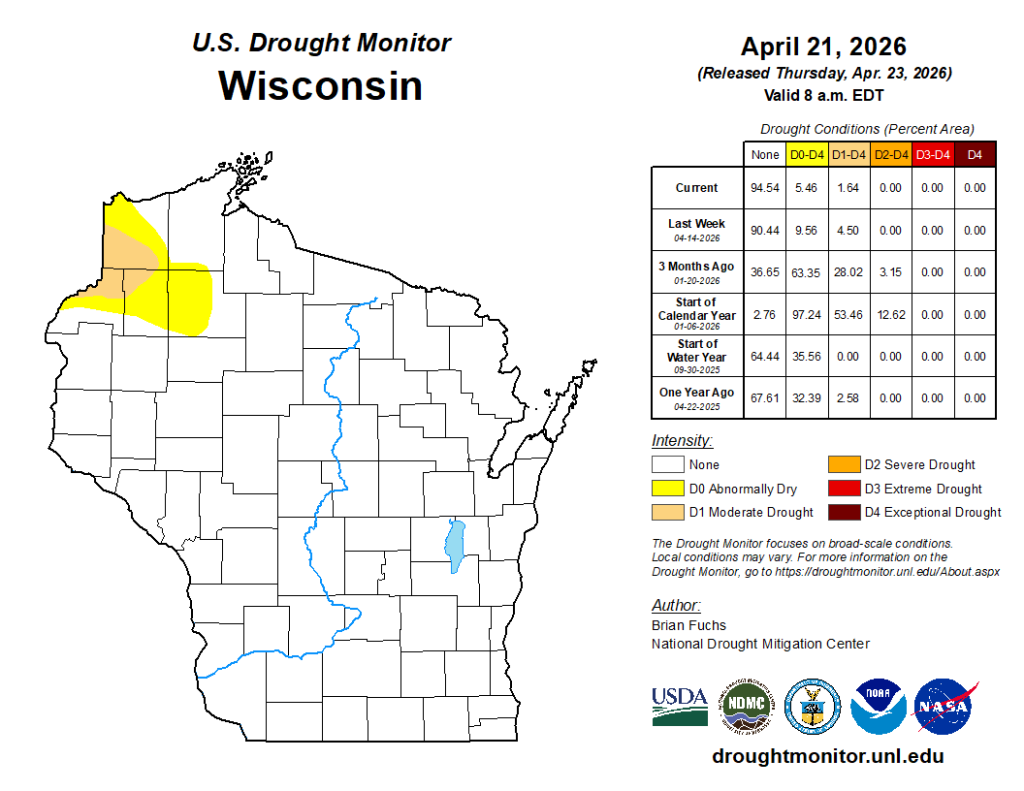
Image Description ↓
A map titled “U.S. Drought Monitor – Wisconsin” shows drought conditions as of April 21, 2026 (released April 23, valid 8 a.m. EDT). County outlines are shown across Wisconsin. Most counties are white, indicating no drought. Small areas in northwestern Wisconsin are shaded yellow and light tan, representing D0 Abnormally Dry and limited D1 Moderate Drought conditions. No areas show D2 Severe Drought, D3 Extreme Drought, or D4 Exceptional Drought. A table at right lists percent area by category: current conditions show 94.54% none, 5.46% D0–D4 combined, 1.64% D1–D4, and 0% D2 or worse. Last week values show slightly more dryness.
- Wisconsin: 1-class improvement across northwestern Wisconsin, but a small sliver of drought remains.
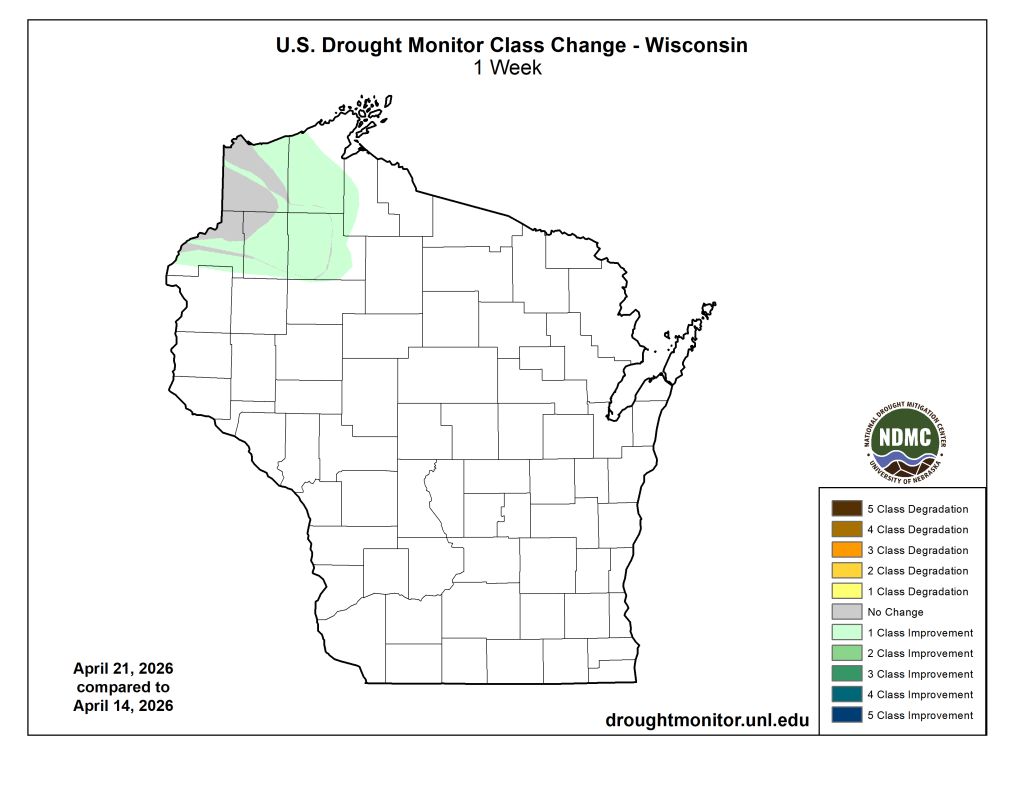
Image Description ↓
A map titled “U.S. Drought Monitor Class Change – Wisconsin (1 Week)” compares conditions from April 14 to April 21, 2026. Wisconsin is shown by county outlines. Most of the state is white, indicating no change in drought classification over the past week. Light green shading appears in portions of far northwestern Wisconsin, indicating a 1‑class improvement in drought status. Small gray areas indicate no change. There are no areas showing degradation (yellow to brown shades) or multi‑class improvements. A legend at right explains color categories from 1 to 5 class improvements or degradations, plus no change.
- A small area of drought remains in northwestern Wisconsin.
U.S. Drought Monitor Time Series
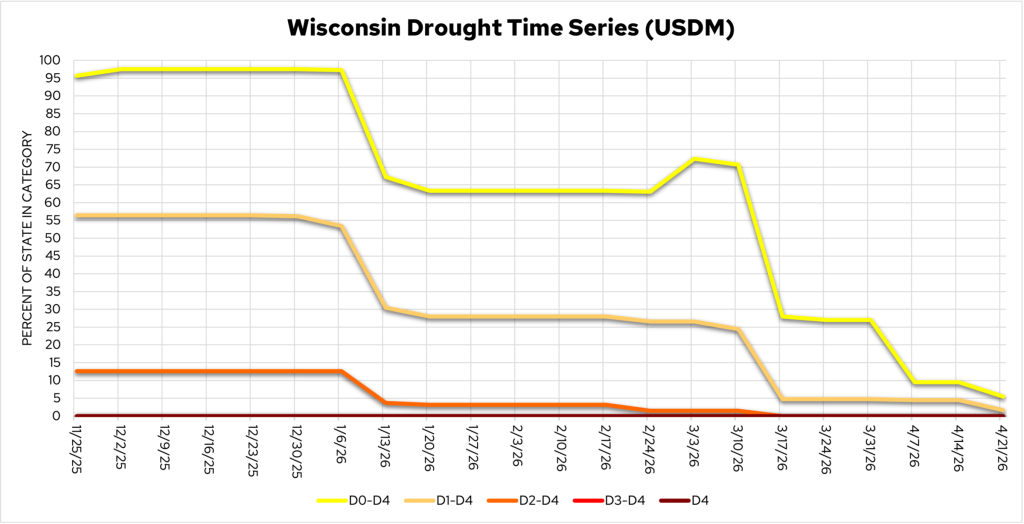
Image Description ↓
A line chart titled “Wisconsin Drought Time Series (USDM)” shows the percent of Wisconsin in drought categories from November 25, 2025, through April 21, 2026. The y‑axis is labeled “Percent of State in Category” (0–100%), and the x‑axis shows weekly dates. Five color‑coded lines represent drought extent: D0–D4 (yellow), D1–D4 (light orange), D2–D4 (orange), D3–D4 (red), and D4 (dark red).
From late November through early January, about 95–97% of the state is in D0–D4, ~55–56% in D1–D4, and ~12% in D2–D4, with near‑zero D3–D4 and D4. In mid‑January, all categories drop sharply: D0–D4 falls to ~65%, D1–D4 to ~30%, and D2–D4 to ~4%. Conditions remain relatively steady through February, briefly worsen in early March, then improve rapidly after mid‑March. By April 21, 2026, drought coverage is minimal, with D0–D4 near 5%, D1–D4 near 1–2%, and no D2–D4 or worse.
- Just 5.5% of the state is abnormally dry or is in moderate drought.
Temperature Trends
7 Day Temperatures
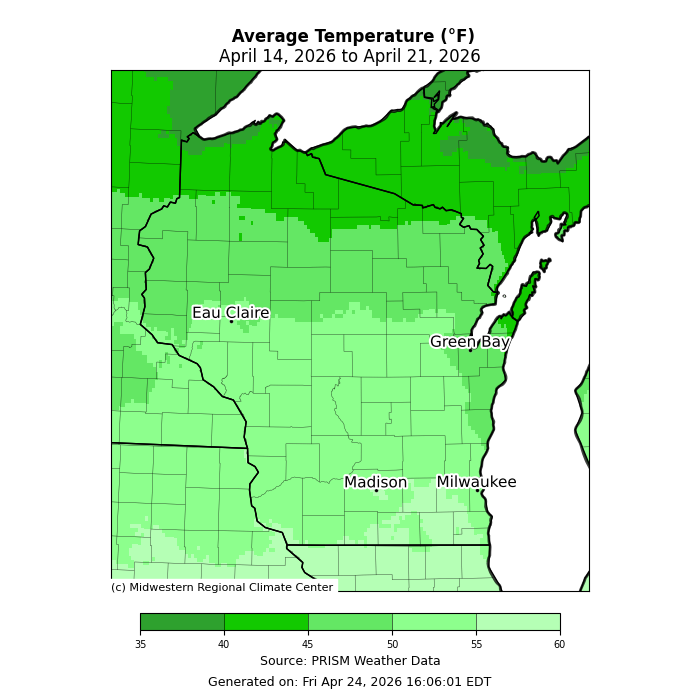
Image Description ↓
A shaded map of Wisconsin titled “Average Temperature (°F), April 14, 2026 to April 21, 2026.” Counties are color-coded from dark green (cooler) to light green (warmer). Northern Wisconsin appears cooler, generally around the upper 30s to low 40s°F. Central areas are mid-40s to low 50s°F. Southern Wisconsin, including Madison and Milwaukee, is warmest, approaching mid- to upper-50s°F. City labels include Eau Claire, Green Bay, Madison, and Milwaukee. A horizontal legend shows temperatures from 35 to 60°F. Source noted as PRISM Weather Data, with credit to the Midwestern Regional Climate Center and generation date April 24, 2026.
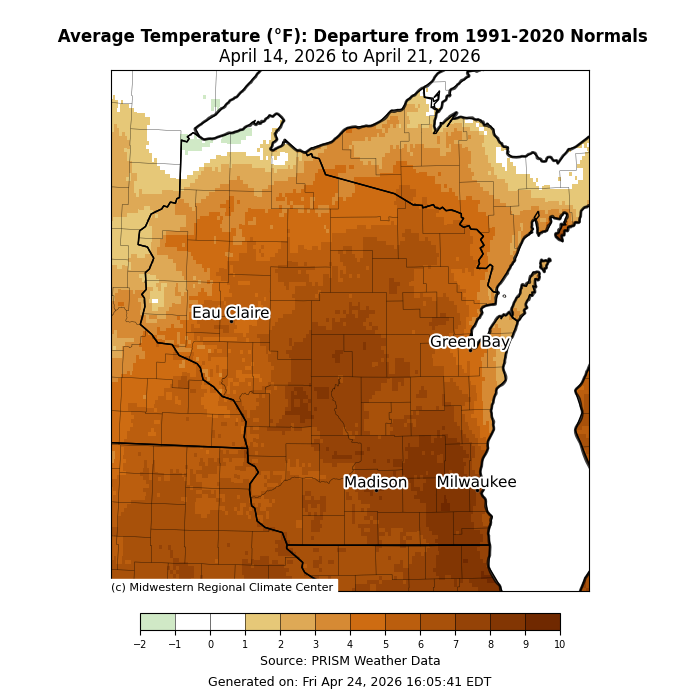
Image Description ↓
A county-level map of Wisconsin titled “Average Temperature (°F): Departure from 1991–2020 Normals, April 14, 2026 to April 21, 2026.” Counties are shaded from light tan to dark brown, indicating departures from –2°F to +10°F. Most of the state is shaded medium to dark brown, meaning temperatures were well above normal. Southern and central Wisconsin, including Madison and Milwaukee, show departures around +6 to +9°F. Northern areas are slightly less above normal, generally around +3 to +6°F. City labels include Eau Claire, Green Bay, Madison, and Milwaukee. A horizontal legend displays departure values from –2 to +10°F. Source is PRISM Weather Data, credited to the Midwestern Regional Climate Center, generated April 24, 2026.
- Average temperatures ranged from 50-60°F across the southern half of the state to 40-50°F in the northern half and in far east-central Wisconsin.
- Temperatures were 1-4°F above normal across northern Wisconsin and 4-7°F above normal across southern Wisconsin.
30 Day Temperatures
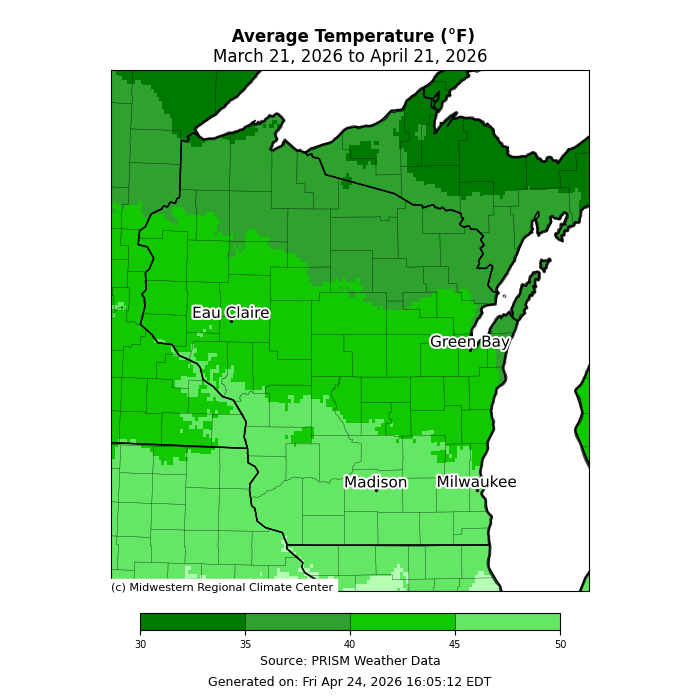
Image Description ↓
A county-level map of Wisconsin titled “Average Temperature (°F), March 21, 2026 to April 21, 2026.” Counties are shaded in greens from darker (cooler) to lighter (warmer). Northern Wisconsin shows cooler averages around 30–35°F. Central areas are mostly mid- to upper-30s and low-40s°F. Southern Wisconsin, including Madison and Milwaukee, appears warmest, generally near 45–50°F. A horizontal legend shows temperature values from 30 to 50°F. Source is PRISM Weather Data, credited to the Midwestern Regional Climate Center, generated April 24, 2026.
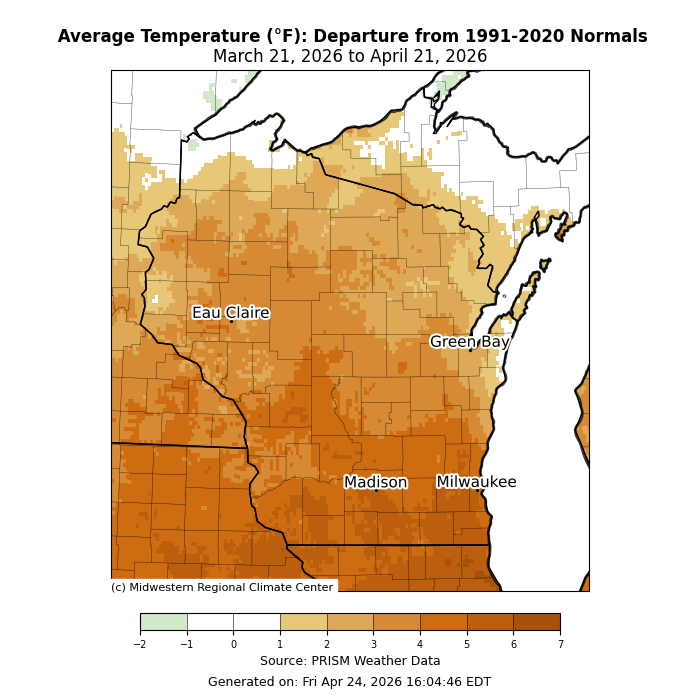
Image Description ↓
A county-level Wisconsin map titled “Average Temperature (°F): Departure from 1991–2020 Normals, March 21, 2026 to April 21, 2026.” Counties are shaded from light tan to dark brown, representing departures from –2 to +7°F. Most of the state is above normal. Southern and central Wisconsin, including Madison and Milwaukee, show the largest positive departures, generally +5 to +7°F. Northern areas are also above normal, typically around +2 to +4°F. A horizontal legend shows the departure scale from –2 to +7°F. Source is PRISM Weather Data, credited to the Midwestern Regional Climate Center, generated April 24, 2026.
Last Spring Freeze
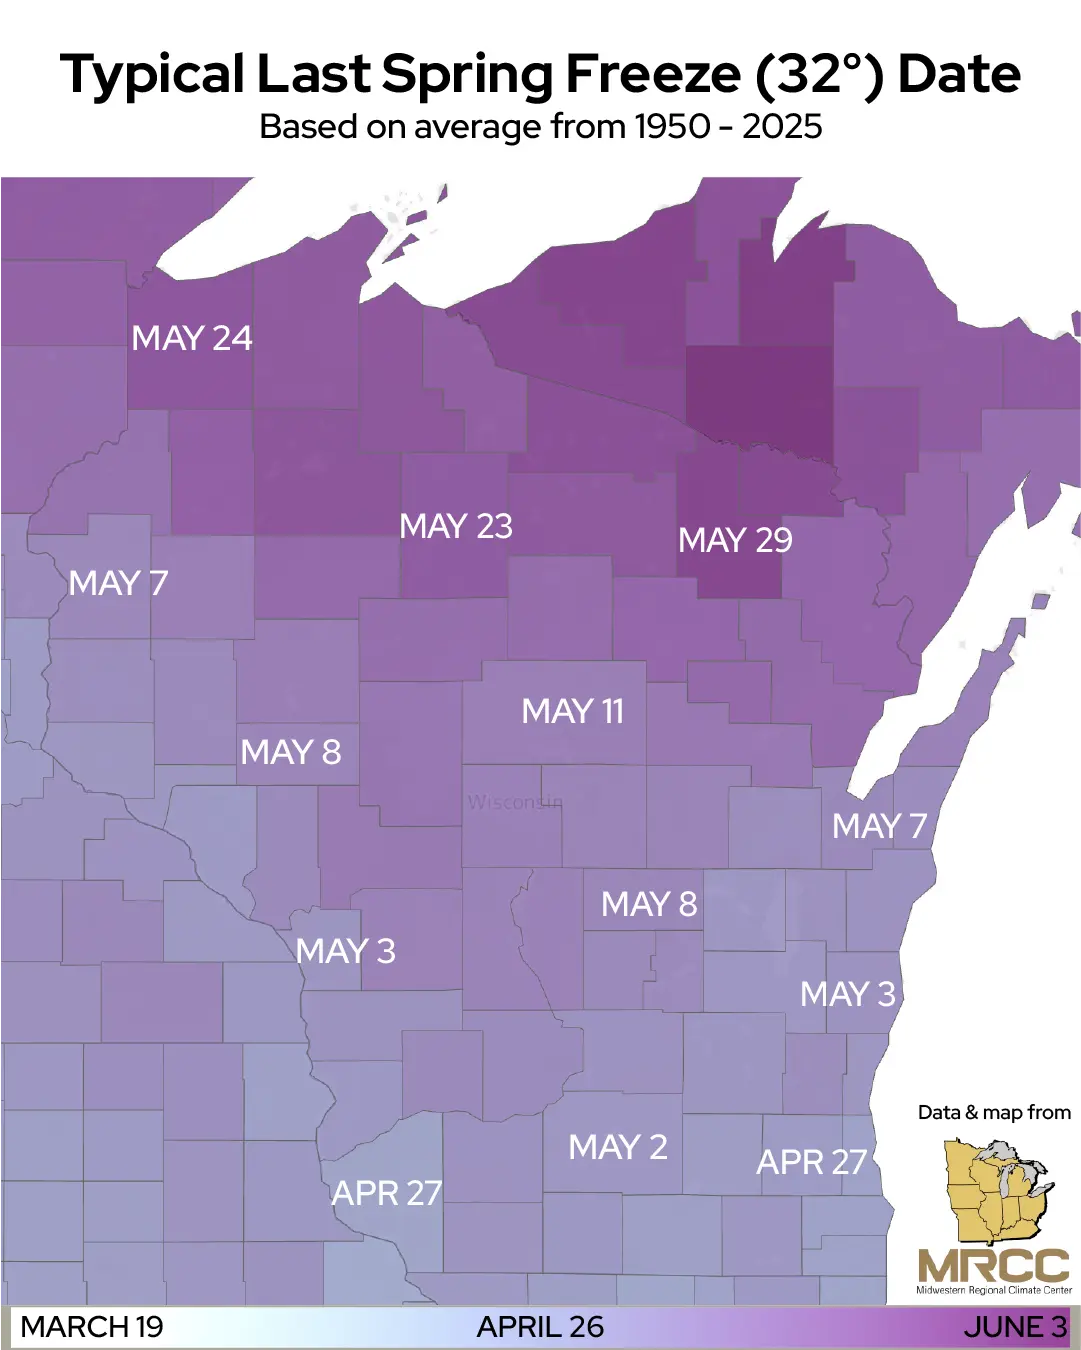
Image Description ↓
The map is titled “Typical Last Spring Freeze (32°) Date” with a subtitle stating it is based on averages from 1950–2025. It shows Wisconsin divided by counties, shaded in a purple gradient indicating the average date of the last 32°F spring freeze. Dates are labeled across the state. Southern Wisconsin shows earlier last freeze dates, mainly late April (for example, April 26–27 and May 2–3). Central Wisconsin shows early to mid‑May dates, such as May 7, May 8, and May 11. Northern Wisconsin, including areas near Lake Superior, shows later dates from mid‑ to late May, including May 23, May 24, and May 29. A color bar at the bottom indicates a progression from March 19 on the early end to June 3 on the late end. The Midwestern Regional Climate Center (MRCC) logo and a small Wisconsin locator map appear at the lower right.
- To explore data on when the last spring freeze typically occurs in your county, please check out the interactive MRCC Freeze Date Tool.
Crop Progress and Condition
Crop Progress Report for Wisconsin for the Week Ending on April 19th
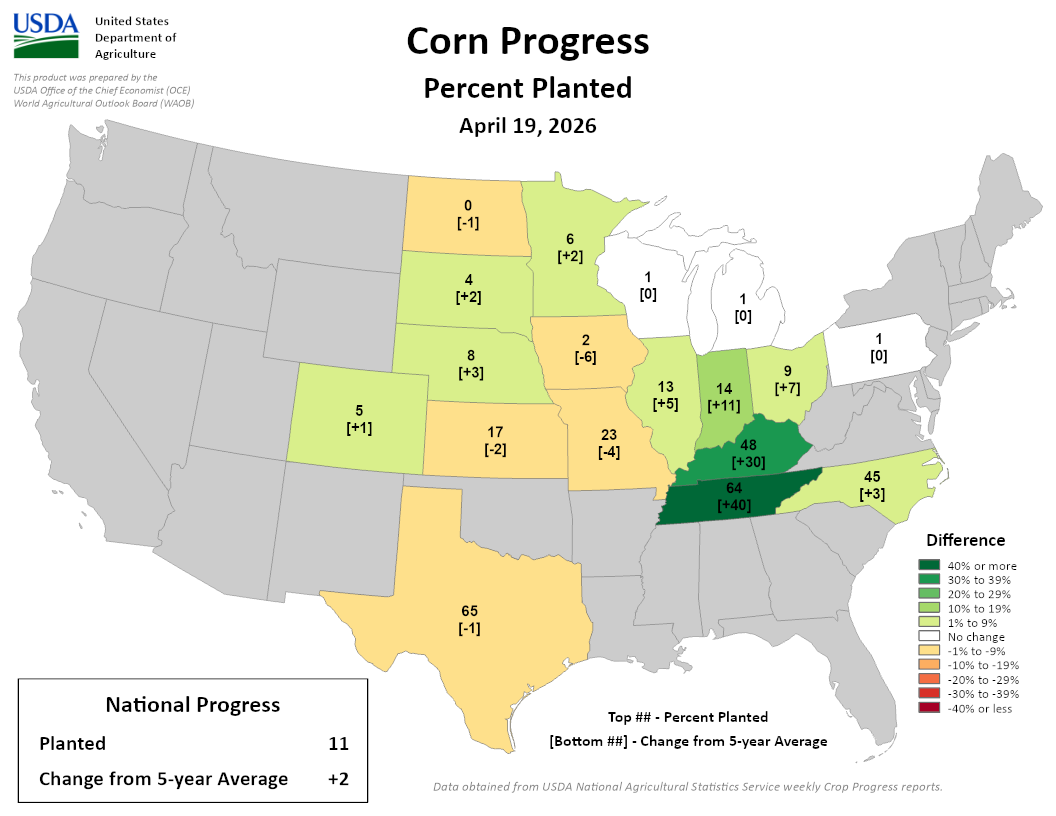
Image Description ↓
A color-coded map of the United States from the U.S. Department of Agriculture (USDA) shows corn planting progress by state as of April 19, 2026. Each participating state displays two numbers: the top number is percent planted; the bracketed number below is the change from the 5‑year average. A legend at right indicates color ranges for differences from the 5‑year average, from dark green (40% or more above average) to dark red (40% or more below), with neutral or light colors for smaller changes.
Examples visible on the map include: North Dakota at 0% (−1), Minnesota at 6% (+2), Iowa at 2% (−6), Illinois at 13% (+5), Indiana at 14% (+11), Ohio at 9% (+7), Kentucky at 48% (+30), Tennessee at 64% (+40), North Carolina at 45% (+3), and Texas at 65% (−1). Western states with no data are gray.
A boxed summary labeled “National Progress” reports: Planted 11; Change from 5‑year Average +2.
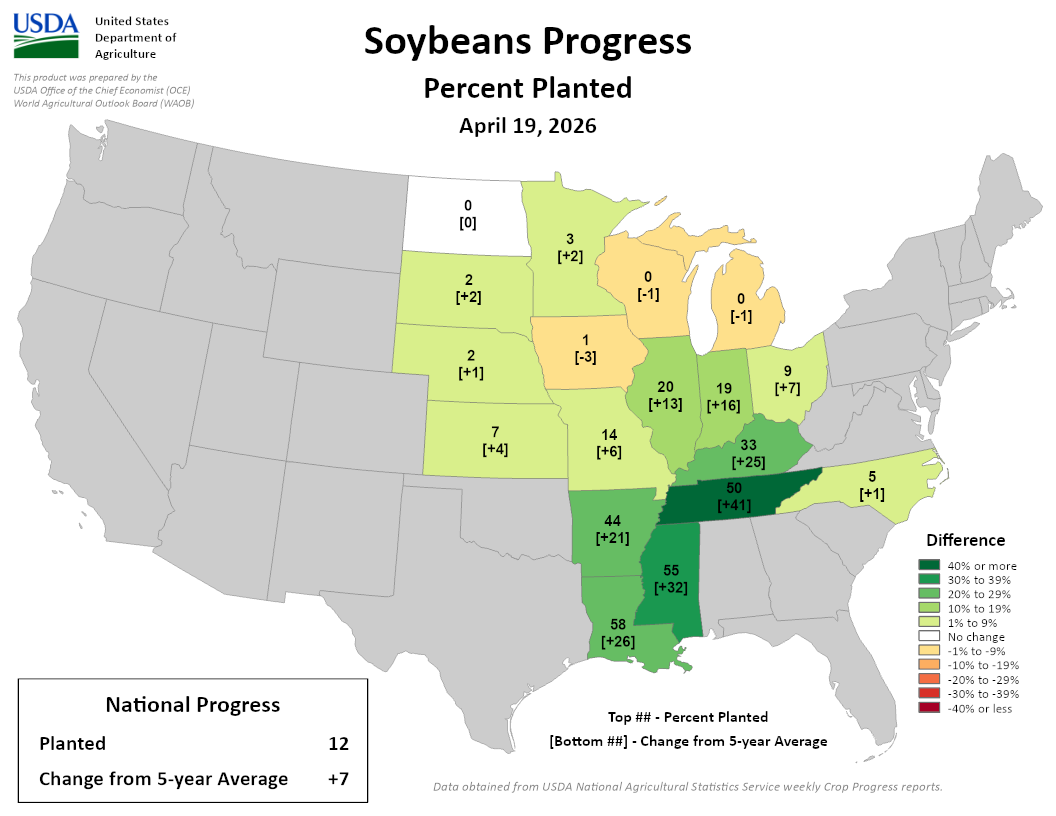
Image Description ↓
A color‑coded U.S. map from the U.S. Department of Agriculture shows soybean planting progress by state as of April 19, 2026. Each state label displays the percent planted (top number) and the change from the 5‑year average (bracketed number). Colors represent deviation from the 5‑year average, ranging from dark green (40% or more above average) to dark red (40% or more below average); gray indicates no data.
Notable values shown include: North Dakota 0% (0), Minnesota 3% (+2), Wisconsin 0% (‑1), Iowa 1% (‑3), Illinois 20% (+13), Indiana 19% (+16), Ohio 9% (+7), Kentucky 33% (+25), Tennessee 50% (+41), Alabama 55% (+32), Mississippi 58% (+26), and North Carolina 5% (+1).
A boxed summary labeled “National Progress” reports: Planted 12; Change from 5‑year Average +7.
- Corn planting remained at 1% complete.
- Oat planting rose slightly to 1% complete.
- Pasture and range was rated 38% good to excellent, the same as last week.
- Winter wheat was rated 49% good to excellent, up 1% from last week.
- Read the full USDA report.
Forecasts and Outlooks
7 Day Precipitation Forecast
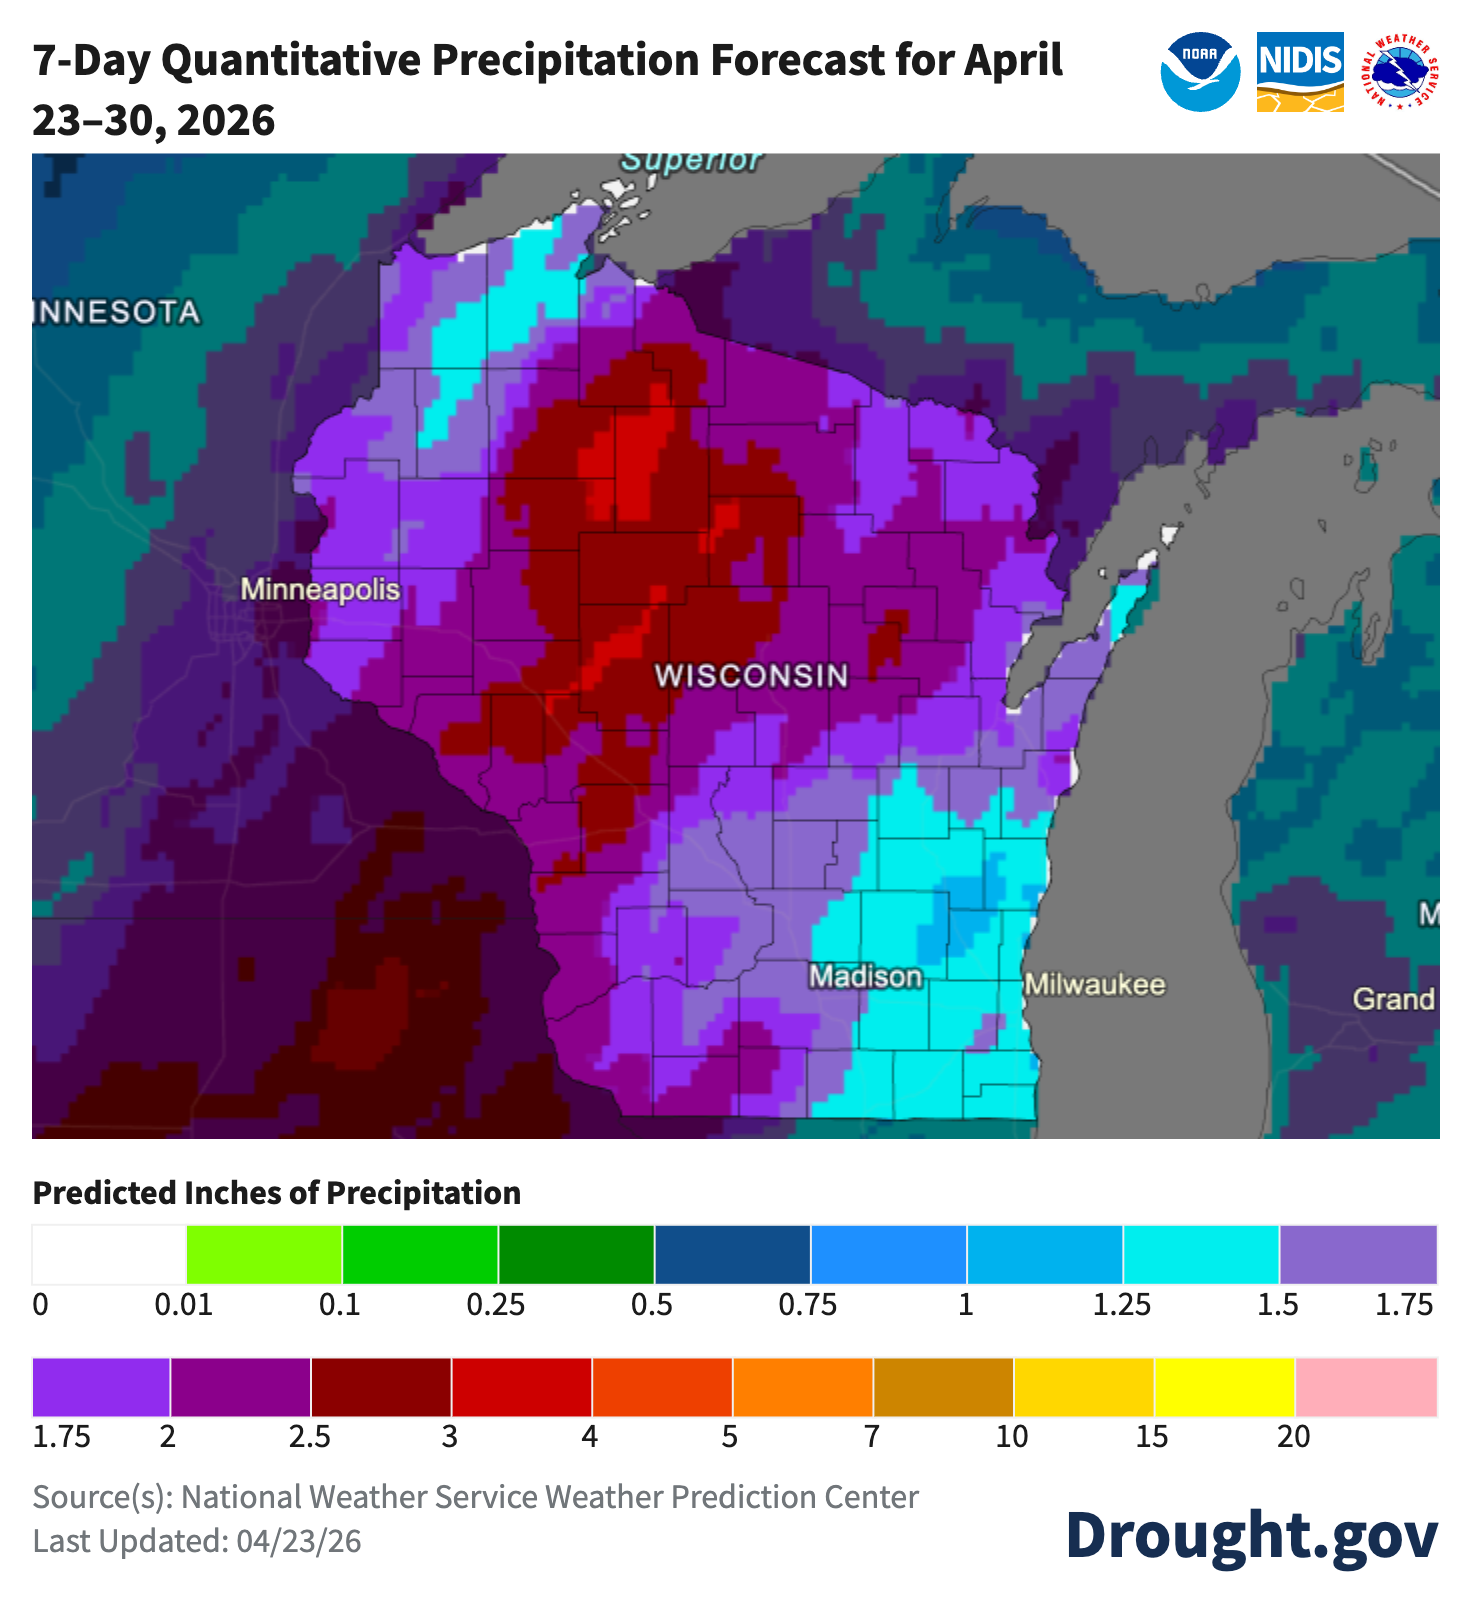
Image Description ↓
A map titled “7-Day Quantitative Precipitation Forecast for April 23–30, 2026” shows predicted precipitation totals across Wisconsin, from the National Weather Service Weather Prediction Center. Color shading represents inches of precipitation, with a legend ranging from 0 to 20 inches. Central and north-central Wisconsin are shaded red to purple, indicating roughly 4–10 inches or more. Southern and southwestern areas also show elevated totals. Southeastern Wisconsin, including Madison and Milwaukee, is shaded light blue to teal, indicating lower amounts (about 0.75–1.5 inches). State boundaries, county lines, major cities (Minneapolis, Madison, Milwaukee), and Lake Superior and Lake Michigan coastlines are labeled. Source text reads: “Source(s): National Weather Service Weather Prediction Center. Last Updated: 04/23/26.
- When? – best chances for precipitation are Sunday night through Tuesday morning (4/26-4/28).
- Where? – highest precipitation totals are predicted for western and northern counties.
- Check your local forecast for details on totals and timing.
- Average precip (1991-2020) for this week: 0.93”.
8-14 Day Temperature and Precipitation Outlook
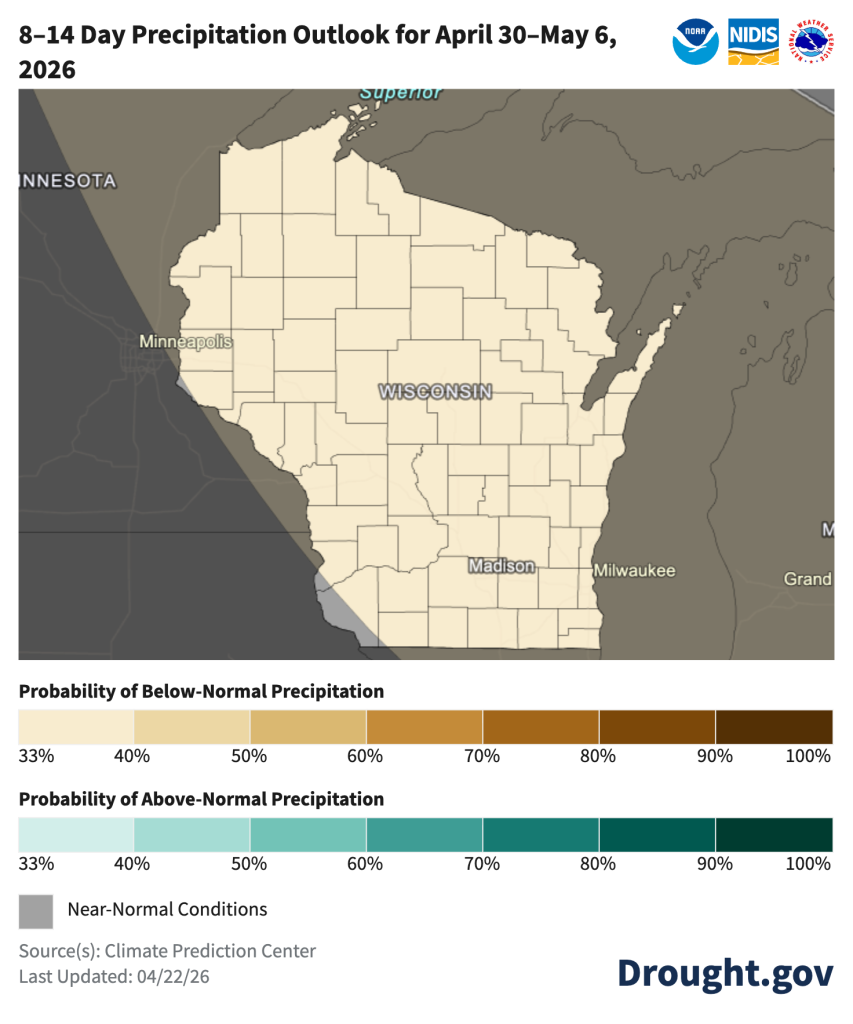
Image Description ↓
A map titled “8–14 Day Precipitation Outlook for April 30–May 6, 2026” shows Wisconsin outlined by counties and labeled with major cities including Madison and Milwaukee. The entire state is shaded light gray, indicating near-normal precipitation conditions. No areas are shaded to indicate above-normal (green/teal scale) or below-normal (tan/brown scale) precipitation probabilities. Legends below the map show probability ranges (33%–100%) for below-normal precipitation, above-normal precipitation, and a gray key for near-normal conditions. Source text reads “Source(s): Climate Prediction Center” and “Last Updated: 04/22/26.
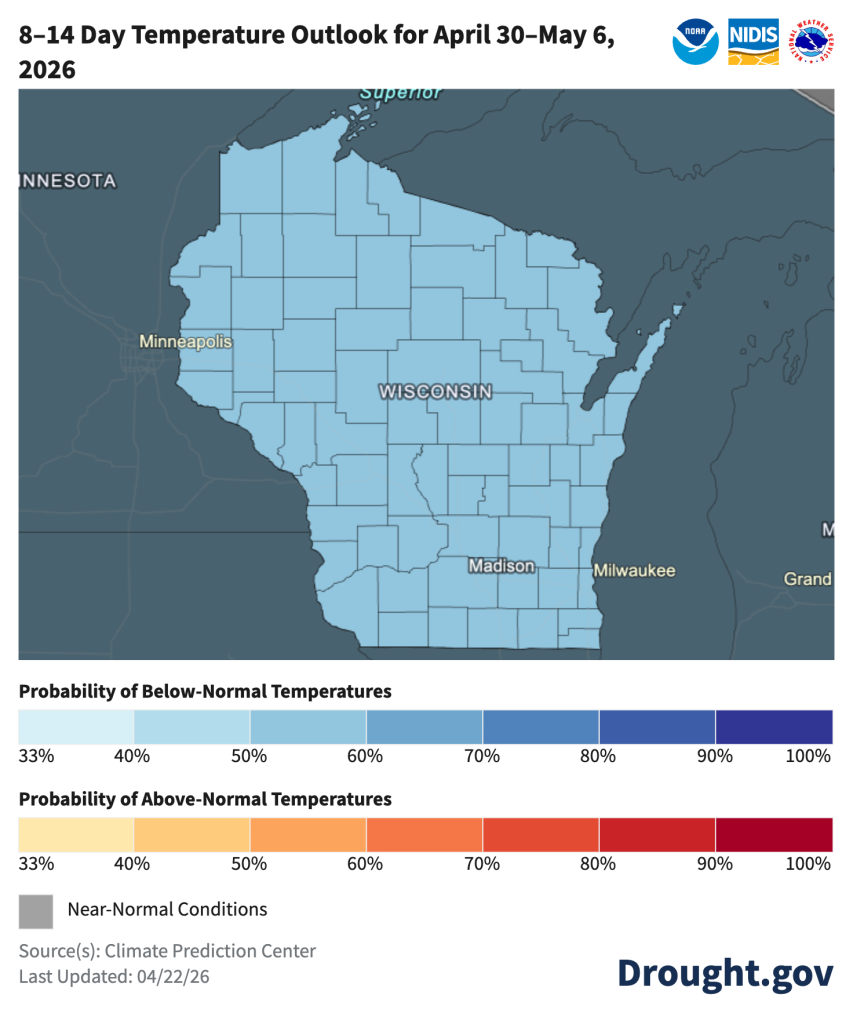
Image Description ↓
A map titled “8–14 Day Temperature Outlook for April 30–May 6, 2026” shows Wisconsin divided by counties, with major cities labeled including Madison and Milwaukee. The entire state is shaded light blue-gray, corresponding to near-normal temperature conditions. No areas show color shading for above-normal (yellow to red scale) or below-normal (blue scale) temperature probabilities. Legends below the map display probability ranges from 33% to 100% for below-normal and above-normal temperatures, plus a gray key for near-normal conditions. Source text reads “Source(s): Climate Prediction Center” and “Last Updated: 04/22/26.
- Late April-early May: there is the chance for below-normal precipitation (33-40% odds) and temperatures (50-60% odds).
- Statewide normals (1991-2020) for April 30-May 6 are 50.5°F and 0.82”.
30 Day Temperature and Precipitation Outlook
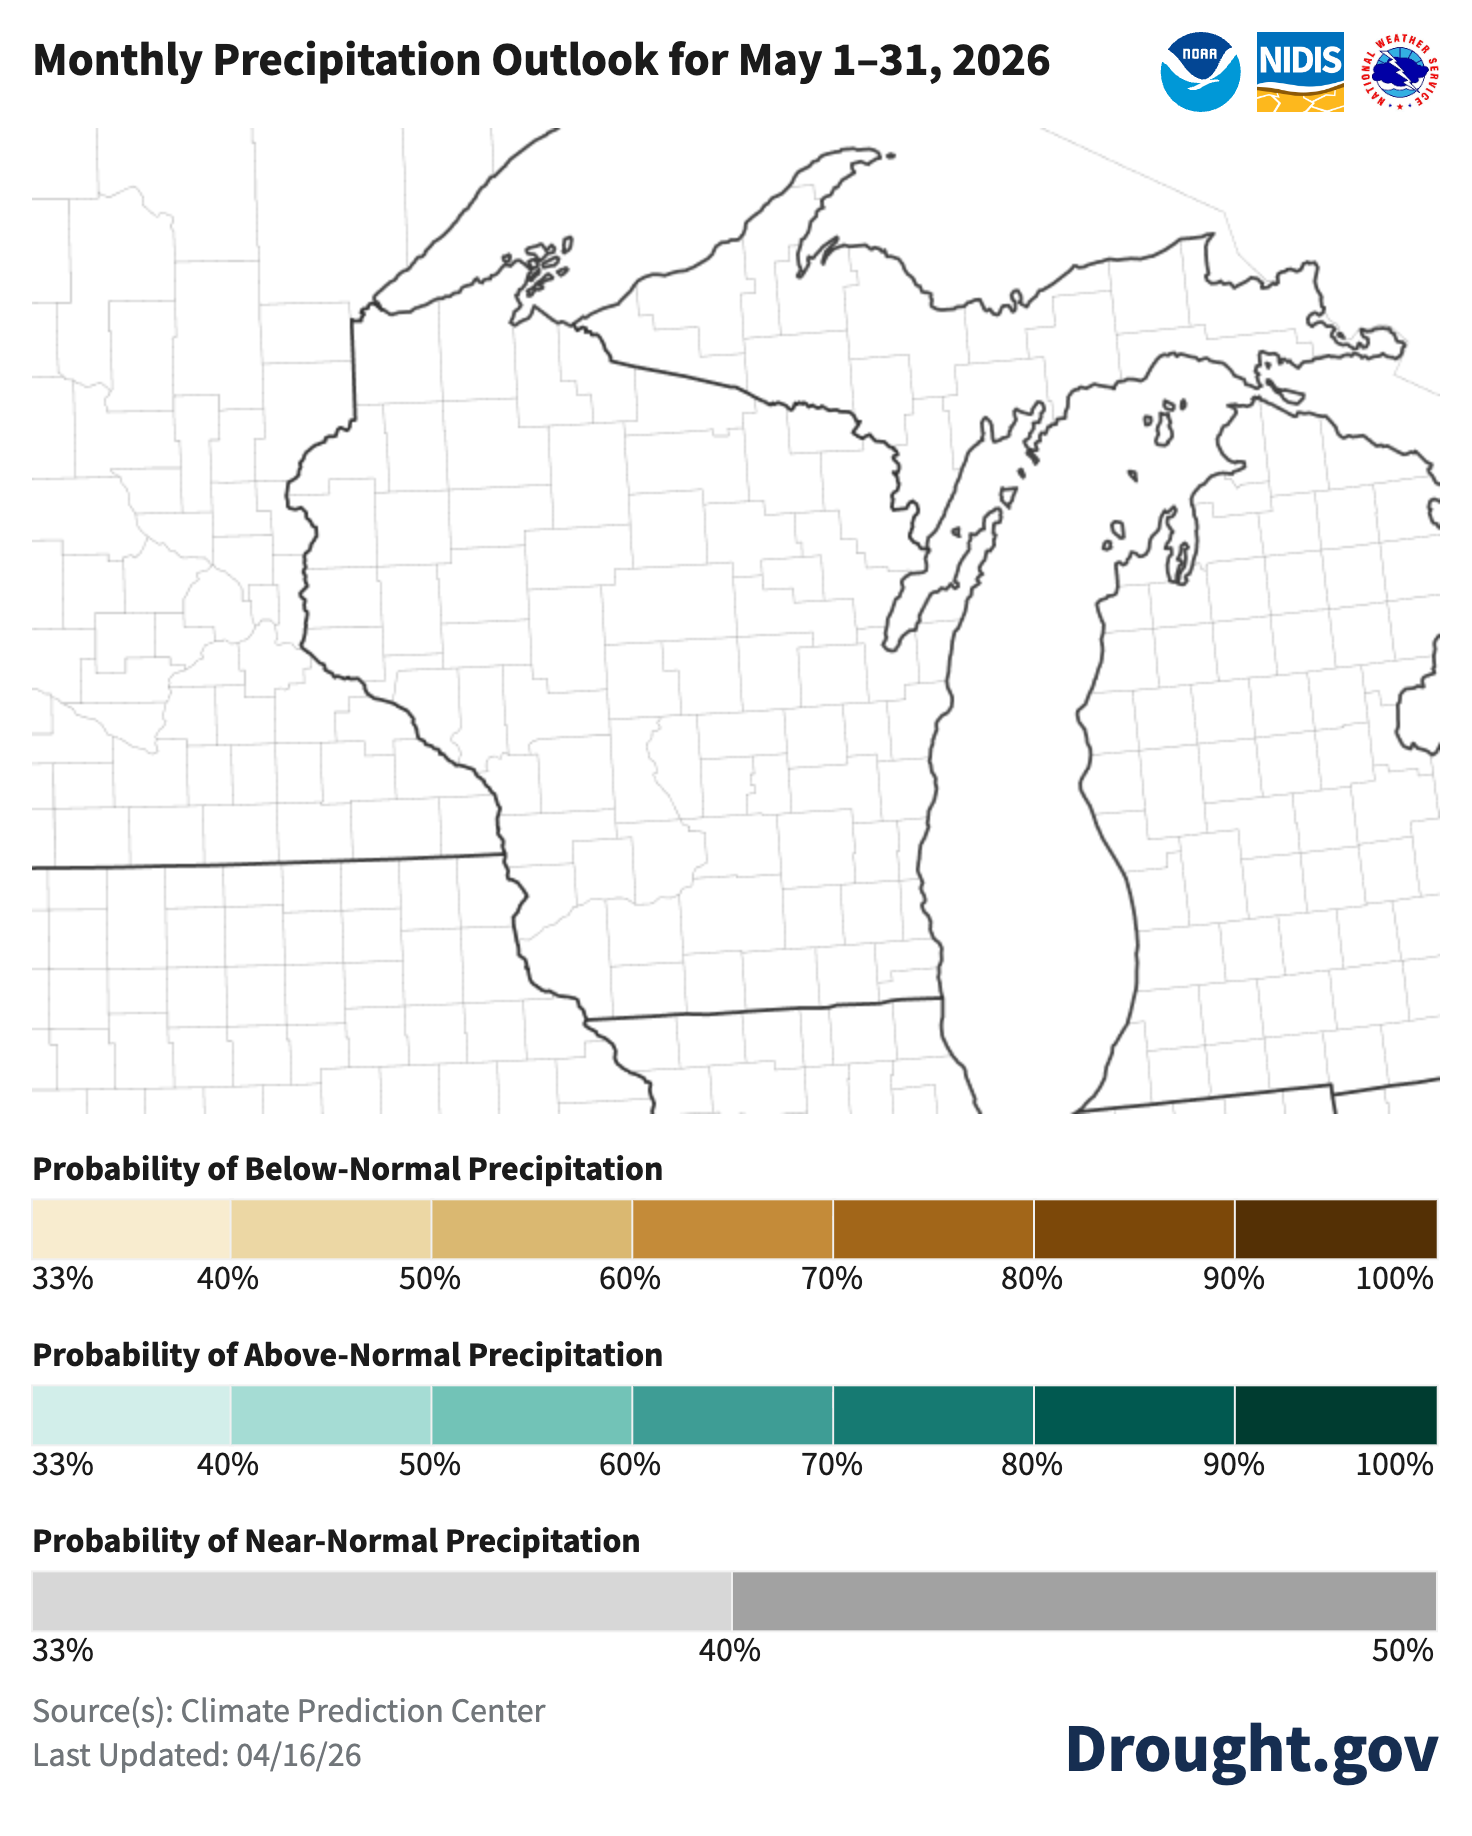
Image Description ↓
A map titled “Monthly Precipitation Outlook for May 1–31, 2026” shows Wisconsin outlined with county boundaries but no colored shading across the state. The absence of color indicates no clear signal for above-normal or below-normal precipitation, implying equal chances or near-normal conditions statewide. Legends below show probability scales for below-normal precipitation (tan/brown), above-normal precipitation (green/teal), and near-normal precipitation (gray), but none are applied to the map. The source is the Climate Prediction Center, last updated 04/16/26.
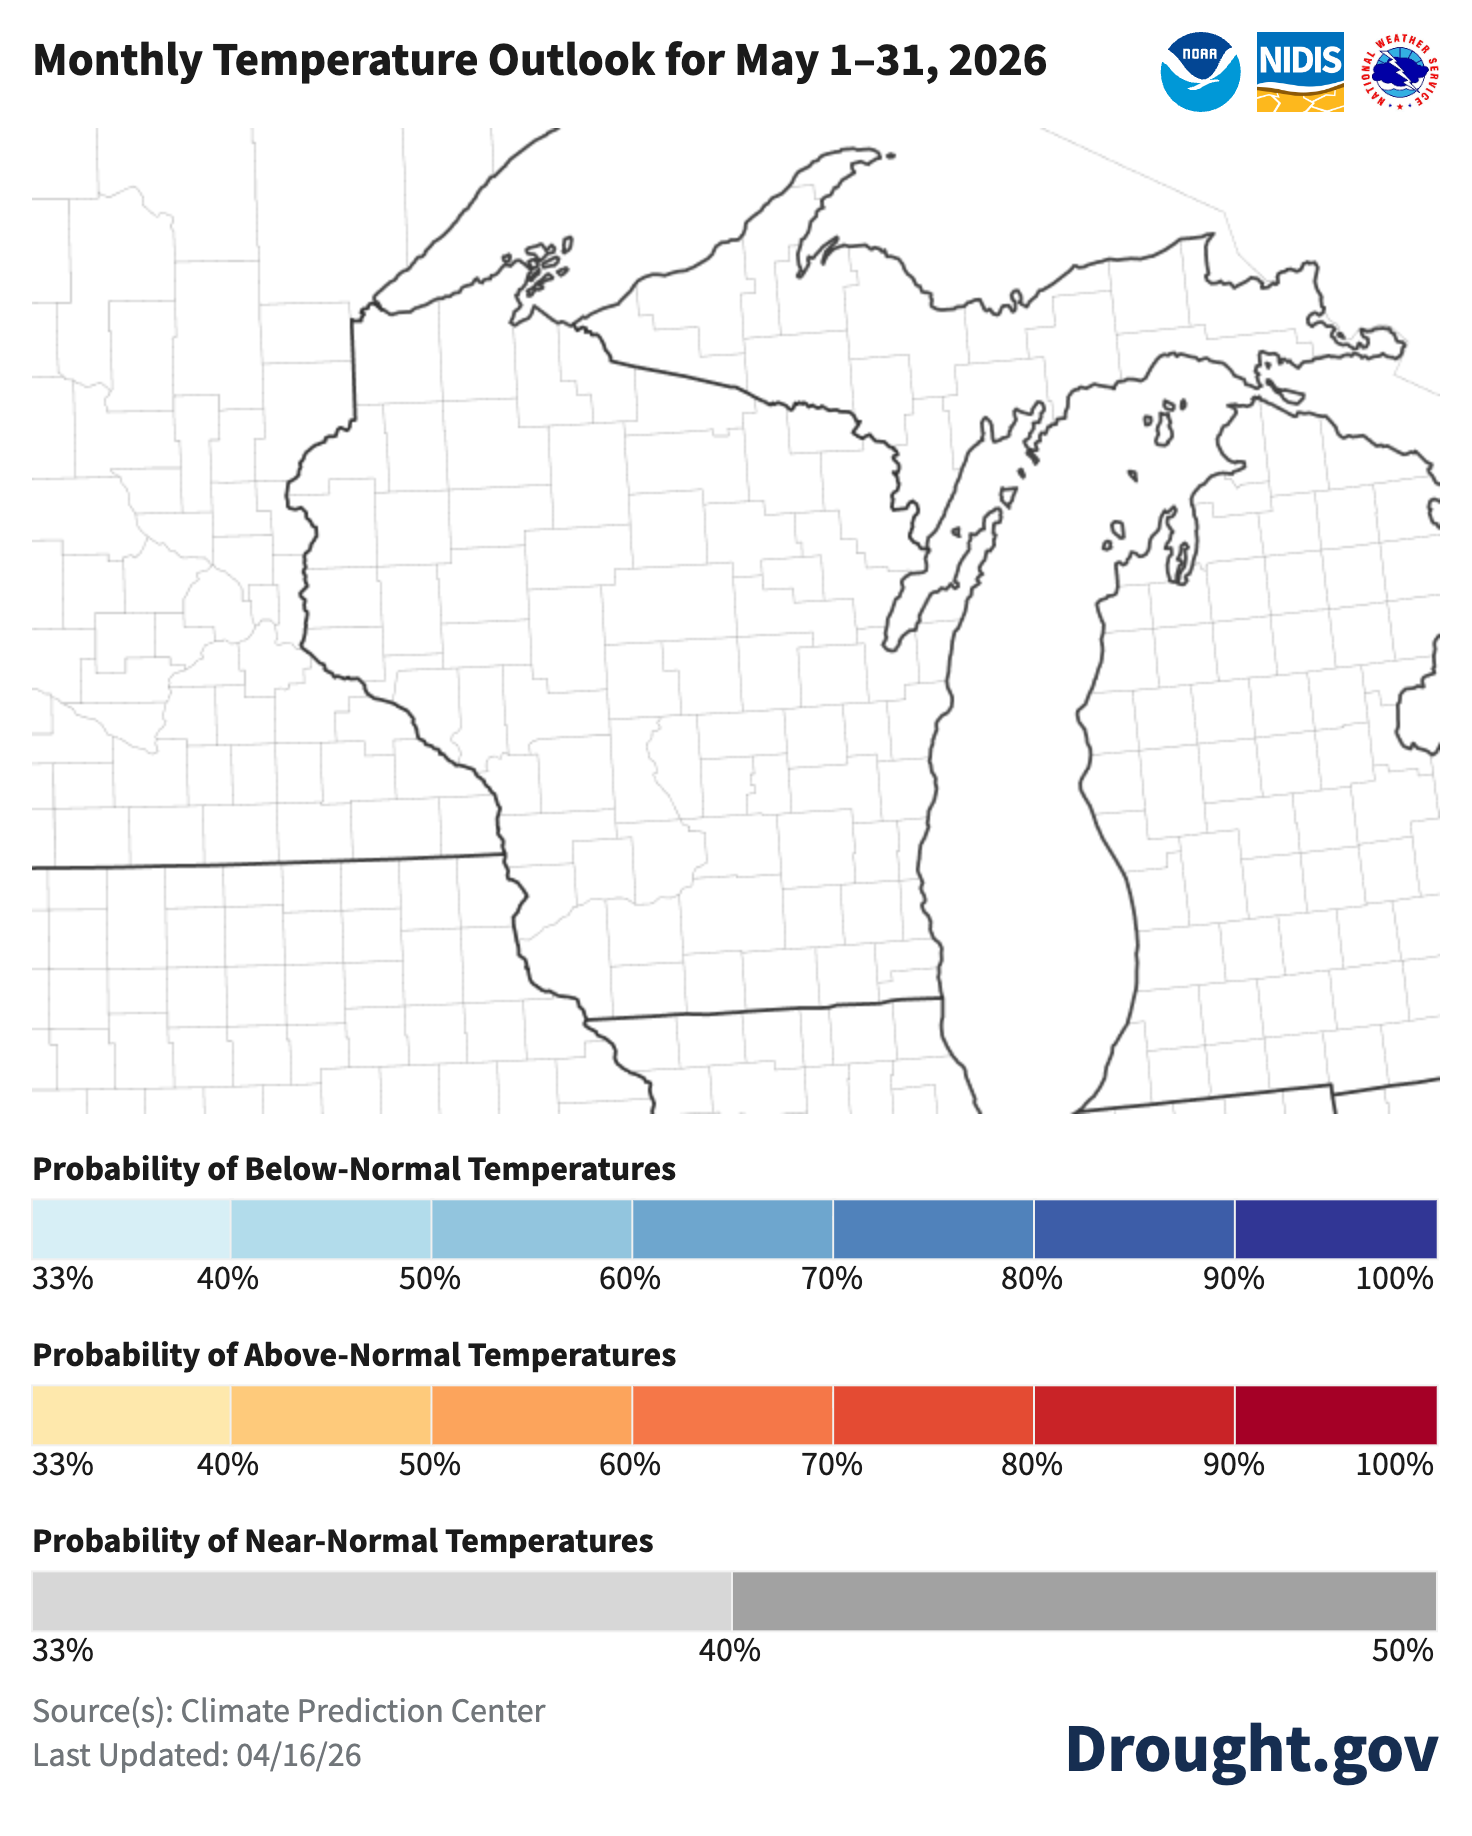
Image Description ↓
A map titled “Monthly Temperature Outlook for May 1–31, 2026” shows Wisconsin outlined with county boundaries and surrounding Great Lakes. The state has no color shading, indicating equal chances with no clear signal for above-normal, below-normal, or near-normal temperatures across Wisconsin. Legends below display probability scales for below-normal temperatures (blue), above-normal temperatures (yellow to red), and near-normal temperatures (gray), but none are applied to the map. Source text reads “Source(s): Climate Prediction Center” and “Last Updated: 04/16/26.
- May: uncertainty for temperatures and precipitation statewide with equal chances for above, near, or below normal conditions.
- Statewide normals (1991-2020) for May 1-31 are 55.4°F and 3.93”.
90 Day Temperature and Precipitation Outlook
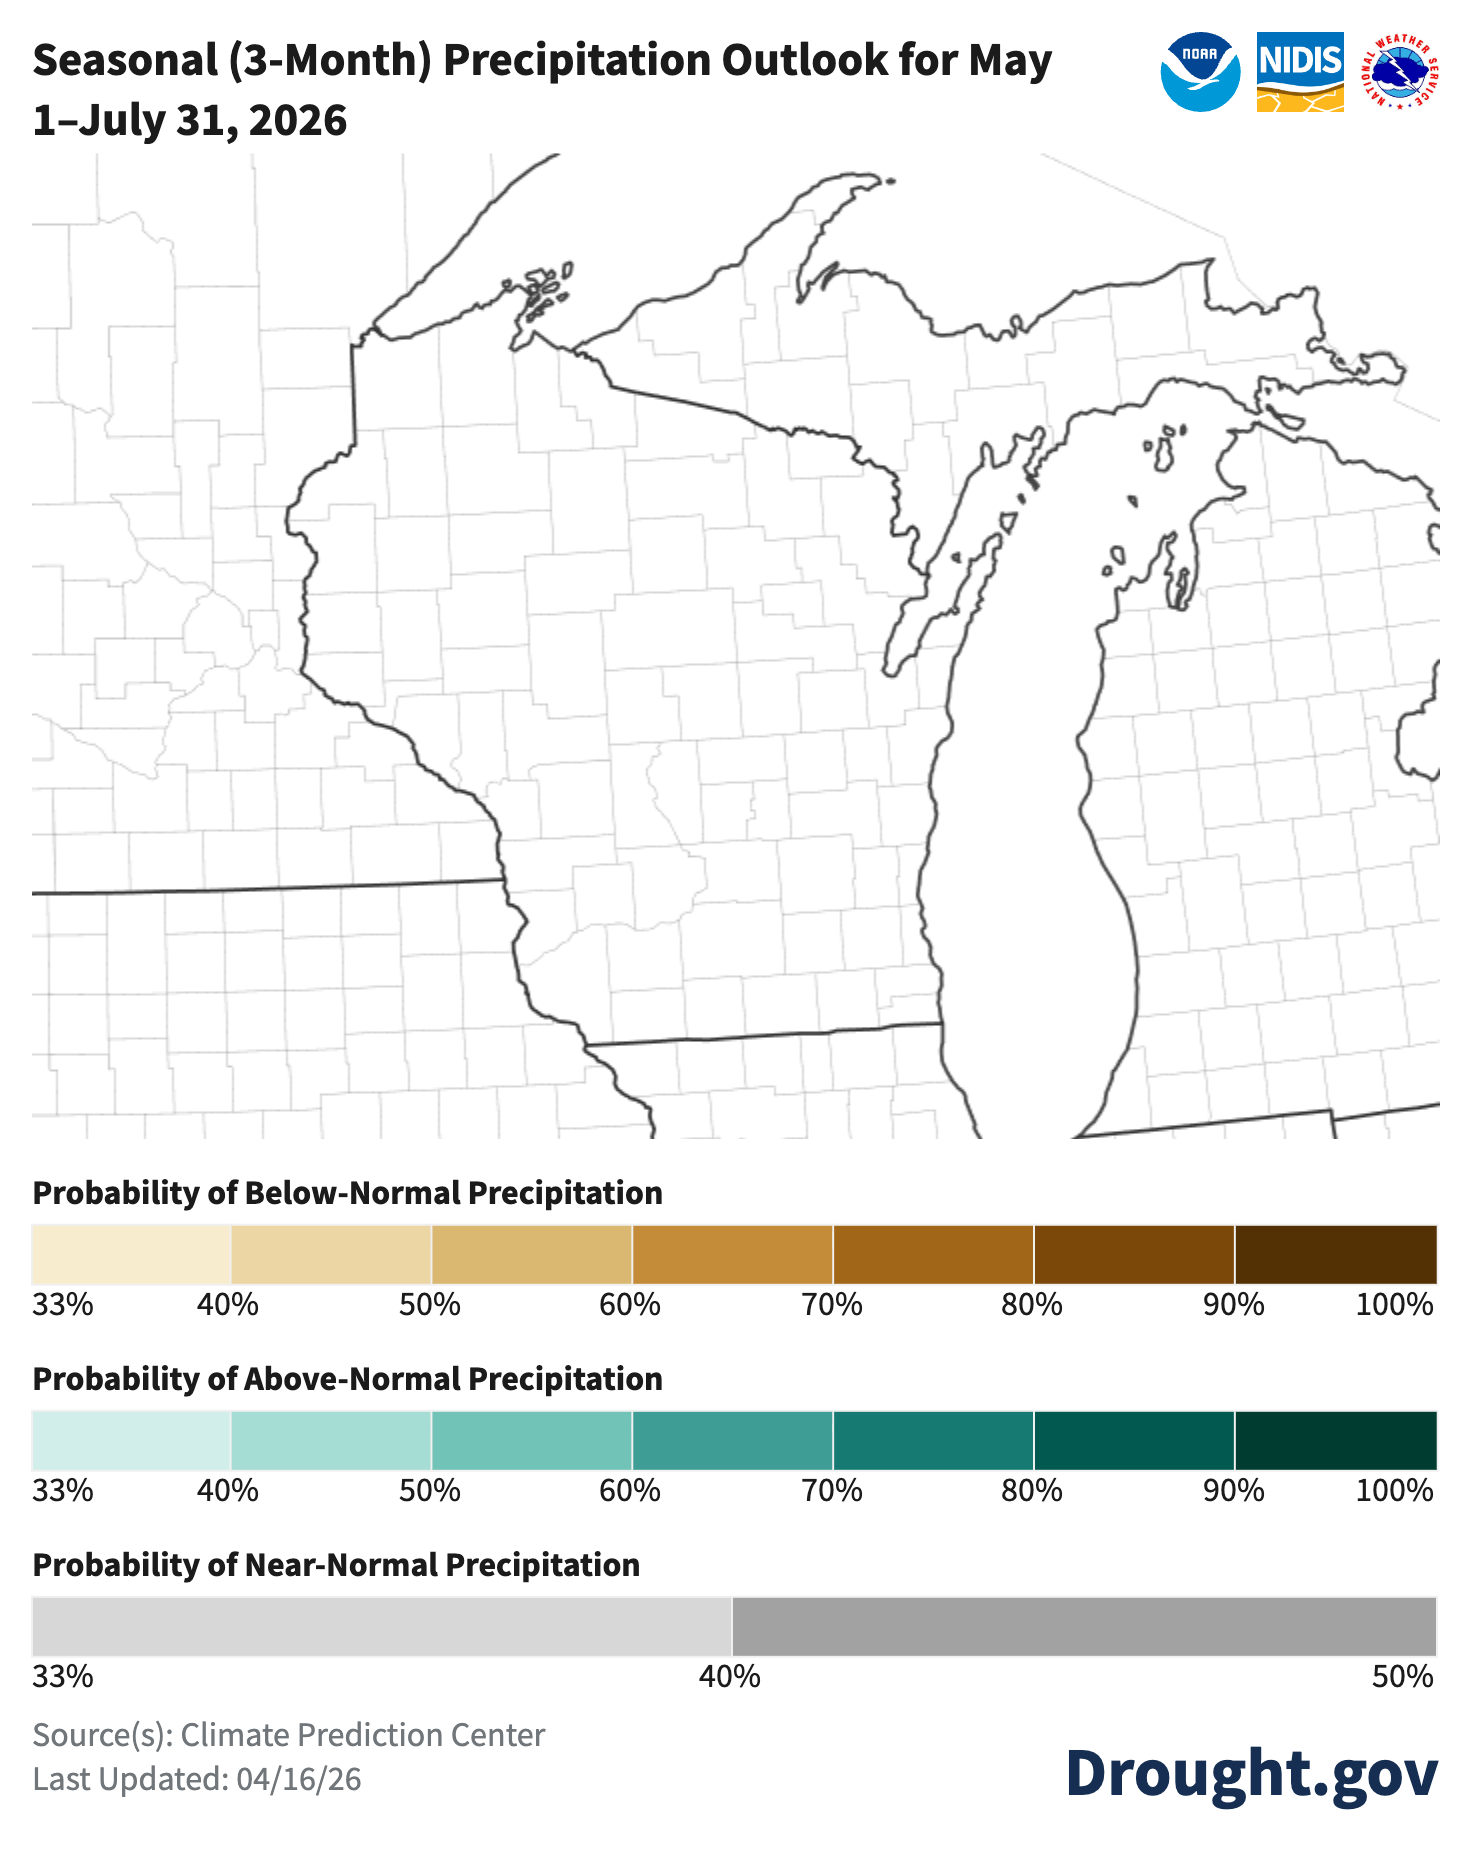
Image Description ↓
The map is titled “Seasonal (3‑Month) Precipitation Outlook for May 1–July 31, 2026.” It shows Wisconsin and surrounding Great Lakes states with county outlines only; Wisconsin counties are not shaded. The absence of color indicates equal chances for below‑normal, near‑normal, and above‑normal precipitation across Wisconsin for the three‑month period. Below the map are three legends: probability of below‑normal precipitation (brown scale, 33–100%), probability of above‑normal precipitation (teal scale, 33–100%), and probability of near‑normal precipitation (gray scale, 33–50%). Wisconsin is not highlighted in any probability category, confirming no favored precipitation outcome. Branding for NOAA, NIDIS, and Drought.gov appears on the graphic. The source is the Climate Prediction Center, last updated April 16, 2026.
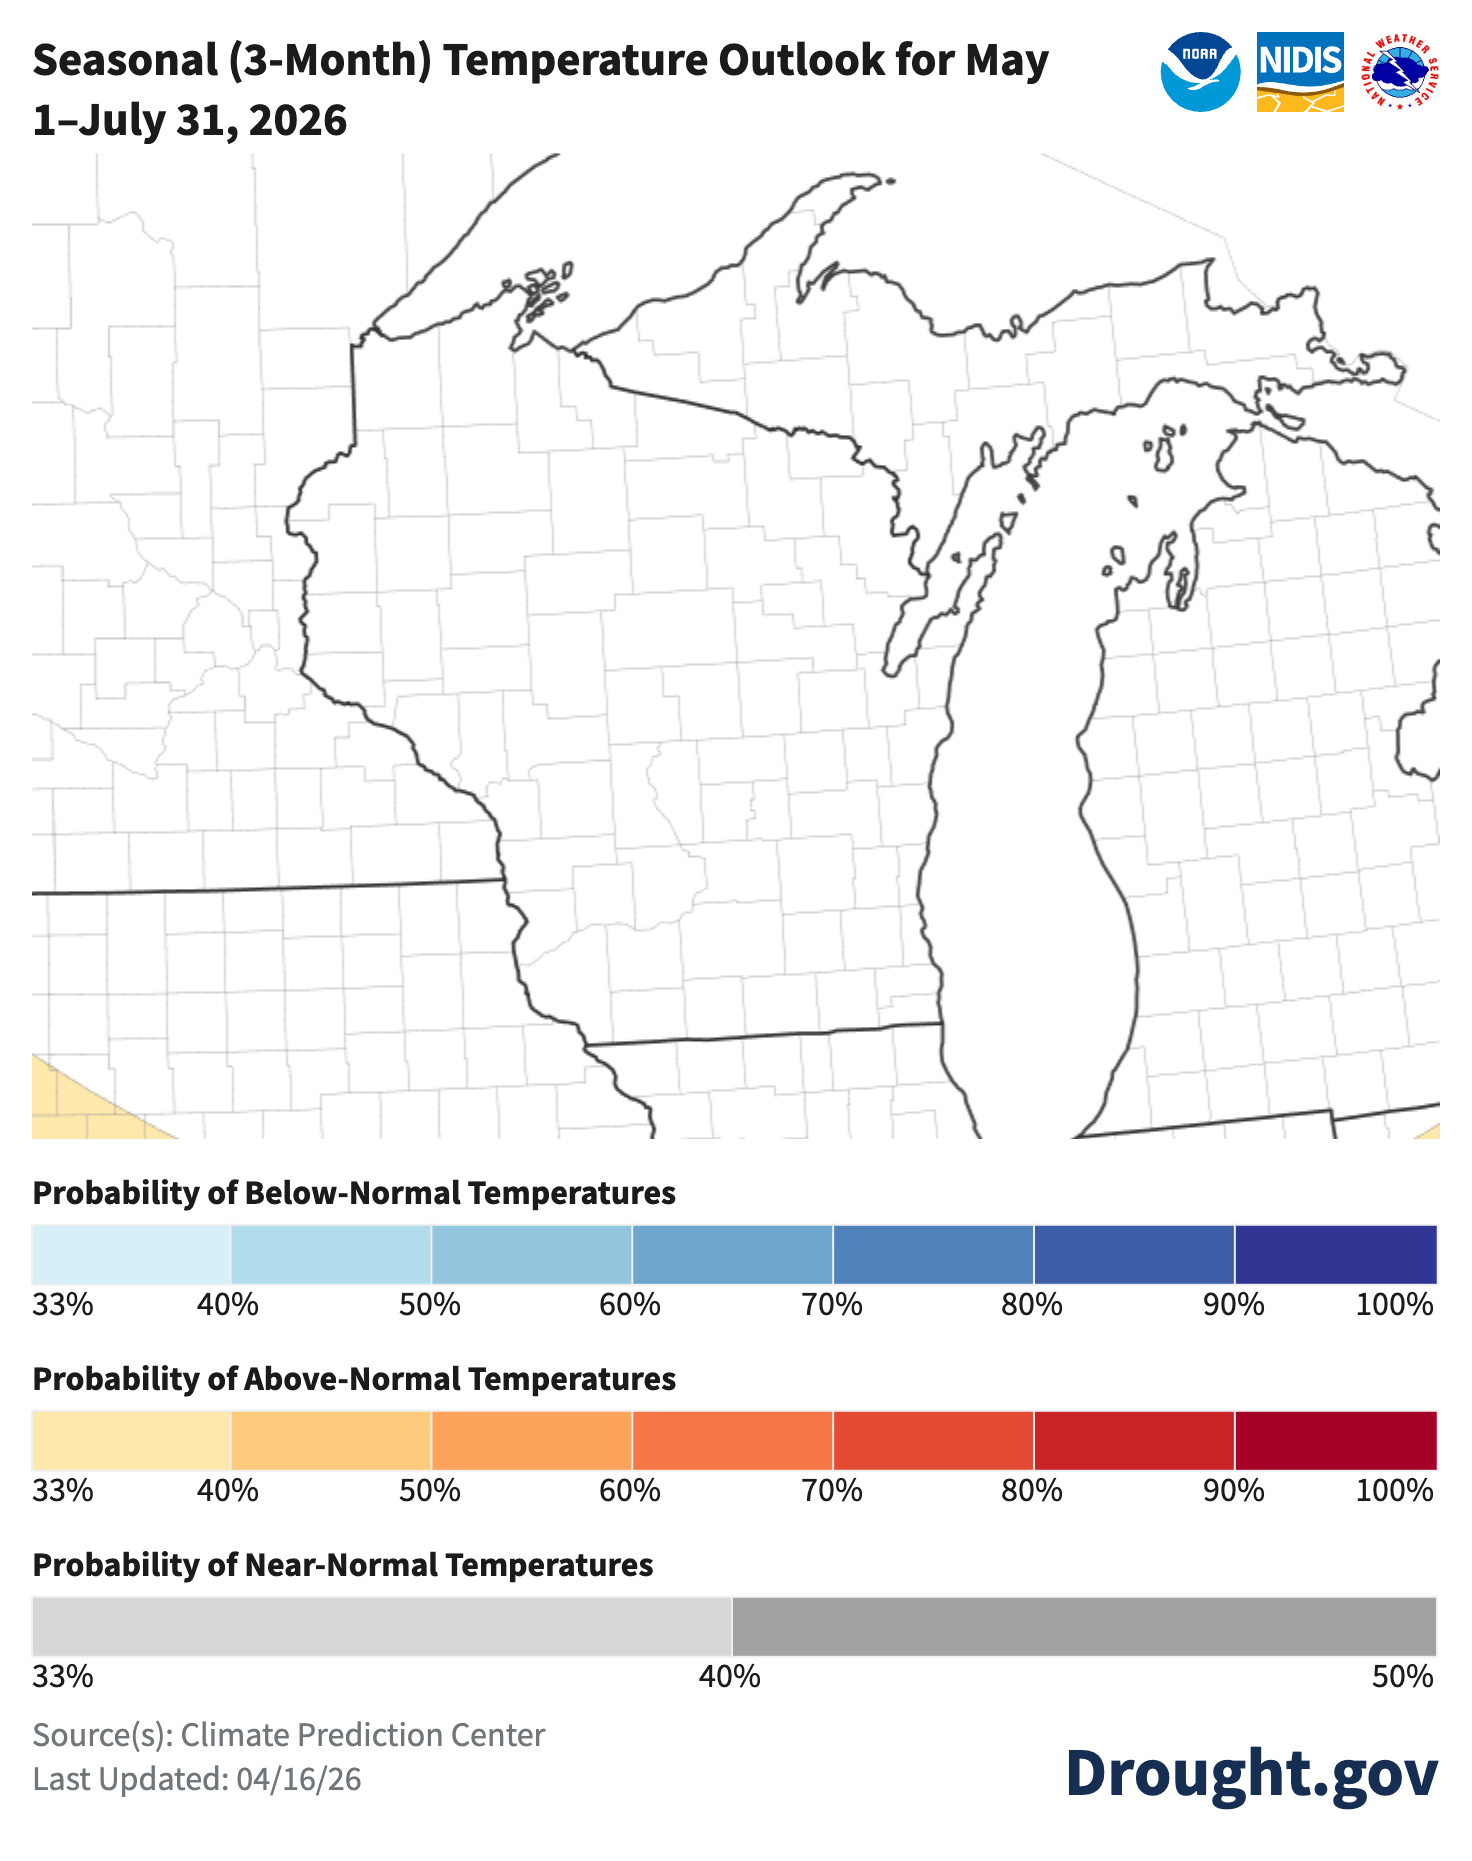
Image Description ↓
The map is titled “Seasonal (3‑Month) Temperature Outlook for May 1–July 31, 2026.” It shows Wisconsin and surrounding Great Lakes states with county outlines. Wisconsin is not shaded with probability colors, indicating equal chances for below‑normal, near‑normal, and above‑normal temperatures across the state for the three‑month period. Probability legends below the map show scales for below‑normal temperatures (blue, 33–100%), above‑normal temperatures (orange to red, 33–100%), and near‑normal temperatures (gray, 33–50%). NOAA, NIDIS, and Drought.gov logos appear on the graphic. The source is the Climate Prediction Center, last updated April 16, 2026.
- May-July: uncertainty for temperatures and precipitation statewide with equal chances for above, near, or below normal conditions.
- Statewide normals (1991-2020) for May-July are 63.2°F and 12.67”.
User Survey
Are you a regular user of the Ag Weather Outlook for Wisconsin (AgWOW)? Or maybe you are viewing these slides for the first time this week? Either way, we want to hear your feedback on this resource! Please take a few minutes and fill out this survey. Your feedback will help us better serve your ag-weather data needs through AgWOW.
If you have any trouble accessing or filling out the survey, please email Josh Bendorf at jbendorf@wisc.edu. Thank you!